plans and status of wind-tunnel testing employing an
TRANSCRIPT

Plans and Status of Wind-Tunnel Testing Employing an Aeroservoelastic Semispan Model
Boyd Perry, III*; Walter A. Silva†; James R. Florance‡; Carol D. Wieseman§; Anthony S. Pototzky**; Mark D. Sanetrik††;
Robert C. Scott‡‡; Donald F. Keller§§; and Stanley R. Cole*** Aeroelasticity Branch
NASA Langley Research Center Hampton, Virginia 23681-2199
and
David A. Coulson†††
Analytical Services & Materials, Inc. Hampton, Virginia 23666-1340
This paper presents the research objectives, summarizes the pre-wind-tunnel-test experimental results to date, summarizes the analytical predictions to date, and outlines the wind-tunnel-test plans for an aeroservoelastic semispan wind-tunnel model. The model is referred to as the Supersonic Semispan Transport (S4T) Active Controls Testbed (ACT) and is based on a supersonic cruise configuration. The model has three hydraulically-actuated surfaces (all-movable horizontal tail, all-movable ride control vane, and aileron) for active controls. The model is instrumented with accelerometers, unsteady pressure transducers, and strain gages and will be mounted on a 5-component sidewall balance. The model will be tested twice in the Langley Transonic Dynamics Tunnel (TDT). The first entry will be an “open-loop” model-characterization test; the second entry will be a “closed-loop” test during which active flutter suppression, gust load alleviation and ride quality control experiments will be conducted.
I. Introduction The National Aeronautics and Space Administration (NASA) recently established the Fundamental Aeronautics Program (FAP) (ref. 1). A goal of this program is the development of system-level, multi-disciplinary capabilities for both civilian and military applications. Research performed in support of the FAP will yield design tools to benefit a broad range of vehicles in four categories: Subsonic Fixed Wing, Subsonic Rotary Wing, Supersonics, and Hypersonics. The principal objective of the Supersonics Project under the FAP is the development of multi-disciplinary, physics-based predictive design, analysis, and optimization capabilities for supersonic aircraft. The primary topics that will be investigated under the Supersonics Project include: Sonic Boom Acceptability; Airport Noise Acceptability;
* Assistant Branch Head, Senior Member, AIAA. † Senior Research Scientist, Associate Fellow, AIAA. ‡ Aerospace Engineer, Senior Member, AIAA. § Senior Aerospace Engineer, Associate Fellow, AIAA. ** Senior Aerospace Engineer, Senior Member, AIAA. †† Aerospace Engineer, Senior Member, AIAA. ‡‡ Senior Aerospace Engineer, Associate Fellow, AIAA. §§ Senior Aerospace Engineer. *** Branch Head, Associate Fellow, AIAA. ††† Senior Research Engineer.
1 American Institute of Aeronautics and Astronautics

High Temperature Durability; Acceptable High Altitude Emissions; Supersonic Cruise Efficiency; and Flight Dynamics, Stability, and Handling Qualities. Within the Flight Dynamics, Stability, and Handling Qualities topic, the investigation of Aero-Propulso-Servo-Elastic (APSE) phenomena has been identified as a critical component to ensure safe and efficient supersonic flight. The unique structural configuration of supersonic aircraft combined with nonlinear aerodynamics and rigid-body effects results in highly complex nonlinear aeroelastic/flight dynamics phenomena. These aeroelastic phenomena affect ride quality, gust loads, flutter, flight dynamics and control, and, possibly, engine performance. The aeroelastic/flight dynamics phenomena simultaneously influence the airframe and propulsion system controls, producing undesirable effects on performance and flying characteristics. These APSE phenomena need to be thoroughly understood in order for supersonic flight to be safe, comfortable, and efficient. In addition, there is an opportunity, through active controls, to exploit these phenomena for improved performance and efficiency. Analysis and design capabilities for slender supersonic aircraft may then be updated to include this new knowledge. A vast body of analytical, computational, wind-tunnel and flight data exists on the aero-servo-elastic (ASE) systems for subsonic transport and supersonic fighter aircraft (ref. 2, for example). Systems for control of undesirable aeroelastic phenomena, such as suppression of flutter, have been demonstrated many times (refs. 3-5, for example). Systems that exploit vehicle flexibility for improved performance, such as vehicle roll control beyond aileron reversal and wing load alleviation have also been demonstrated (refs. 6 and 7, for example). Considerably less data are available for supersonic cruise configurations. In the mid- to late-1990s, under the auspices of the High Speed Research (HSR) program, research was performed in the areas of computational and experimental aeroelasticity (ref. 8). As part of this research, aeroelastic wind-tunnel models were designed, built, and tested in the Transonic Dynamics Tunnel (TDT). A remnant from the HSR program is a very sophisticated, aeroelastically-scaled semispan wind-tunnel model based on the Technology Concept Aircraft (TCA) configuration equipped with three active surfaces (ride control vane, aileron, horizontal tail) and flow-through nacelles with flexible mounts. Due to the cancellation of the HSR program, the model was never tested. The model was designed so that it would flutter within the TDT operating boundary, making it an ideal testbed for investigating ASE and some APSE issues associated with supersonic cruise configurations. Now, under the auspices of the Supersonics Project under the FAP, this semispan wind-tunnel model, referred to as the Supersonic Semispan Transport (S4T) Active Controls Testbed (ACT), has been revived and is being prepared for two wind-tunnel tests: an open-loop (no model active control) test and a closed-loop (model active control) test. This paper describes in detail the S4T wind-tunnel model and its characterization, the development of computational-aeroelastic analytical models and some preliminary calculations performed with these models. In addition, the paper presents the performance goals for the three active control functions being considered, describes the digital controller system being developed to implement the active control laws, and outlines the open-loop and closed-loop test plans. Trade names and trademarks are used in this paper for identification only. Their usage does not constitute an official endorsement, either expressed or implied, by the National Aeronautics and Space Administration.
II. Test Apparatus A. Wind Tunnel The Langley Transonic Dynamics Tunnel (TDT) will be used for the present work. The TDT, shown in figure 1, is a closed-circuit, continuous-flow wind tunnel capable of testing at stagnation pressures from near zero to atmospheric conditions and over a Mach number range from near zero to 1.2. The test section cross section is 16 feet square with cropped corners. Controlled variation of pressure in the tunnel simulates variations in flight altitude.
2 American Institute of Aeronautics and Astronautics
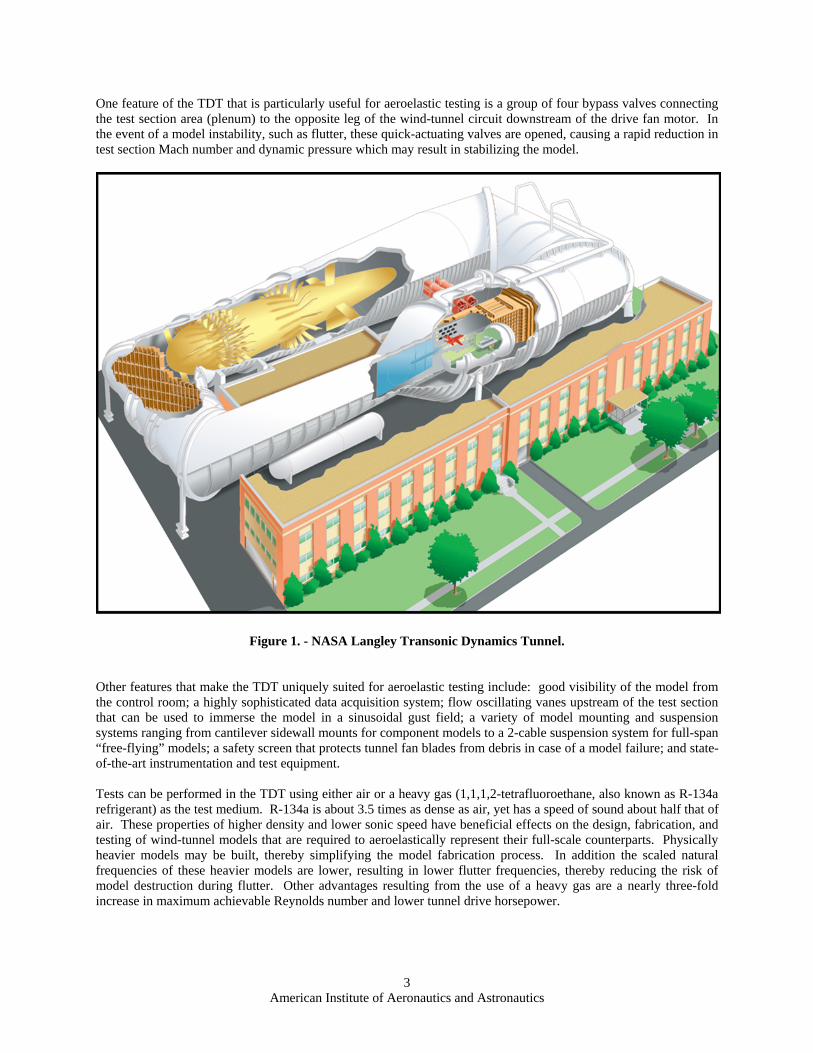
One feature of the TDT that is particularly useful for aeroelastic testing is a group of four bypass valves connecting the test section area (plenum) to the opposite leg of the wind-tunnel circuit downstream of the drive fan motor. In the event of a model instability, such as flutter, these quick-actuating valves are opened, causing a rapid reduction in test section Mach number and dynamic pressure which may result in stabilizing the model.
Figure 1. - NASA Langley Transonic Dynamics Tunnel. Other features that make the TDT uniquely suited for aeroelastic testing include: good visibility of the model from the control room; a highly sophisticated data acquisition system; flow oscillating vanes upstream of the test section that can be used to immerse the model in a sinusoidal gust field; a variety of model mounting and suspension systems ranging from cantilever sidewall mounts for component models to a 2-cable suspension system for full-span “free-flying” models; a safety screen that protects tunnel fan blades from debris in case of a model failure; and state-of-the-art instrumentation and test equipment. Tests can be performed in the TDT using either air or a heavy gas (1,1,1,2-tetrafluoroethane, also known as R-134a refrigerant) as the test medium. R-134a is about 3.5 times as dense as air, yet has a speed of sound about half that of air. These properties of higher density and lower sonic speed have beneficial effects on the design, fabrication, and testing of wind-tunnel models that are required to aeroelastically represent their full-scale counterparts. Physically heavier models may be built, thereby simplifying the model fabrication process. In addition the scaled natural frequencies of these heavier models are lower, resulting in lower flutter frequencies, thereby reducing the risk of model destruction during flutter. Other advantages resulting from the use of a heavy gas are a nearly three-fold increase in maximum achievable Reynolds number and lower tunnel drive horsepower.
3 American Institute of Aeronautics and Astronautics

B. Wind-Tunnel Model 1. Overall Description The S4T ACT is a very sophisticated aeroelastic semispan wind-tunnel model designed and fabricated at NASA Langley. The model in two different states of assembly mounted on a backstop in a model preparation area at the TDT is shown in figure 2. Figure 2(a) contains a photo of the model fully assembled as it would be tested in the tunnel and figure 2(b) contains a photo of the model without the fuselage fairing installed and with key features highlighted. Those features are the three active surfaces (ride control vane, aileron, horizontal tail), flow-through nacelles with flexible attachments, and the flexible fuselage beam. The engine nacelles include provisions for varying their masses and mount stiffnesses allowing researchers to vary the test conditions at which flutter occurs.
(a) Model fully assembled. (b) Model without fuselage fairing installed.
Figure 2. - Photographs of model mounted on backstop. The wind-tunnel model is 16.5 feet in length with a model span of 3.25 feet. The fuselage consists of a graphite-epoxy flexible beam (fig. 3) attached to an aluminum c-channel “rigid” beam and surrounded by a fiberglass-over-honeycomb fairing. Attachment points allow the flexible beam pitch and vertical motion (along with minimal fore-aft motion) but constrain roll, yaw, and side motion. Two nodal mounts supply vertical stiffness through four U-springs (two springs per mount). These nodal mounts can be locked with expansion spacers placed between the stop spacers on the U-springs for testing if a nearly cantilevered boundary condition is desired. The all movable ride control vane (RCV) and horizontal tail are mounted to the flexible beam. Piston-type hydraulic actuators are used to deflect these control surfaces. Figure 4 contains sketches of the RCV and horizontal tail assemblies and the locations of the actuators and servovalves. The horizontal tail assembly is similar to the RCV assembly, except the servovalve and actuator are upstream of the horizontal tail. Both surfaces have a total deflection range of 30 degrees (+15° to -15°). The wing consists of a fiberglass-epoxy skin over a honeycomb core and has a remotely controlled aileron outboard of the engines. Its root and tip chords are 82 inches and 6 inches, respectively. The wing attaches to the flexible fuselage beam at four locations through shear pins on the lower and upper surfaces of the wing. The wing’s main spar is located between the aft two attachment points and runs out spanwise to the wing tip. Due to lower strength requirements of the section forward of the main spar, compared to the outboard wing and main spar, the wing skins in that section are minimum thickness composite layup. The aileron is constructed of graphite-epoxy skins over a honeycomb core and a balsa leading edge. A vane-type hydraulic actuator is used to deflect the aileron through a total range of 5 degrees (+2.5° to -2.5°). Figure 5 contains an exploded view of the actuator and its torsion beam instrumented with a torsion strain gage to measure aileron position. The engine nacelles for this model consist of two separate parts. The engine inlet is rigidly mounted to the wing and the engine nozzle is mounted to a flexible beam that simulates the pylon of the TCA configuration. The front of the
4 American Institute of Aeronautics and Astronautics

inlet has a circular cross-section and transitions to a square cross-section at the aft end of the nozzle. Figure 6 contains sketches of the inlet and nozzle of the outboard engine and the shape of various sections along both. Provisions for changing the engine mass were built into the engine nacelles by the inclusion of 10 hollow cylindrical tubes distributed around the perimeter of the flow-through nozzle into which tungsten rods may be placed. Figure 7 illustrates the distribution of these tubes. The use of tungsten rods allow varying engine mass by about a factor of two, which can have significant influence on engine frequency and, ultimately, on the model flutter condition.
Figure 3. – Fuselage beam showing attachment points and nodal mounts.
5 American Institute of Aeronautics and Astronautics

(a) Ride Control Vane (b) Horizontal Tail
Figure 4. – Ride control vane and horizontal tail hydraulic assembly layout.
Figure 5. – Aileron actuator assembly details.
6 American Institute of Aeronautics and Astronautics

Figure 6. – Outboard engine nacelle section details.
Figure 7. – Engine nozzle ballast details.
2. Instrumentation The instrumentation in the wing, illustrated in figure 8, is extensive. The wing is populated with 26 accelerometers, the engines with four each, and the fuselage with four. In addition, there are 93 unsteady pressure transducers (53 on the upper surface and 40 on the lower surface) arranged in six chordwise rows, 12 strain gages (bending and torsion gages at three locations on the upper and lower surface), and a torsion strain gage that measures aileron position. The flexible fuselage beam is instrumented with two linear potentiometers for measuring ride-control-vane and horizontal-tail positions, four accelerometers, and three servovalves (one for each control surface actuator). A 5-component sidewall balance (TDT-05S) will be used to measure loads on only those components of the model shown in figure 2(b). Figure 9 contains the distribution of the wing pressure transducers. Volume constraints precluded the placement of pressure transducers and accelerometers at the leading and trailing edges of the outboard wing section.
7 American Institute of Aeronautics and Astronautics

Figure 8. – Model instrumentation layout.
(a) Upper Surface (b) Lower Surface
Figure 9. – Wing unsteady pressure transducer locations.
III. Wind-Tunnel-Model Characterization Several types of characterization measurements and tests on the wind-tunnel model have been conducted or will be conducted before testing in the TDT. These tests include mass and stiffness characterization measurements, modal surveys on major model components and the fully assembled configuration, model geometry measurements, and actuator frequency response measurements. The results from these characterization tests will be used for correlation with results from analysis, and, where there are significant differences between measurement and prediction, the analytical representations of the physical model will be updated, corrected, or modified. A. Wind-Tunnel-Model Geometry Due to the flexibility of the wing and fuselage beam, a non-contact measurement capability is required for measuring the geometry of the model. The geometry is measured using a three-dimensional laser scanner system that is portable, highly accurate, and provides fast data acquisition. It can obtain accuracies up to ±0.002 inches (depending on the range, scan speeds, and type of material scanned) and has a range between 6-80 feet. The geometry of the wing alone, each control surface, and the fully assembled configuration were each measured separately. Figure 10 contains the results from the geometry measurement tests. Almost one million location points were measured, with a higher density of points acquired on the wing and control surfaces. The highest densities of measurement points were on the leading and trailing edges of the wing and control surfaces.
8 American Institute of Aeronautics and Astronautics

Figure 10. – Measured model geometry.
The geometry of the nacelle pylon beams was measured to correlate with the properties in the analytical models. Three sets of pylon beams (inboard and outboard) were fabricated: a set that is considered the nominal configuration, another set that is 75% of the stiffness of the nominal beams, and a third set that is 150% of the stiffness of the nominal beams. Figure 11 contains a drawing of the nominal inboard pylon beam and is representative of the other beam shapes. B. Stiffness of Wing and Fuselage Beam The stiffnesses of the wing and flexible fuselage beam were determined by measuring static deflections for various loading conditions. Wing stiffness was measured by applying point loads along the front and rear spars of the outboard wing and measuring the wing deflection using a video model deformation (VMD) system. The measured bending deflection results are presented in figure 12. Figure 12(a) contains contours of constant deflection for a 1-pound down load applied on the aft spar three inches inboard from the wing tip; figure 12(b) contains deflection contours for the simultaneous application of a 1-pound up load on the front spar and 1-pound down load on the aft spar, both three inches inboard from the wing tip.
9 American Institute of Aeronautics and Astronautics

Figure 11. – Nominal stiffness inboard nacelle pylon beam.
The stiffness of the flexible fuselage beam was measured by applying moments at three locations (the RCV shaft, the second downstream wing attachment point, and the horizontal tail shaft) separately and measuring the angle of deflection along the beam using a calibrated angle measurement system. Figure 13 contains a photograph of the test setup in a model preparation area at the TDT for a moment applied at the second wing attachment point. To best simulate a cantilevered boundary condition for facilitating analytical comparisons with the measured data, deflections for the forward section of flexible beam were measured with the forward nodal mount locked and deflections for the aft section of the flexible beam were measured with the aft nodal mount locked. The stiffness of the fuselage beam section between the nodal mounts was measured in four configurations due to the uncertainty of the stiffness contributions of the nodal mounts and attachment points, which were not removable. The four configurations consisted of various combinations of the forward and aft nodal mounts in their locked and unlocked states. The measured stiffness of the nodal mounts in the normal, axial, and side degrees of freedom is presented in Table I. The measurements were obtained before the mounts were installed in the model.
(a) One-pound force applied on rear spar three inches inboard from wing tip.
10 American Institute of Aeronautics and Astronautics

(b) Simultaneous application of a one-pound up load on the front spar and a one-pound down load on the rear spar, both three inches inboard from the wing tip.
Figure 12. – Contours of constant deflection for applied loads near wing tip.
Contour interval = 0.01 inches.
Figure 13. – Flexible fuselage beam stiffness test setup for moment applied at the 2nd wing attachment point.
11 American Institute of Aeronautics and Astronautics

Table I. Measured Nodal Mount Stiffness for Translational Degrees of Freedom.
Figure 14. – Wing first bending mode identified during ground vibration test.
C. Modal Surveys To date, a modal survey of the fully assembled wind-tunnel model has not yet been conducted, awaiting the final checkout of the model hydraulic control system. However, the modal characteristics of the wing alone and the flexible fuselage beam alone were measured during separate ground vibration tests (GVTs). The wing-alone GVT was conducted with the wing cantilevered to a backstop at its four attachment points, but without the engine nacelles, the pylons, or the aileron installed. Only vertical accelerations were measured during this GVT, so no lateral modes were identified. The measured mode shape for the wing first bending mode is shown in figure 14 and the first six wing modal frequencies are presented in Table II.
Table II. Measured Wing Modal Frequencies.
D. Actuator Frequency Response Functions Tests are presently being conducted to quantify the performance of the aileron, ride control vane, and horizontal tail actuators. Actuator commands were in the form of sine waves applied to each control surface at various deflection
12 American Institute of Aeronautics and Astronautics

amplitudes and frequencies. Frequency sweeps were conducted from 0.1 Hz to 60 Hz. The aileron vane-type hydraulic actuator was tested at deflection amplitudes of 0.5, 1.0, and 1.5 degrees. Figure 15 contains frequency response function plots –magnitude (actual control surface deflection, δactual, divided by commanded control surface deflection, δcommand), and phase angle versus frequency – of the aileron actuator with the aileron installed.
Figure 15. – Frequency response functions of aileron actuator with aileron installed.
IV. Computational Aeroelastic Models A linear aeroelastic model of the S4T ACT was developed during the initial design of the wind-tunnel model during the High Speed Research (HSR) program. The first part of this linear aeroelastic model is a NASTRAN finite element model (FEM) of the structure consisting of beam and plate representations of 2711 nodes and 4105 elements shown in figure 16. The upper and lower surfaces are modeled as plate elements with proper outer mold line geometry definition. The fuselage is modeled as a series of beams and the engines are modeled as simple cruciforms. The NASTRAN aeroelastic model of the S4T ACT also includes aerodynamic modeling for use with linear subsonic (doublet lattice) and supersonic (ZONA51) unsteady aerodynamic theories. The aerodynamic box layout is shown in figure 17. Recently, this linear aeroelastic model has been significantly improved via the updating of mass and stiffness information based on mass measurements and stiffness tests. Additional improvements will be implemented upon completion of a full model GVT.
13 American Institute of Aeronautics and Astronautics

Figure 16. – Finite element model of S4T wind-tunnel model.
Figure 17. – Aerodynamic box layout of S4T wind-tunnel model.
Computational aeroelastic analyses using higher-order methods are planned for the S4T ACT. Analyses will be performed using the CFL3D (structured grids) and FUN3D (unstructured grids) aeroelastic CFD codes. Two structured grids have already been generated: an inviscid grid and a viscous grid.
V. Analytical Predictions Analytical predictions using the current linear aeroelastic NASTRAN model including 30 normal modes, nominal pylon stiffness, various engine mass configurations, and nodal mounts unlocked have been performed and are presented in this section of the paper. A. Static Aeroelastic Predictions Stability and control derivatives have been calculated for Mach numbers from 0.6 to 1.2 over a range of dynamic pressures. From these derivatives, flexible-to-rigid (F/R) ratios were computed. Figure 18 contains plots of the F/R ratio of lift coefficient due to aileron deflection, , as a function of dynamic pressure. For the range of dynamic pressures shown, the aileron is seen to “reverse” in lift for all presented Mach numbers.
δLC
14 American Institute of Aeronautics and Astronautics

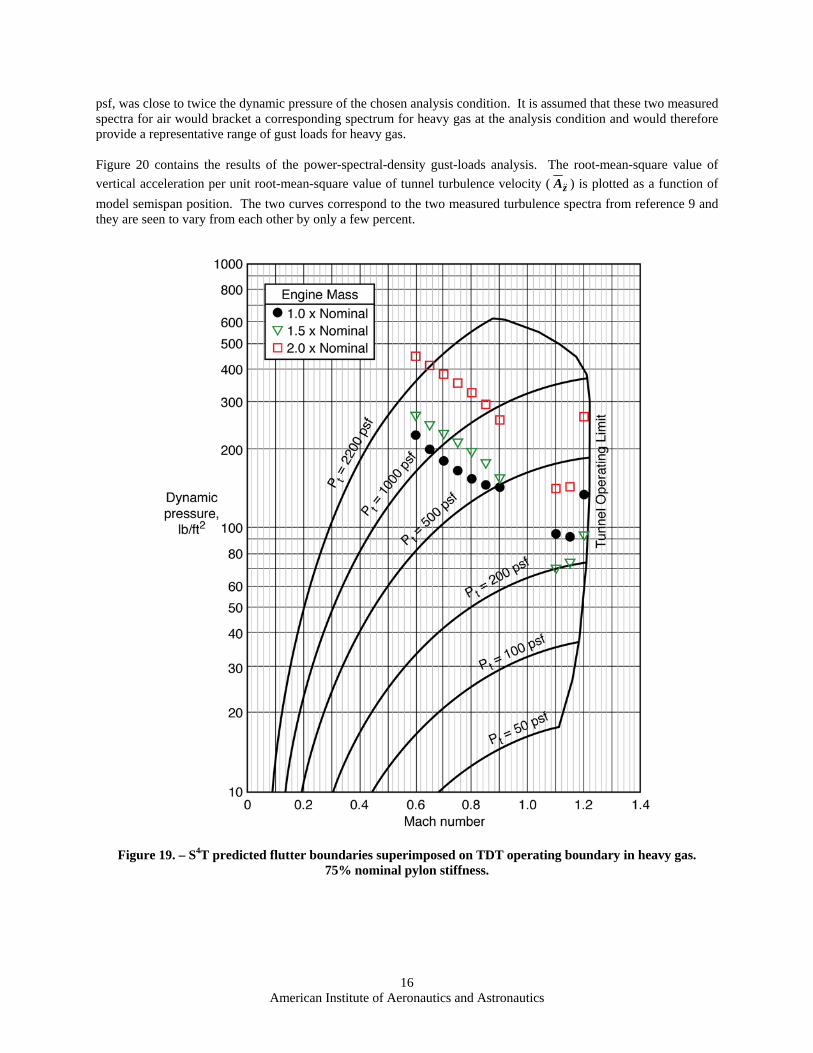
Figure 18. – Aileron flex-to-rigid ratio as a function of dynamic pressure for several Mach numbers. B. Flutter Predictions Preliminary flutter calculations have been performed using a p-k analysis for Mach numbers from 0.6 to 1.2 for three different engine masses (nominal mass, one and a half times nominal mass, and two times nominal mass) and two pylon stiffnesses (nominal stiffness and 75% nominal stiffness). The mass and stiffness variations were part of a study of the sensitivity of the flutter boundary to variations of certain model parameters. Figure 19 contains the resulting predicted flutter boundaries superimposed on the TDT operating boundary for the heavy gas test medium and for the 75% nominal pylon stiffness condition. The operating boundary is a semi-log plot of dynamic pressure as a function of Mach number. Lines of constant total pressure, Pt, are indicated on the plot. It is seen in figure 19 that, subsonicly, increasing engine mass raises the flutter boundary and that at twice nominal engine mass the flutter boundary is outside the operating capability of the TDT. For the nominal engine mass condition there appears to be sufficient tunnel operating capability above the predicted flutter boundary to potentially demonstrate, through active flutter suppression, significant increases in flutter dynamic pressure. C. Gust-Load Predictions A preliminary assessment of S4T gust loads has been made at analysis conditions of Mach number of 0.8 and dynamic pressure of 72 pounds per square foot (psf) for the heavy gas test medium in TDT. Vertical accelerations due to naturally occurring tunnel turbulence were computed for a locus of points on the model. For the outboard portion of the wing these points are on a line slightly aft of the mid chord, and for the inboard portion of the wing and fuselage, the points are on the extension of that line to the model centerline. Measurements of vertical and lateral components of naturally occurring TDT tunnel turbulence have been made for the air test medium (ref. 9). Unfortunately, no similar measurements exist for the heavy gas test medium. Therefore, for current gust-load predictions, measured spectra from reference 9 at two different conditions in the air test medium were used: the first measured spectrum, at a dynamic pressure of 69.4 psf, was close to the dynamic pressure of the chosen analysis condition (72 psf); the second measured spectrum, at a dynamic pressure of 167.6
15 American Institute of Aeronautics and Astronautics
psf, was close to twice the dynamic pressure of the chosen analysis condition. It is assumed that these two measured spectra for air would bracket a corresponding spectrum for heavy gas at the analysis condition and would therefore provide a representative range of gust loads for heavy gas. Figure 20 contains the results of the power-spectral-density gust-loads analysis. The root-mean-square value of vertical acceleration per unit root-mean-square value of tunnel turbulence velocity ( zA && ) is plotted as a function of model semispan position. The two curves correspond to the two measured turbulence spectra from reference 9 and they are seen to vary from each other by only a few percent.
Figure 19. – S4T predicted flutter boundaries superimposed on TDT operating boundary in heavy gas. 75% nominal pylon stiffness.
16 American Institute of Aeronautics and Astronautics

Figure 20. – Representative gust load predictions.
VI. Active Controls Considerations As stated elsewhere in this paper, an important objective of this work is the demonstration of flutter-suppression, gust-load-alleviation, and ride-quality-control control laws, singly and in all combinations, over a range of Mach numbers and dynamic pressures. Control law designers are free to choose their own design methodologies and employ whatever sensors (accelerometers, strain gages) and active control surfaces (ride control vane, aileron, horizontal tail) they wish. Each of the active controls functions has closed-loop performance goals, enumerated here: A. Flutter Suppression The goal of the flutter-suppression function is to increase the flutter dynamic pressure by an amount at least 44% above the open-loop flutter dynamic pressure while maintaining adequate relative stability. This minimum increase in dynamic pressure should be demonstrated across a range of Mach numbers. B. Gust Load Alleviation The goal of the gust-load-alleviation function is to decrease representative wing-load responses by an amount at least 20% below the open-loop responses while maintaining adequate relative stability. This minimum decrease in loads should be demonstrated across a range of Mach numbers. Both the naturally occurring tunnel turbulence (defined by power spectral density functions) and a simulated sinusoidal gust field produced by the TDT flow oscillation vanes will be considered as the gust excitation source. C. Ride Quality Control The goal of the ride-quality-control function is to decrease representative fuselage acceleration responses by an amount at least 20% below the open-loop responses while maintaining adequate relative stability. This minimum decrease in accelerations should be demonstrated across a range of Mach numbers. Both the naturally occurring tunnel turbulence (defined by a power spectral density function) and a simulated sinusoidal gust field produced by the TDT flow oscillation vanes will be considered as gust excitation sources. D. Controller Performance Evaluation During closed-loop testing an online system will be employed that provides valuable information about open- and closed-loop stability and performance. The generic name given to this system is “controller performance evaluation” (ref. 10). Its open-loop capabilities include verification of the control law loaded into the digital controller and prediction of closed-loop system performance based on the open-loop performance to determine if a given control law will stabilize the system when the loop is closed. Its closed-loop capabilities include determining the relative stability of a given closed-loop system by evaluating the singular values of the return difference matrices and determining the open-loop plant stability to ascertain the open-loop flutter boundary while operating closed-loop.
17 American Institute of Aeronautics and Astronautics

VII. Digital Controller
A digital controller system (DCS) will be employed during both the open- and closed-loop entries of the S4T ACT. Sensor and other pertinent signals are input to the DCS and actuator commands and other selected signals are output from the DCS. The DCS typically operates with sampling frequencies between 100Hz and 1KHz. The primary architecture of the DCS is built around a host and target processor configuration as depicted in figure 21. The host portion of the system is comprised of a 3.0 GHz Intel Pentium 4 processor with associated peripherals. The target system is centered on the dSPACE DS1006 control processor board utilizing a 2.6GHz AMD Opteron processor. The system includes three dSPACE DS2002 multi-channel analog-to-digital (A/D) boards. The A/D boards are comprised of 32 channels utilizing 16 bit quantization with an input range of ± 10 volts. The standard system output is one dSPACE DS2103 multi-channel digital-to-analog (D/A) converter board. The D/A board contains 32 channels of 14 quantization bits designed for ± 10 volts and a settling time of 10µsec. Additionally, a dSPACE DS4003 Digital I/O board provides 96 channels of programmable digital I/O capability.
Figure 21. – TDT dSPACE digital control system internal configuration. The DCS programming functionality is currently centered on dSPACE ”Solutions for Control” R5.1 and MatLab R2006A, the host processors run under the Win XP Pro operating system. Highly flexible controller functionality is observed as the controller is developed and modeled within the SIMULINK environment, then compiled and downloaded to the target processor via the dSPACE and MatLab Real-Time Interface. An integral component of the dSPACE tools is the ControlDesk application. ControlDesk provides the user interface to the target processor for the development and implementation of the visual control and indication medium. The target processor is the embedded controller and the host provides the user interface, visual display, data acquisition and controls all communications between the processors. For active controls, control laws may take any form or function within the capability of the MatLab Simulink environment and the hardware capacity of the DCS. The DCS provides for control law verification, functionality checks, and response and performance evaluation of the controller, plant response and system ID by utilizing various interconnections and excitation functions, as well as signal throughput verification and end-to-end checks.
18 American Institute of Aeronautics and Astronautics

During various stages of lab testing leading up to testing in the wind tunnel, sensor and actuator analysis, actuator evaluation or actuator tuning, the DCS can be easily configured to function as the controller and acquire specified data as well. Data acquired can easily be transferred for analysis or analyzed onboard using the capabilities within the MatLab environment.
VIII. Test Plan Two tunnel entries are planned for the S4T ACT. Both are envisioned to be four-week entries, spaced about a year apart, in the Langley Transonic Dynamics Tunnel using the heavy-gas test medium. A. Open-Loop Entry The purposes of this entry are to measure and quantify model static- and dynamic-aeroelastic characteristics over a range of Mach numbers and dynamic pressures and for several variations in model parameters. For this entry, experimental quantities of interest include:
• Static aeroelastic behaviors (structural deformations, pressure distributions, control-surface effectiveness) due to angle-of-attack variations and control-surface deflections;
• Flutter boundaries; • Responses to naturally-occurring random tunnel turbulence; • Hydraulic-actuator frequency response functions under aerodynamic load; • Bending-moment, torsion-moment, acceleration, and unsteady-pressure frequency response functions due
to control-surface deflections and flow-oscillator-vane oscillations. Mach numbers envisioned for this entry range from 0.6 to 1.2, with emphasis on the transonic region. Dynamic pressures for sub-critical data acquisition will be determined at the time of testing and will be safely away from the open-loop flutter boundary. Potential model parameters that may be varied during this entry are engine pylon stiffness (nominal, 0.75 x nominal), engine mass (nominal, 2 x nominal), and nodal mount state (unlocked and locked). On the basis of these open-loop test results, a wind-tunnel model configuration will be chosen for the closed-loop entry. Also on the basis of these open-loop test results, the aeroelastic and aeroservoelastic analytical models will be modified to include the actual characteristics of the physical model. Control law engineers will employ these modified analytical models in their design of control laws to be implemented during the closed-loop entry, described next. B. Closed-Loop Entry The purposes of this entry are to demonstrate flutter-suppression, gust-load-alleviation, and ride-quality-control control laws, singly and in all combinations, over the same ranges of Mach number and dynamic pressure envisioned for the open-loop entry. For this entry experimental quantities of interest include:
• Flutter suppression operating alone - Closed-loop flutter boundary (taking particular note of the percentage changes in flutter dynamic pressure compared to the open-loop flutter boundary), control surface activity, measures of relative stability;
• Gust load alleviation operating alone - Closed-loop responses to tunnel turbulence (taking particular note of the percentage changes in responses compared to the open-loop turbulence responses), control surface activity, measures of relative stability;
• Ride quality control operating alone - Closed-loop responses to tunnel turbulence (taking particular note of the percentage changes in responses compared to the open-loop turbulence responses), control surface activity, measures of relative stability;
19 American Institute of Aeronautics and Astronautics

• Active systems operating in combination - Mapping out of regions (Mach numbers and dynamic pressures) of improved and degraded combined closed-loop performance compared to open-loop performance and one-control-function-at-a-time closed-loop performance.
IX. Concluding Remarks The Supersonic Semispan Transport (S4T) Active Controls Testbed (ACT) represents an important opportunity to investigate the unique combination of structural properties, rigid-body effects, and nonlinear aerodynamics typically present in supersonic cruise configurations. A pair of wind-tunnel tests (one open-loop, the other closed-loop) will be conducted in the NASA Langley Transonic Dynamics Tunnel (TDT) over the course of the next two years to take advantage of this opportunity. This paper has presented the research objectives, summarized the pre-wind-tunnel-test experimental results to date, summarized the analytical predictions to date, and outlined the wind-tunnel-test plans for the S4T ACT. The model has been designed and fabricated and is currently being readied for testing at the TDT.
References
1. NASA Fundamental Aeronautics Program Website: http://www.hq.nasa.gov/office/aero/programs_fap.htm
2. Advanced Aeroservoelastic Testing and Data Analysis. AGARD Conference Proceedings 566. North Atlantic Treaty Organization. November 1995.
3. Sandford, Maynard C.; Abel, Irving; and Gray, David L.: “Development and Demonstration of a Flutter-Suppression System Using Active Controls.” NASA TR R-450, 1975.
4. Abel, I.; Perry, B., III; Newsom, J. R.: “Comparison of Analytical and Wind-Tunnel Results for Flutter and
Gust Response of a Transport Wing with Active Controls.” NASA-TP-2010, 1982. 5. Waszak, Martin R.: “Robust Multivariable Flutter Suppression for the Benchmark Active Control
Technology (BACT) Wind-Tunnel Model.” Eleventh Symposium on Structural Dynamics and Control, Blacksburg, VA, May 12-14, 1997.
6. Many Authors: “Special Section: Active Flexible Wing.” Journal of Aircraft, vol. 32, no. 1, January-
February 1995, pp. 9-76, 206-207. 7. Pendleton, Edmund W.; Bessette, Denis; Field, Peter B.; Miller, Gerald D.; and Griffin, Kenneth E.:
“Active Aeroelastic Wing Flight Research Program – Technical Program and Model Analytical Development.” Journal of Aircraft, vol. 37, no. 4, July-August 2000, pp. 554-561.
8. Silva, W. A.; Keller, D. F.; Florance, J. R.; Cole, S. R.; and Scott, R. C., “Experimental Steady and Unsteady Aerodynamic and Flutter Results for HSCT Semispan Models.” AIAA-2000-1697, 41st AIAA/ASME/ASCE/AHS/ASC Structures, Structural Dynamics, and Materials Conference and Exhibit, Atlanta, GA, April 3-6, 2000.
9. Sleeper, Robert K.; Keller, Donald F.; Perry, Boyd III; and Sandford, Maynard C.: “Characteristics of Vertical and Lateral Tunnel Turbulence Measured in Air in the Langley Transonic Dynamics Tunnel.” NASA TM 107734, 1993.
10. Pototzky, Anthony S.; Wieseman, Carol D.; Hoadley, Sherwood T.; and Mukhopadhyay, Vivek: “On-Line Performance Evaluation of Multiloop Digital Control Systems.” Journal of Guidance, Control, and Dynamics, vol. 15, no. 4, July-August 1992, pp. 878-884.
20 American Institute of Aeronautics and Astronautics