planning strategically today for a profoundly different tomorrow sais 2009 winter retreat donna...
TRANSCRIPT
Planning Strategically Today for a Profoundly Different Tomorrow
SAIS 2009 Winter Retreat
Donna Orem, [email protected]

Part I: The Demographic and Economic Landscape
Part II: The Changing Workforce
Part III: Social Forces

Part I
The Demographic Landscape
Changing Demographics: Key Trends
– The make-up of the school age population will change significantly.
– Our population will become more and more racially diverse.
– Our population is rapidly aging.
– Different states will have sharply different projected futures.
68000000
70000000
72000000
74000000
76000000
78000000
80000000
UnitedStates
2000200820013
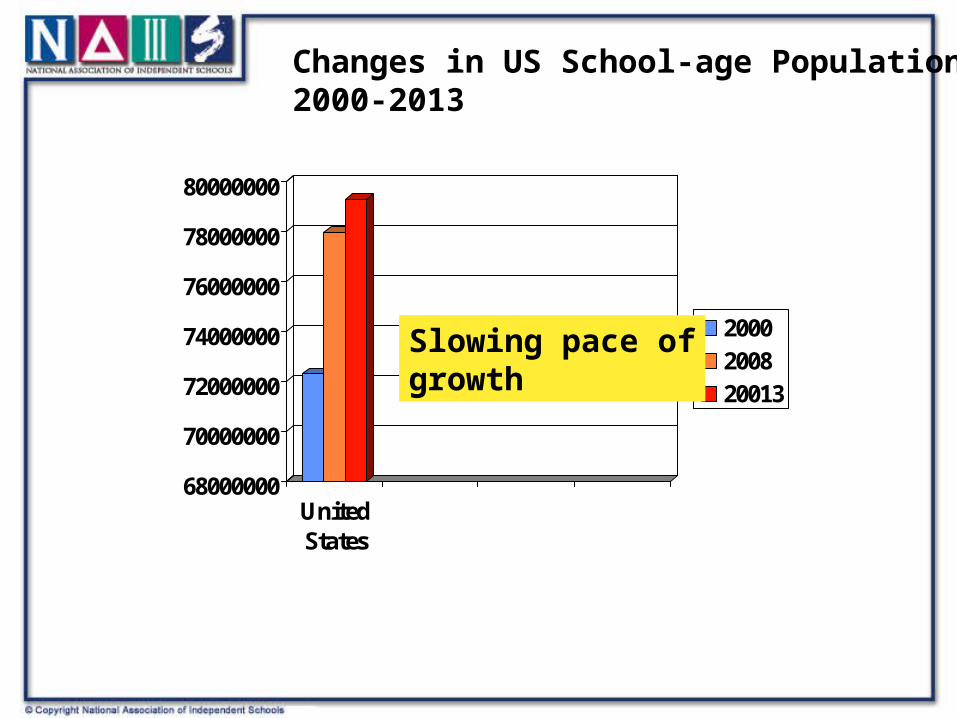
Changes in US School-age Population 2000-2013
Slowing pace ofgrowth
0
200000
400000
600000
800000
1000000
1200000
1400000
1600000
Atlanta
200020082013
Changes in
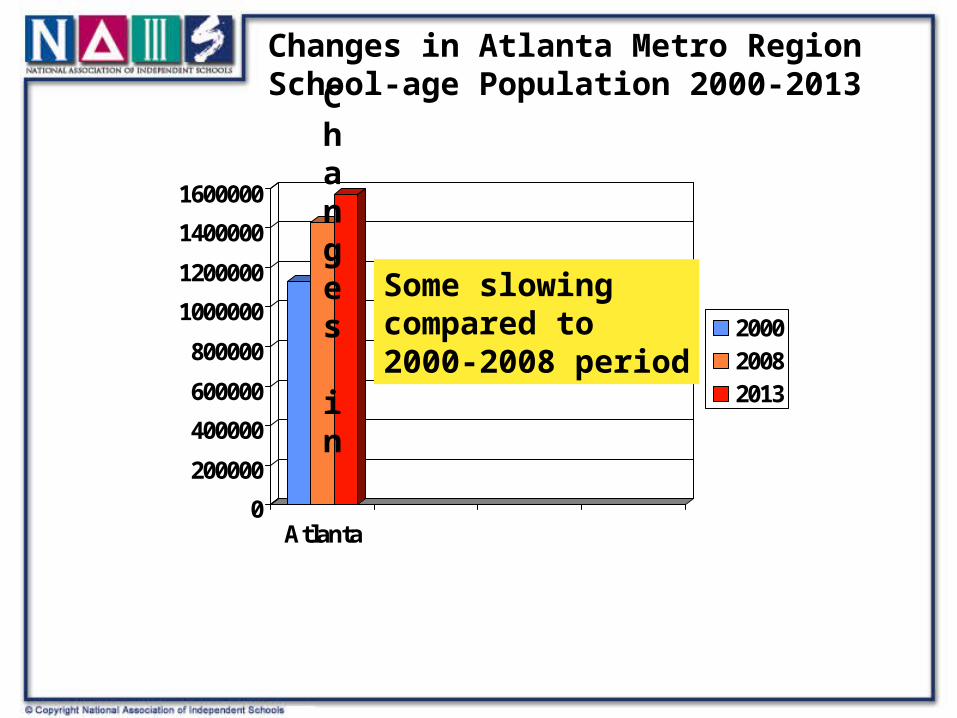
Changes in Atlanta Metro RegionSchool-age Population 2000-2013
Some slowing compared to2000-2008 period
0
20000
40000
60000
80000
100000
120000
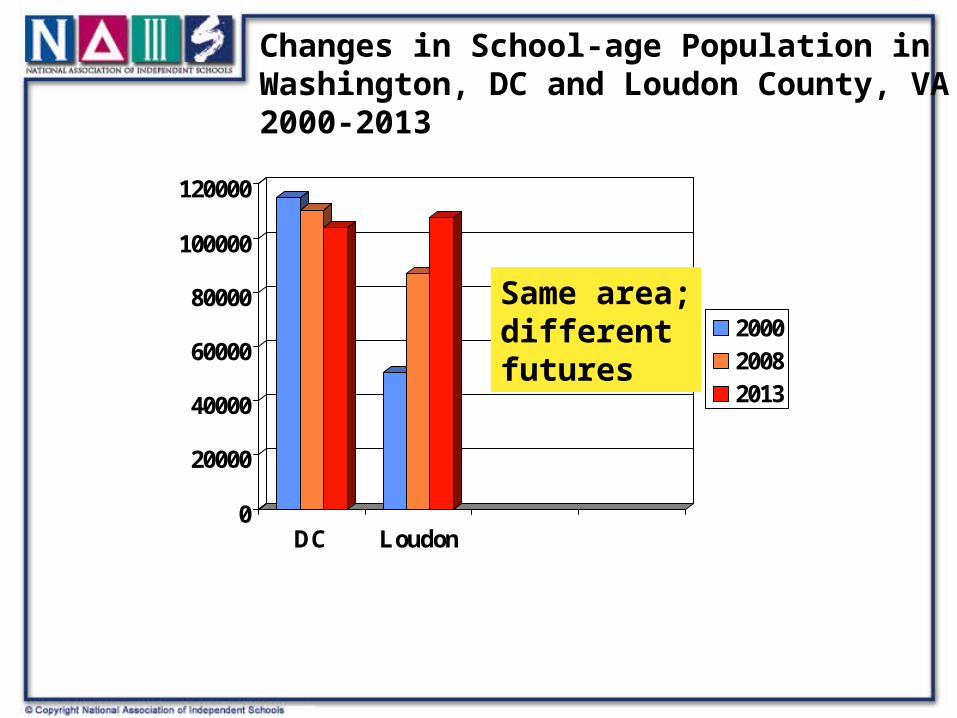
DC Loudon
200020082013
Changes in School-age Population inWashington, DC and Loudon County, VA2000-2013
Same area;differentfutures
Race/Ethnicity Demographic Trends
About 65% of America’s population growth in the next two decades will be minority, particularly from Hispanic and Asian immigrants.
Within the 0-24 age-range, the share of Hispanics is expected to nearly double in the coming decade
– from 12% in 1990 to 21% in 2015.
This diversity will be unevenly distributed:
– The 65% increase will be absorbed by 230 counties, with California, Texas, and Florida getting about 3/5ths of the increase.
– Harold Hodgkinson, Center for Demographic Policy
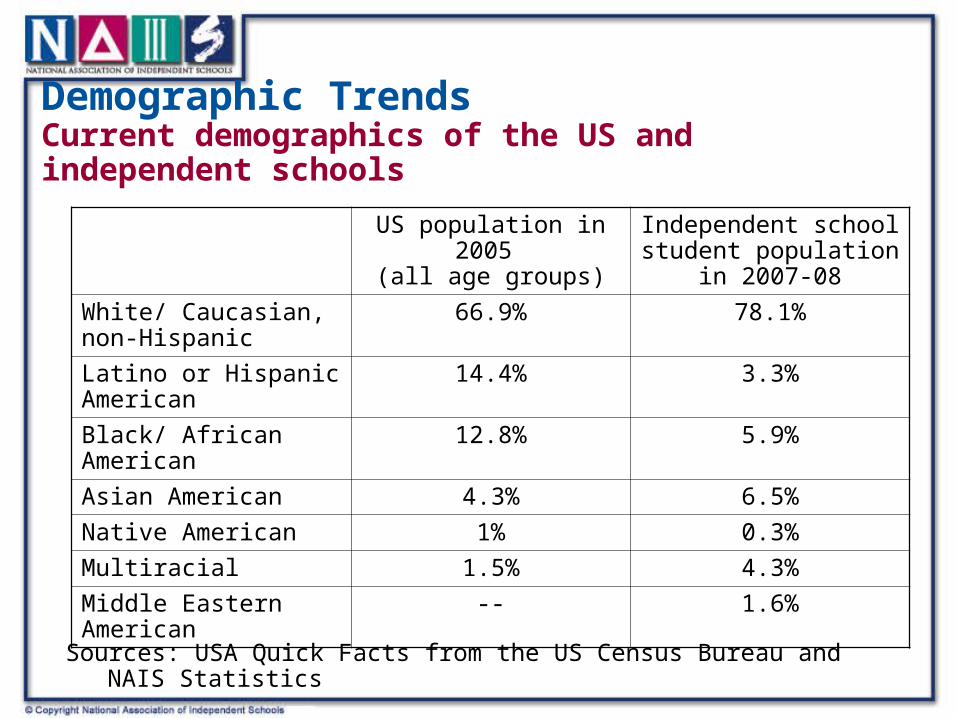
Demographic TrendsCurrent demographics of the US and independent schools
Sources: USA Quick Facts from the US Census Bureau and NAIS Statistics
US population in 2005 (all age groups)
Independent school student population in
2007-08
White/ Caucasian, non-Hispanic
66.9% 78.1%
Latino or Hispanic American
14.4% 3.3%
Black/ African American 12.8% 5.9%
Asian American 4.3% 6.5%
Native American 1% 0.3%
Multiracial 1.5% 4.3%
Middle Eastern American -- 1.6%
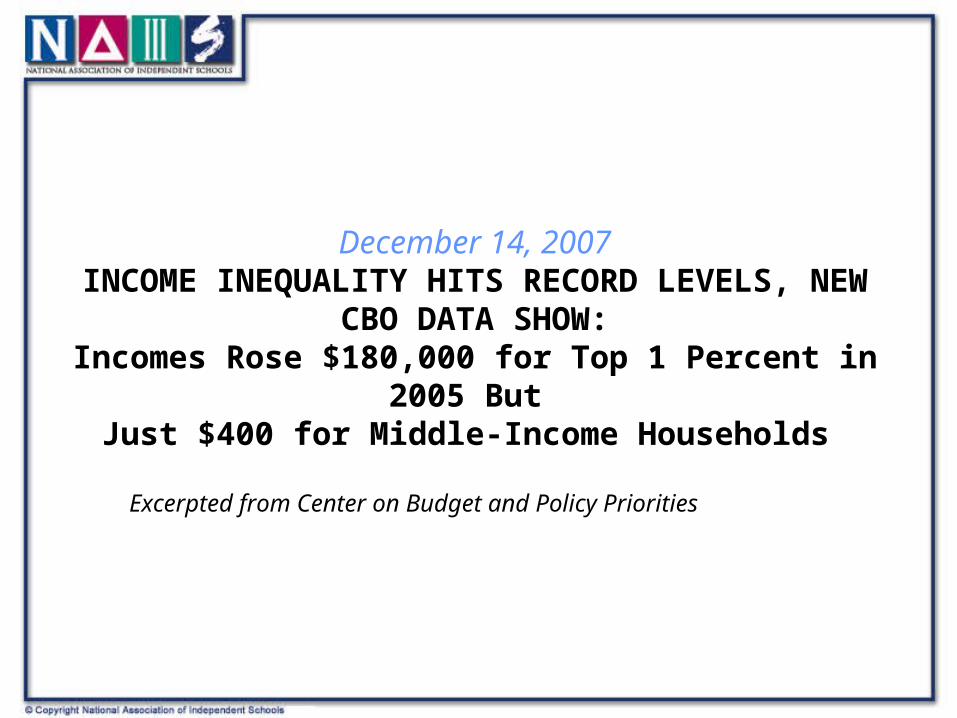
December 14, 2007INCOME INEQUALITY HITS RECORD LEVELS, NEW
CBO DATA SHOW:Incomes Rose $180,000 for Top 1 Percent in 2005 But
Just $400 for Middle-Income Households
Excerpted from Center on Budget and Policy Priorities
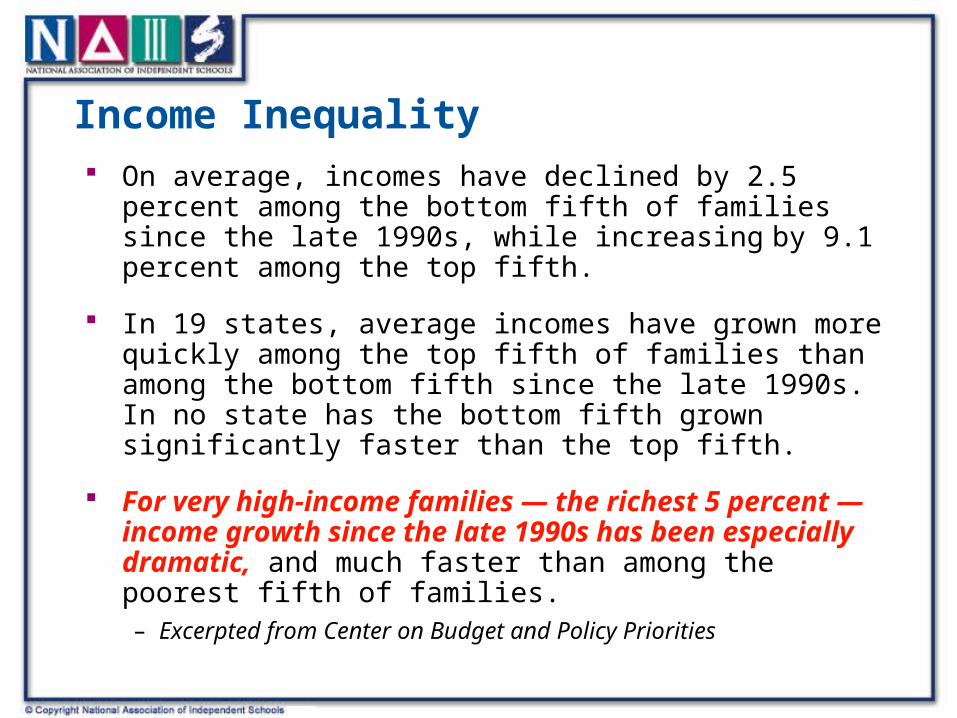
Income Inequality
On average, incomes have declined by 2.5 percent among the bottom fifth of families since the late 1990s, while increasing by 9.1 percent among the top fifth.
In 19 states, average incomes have grown more quickly among the top fifth of families than among the bottom fifth since the late 1990s. In no state has the bottom fifth grown significantly faster than the top fifth.
For very high-income families — the richest 5 percent — income growth since the late 1990s has been especially dramatic, and much faster than among the poorest fifth of families.– Excerpted from Center on Budget and Policy Priorities
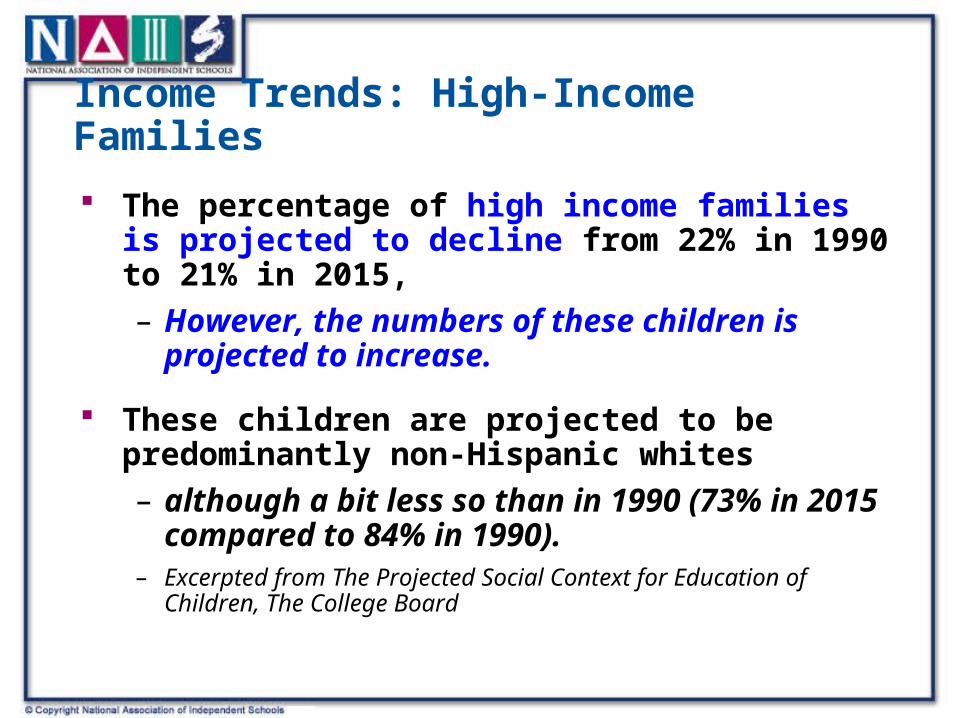
Income Trends: High-Income Families
The percentage of high income families is projected to decline from 22% in 1990 to 21% in 2015,
– However, the numbers of these children is projected to increase.
These children are projected to be predominantly non-Hispanic whites
– although a bit less so than in 1990 (73% in 2015 compared to 84% in 1990).
– Excerpted from The Projected Social Context for Education of Children, The College Board
02000
4000
6000
800010000
12000
14000
16000
age5-9
age10-13
age14-17
age5-9
age10-13
age14-17
200020082013
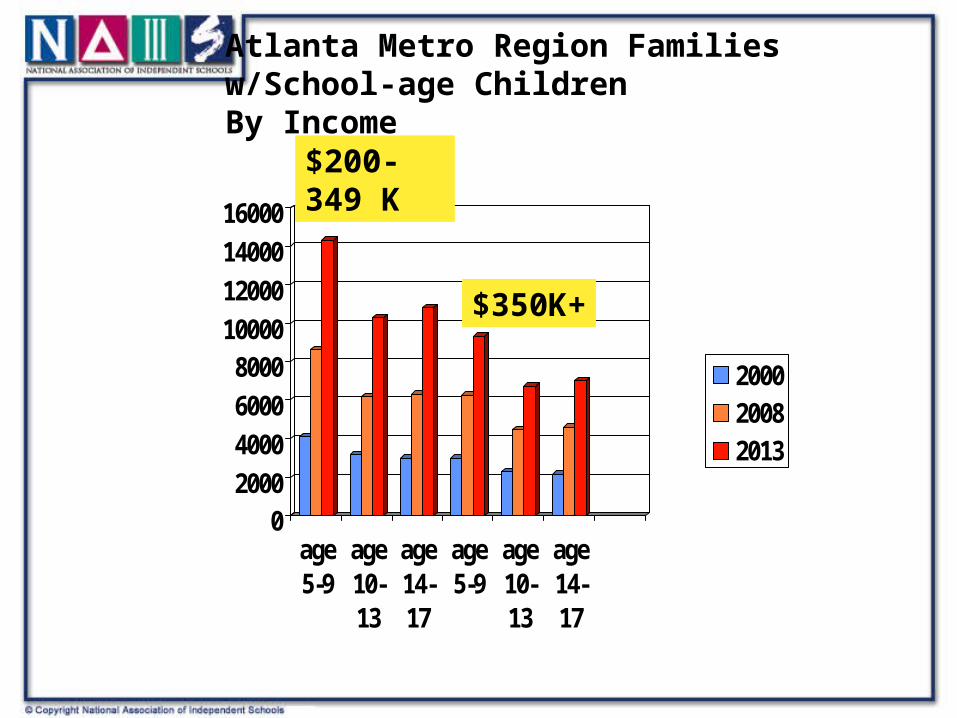
Atlanta Metro Region Families w/School-age Children By Income
$200-349 K
$350K+
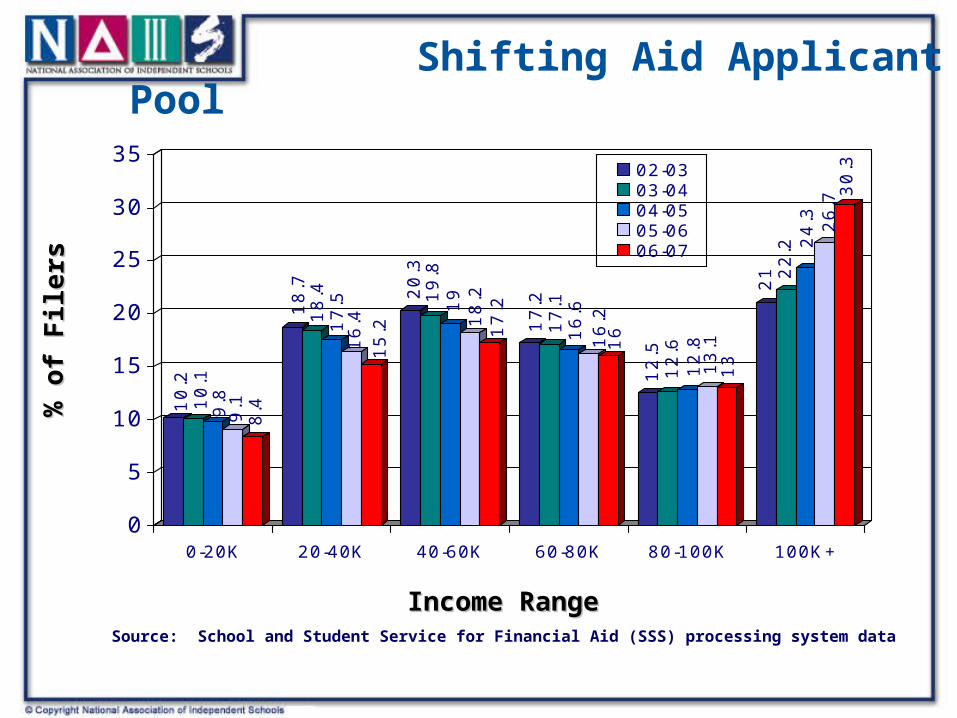
Shifting Aid Applicant Pool
10.2
10.1
9.8
9.1
8.4
18.7
18.4
17.5
16.4
15.2
20.3
19.8
19
18.2
17.2
17.2
17.1
16.6
16.2
16
12.5
12.6
12.8
13.1
13
21 22.2 24.3 26.730.3
0
5
10
15
20
25
30
35
0-20K 20-40K 40-60K 60-80K 80-100K 100K+
02-0303-0404-0505-0606-07
Income RangeIncome Range
% o
f F
ilers
% o
f F
ilers
Source: School and Student Service for Financial Aid (SSS) processing system data
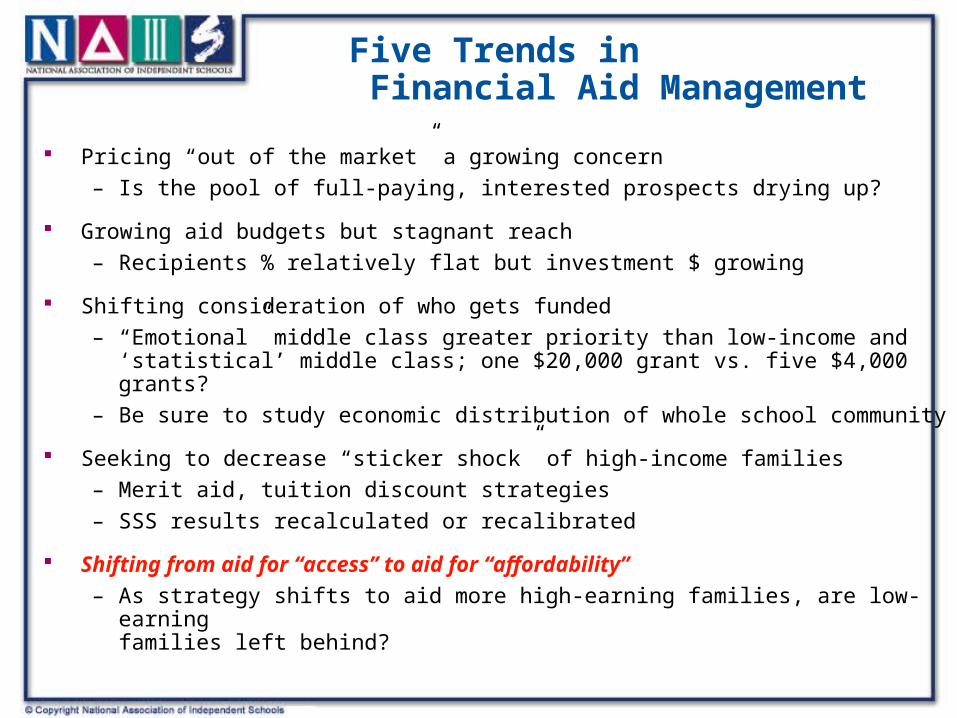
Five Trends in Financial Aid Management
Pricing “out of the market” a growing concern
– Is the pool of full-paying, interested prospects drying up?
Growing aid budgets but stagnant reach
– Recipients % relatively flat but investment $ growing
Shifting consideration of who gets funded
– “Emotional” middle class greater priority than low-income and ‘statistical’ middle class; one $20,000 grant vs. five $4,000 grants?
– Be sure to study economic distribution of whole school community
Seeking to decrease “sticker shock” of high-income families
– Merit aid, tuition discount strategies
– SSS results recalculated or recalibrated
Shifting from aid for “access” to aid for “affordability”
– As strategy shifts to aid more high-earning families, are low-earning families left behind?
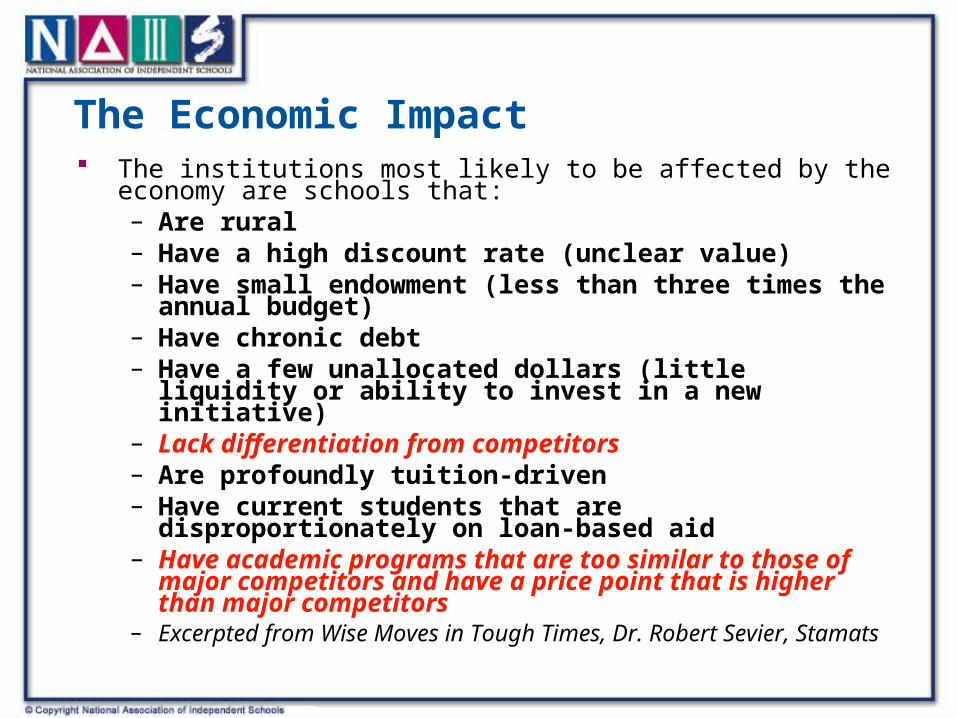
The Economic Impact
The institutions most likely to be affected by the economy are schools that:– Are rural– Have a high discount rate (unclear value)– Have small endowment (less than three times the annual budget)– Have chronic debt– Have a few unallocated dollars (little liquidity or ability to invest
in a new initiative)– Lack differentiation from competitors– Are profoundly tuition-driven– Have current students that are disproportionately on loan-based
aid– Have academic programs that are too similar to those of major
competitors and have a price point that is higher than major competitors
– Excerpted from Wise Moves in Tough Times, Dr. Robert Sevier, Stamats
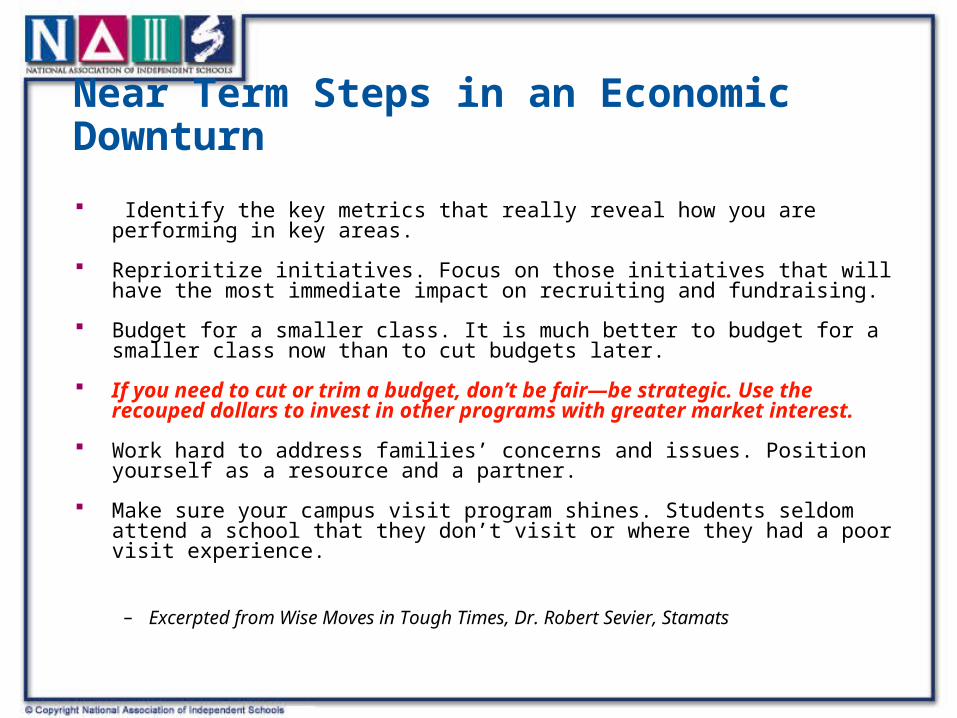
Near Term Steps in an Economic Downturn
Identify the key metrics that really reveal how you are performing in key areas.
Reprioritize initiatives. Focus on those initiatives that will have the most immediate impact on recruiting and fundraising.
Budget for a smaller class. It is much better to budget for a smaller class now than to cut budgets later.
If you need to cut or trim a budget, don’t be fair—be strategic. Use the recouped dollars to invest in other programs with greater market interest.
Work hard to address families’ concerns and issues. Position yourself as a resource and a partner.
Make sure your campus visit program shines. Students seldom attend a school that they don’t visit or where they had a poor visit experience.
– Excerpted from Wise Moves in Tough Times, Dr. Robert Sevier, Stamats
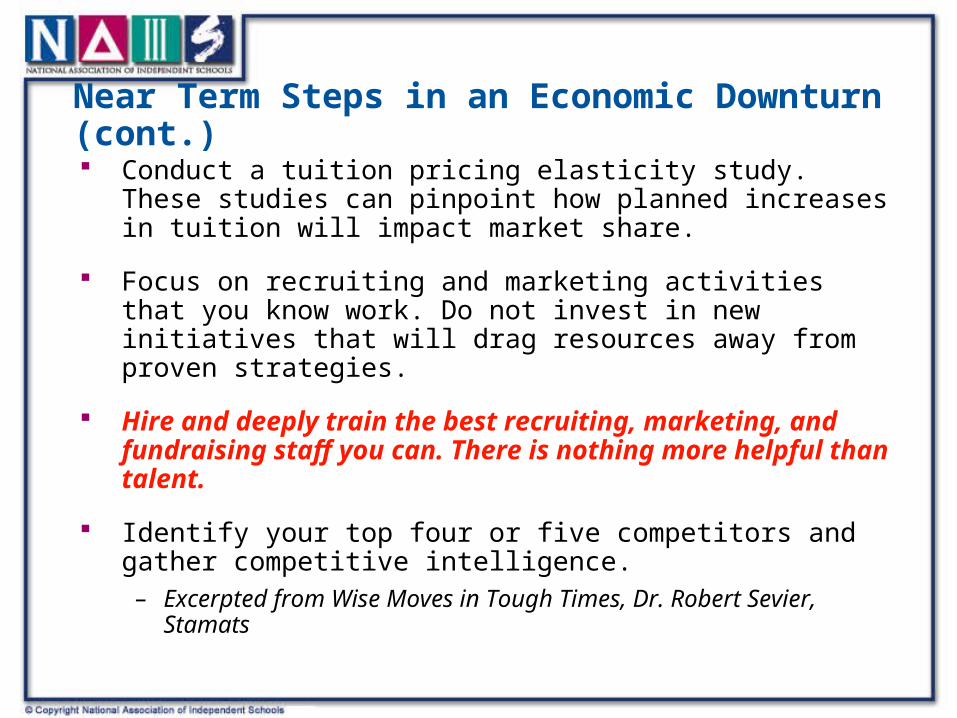
Near Term Steps in an Economic Downturn (cont.)
Conduct a tuition pricing elasticity study. These studies can pinpoint how planned increases in tuition will impact market share.
Focus on recruiting and marketing activities that you know work. Do not invest in new initiatives that will drag resources away from proven strategies.
Hire and deeply train the best recruiting, marketing, and fundraising staff you can. There is nothing more helpful than talent.
Identify your top four or five competitors and gather competitive intelligence.
– Excerpted from Wise Moves in Tough Times, Dr. Robert Sevier, Stamats
Actions Schools Should Take
Subscribe to trend publications:
– The Trend Letter: www.trendletter.com
– Herman Trend Alert: http://www.hermangroup.com/trend_alert_signup.html
Stay current on changing demographic data sets.
Chart and analyze your school’s enrollment history. From where do your students come?
Actions Schools Should Take
Create demographic charts identifying how area economic, racial, and age demographics are changing.
Survey your parents. What are their perceptions of the school?
Find your niche. What is unique about your school? Are all of your communications on message and consistent?
Research new markets—what would you have to change to attract these markets.
Rethink your budget; hold tuition increases.
NAIS Services to assist you…
NAIS Demographic Center—http://www.nais.org/go/demographics
NAIS SurveyBuilder
Financial Sustainability Resources
NAIS Website Resources: www.nais.org

Part II
The Changing Workforce
Trends Driving the Workforce
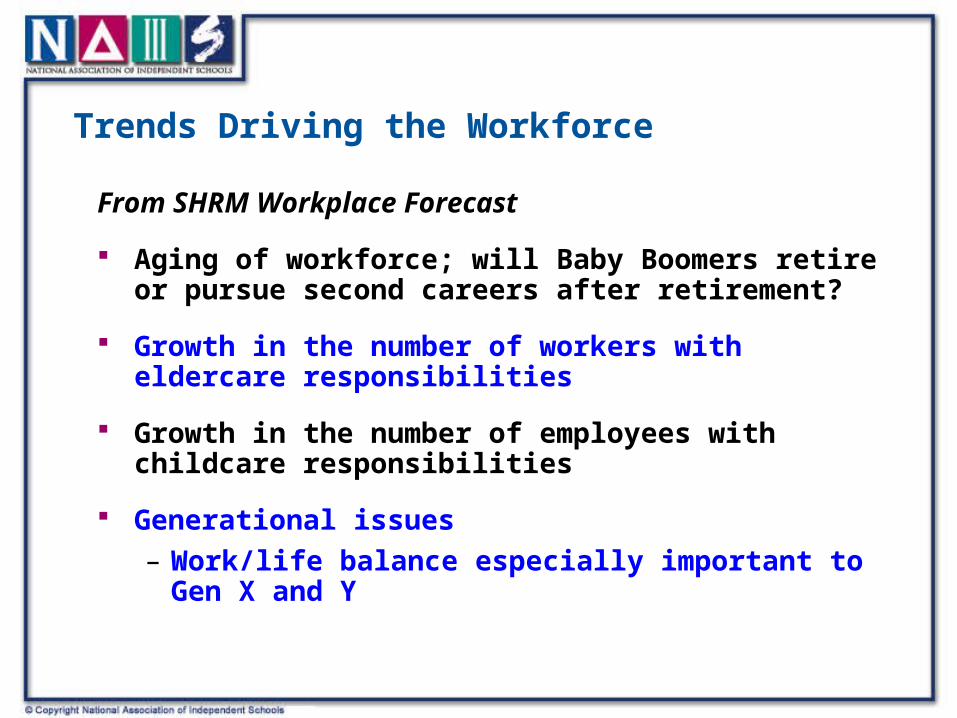
From SHRM Workplace Forecast
Aging of workforce; will Baby Boomers retire or pursue second careers after retirement?
Growth in the number of workers with eldercare responsibilities
Growth in the number of employees with childcare responsibilities
Generational issues
– Work/life balance especially important to Gen X and Y
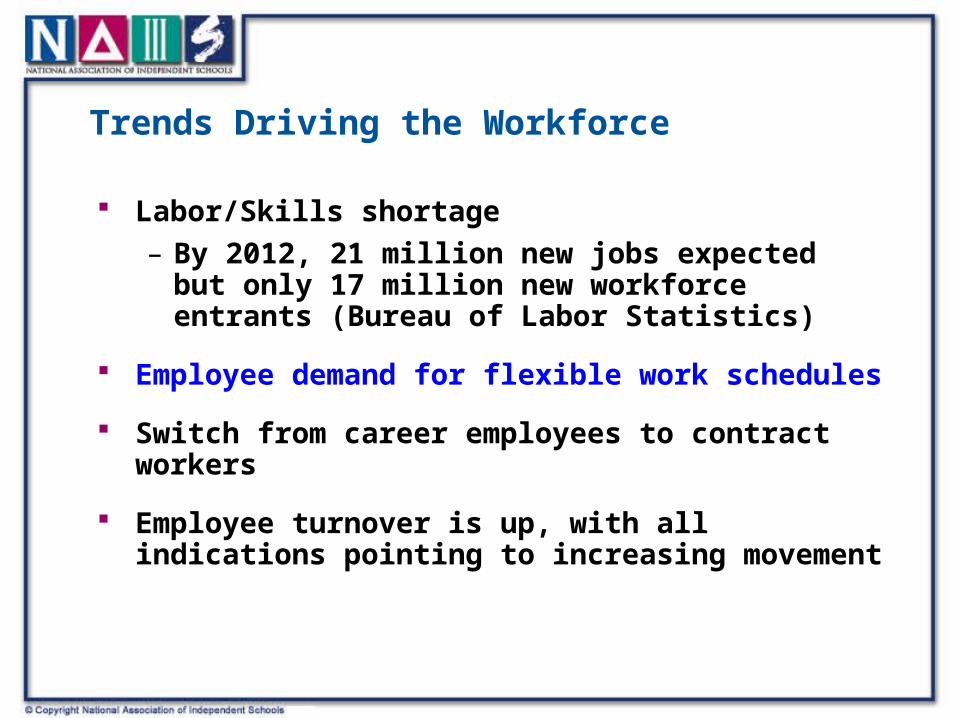
Labor/Skills shortage
– By 2012, 21 million new jobs expected but only 17 million new workforce entrants (Bureau of Labor Statistics)
Employee demand for flexible work schedules
Switch from career employees to contract workers
Employee turnover is up, with all indications pointing to increasing movement
Trends Driving the Workforce
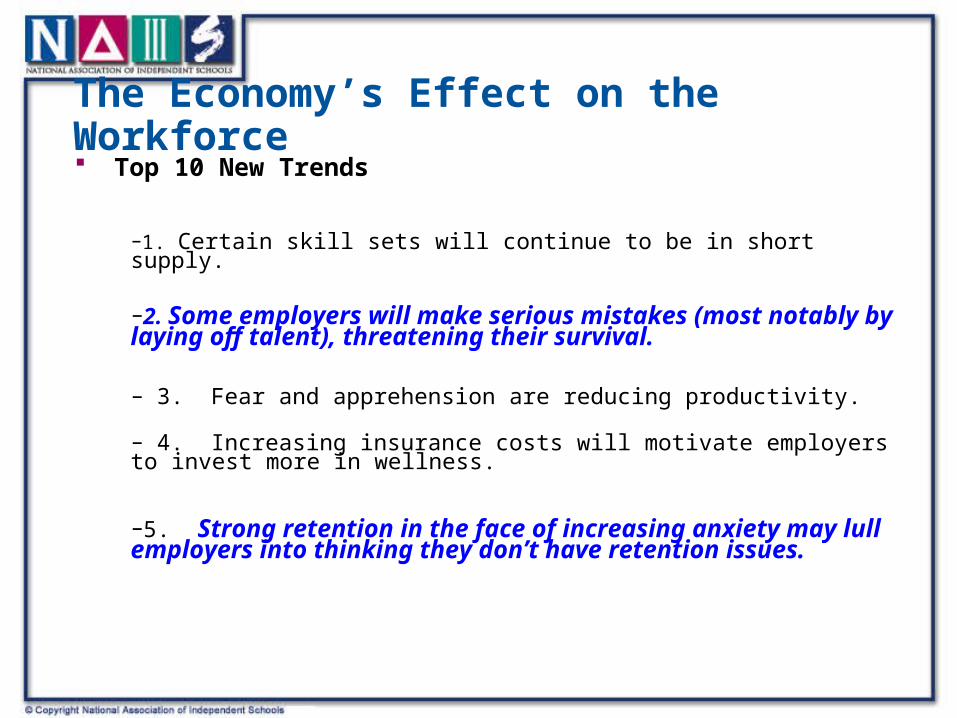
The Economy’s Effect on the Workforce Top 10 New Trends
–1. Certain skill sets will continue to be in short supply.
–2. Some employers will make serious mistakes (most notably by laying off talent), threatening their survival. – 3. Fear and apprehension are reducing productivity.
– 4. Increasing insurance costs will motivate employers to invest more in wellness.
–5. Strong retention in the face of increasing anxiety may lull employers into thinking they don’t have retention issues.

The Economy’s Effect on the Workforce (cont.)
Top 10 (cont.)
– 6. More attention to succession planning is critical.
– 7. Wise companies will use this time well to build bench strength; that is invest in training for their staff, particularly leaders.
– 8. More "Home Sourcing” to maintain control and reduce expenses.
– 9. Employers will find low-cost ways to add value and make staff feel appreciated.
– 10. Older workers will be particularly valued this year; we will see a return of retirees.
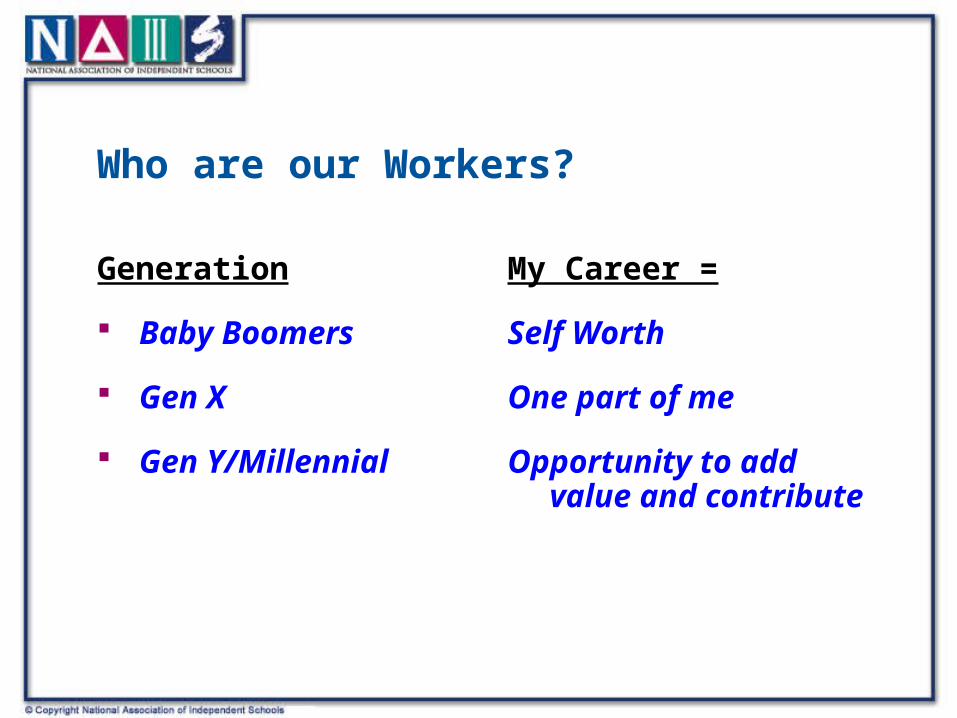
Who are our Workers?
Generation
Baby Boomers
Gen X
Gen Y/Millennial
My Career =
Self Worth
One part of me
Opportunity to add value and contribute
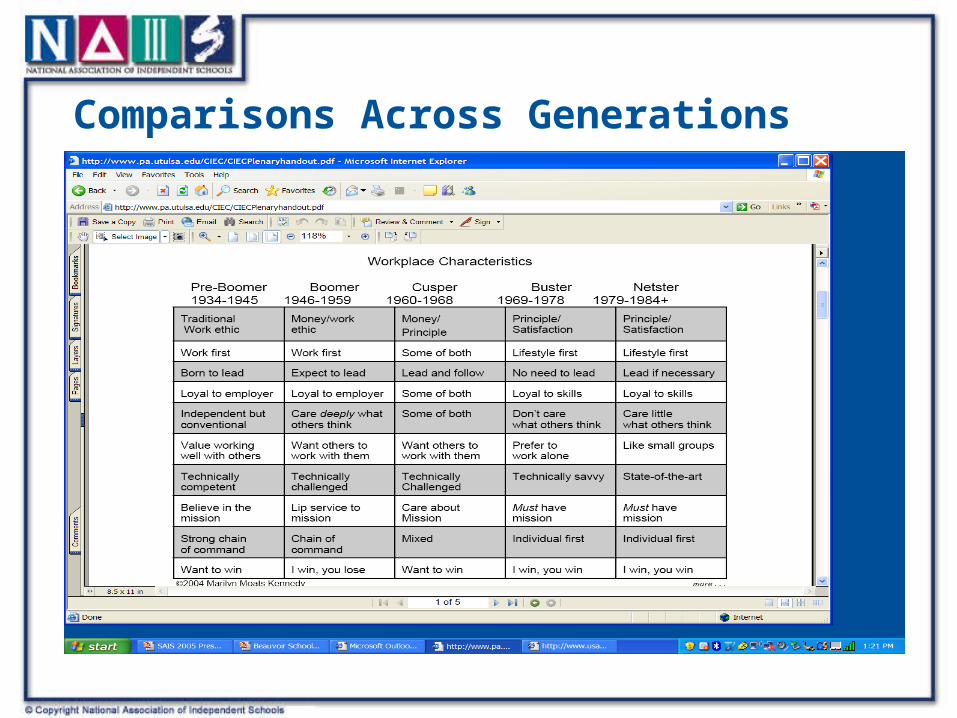
Comparisons Across Generations
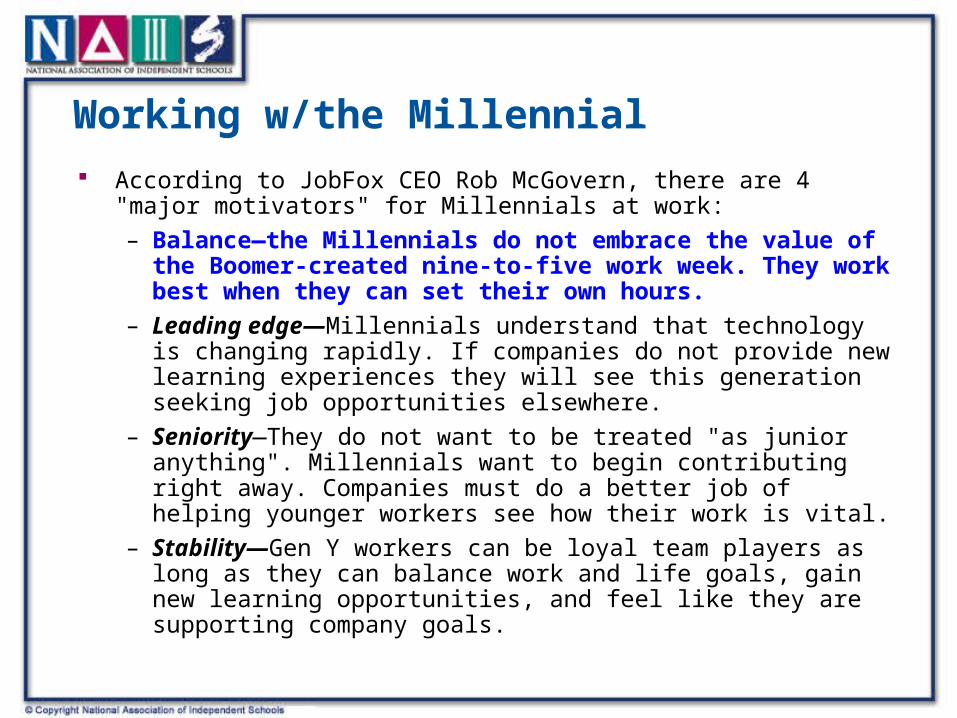
Working w/the Millennial
According to JobFox CEO Rob McGovern, there are 4 "major motivators" for Millennials at work:
– Balance—the Millennials do not embrace the value of the Boomer-created nine-to-five work week. They work best when they can set their own hours.
– Leading edge—Millennials understand that technology is changing rapidly. If companies do not provide new learning experiences they will see this generation seeking job opportunities elsewhere.
– Seniority—They do not want to be treated "as junior anything". Millennials want to begin contributing right away. Companies must do a better job of helping younger workers see how their work is vital.
– Stability—Gen Y workers can be loyal team players as long as they can balance work and life goals, gain new learning opportunities, and feel like they are supporting company goals.
What Flexible Arrangements are Important to the Workforce?
Job sharing
Onsite daycare
Teleworking
Part-time schedules
Summer hours
Flex schedules
Compressed work week
Trends Driving Teaching Profession
Within this decade, U.S. schools will hire over two million new teachers to serve a growing number of students and replace a large cohort of retiring teachers. Evidence of high attrition rates among new teachers suggests that retaining a high quality teaching force will be a challenge.
– The Next Generation of Teachers Project, Harvard University
Trends Driving Teaching Profession: No Longer a Life-long Calling
Many new teachers approach teaching tentatively or conditionally:
– Few plan to make teaching a lifelong career.
– For those who envision short-term careers, well-designed alternative routes to teaching and support at the school site might ensure that they enter and remain in teaching.
The Next Generation of Teachers Project, Harvard University
Trends Driving Teaching Profession: Generational Differences
Teachers in the new generation look for:
– frequent feedback on their performance
– opportunities to work with, instead of next to, other people
– opportunities to strengthen their skills (note: they expect to be rewarded when they improve and are less likely than their predecessors to resist such policies as differentiated pay)
The Next Generation of Teachers Project, Harvard University

Trends Driving Teaching Profession: Compensation
– While some report that they could afford to teach and live comfortably, the majority describe tight financial circumstances. They suggest that pay would significantly affect whether they would stay in teaching.
– The costs of housing, particularly in urban areas, is becoming a major disincentive to entering or staying in the profession.
– “Barely Breaking Even”: Incentives, Rewards, and the High Costs of Choosing to Teach by E. Liu, S. M. Kardos, D. Kauffman, H. G. Peske, & S. M. Johnson,
Actions Schools Should Take
Study recruitment and retention statistics for your school. Identify patterns both positive and negative. Develop strategies for addressing issues.
Offer faculty and staff a flexible workplace. Teleworking, part-time schedules, and job-sharing can help you recruit and retain faculty and staff.
Keep current with benefit trends; particularly understand what different generations seek in a benefit package. Study benefit trends in both the for-profit and nonprofit sectors in your community. You will be competing against both for staff in the future.
NAIS Services to assist you…
Faculty Recruitment and Retention Research—available to member schools via NAIS website
NAIS Career Center—http://www.nais.org/career/index.cfm?Itemnumber=145863
NAIS Website Resources: www.nais.org

Part III
Social Forces
The Changing Consumer: Seeking Transparency
In reaction to the corporate misdeeds of Enron, WorldCom, and others, ethical financial accountability will become standard business practice.
Government, the public, parents, board members, and other constituency groups will demand that schools provide more transparent financial reporting and more data.
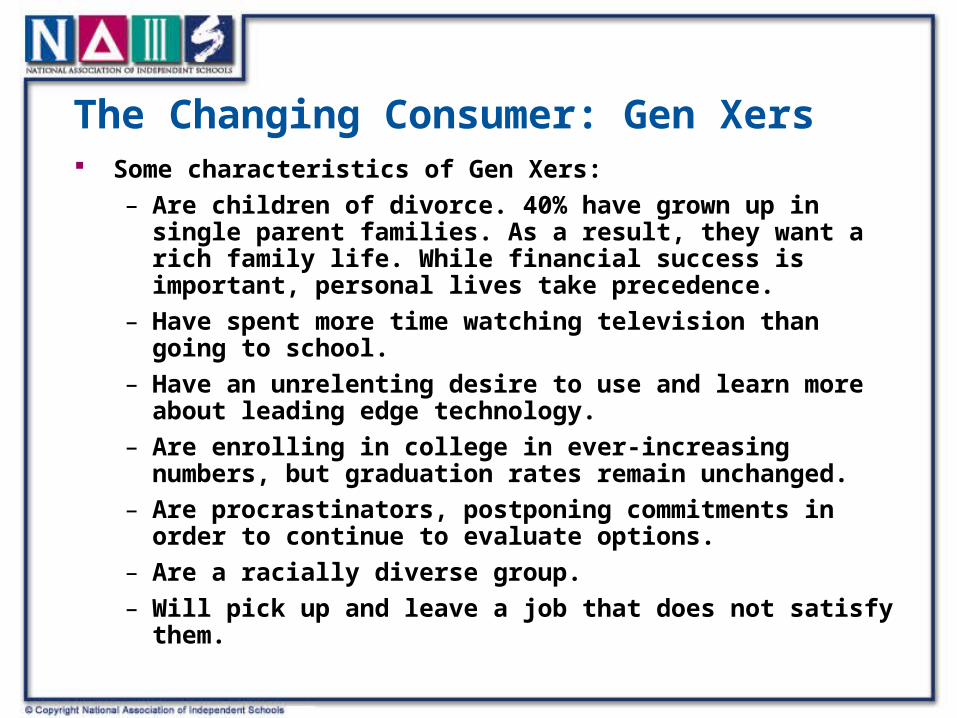
The Changing Consumer: Gen Xers Some characteristics of Gen Xers:
– Are children of divorce. 40% have grown up in single parent families. As a result, they want a rich family life. While financial success is important, personal lives take precedence.
– Have spent more time watching television than going to school.
– Have an unrelenting desire to use and learn more about leading edge technology.
– Are enrolling in college in ever-increasing numbers, but graduation rates remain unchanged.
– Are procrastinators, postponing commitments in order to continue to evaluate options.
– Are a racially diverse group.
– Will pick up and leave a job that does not satisfy them.
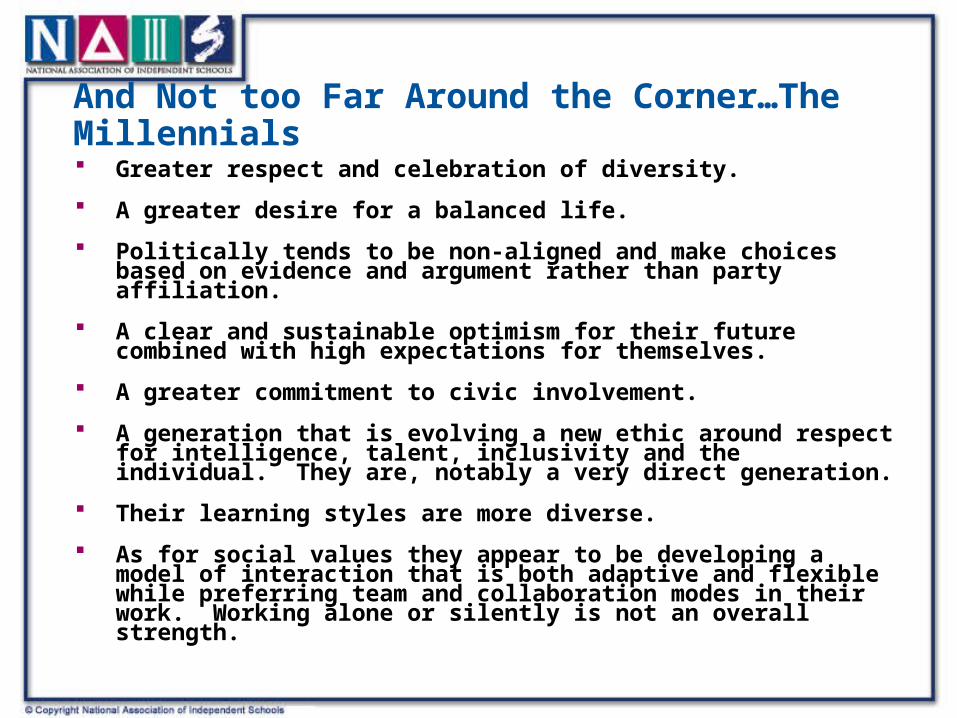
And Not too Far Around the Corner…The Millennials
Greater respect and celebration of diversity.
A greater desire for a balanced life.
Politically tends to be non-aligned and make choices based on evidence and argument rather than party affiliation.
A clear and sustainable optimism for their future combined with high expectations for themselves.
A greater commitment to civic involvement.
A generation that is evolving a new ethic around respect for intelligence, talent, inclusivity and the individual. They are, notably a very direct generation.
Their learning styles are more diverse.
As for social values they appear to be developing a model of interaction that is both adaptive and flexible while preferring team and collaboration modes in their work. Working alone or silently is not an overall strength.

The Changing Consumer: Women as Buyers
According to market guru Tom Peters:“Start with women. They buy everything. Consider these stats from the
US,UK, Canada, Australia, and New Zealand. Women’s share of purchases:
– Home furnishings ...94%– Vacations ... 92%– Houses ... 91%– D.I.Y. (major “home projects”) ...80%– Consumer electronics ...51% (66% home computers)– Cars ... 68%– All consumer purchases ...83%– Bank account ... 89%– Household investment decisions ...67%– Small business loans/biz starts ... 70%– Health care ...80%”
Excerpted from Everything You Need to Know About Strategy: A Baker’s Dozen Eternal Verities by Tom Peters
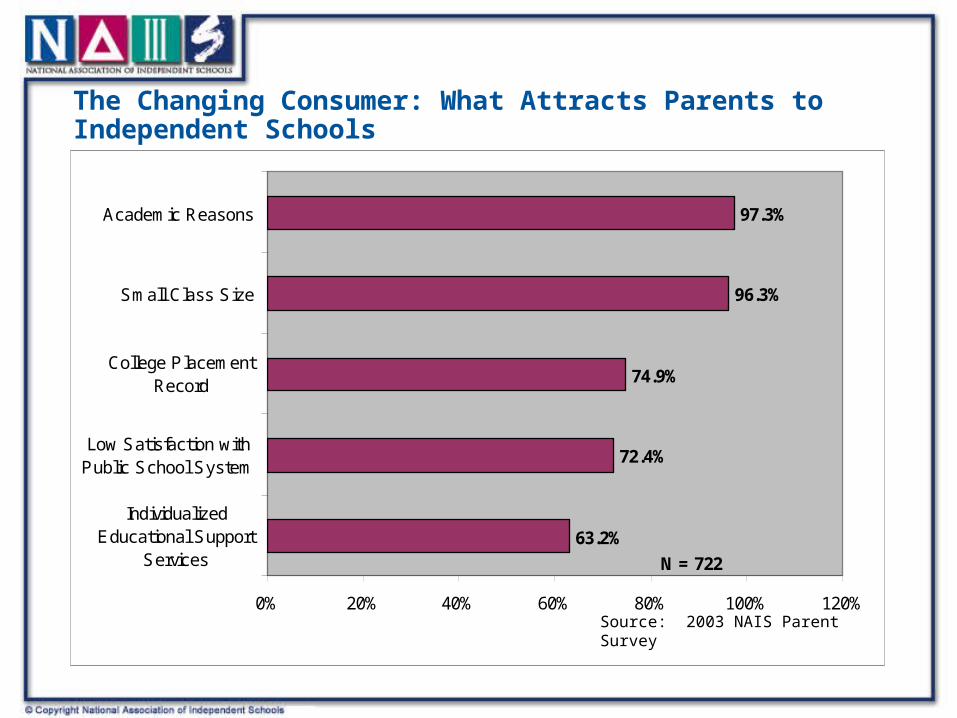
The Changing Consumer: What Attracts Parents to Independent Schools
63.2%
72.4%
74.9%
96.3%
97.3%
0% 20% 40% 60% 80% 100% 120%
IndividualizedEducational Support
Services
Low Satisfaction withPublic School System
College PlacementRecord
Small Class Size
Academic Reasons
N = 722
* Factors considered 'Important' or 'Very Important.'Source: 2003 NAIS Parent Survey
What Ed Consultants Say
Top three reasons their clients seek an independent school education
– Dissatisfaction with the local public school system
– Gain more individualized attention
– To meet a need for a child with learning differences
– NAIS School Search Trends Survey 2009
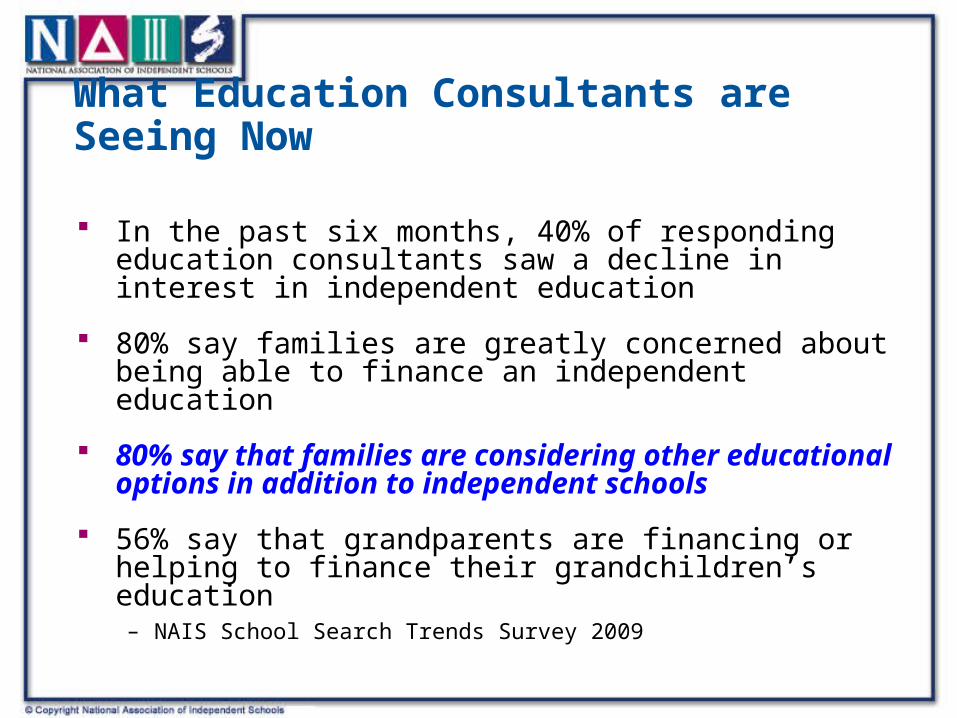
What Education Consultants are Seeing Now
In the past six months, 40% of responding education consultants saw a decline in interest in independent education
80% say families are greatly concerned about being able to finance an independent education
80% say that families are considering other educational options in addition to independent schools
56% say that grandparents are financing or helping to finance their grandchildren’s education
– NAIS School Search Trends Survey 2009
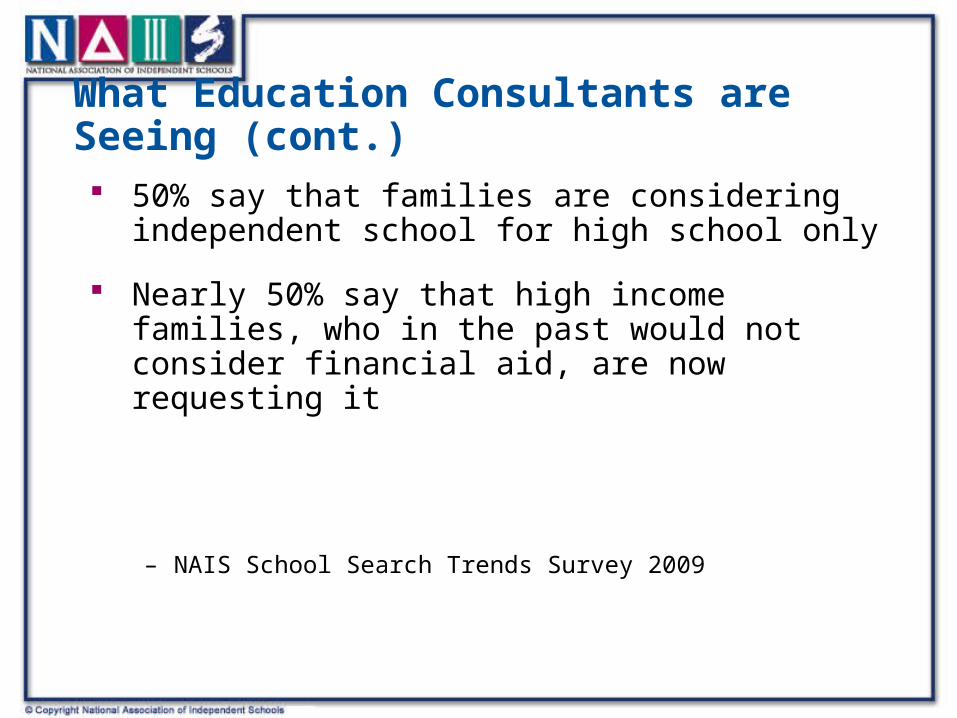
What Education Consultants are Seeing (cont.)
50% say that families are considering independent school for high school only
Nearly 50% say that high income families, who in the past would not consider financial aid, are now requesting it
– NAIS School Search Trends Survey 2009
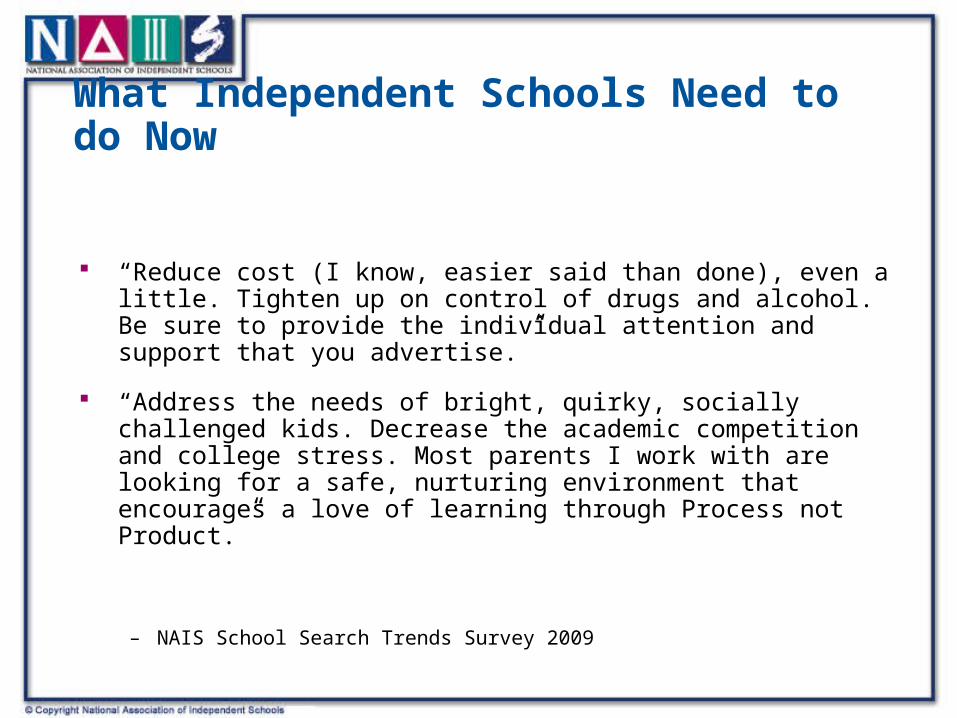
What Independent Schools Need to do Now
“Reduce cost (I know, easier said than done), even a little. Tighten up on control of drugs and alcohol. Be sure to provide the individual attention and support that you advertise.”
“Address the needs of bright, quirky, socially challenged kids. Decrease the academic competition and college stress. Most parents I work with are looking for a safe, nurturing environment that encourages a love of learning through Process not Product.”
– NAIS School Search Trends Survey 2009
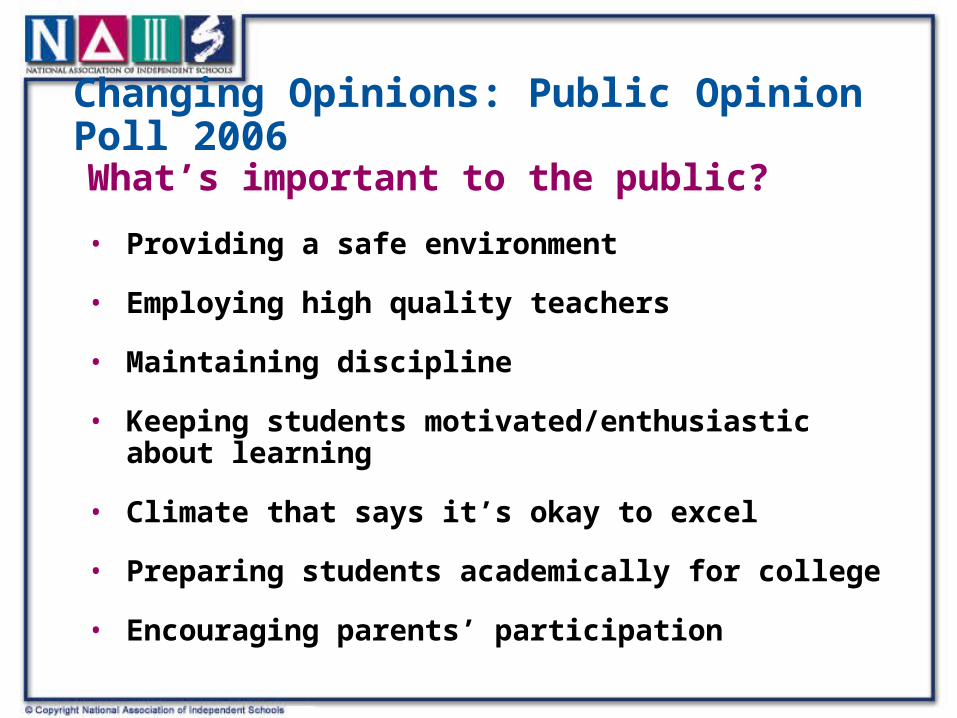
Changing Opinions: Public Opinion Poll 2006
What’s important to the public?
• Providing a safe environment
• Employing high quality teachers
• Maintaining discipline
• Keeping students motivated/enthusiastic about learning
• Climate that says it’s okay to excel
• Preparing students academically for college
• Encouraging parents’ participation
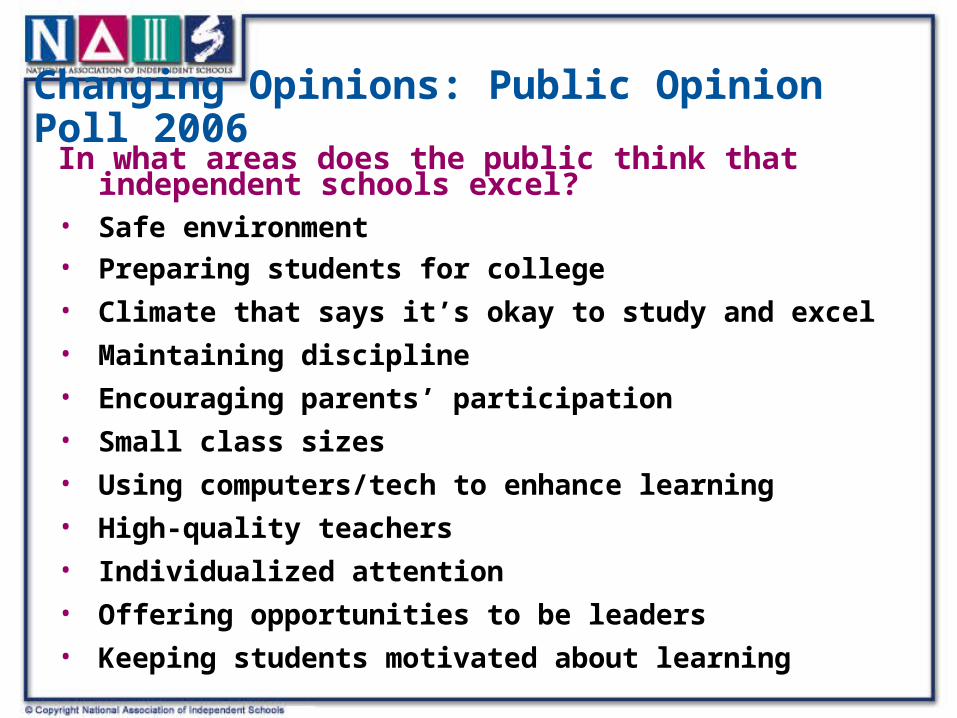
Changing Opinions: Public Opinion Poll 2006In what areas does the public think that independent
schools excel?• Safe environment • Preparing students for college
• Climate that says it’s okay to study and excel
• Maintaining discipline
• Encouraging parents’ participation
• Small class sizes
• Using computers/tech to enhance learning
• High-quality teachers
• Individualized attention
• Offering opportunities to be leaders
• Keeping students motivated about learning
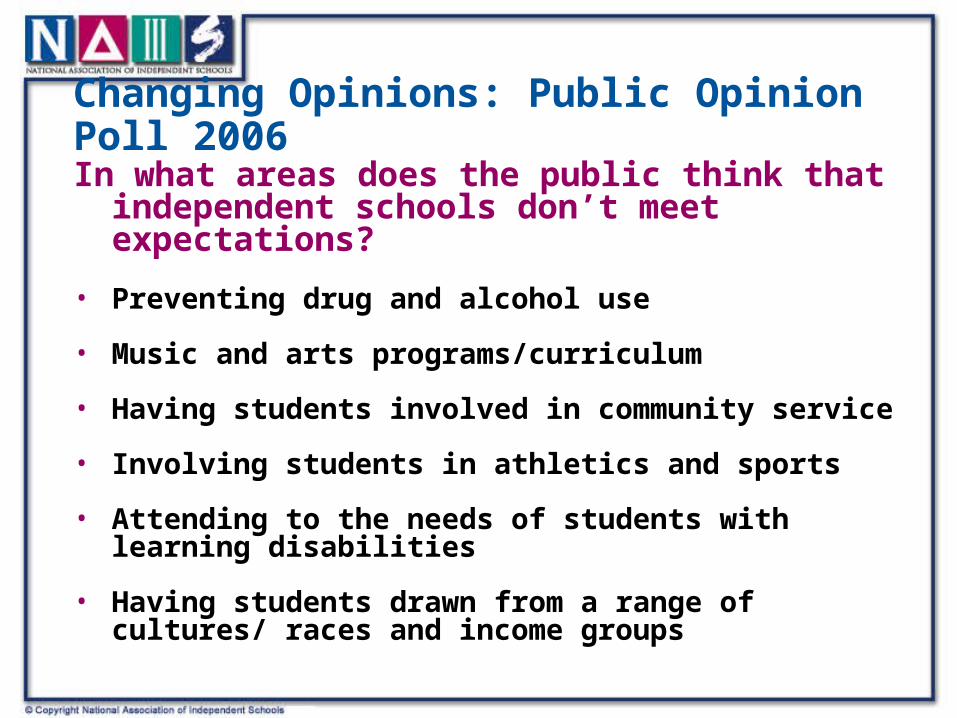
Changing Opinions: Public Opinion Poll 2006
In what areas does the public think that independent schools don’t meet expectations?
• Preventing drug and alcohol use
• Music and arts programs/curriculum
• Having students involved in community service
• Involving students in athletics and sports
• Attending to the needs of students with learning disabilities
• Having students drawn from a range of cultures/ races and income groups
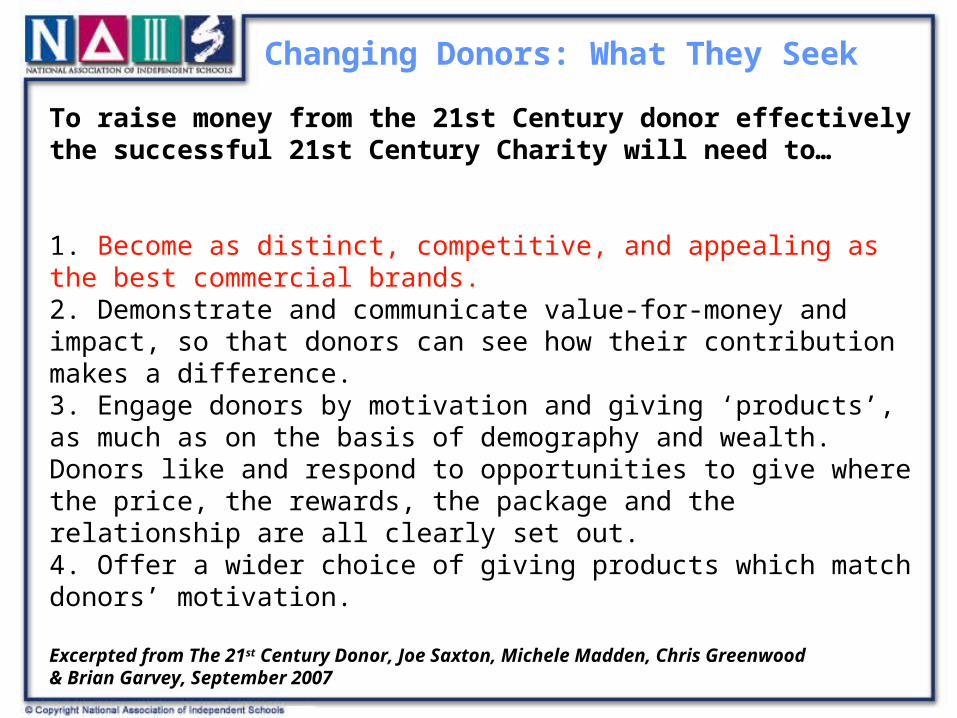
To raise money from the 21st Century donor effectivelythe successful 21st Century Charity will need to…
1. Become as distinct, competitive, and appealing as the best commercial brands.2. Demonstrate and communicate value-for-money and impact, so that donors can see how their contribution makes a difference.3. Engage donors by motivation and giving ‘products’, as much as on the basis of demography and wealth. Donors like and respond to opportunities to give where the price, the rewards, the package and the relationship are all clearly set out.4. Offer a wider choice of giving products which match donors’ motivation.
Excerpted from The 21st Century Donor, Joe Saxton, Michele Madden, Chris Greenwood& Brian Garvey, September 2007
Changing Donors: What They Seek
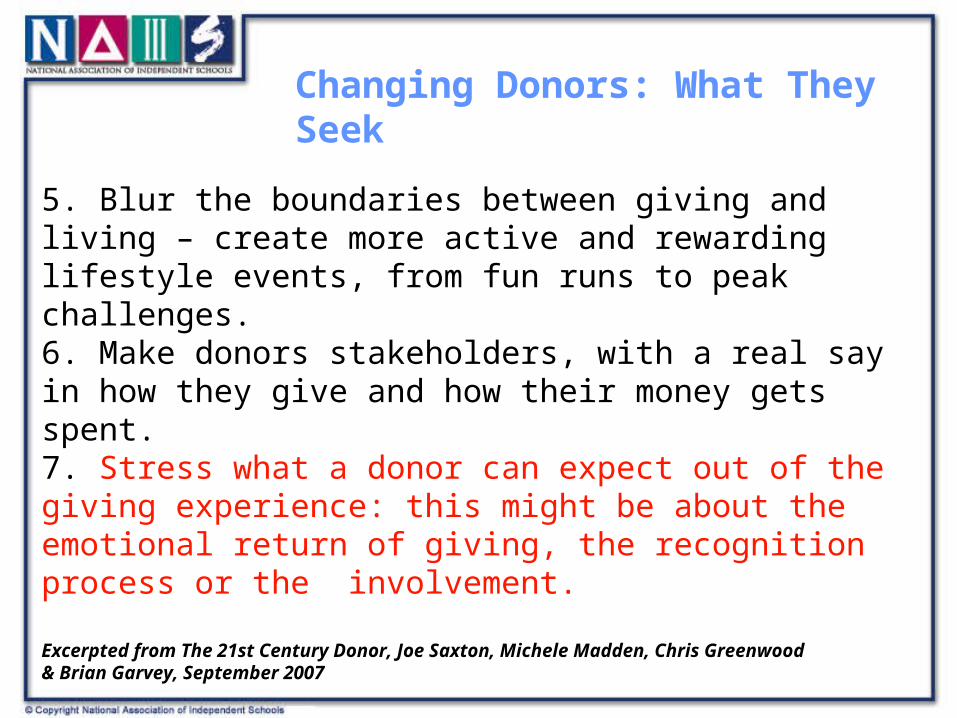
5. Blur the boundaries between giving and living – create more active and rewarding lifestyle events, from fun runs to peak challenges.6. Make donors stakeholders, with a real say in how they give and how their money gets spent. 7. Stress what a donor can expect out of the giving experience: this might be about the emotional return of giving, the recognition process or the involvement.
Excerpted from The 21st Century Donor, Joe Saxton, Michele Madden, Chris Greenwood& Brian Garvey, September 2007
Changing Donors: What They Seek
8. Appeal intensely to specific, defined target audiences. A lukewarm appeal to the general public is worth far less than a burning passion amongst a key demographic or attitudinal group.9. Woo more big givers, corporate and individual, via the offer of recognition and the opportunity to change both their own lives and the lives of beneficiaries.10. Integrate the experience of giving time, money or activism so as to retain loyal supporters able to give different things at different life stages.
Excerpted from The 21st Century Donor, Joe Saxton, Michele Madden, Chris Greenwood& Brian Garvey, September 2007
Changing Donors: What They Seek
Changing Donors: Patterns of Giving
Researchers at Indiana University Center on Philanthropy analyzed data from 10,000 individuals, 80% of whom had given to charity. They represented five generations: great (born before 1929), silent (born 1929-1945), boomer (born 1946-1963), generation X (born 1964-1981), and millennial (born since 1981).
– The scholars found that the amount people give rises along with their income, levels of education, and frequency of attending religious services. The age of donors didn’t matter at all.
Actions Schools Should Take Now
Change your marketing approach to accommodate different cultural and social nuances of a changing population. Market now for tomorrow.
Be much better and consistent about reporting on your product. Refine your value proposition.
Conduct research to track your alumni. This research will help you market your school, measure the effectiveness of your programs, and provide data to respond to requests for academic accountability.
Go digging in your database: Segment your donors by generation and giving patterns; investigate what may be affecting donor loyalty at your school.
NAIS Services to assist you…
NAIS SurveyBuilder
NAIS Public Opinion Poll
NAIS Marketing Handbook
NAIS Website Resources: www.nais.org

And.. A few parting words…
“Look at the world around you. It may seem like an immovable, implacable
place. It is not. With the slightest push — in just the right place — it can be tipped.”
The Tipping Point