sais-nais 2007 winter retreat mark j. mitchell, nais vp, sch info services [email protected]...
TRANSCRIPT

SAIS-NAIS 2007 Winter RetreatMark J. Mitchell, NAIS VP, Sch Info Services
Benchmarking Performance:Tools You Can Use

NAIS StatsOnline Variety of reports available
– How quickly do you need information?– How broadly do you want to compare yourself to others?– What problem are you looking to solve? – What picture are you painting?
NAIS Statistical Reports– Facts-At-A-Glance (public)– National Tables (NAIS members-only)– Custom Benchmarking (Five authorized users at member schools)– Custom reports also available
Comparative, Analytical Tools– Dashboard Indicators– Financing Schools Calculator

Facts-At-A-Glance
Problem: “I have a committee meeting on evaluating our endowment position, which we feel is too low. The meeting starts in fifteen minutes and I need to know the endowment of the typical NAIS and SAIS school.”
Answer: Average endowment for all NAIS schools in 2005-06 was $33,639 per student. For SAIS schools, it was $16,018.
Where to find these data?

Facts-At-A-Glance Provides quick and easy benchmarking at the broadest
level…comparisons to an association’s members for one-year snapshots
Access to 140 key indicators
– Enrollment, tuition, financial aid, attrition, admissions, student and staff diversity,
– Per student ratios: income, expense, endowment, giving, staffing
– Teacher salaries, benefits contributions
National facts as well as state/regional facts available (for StatsOnline participating associations)
Next
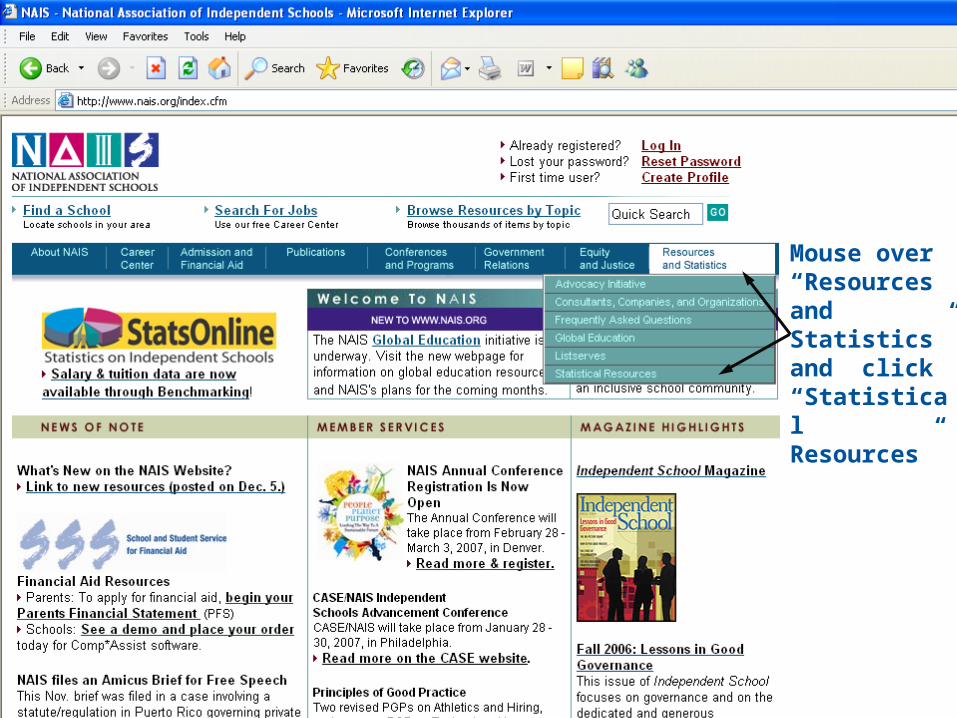
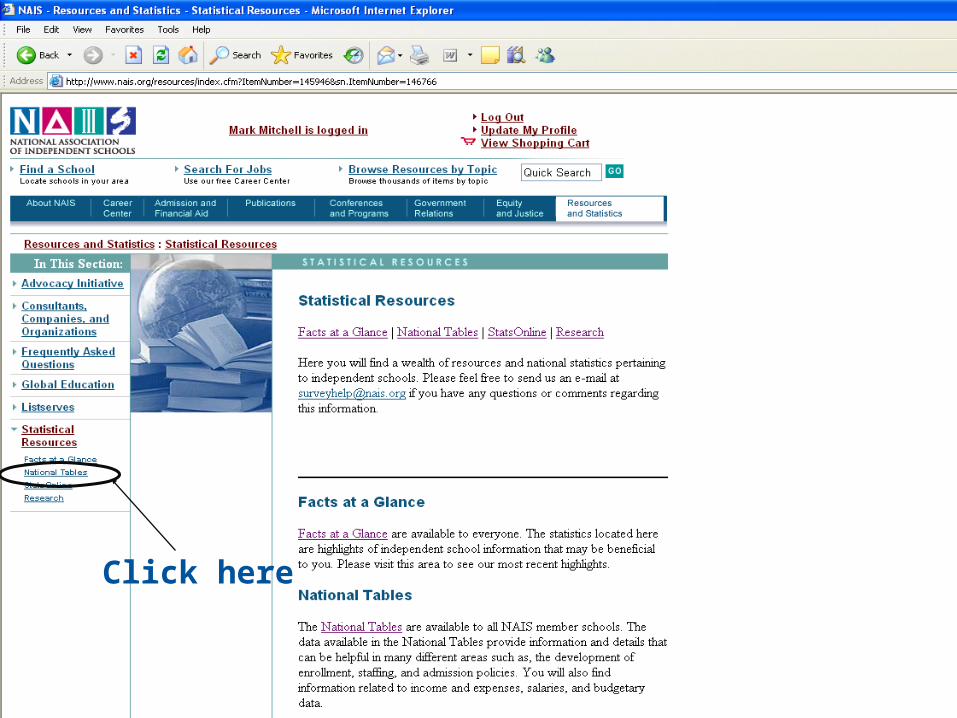
Mouse over “Resources and Statistics” and click “Statistical Resources”
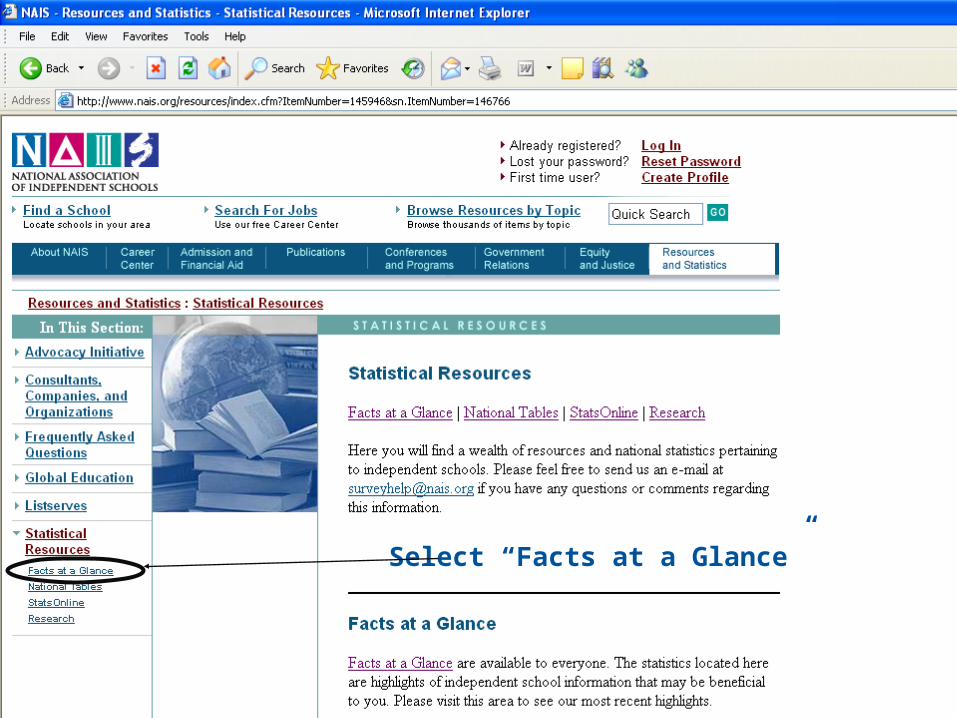
Select “Facts at a Glance”

Select the association(one at a time)

Select the year

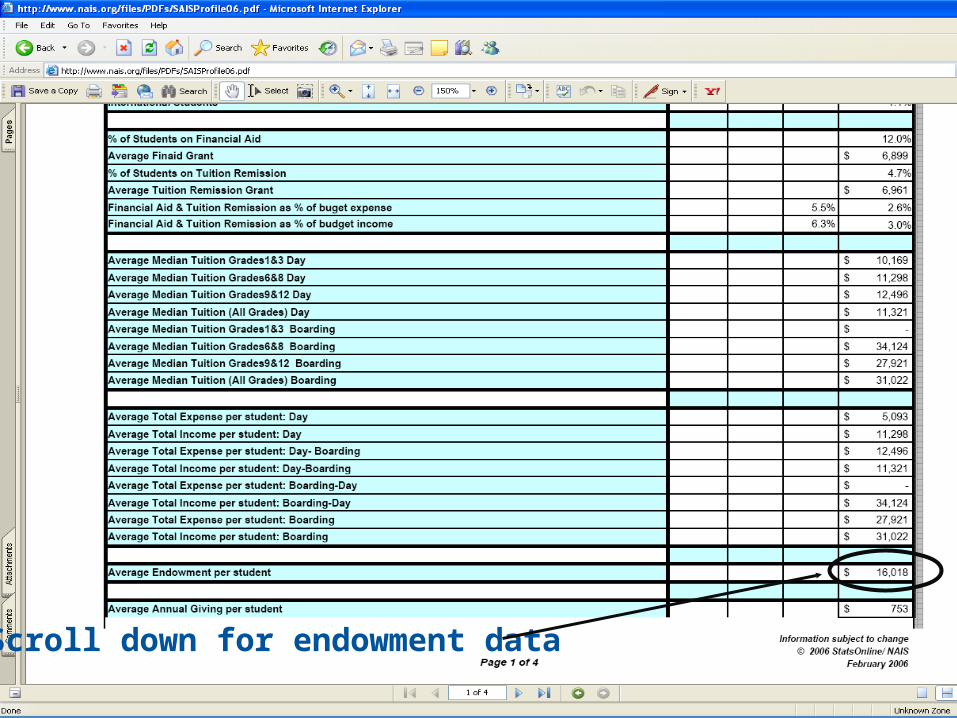
Scroll down for endowment data

National Tables
Problem: Data for all schools is too generic. I need to know the endowment figure for day schools. Would also be nice to know same stats for schools of my size and location.
Answer: For day schools, endowment per student was $19,321; $14,546 for schools located in the Southeast region. For large schools (above 700 enrolled), $31,976.
Where to find these data?
National Tables
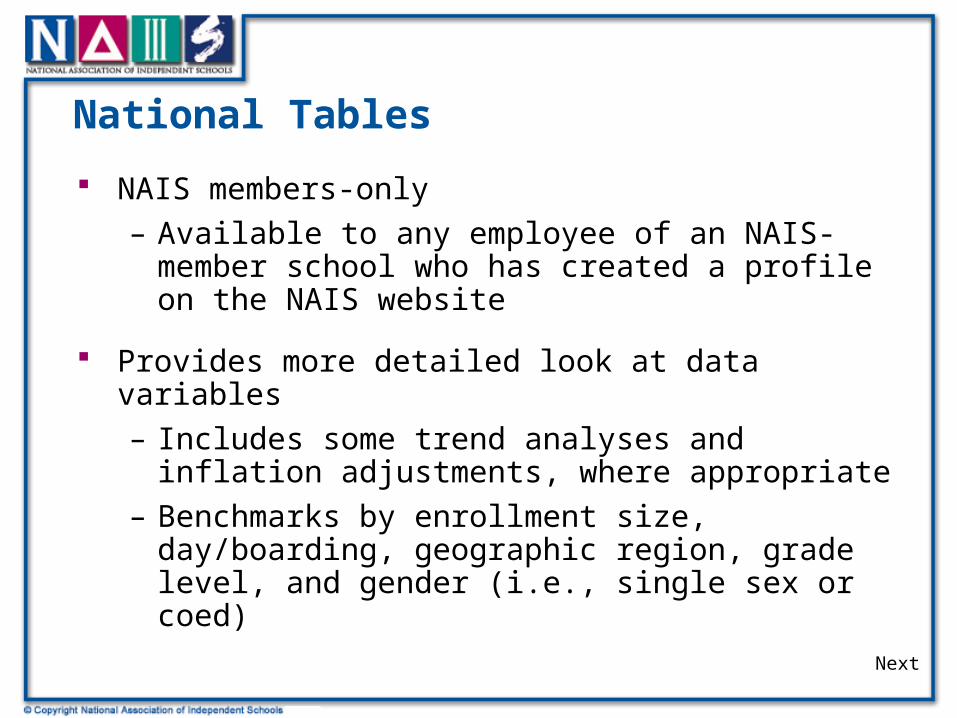
NAIS members-only
– Available to any employee of an NAIS-member school who has created a profile on the NAIS website
Provides more detailed look at data variables
– Includes some trend analyses and inflation adjustments, where appropriate
– Benchmarks by enrollment size, day/boarding, geographic region, grade level, and gender (i.e., single sex or coed)
Next

Be sure to login first

Click here
Click here

Select the categoryof data you want to see

Pick the year


Customized Benchmarking
Problem: My board chair wants to know even more specific endowment data. How does our endowment compare to the other large day schools in the state? What about several specific schools in our area that we overlap with?
Answer: Create a benchmark group of the schools you want to examine. If they have provided data and you have provided data, you can get the answer fairly quickly
Where to find these data?

Customized Benchmarking
Available using StatsOnline
Provides pre-set and customized benchmarking groups in categories that are more specific than Facts at a Glance and National Tables provide
All data collected in StatsOnline surveys are available for benchmarking (thousands of variables)
– Must be one of five authorized users
– Must give data to get data
Next

Be sure to login first
Click StatsOnline logo

Self-explanatory

Choose “Benchmarking”
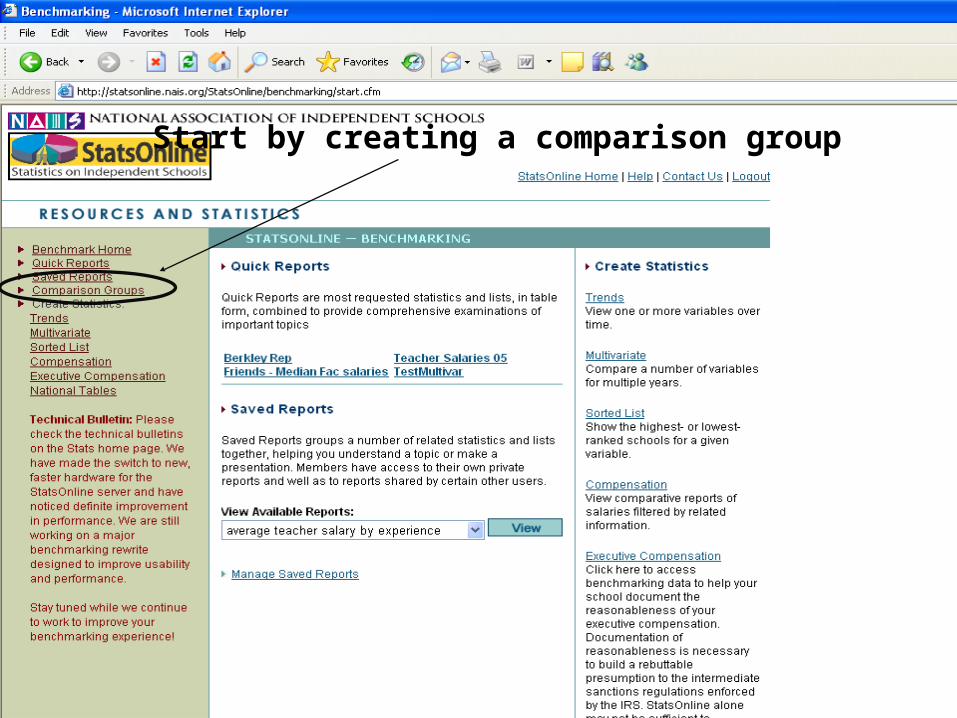
Start by creating a comparison group

Create a custom group from scratch
Or create from an existing group(over 120 pre-set groups)
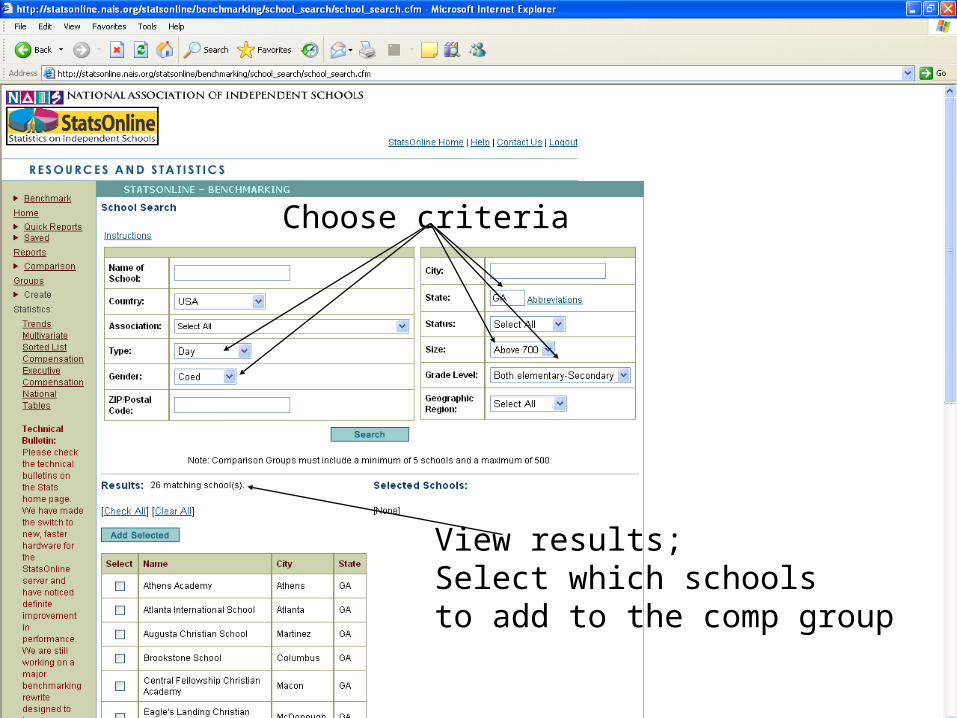
View results;Select which schools to add to the comp group
Choose criteria
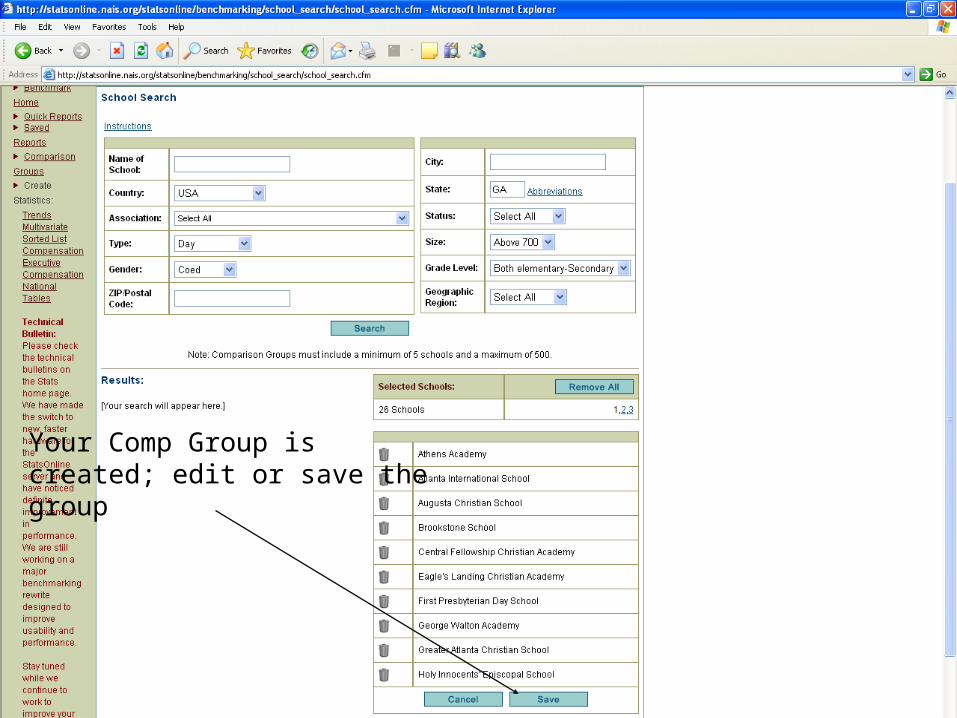
Your Comp Group iscreated; edit or save the group

Share itDescribe itName it
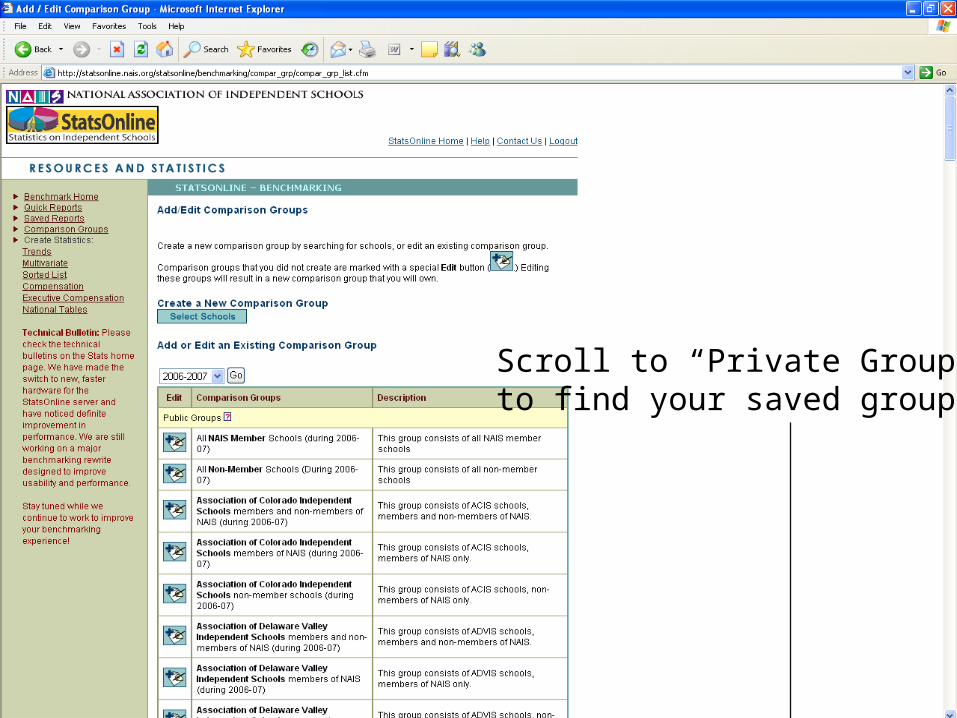
Scroll to “Private Groups”to find your saved groups

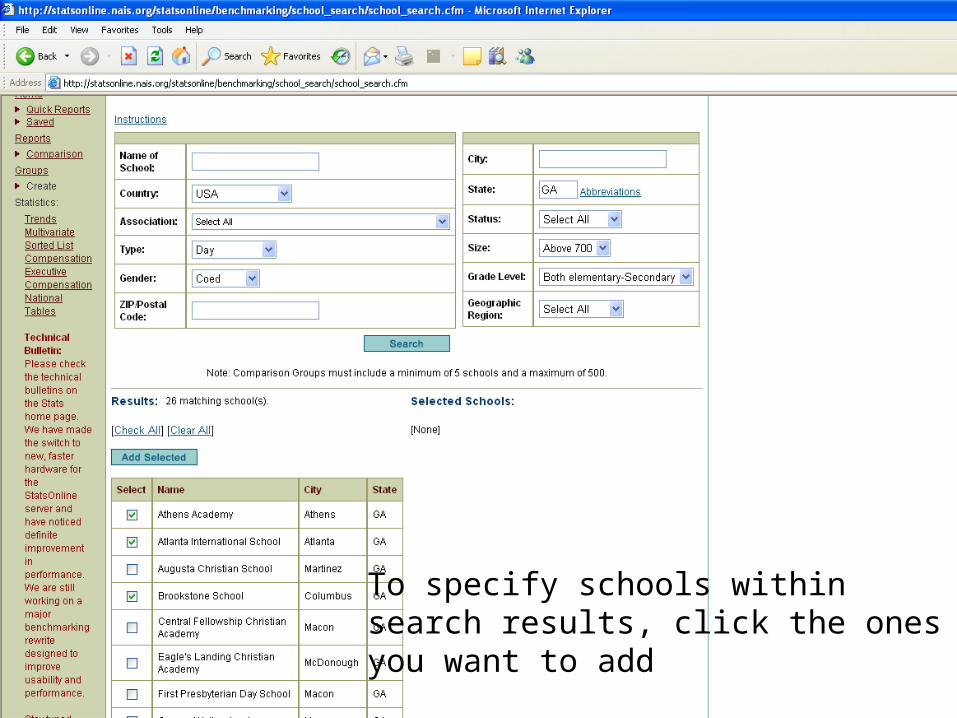
To specify schools withinsearch results, click the onesyou want to add

Instead of all schools,select the schools that you want.Must choose at least 5 schools for a comp group to save.

Your customized benchmarkgroup is created; click save
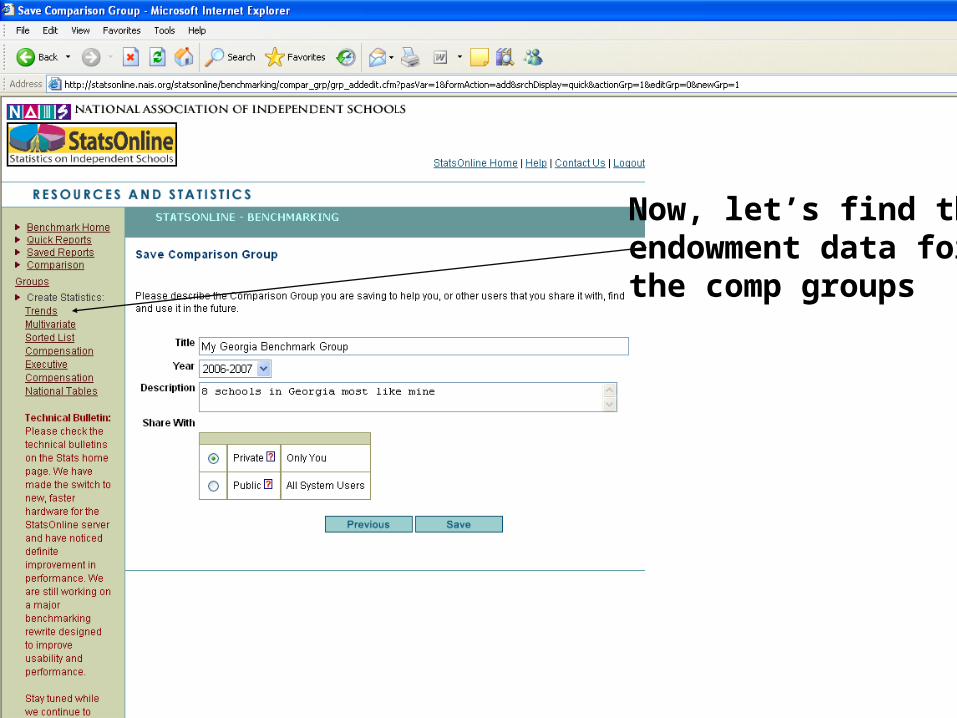
Now, let’s find theendowment data forthe comp groups

Select the data/variable

1. Choose “Variable Family”2. Select which variable from list3. Move variable to “Selected”4. Click “Save”

MM Sample School
Pick your Comparison Grp

Choose pre-setgroups or customgroups you made
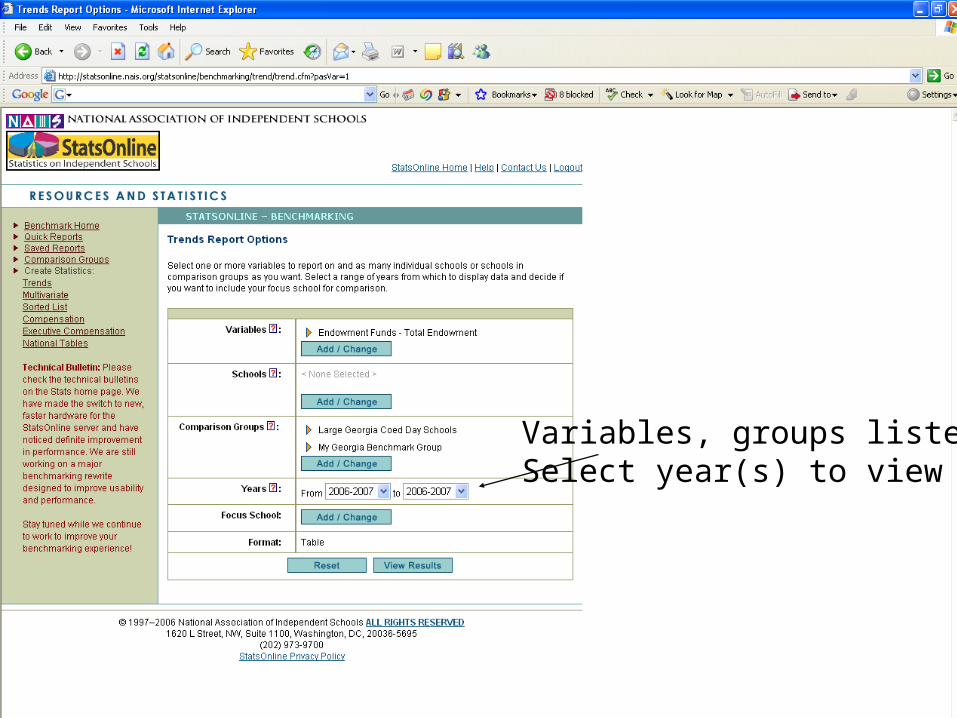
Variables, groups listed;Select year(s) to view


Dashboard Indicators Problem: Is growing our endowment the financial
challenge we should be most concerned about? What else is out there?
Answer: Endowment per student is comparable to but lower than the benchmark group (7.2% lower); other areas of concern may need even more attention
– annual giving per student is 61% lower;
– avg salary is 29% lower;
– investment income nearly nonexistent; and
– the attrition rate is twice as high
Where to find these data?
Dashboard Indicators
Highlights 20+ specific variables as key indicators/drivers of school financial position
Available in StatsOnline only, for head and business manager
Provides broad summary of data for your school and a comparison group you choose
– Allows opportunity to spot over- and under-performing areas that may need attention
– Helps determine short- and mid-range financial planning goals
– Pre-cursor to Online Calculator
Next

Choose “Financing Schools Calculator”

StatsOnline Dashboard Indicators & Calculator
Your school namewill appearautomatically
Choose 2006 to get complete data set

School data pulled automatically from StatsOnline.You can edit thesefields to create scenarios or update info
Any changes made are not saved in StatsOnline
Click “Submit” to see the Dashboard

Select any comp group you’ve created or create one
MM Sample School
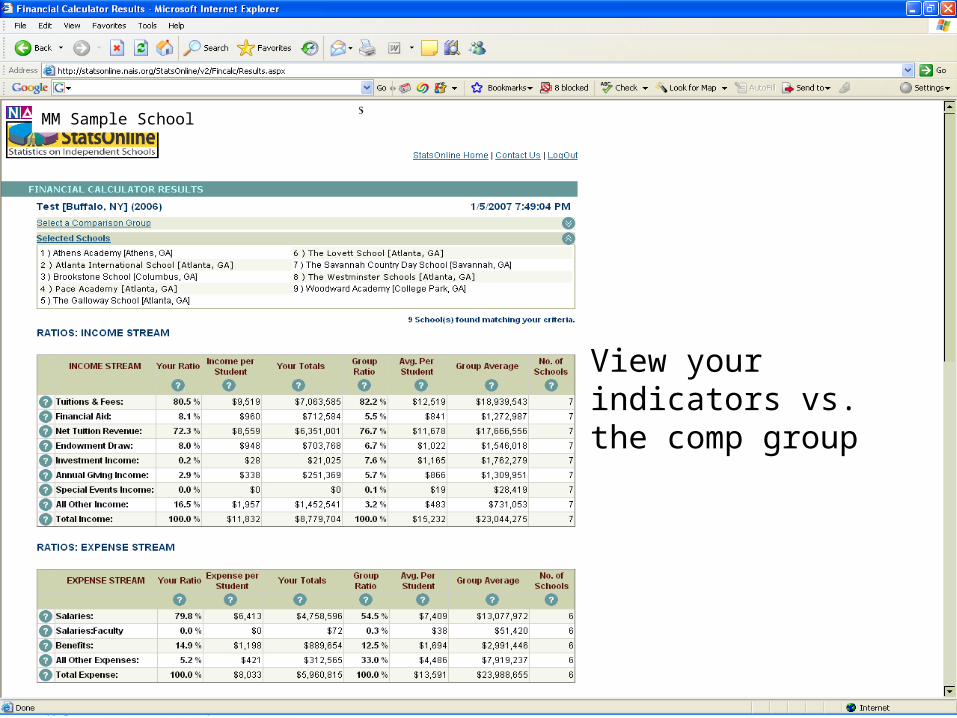
View your indicators vs.the comp group
MM Sample School
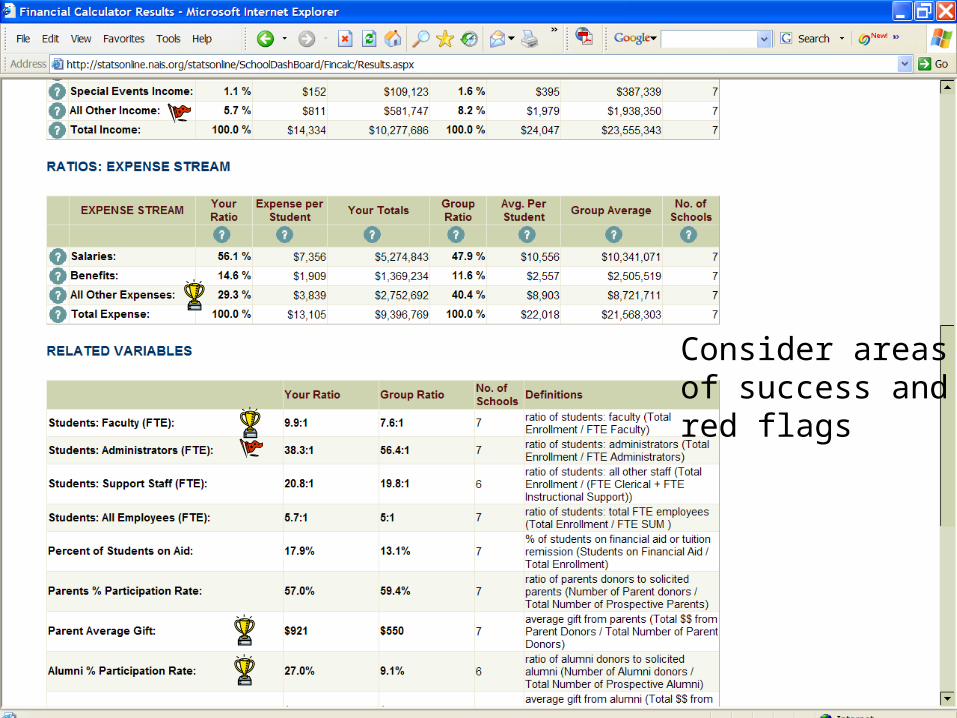
Consider areasof success and red flags

Do we have toraise salaries to be more competitive?How to fund it?
Online Calculator
Problem: Now we know endowment may not really our biggest challenge, relatively speaking. But raising salaries, perhaps through increased giving and other income sources, is something to be concerned about. What would it take to position ourselves for future financial equilibrium in those areas?
Answer: Using the Online Financial Calculator, plug in assumed rates of change in tuition, other income, salaries, and staffing to guide us along the right path
Where to find this tool?
Online Calculator
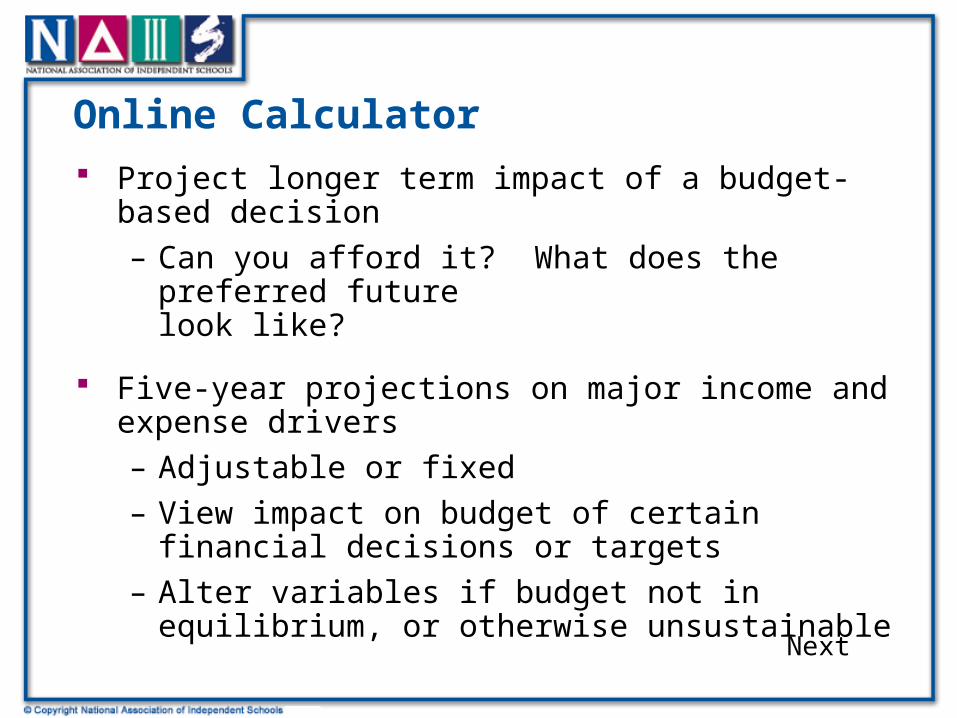
Project longer term impact of a budget-based decision
– Can you afford it? What does the preferred future look like?
Five-year projections on major income and expense drivers
– Adjustable or fixed
– View impact on budget of certain financial decisions or targets
– Alter variables if budget not in equilibrium, or otherwise unsustainable
Next
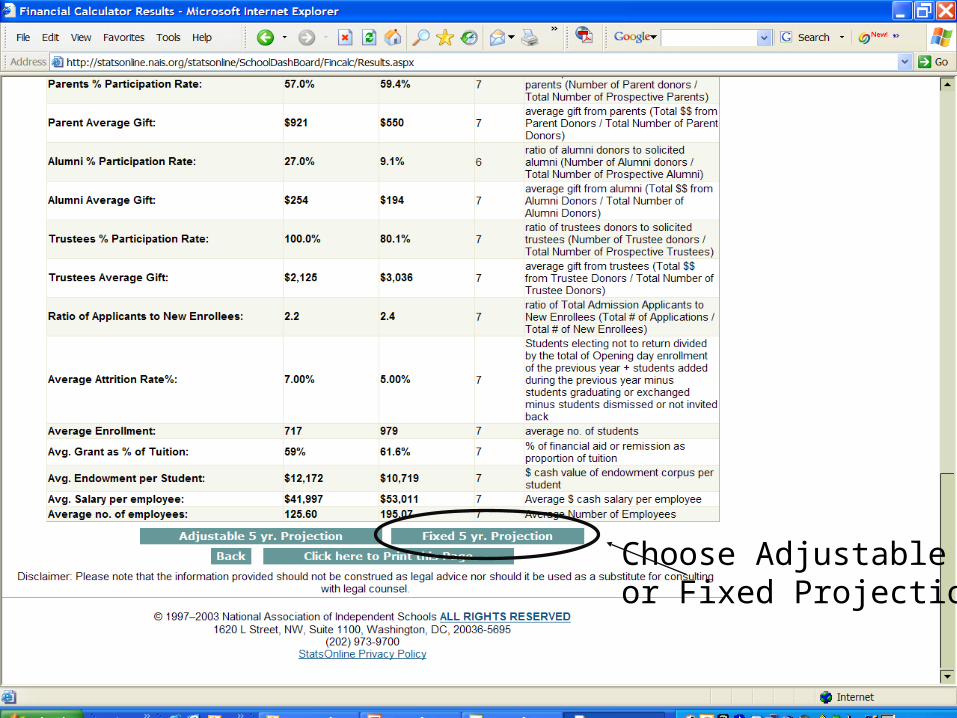
Choose Adjustableor Fixed Projection

1. Hold tuition at/near inflation
2. Seek more giving
3. Create special events revenue goals

4. Push salaries to 2x inflation
5. Freeze fac. hiring
Click “submit” to seewhat happens in 5 yrs
6. Expand admin staff fornew giving & events goals

Is this growth realistic? More?Less?

Strong but diminishingreturns? Can we affordmore inv in fin aid and salaries? For how long?
Hit the back button; changevariables to explore otheroptions
What are wedoing withthe money?!

Compensation Benchmarking: For Heads, Business Managers Only
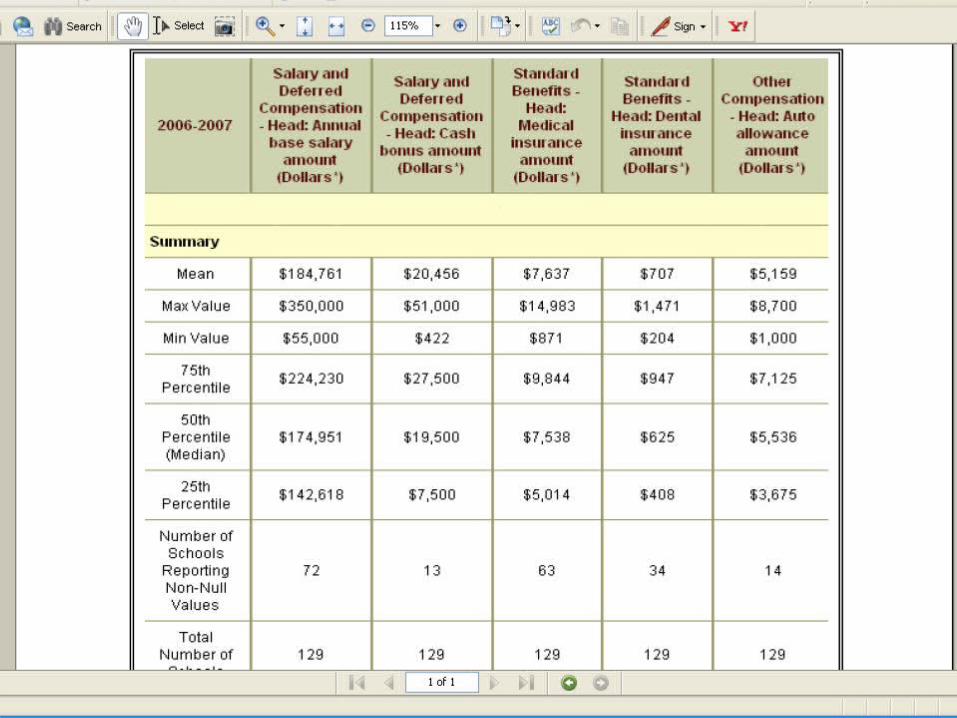
Salary data and comparison for key administrative positions
Executive compensation benchmarking for heads and CFO’s
– Examine total compensation
Salary, bonuses, deferred comp, insurance, housing allowances, other benefits
Free reports from StatsOnline benchmarking section
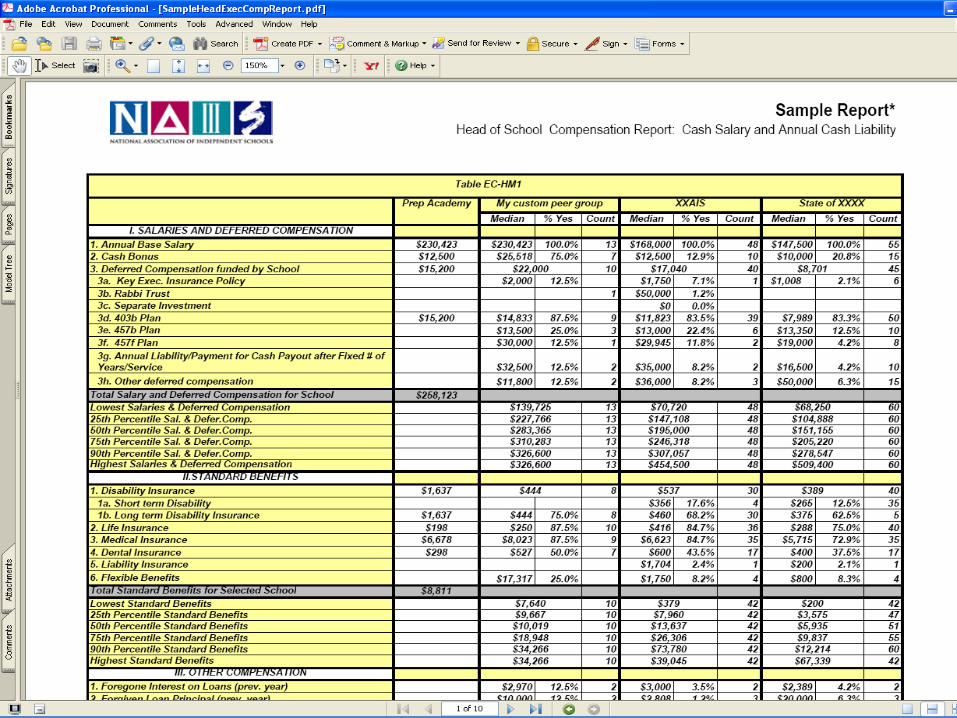
Fee-based, customized, 10-page reports available from NAIS
– Comparison groups include a customized peer group, by budget, endowment, association, state, and other groups


The End!