pilot of new approaches to estimate dietary exposure to ... · veterinary drug residues in food...
TRANSCRIPT

EVALUATION OF CERTAIN
VETERINARY DRUG
RESIDUES IN FOOD Seventy-eighth meeting of the
Joint FAO/WHO Expert Committee on
Food Additives
© World Health Organization 2014
Pilot of new approaches to estimate dietary exposure to veterinary drug residues
First draft prepared by
Rainer Reuss, Barton, ACT, Australia
Introduction
At its 70th meeting, the Committee identified a need for further work to refine chronic and acute
exposure assessments for veterinary drug residues in foods for integration into the decision-tree approach (TRS 954, 2012). The 18
th and 19
th Sessions of the Codex Committee on Residues of
Veterinary Drugs in Foods (CCRVDF), in response to the statement by JECFA, requested FAO and WHO to convene an expert consultation on exposure assessment methodologies for residues of veterinary drugs in foods (FAO/WHO, 2009; FAO/WHO 2011) to:
review the current model diet (so-called market basket approach) applied by JECFA:
consider possible simplification of the current model die;
investigate the possible development of several model diets to reflect regional differences in consumption patterns; and
develop approaches for acute and sub-chronic dietary exposure assessment.
FAO and WHO issued a call for data on consumption of foods of animal origin in 2010 (FAO/WHO, 2010) and received food consumption data from 47 countries and a submission from an interested party. Subsequently, an expert meeting on dietary exposure assessment of veterinary drug residues in foods took place at FAO in Rome from 7 to 11 November 2011, which included participation by the attendees at the 75
th meeting of JECFA. Opinions were also sought from an open
stakeholder meeting in Rome on 7 November 2011.
The report prepared by the experts on exposure assessment proposed new approaches for acute and chronic dietary exposure assessment for veterinary drug residues, taking the key findings, concerns and recommendations of the stakeholders into consideration. Discussions and exchanges between participants at both the meeting on dietary exposure assessment methodologies and the 75
th
JECFA provided some examples to compare the exposure models used by JECFA with the proposed new models for dietary exposure. These were further discussed, with the outcome that the final report of the expert consultation should be further considered at a future meeting of JECFA, with input from the CCRVDF (TRS 969, 2012).
The Report of the 75th JECFA noted that acute dietary exposure estimates should cover a
time-period of food consumption over a single meal (i.e. a single eating occasion) or 1 day and are intended to be used for comparison with acute reference dose (ARfD) values in a risk assessment process. The Committee emphasized that, depending on the health end-points for acute risk, acute exposure should be estimated for both the general population and children. The report of the Joint FAO/WHO Expert Meeting on Dietary Exposure Assessment Methodologies for Residues of Veterinary Drugs noted that JECFA had not, as of the date of the report, developed principles for acute dietary exposure assessments (FAO/WHO, 2011). The 75
th JECFA report also noted that
chronic dietary exposure estimates cover food consumption over the long term. Such estimates can be compared with a health-based guidance value based on chronic toxicity, such as an Acceptable Daily Intake (ADI), in a risk assessment process.
2
The 70th Meeting of the Committee confirmed that the median residue level from depletion studies
with a correction for marker residue to total residue (the Estimated Dietary Intake, or EDI) would continue to be used in chronic exposure assessments for long-term dietary exposure estimates, when supported by the available data (TRS 954, 2009). Only when median residue data are not available may the chronic exposure estimate be based on a calculation using the MRL with a correction for marker residue to total residue to calculate a Theoretical Maximum Daily Intake, or TMDI. It should also be noted that when data on bioavailability are available, a correction for bioavailability might also be used in the dietary exposure calculation (TRS 788, 1989).
The report of the Joint FAO/WHO Expert Meeting on Dietary Exposure Assessment Methodologies for Residues of Veterinary Drugs proposed models to estimate both acute and chronic exposure to residues of veterinary drugs in food: the Global Estimate of Acute Dietary Exposure (GEADE) and the Global Estimate of Chronic Dietary Exposure (GECDE). The 75
th JECFA noted that
the proposed models use more detailed consumption data than the EDI. It also noted that comments on the draft report of the expert meeting would be sought from participants of the 75
th meeting of the
Committee soon after the meeting and that, following consideration of these comments, a revised draft report would be prepared for public comments. The final report was discussed at the 20
th Session of
the CCRVDF. The expert report and comments from the CCRVDF would then be discussed at a future meeting of the Committee, at which time additional worked examples would be prepared using the GECDE and GEADE to provide more experience with their application.
Purpose
Following the outcomes and recommendations of the expert report, the 78th JECFA included a
pilot study on use of the GEACDE and GEADE. The purpose of the study was to explore the new calculations for dietary exposure assessment, compare them with estimates calculated using the model diet approach, identify the practical impact of using the new methods and make recommendations for dietary exposure assessment at future meetings. Dietary exposures were estimated for four veterinary drug residues using the model diet approach as well as the new methods for chronic and acute dietary exposure estimation.
The study is intended to pilot and explore the new calculations for dietary exposure assessment rather than forming part of the risk assessment per se. For example, acute exposures are calculated, even though ARfD have not been set for the chemicals included in the pilot study.
Background
Theoretical Maximum Daily Intake (TMDI)
The initial approach to estimating dietary exposure, the TMDI, was adopted at the 34th meeting of
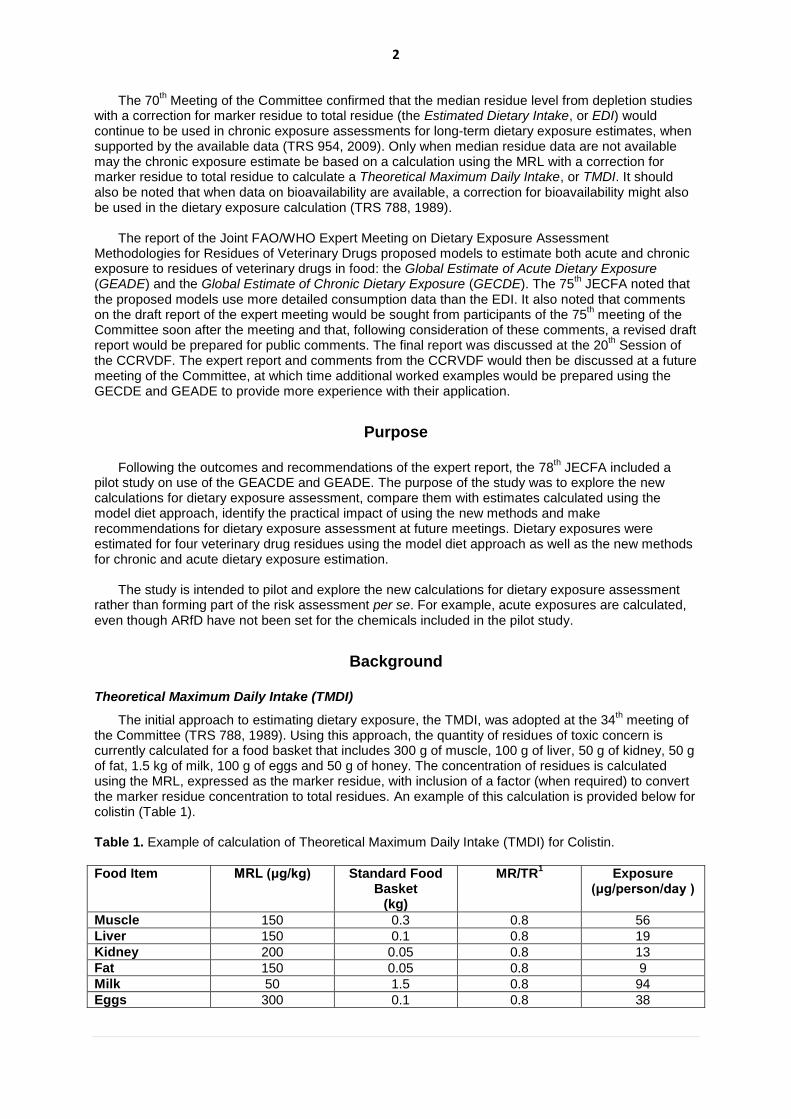
the Committee (TRS 788, 1989). Using this approach, the quantity of residues of toxic concern is currently calculated for a food basket that includes 300 g of muscle, 100 g of liver, 50 g of kidney, 50 g of fat, 1.5 kg of milk, 100 g of eggs and 50 g of honey. The concentration of residues is calculated using the MRL, expressed as the marker residue, with inclusion of a factor (when required) to convert the marker residue concentration to total residues. An example of this calculation is provided below for colistin (Table 1).
Table 1. Example of calculation of Theoretical Maximum Daily Intake (TMDI) for Colistin.
Food Item MRL (μg/kg) Standard Food Basket
(kg)
MR/TR1 Exposure
(μg/person/day )
Muscle 150 0.3 0.8 56
Liver 150 0.1 0.8 19
Kidney 200 0.05 0.8 13
Fat 150 0.05 0.8 9
Milk 50 1.5 0.8 94
Eggs 300 0.1 0.8 38

3
TMDI 229
ADI (upper bound) 420 1 MR = marker residue (parent drug); TR = total residues
The 66
th Meeting of the Committee concluded that the TMDI was no longer the most suitable
estimate of chronic exposure, because the MRL was a single concentration representing the estimated upper limit of a high percentile of the distribution of marker residue present in a given tissue of the treated animals (TRS 939, 2006). Therefore, the Committee decided to use the median of the residue distribution to substitute for the MRL in the exposure estimate. The new estimate of exposure is the EDI. Further considerations are in the report of the 70th meeting of the Committee in reply to comments submitted by the Committee for Medicinal Products for Veterinary Use (CVMP), European Medicines Agency (TRS 954, 2009).
Estimated Daily Intake (EDI)
The use of an extreme value of the distribution (the MRL) is not a realistic in a scenario describing chronic exposure. Instead, all concentrations of the distribution of residues should be considered. The median concentration is selected as representing the best point estimate of a central tendency over a prolonged period. Therefore, the EDI It is calculated using the same factors as the TMDI, but using the median residue concentration instead of the MRL. An example of the EDI calculation for colistin is provided in Table 2.
As noted by the 66th JECFA, the EDI should not be applied when there is concern for acute
toxicity or acute exposure (TRS 939, 2006). The use of the EDI is currently applicable only to the evaluation of chronic toxicity of, and chronic exposure to, residues as reflected by the ADI.
Table 2. Example of calculation of Estimated Daily Intake (EDI) for Colistin.
Food Item Median Residue (μg/kg)
Standard Food Basket
(kg)
MR/TR1 Estimated Daily
Intake (µg)
Muscle (turkey) 38 0.3 0.8 14.3
Liver (pig) 38 0.1 0.8 4.8
Kidney (rabbits) 145 0.05 0.8 9.1
Fat (rabbit) 82 0.05 0.8 5.1
Milk (cattle) 11 1.5 0.8 20.6
Eggs (chicken) 24 0.1 0.8 3.0
EDI 56.9
ADI (upper bound) 420 1 MR = marker residue (parent drug); TR = total residues
Concerns raised about the use of the model diet
The 19th Session of the CCRVDF (FAO/WHO, 2011) identified a number of concerns about the
EDI calculations, including: • consumers are unlikely to ingest large quantities of different animal products at the same time • the model diet was only suitable for evaluation of residues exhibiting chronic toxicity • the model diet did not reflect regional differences in diet • data are lacking on consumption of certain tissues, such as lung
These issues were considered in the development of the proposed new approaches in the Expert Report, but certain data deficiencies remain, such as data on consumption of certain tissues and data on regional diets (FAO/WHO, 2011).
New approaches for estimating drug residues: GEADE and GECDE
The Joint FAO/WHO Expert Meeting on Dietary Exposure Assessment Methodologies for Residues of Veterinary Drugs developed two new approaches for the calculation of potential dietary

4
exposure to residues of veterinary drugs in foods (FAO/WHO, 2011). The same general equation applies for both acute and chronic dietary exposure estimates, represented as:
The equation is applied to any food containing the residue.
GEADE: estimating acute exposure
The current approach to estimating exposure does not explicitly estimate acute exposure. However, the proposed new acute dietary exposure model, the Global Estimated Acute Dietary Exposure (GEADE), is an explicit estimate of acute exposure. The GEADE considers high-level exposure from each relevant food of animal origin individually. The concurrent occurrence of the selected high residue concentration in each food to which a consumer might be exposed (e.g. an MRL or high residue concentration derived from depletion studies, such as the upper one-sided 95% confidence limit over the 95
th percentile residue concentration) is combined with a high daily
consumption (97.5th percentile) of that food (meat, offal, milk, others). The 97.5
th percentile food
consumption amount (consumers only) was selected as being a more statistically robust value than the maximum food consumption amount because it represents an actual distribution of values. The GEADE is calculated as follows:
Unlike the EDI, estimates are derived for the children as well as for the general population,
following the principle that dietary exposure assessments should cover the whole population and should include children. When calculating the GEADE, instead of the amounts of food consumed set out in the model diet, more detailed estimates of consumption are used to calculate exposure.
For an acute dietary exposure assessment, an Acute Reference Dose (ARfD)1 must first be
established. The GEADE is used to calculate the percentage exposure of the ARfD it represents for each population. JECFA has made limited use of an approach to acute exposure based on an ARfD. The Committee has considered this approach primarily when:
there is a concern that residues of an injectable drug may remain in excess of the MRL at the injection site after the residues in normal muscle tissue are below the MRL
the residue concentrations at the injection site could pose a serious risk to consumers (TRS 893, 2000).
For example, in the case of the β-adrenoreceptor blocking agent carazolol, which is used as a
sedative for transport of pigs, the Committee noted that at 2 h following treatment, residues at the injection site could result in an exposure of 18 μg of parent carazolol, which is three times the ARfD. The Committee therefore advised that, unless appropriate measures could be taken to ensure that residues at the injection site do not result in residues exceeding the ARfD, use of carazolol prior to transport for slaughter is not consistent with the safe use of this drug (TRS 893, 2000).
GECDE: estimating chronic exposure
In chronic exposure assessment, consumption reflects the ongoing average (mean) and habitual high consumption of a food. In contrast, consumption derived for acute exposure reflects consumption at a single eating occasion. In addition to the general population, exposure is also estimated for children and infants using this method.
The Global Estimated Chronic Dietary Exposure (GECDE) uses median residues combined with two different types of consumption data to estimate chronic dietary exposure. Firstly, the highest
1 The ARfD has been defined as an “estimate of the amount of a substance in food or drinking water, expressed on a
bodyweight basis, that can be ingested over a short period of time, usually during one meal or one day, without appreciable health risk to the consumer on the basis of all the known facts at the time of the evaluation” (FAO, 1967)
5
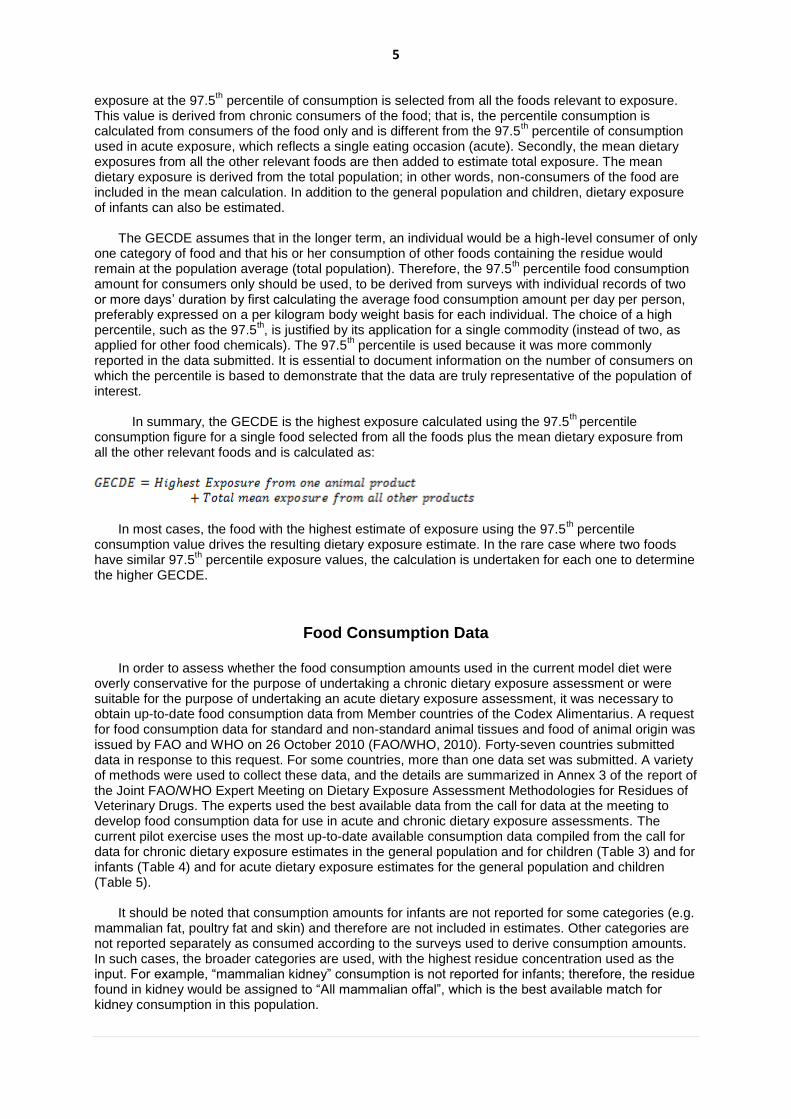
exposure at the 97.5th percentile of consumption is selected from all the foods relevant to exposure.
This value is derived from chronic consumers of the food; that is, the percentile consumption is calculated from consumers of the food only and is different from the 97.5
th percentile of consumption
used in acute exposure, which reflects a single eating occasion (acute). Secondly, the mean dietary exposures from all the other relevant foods are then added to estimate total exposure. The mean dietary exposure is derived from the total population; in other words, non-consumers of the food are included in the mean calculation. In addition to the general population and children, dietary exposure of infants can also be estimated.
The GECDE assumes that in the longer term, an individual would be a high-level consumer of only
one category of food and that his or her consumption of other foods containing the residue would remain at the population average (total population). Therefore, the 97.5
th percentile food consumption
amount for consumers only should be used, to be derived from surveys with individual records of two or more days’ duration by first calculating the average food consumption amount per day per person, preferably expressed on a per kilogram body weight basis for each individual. The choice of a high percentile, such as the 97.5
th, is justified by its application for a single commodity (instead of two, as
applied for other food chemicals). The 97.5th percentile is used because it was more commonly
reported in the data submitted. It is essential to document information on the number of consumers on which the percentile is based to demonstrate that the data are truly representative of the population of interest.
In summary, the GECDE is the highest exposure calculated using the 97.5
th percentile
consumption figure for a single food selected from all the foods plus the mean dietary exposure from all the other relevant foods and is calculated as:
In most cases, the food with the highest estimate of exposure using the 97.5
th percentile
consumption value drives the resulting dietary exposure estimate. In the rare case where two foods have similar 97.5
th percentile exposure values, the calculation is undertaken for each one to determine
the higher GECDE.
Food Consumption Data
In order to assess whether the food consumption amounts used in the current model diet were overly conservative for the purpose of undertaking a chronic dietary exposure assessment or were suitable for the purpose of undertaking an acute dietary exposure assessment, it was necessary to obtain up-to-date food consumption data from Member countries of the Codex Alimentarius. A request for food consumption data for standard and non-standard animal tissues and food of animal origin was issued by FAO and WHO on 26 October 2010 (FAO/WHO, 2010). Forty-seven countries submitted data in response to this request. For some countries, more than one data set was submitted. A variety of methods were used to collect these data, and the details are summarized in Annex 3 of the report of the Joint FAO/WHO Expert Meeting on Dietary Exposure Assessment Methodologies for Residues of Veterinary Drugs. The experts used the best available data from the call for data at the meeting to develop food consumption data for use in acute and chronic dietary exposure assessments. The current pilot exercise uses the most up-to-date available consumption data compiled from the call for data for chronic dietary exposure estimates in the general population and for children (Table 3) and for infants (Table 4) and for acute dietary exposure estimates for the general population and children (Table 5).
It should be noted that consumption amounts for infants are not reported for some categories (e.g.
mammalian fat, poultry fat and skin) and therefore are not included in estimates. Other categories are not reported separately as consumed according to the surveys used to derive consumption amounts. In such cases, the broader categories are used, with the highest residue concentration used as the input. For example, “mammalian kidney” consumption is not reported for infants; therefore, the residue found in kidney would be assigned to “All mammalian offal”, which is the best available match for kidney consumption in this population.

6
Food consumption data for acute exposure estimates
For acute exposure, the highest 97.5th percentile value for each food was selected from the data
submitted for the Expert Meeting or from the GEMS/Food large portion size database. Some of the submitted data were higher than values in the current GEMS/Food database (WHO, 2013), such as new data from China and Australia (FAO/WHO, 2011). When considering food consumption data for acute exposure estimates, one person-day data from surveys with individual records were considered by preference, as recommended in EHC 240 (FAO/WHO, 2009b). For example, for a survey of 2 days’ duration, days 1 and 2 were treated as separate records for each individual.
Food consumption data for chronic exposure estimates
When considering food consumption data for chronic dietary exposure assessments, the duration of the survey from which the food consumption data are derived should be taken into account. For chronic exposure estimates, it is preferable to use surveys of more than 1 day’s duration to represent “usual” consumption patterns so that the average food consumption is calculated per day for each individual in the survey over the number of days of the survey before the high percentile is derived from the distribution of food consumption values.
The range of distribution therefore tends to decrease towards the central measure the longer the duration of the survey. A 97.5
th percentile consumption from a 2-day survey will tend to be lower than
that derived from 1-day data and provides a better representation of high chronic consumption; that from a 7-day survey would tend to be lower again.
For exposure estimates based on broad food categories (e.g. muscle or milk) that are likely to be consumed daily by the majority of the population, survey duration is not such a critical issue. In a given population, the amounts of these foods consumed tend not to vary significantly from day to day, so the difference between food consumption estimates from 1 and 2 or more days of data is minimal.
Survey duration is much more important when considering foods that are consumed infrequently and in high amounts in some countries but only rarely in some others, such as liver and kidney, and it is significant to note that these commodities are more likely to contain higher concentrations of veterinary drug residues. For foods such as liver and kidney, the longer the duration of the survey in countries that consume them infrequently, the more consumers are identified, so that the proportion of the population consuming (% consumers) appears to increase. Conversely, the average amount that a consumer eats (g/day) appears to decline as the survey duration is extended. In this case, the proportion of the population consuming may be very small; this makes reliable estimates of long-term consumption of such commodities extremely difficult.
From the information submitted, the most comprehensive data sets for high food consumption values were for one person-day 97.5
th percentile food consumption values (e.g. GEMS/Food large
portion size database). However, some information was available on 97.5th percentile food
consumption from surveys of two or more days’ duration, where the amount of food consumed by each individual in the survey was averaged over the number of days of the survey before the 97.5
th
percentile for the population group of interest was derived. This latter type of data is more appropriate for use in chronic dietary exposure assessment.

7
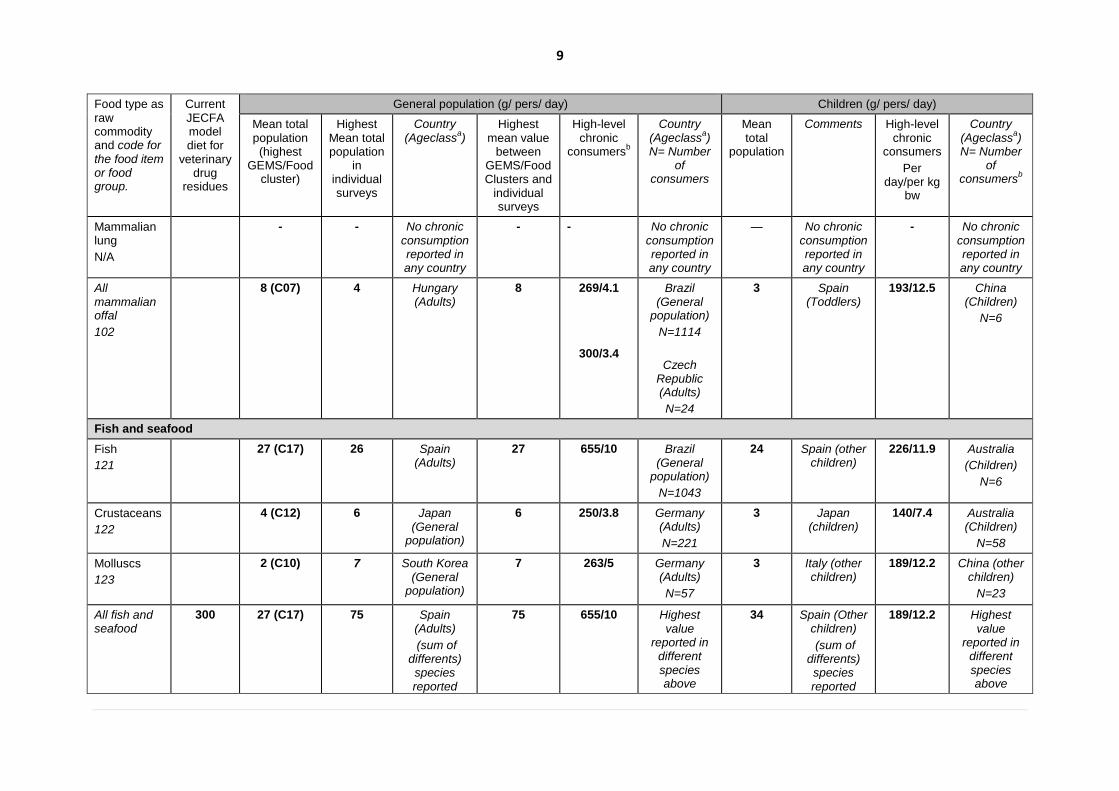
Table 3. Food consumption data for estimating chronic exposure to veterinary drugs residues for the general population and children.
Food type as raw commodity and code for the food item or food group.
Current JECFA model diet for
veterinary drug
residues
General population (g/ pers/ day) Children (g/ pers/ day)
Mean total population (highest
GEMS/Food cluster)
Highest Mean total population
in individual surveys
Country (Ageclass
a)
Highest mean value
between GEMS/Food Clusters and
individual surveys
High-level chronic
consumersb
Country (Ageclass
a)
N= Number of
consumers
Mean total
population
Comments High-level chronic
consumers
Per day/per kg
bw
Country (Ageclass
a)
N= Number of
consumersb
Mammalian muscle
Beef and other bovines MM 0812
47 (C07) 63 Brazil (General
population)
63 291/4.4 Brazil (General
population)
N=23,320
37 Italy (Other children)
159/6.1
100/7.5
Spain (other children)
N=155 Bulgaria
(toddlers)
Pork and other porcines
MM 0818
114 (C08) 58 Latvia (Adults)
114 415/6.3 Brazil (General
population)
N=2577
31 China (Children)
162/10.5 China (Children)
N=1703
Sheep and other ovines
MM 0822
21 (C17) 13 Ireland (Adults)
21 315/4.8 Brazil (General
population)
N=136
13 Greece (Other
children)
158/10.3 China (children)
N=119
Goat and other caprines
MM 0814
5 (C13) 1 Greece (Other
children)
5 315/4.8 Brazil (General
population)
N=194
1 Greece (Other
children)
67/3.5 Greece (Other
children)
N=23
Horse and other equines
MM 0816
3 (C02) 1 Italy (Elderly)
3 557/10 China (General
population)
N=66
2 Belgium (Toddlers)
478/31 China (Children)
N=7
Rabbit
MM 0819
2 (C08) 4 Italy (Very elderly)
4 309/3.6 Germany (Adults)
N=32
2 Italy (Other children)
149/8.5 Italy (Other children)
N=8
All 300 114 (C08) 100 Australia 114 415/6.3 Highest 62 Australia 478/31 Highest

8
Food type as raw commodity and code for the food item or food group.
Current JECFA model diet for
veterinary drug
residues
General population (g/ pers/ day) Children (g/ pers/ day)
Mean total population (highest
GEMS/Food cluster)
Highest Mean total population
in individual surveys
Country (Ageclass
a)
Highest mean value
between GEMS/Food Clusters and
individual surveys
High-level chronic
consumersb
Country (Ageclass
a)
N= Number of
consumers
Mean total
population
Comments High-level chronic
consumers
Per day/per kg
bw
Country (Ageclass
a)
N= Number of
consumersb
mammalian muscle
(General population)
(sum of different species reported above)
value reported in
different species above
(Children)
(sum of different species reported above)
value reported in
different species above
Mammalian trimmed fat, skin and added fat
Mammalian trimmed fat, skin and added fat excluding butter
81
50 14 (C07) 4.4 Czech Republic (Adults)
14 125/2.3 China (General
population)
N=164
1.7 Czech Republic (Other
children)
29/1.9 Bulgaria (Other
children)
N=31
Mammalian offal
Mammalian liver
MO 1281/1285
100 - 2 France (Very elderly)
2 237/3.6 Brazil (General
population)
N=20
3 Spain (Toddlers)
103/6.6 China (Children)
N=74
Mammalian kidney
MO 1280/1284
50 - 0.5 France (Elderly)
0.5 166/2.4 Czech Republic (Adults)
N=6
0.5 Czech Republic
(other children)
150/6 Czech Republic
(other children)
N=2
9
Food type as raw commodity and code for the food item or food group.
Current JECFA model diet for
veterinary drug
residues
General population (g/ pers/ day) Children (g/ pers/ day)
Mean total population (highest
GEMS/Food cluster)
Highest Mean total population
in individual surveys
Country (Ageclass
a)
Highest mean value
between GEMS/Food Clusters and
individual surveys
High-level chronic
consumersb
Country (Ageclass
a)
N= Number of
consumers
Mean total
population
Comments High-level chronic
consumers
Per day/per kg
bw
Country (Ageclass
a)
N= Number of
consumersb
Mammalian lung
N/A
- - No chronic consumption reported in any country
- - No chronic consumption reported in any country
— No chronic consumption reported in any country
- No chronic consumption reported in any country
All mammalian offal
102
8 (C07) 4 Hungary (Adults)
8 269/4.1
300/3.4
Brazil (General
population)
N=1114
Czech Republic (Adults)
N=24
3
Spain (Toddlers)
193/12.5 China (Children)
N=6
Fish and seafood
Fish
121
27 (C17) 26 Spain (Adults)
27 655/10 Brazil (General
population)
N=1043
24 Spain (other children)
226/11.9 Australia
(Children)
N=6
Crustaceans
122
4 (C12) 6 Japan (General
population)
6 250/3.8 Germany (Adults)
N=221
3 Japan (children)
140/7.4 Australia (Children)
N=58
Molluscs
123
2 (C10) 7 South Korea (General
population)
7 263/5 Germany (Adults)
N=57
3 Italy (other children)
189/12.2 China (other children)
N=23
All fish and seafood
300 27 (C17) 75 Spain (Adults)
(sum of differents) species reported
75 655/10 Highest value
reported in different species above
34 Spain (Other children)
(sum of differents) species reported
189/12.2 Highest value
reported in different species above

10
Food type as raw commodity and code for the food item or food group.
Current JECFA model diet for
veterinary drug
residues
General population (g/ pers/ day) Children (g/ pers/ day)
Mean total population (highest
GEMS/Food cluster)
Highest Mean total population
in individual surveys
Country (Ageclass
a)
Highest mean value
between GEMS/Food Clusters and
individual surveys
High-level chronic
consumersb
Country (Ageclass
a)
N= Number of
consumers
Mean total
population
Comments High-level chronic
consumers
Per day/per kg
bw
Country (Ageclass
a)
N= Number of
consumersb
above) above)
Poultry
Poultry muscle
101
300 118 (C04) 59 Australia (General
population)
118 352/6.7 South Korea (Adults)
N=1192
35 Spain (other children)
207/8.6 Czech Republic,
(other children)
N=177
Poultry fat and skin
82
50 1 (C12) 0.4 Hungary (Elderly)
1 23/0.4 Hungary (Adults)
N=28
0.05 France (other
children)
3/0.1 France (other
children)
N=33
Poultry offal
103
100 + 50 5 (C04) 2 Thailand (General
population)
5 188/3.6 Germany (Adults)
N=14
0.4 Bulgaria (other
children)
87/5.5 China (Children)
N=14
Eggs
Eggs (all)
110
100 42 (C11) 39 Japan (General
population)
42 169/3.1 South Korea (General
population)
N=4706
25 South Korea (children)
143/8.8 South Korea (children)
N=431
Milk
Milkc
90
1500 425 (C02) 1072 Australia (General
population)
1072 2917/77 Australia (General
population)
N=4487
809 Australia (Children)
1736/91 Australia (Children)
N=1463
Honey
Honey
11.5
50 3 (C17) 5 Germany (Elderly)
5 140/1.9 Belgium (Adults)
N=72
2 Czech Republic
(other children)
84/5.5 Spain, (other children)
N=29

11
a Toddlers: from 12 up to and including 35 months of age , Other children: from 36 months up to and including 9 years of age ,Children: from 2 up to and including 6 years of age, Adolescents: from
10 up to and including 17 years of age , Adults: from 18 up to and including 64 years of age , Elderly: from 65 up to and including 74 years of age b The high-level chronic consumption is assessed as the highest 97.5
th percentile in consumers only for surveys lasting at least 2 days among countries for which data were made available to
FAO/WHO c Includes whole liquid milk, secondary milk products (e.g. skimmed milk, evaporated milk, milk powders), derived milk products (e.g. cream, butter) and manufactured milk products (yoghurt, cheese,
ice cream).

12
Table 4. Food consumption data for estimating chronic exposure to veterinary drugs residues for infants.
Food type as raw commodity
(Food item/group code)
Infants
Mean total population (g/person per day)
Comments High-level chronic consumersc
(g/person per day) Comments
(Number of cons.)
Mammalian muscle
Beef and other bovines
(MM 0812)
2.5 Bulgaria
68/7.7 Bulgaria
(89)
Pork and other porcines
(MM 0818)
0.6 Italy
61.6 Bulgaria
(9)
Sheep and other ovines
(MM 0822)
0.8 Italy
22.7 Bulgaria
(2)
Goat and other caprines
(MM 0814)
- No consumption reported in any country
- No consumption reported in any country
Horse and other equines
(MM 0816)
- No consumption reported in any country
- No consumption reported in any country
Rabbit
(MM 0819)
0.08 Bulgariab
35.0 Bulgariab
(2)
All mammalian muscle 2.5 Highest value reported in different species above
68.0 Highest value reported in different species above

13
Food type as raw commodity
(Food item/group code)
Infants
Mean total population (g/person per day)
Comments High-level chronic consumersc
(g/person per day) Comments
(Number of cons.)
Mammalian trimmed fat, skin and added fat
Mammalian trimmed fat, skin and added fat excluding butter 81
- No consumption reported in any country
- No consumption reported in any country
Mammalian offal
Mammalian liver
MO 1281/1285
0.1 Bulgaria
31/3.7 Bulgaria
(7)
Mammalian kidney
MO 1280/1284
- No consumption reported in any country
- No consumption reported in any country
Mammalian lung - No consumption reported in any country
- No consumption reported in any country
All mammalian offal
102
0.1 Highest value reported in different species above
31/3.7 Bulgaria
Fish and seafood
Fish
121
1.3 Italy
32.5/4 Bulgaria
(8)
Crustaceans
122
- No consumption reported in any country
- No consumption reported in any country
Molluscs
123
- No consumption reported in any country
- No consumption reported in any country

14
Food type as raw commodity
(Food item/group code)
Infants
Mean total population (g/person per day)
Comments High-level chronic consumersc
(g/person per day) Comments
(Number of cons.)
All fish and seafood 1.3 Highest value reported in different species above
32.5/4 Highest value reported in different species above
Poultry
Poultry muscle
101
6.3 Bulgaria
77/8.9 Bulgaria
(184)
Poultry fat and skin
82
- No consumption reported in any country
- No consumption reported in any country
Poultry offal
103
0.05 Bulgaria
26/2.9 Bulgaria
(4)
Eggs
Eggs (all)
110
3.4 Bulgaria 28/3.2 Bulgaria
(314)
Milk
Milkd
90
317.7 Italy 1080.0/280 Italy
(7)
Honey
Honey
11.5
0.05 Bulgariab 20.0 Bulgaria
b
(8) a Infants: up to and including 11 months
b Chronic consumption reported only in one country
c The high-level chronic consumption is assessed as the highest 97.5
th percentile in consumers only for surveys lasting at least 2 days among countries for which data were made available to
FAO/WHO d Includes whole liquid milk, secondary milk products (e.g. skimmed milk, evaporated milk, milk powders), derived milk products (e.g. cream, butter) and manufactured milk products (yoghurt, cheese,
ice cream).

15
Table 5. Food consumption data for estimating acute exposure to veterinary drugs residues for the general population and children.
Food type as raw commodity
97.5th
percentile, general population, 1 day (g/person per
day)
97.5th
percentile, general population, 1 day (g/kg body weight per day)
97.5th
percentile, childrena,
1 day (g/person per day) 97.5
th percentile, children
a,
1 day (g/kg body weight per day)
Mammalian muscle
Beef and other bovines 514 (Australia) 10.7 (Bulgaria) 337 (Germany) 12 (Bulgaria)
Pork and other porcines
704 (Brazil) 13.3 (Poland) 312 (Poland) 22.0 (Belgium)
Sheep and other ovines
1000 (Slovakia) 11.1 (Slovakia) 311 (Denmark) 9.7 (Spain)
Goat and other caprines
479 (Brazil) 10.6 (Greece) 200 (Greece) 10.6 (Greece)
Horse and other equines
400 (France) 11.4 (France) 210 (Belgium) 15.0 (Belgium)
Rabbit 780 (Poland) 25.4 (Italy) 444 (Belgium) 25.4 (Italy)
All mammalian muscle 1000 (Slovakia) 25.4 (Italy) 337 (Germany) 25.4 (Italy)
Mammalian trimmed fat, skin and added fat
Mammalian trimmed fat, skin and added fat
258 (China) 4.8 (China) 73 (Poland) 2.6 (Poland)
Mammalian offal
Mammalian liver 439 (Ireland) 8.3 (Bulgaria) 165 (Italy) 9.1 (Thailand)
Mammalian kidney 360 (France) 12.9 (France) 300 (Czech Republic) 12.4 (Greece)
Mammalian lung 300 (China) 5.7 (China) 150 (China) 9.4 (China)
All mammalian offal 1000 (Poland) 16.3 (Poland) 300 (Czech Republic) 12.5 (Belgium)
Fish and seafood
Fish 2000 (Slovakia) 27.8 (Slovakia) 345 (Italy) 24.9 (Bulgaria)
Crustaceans 500 (Germany) 18.8 (Sweden) 248 (Netherlands) 11.1 (Netherlands)

16
Food type as raw commodity
97.5th
percentile, general population, 1 day (g/person per
day)
97.5th
percentile, general population, 1 day (g/kg body weight per day)
97.5th
percentile, childrena,
1 day (g/person per day) 97.5
th percentile, children
a,
1 day (g/kg body weight per day)
Molluscs 832 (Denmark) 19.7 (Greece) 481 (Italy) 19.7 (Greece)
All fish and seafood 2000 (Slovakia) 27.8 (Slovakia) 481 (Italy) 24.9 (Bulgaria)
Poultry
Poultry muscle 1120 (France) 15.4 (Czech Republic) 467 (Italy) 35.3 (Poland)
Poultry fat and skin 50 (Hungary) 0.9 (France) 20 (France) 1.0 (Thailand)
Poultry offal 389 (Brazil) 7.2 (Germany) 130 (France) 5.6 (Poland)
Eggs (all)
Eggs (all) 450 (Ireland) 7.3 (France) 196 (China) 12.1 (China)
Milk
Milk
3235 (Australia) 63.8 (Finland) 1551 (Australia) 107.2 (Finland)
Honey
Honey
194 (Brazil) 5.5 (Spain) 90 (Poland) 5.5 (Spain)
a Children age class for Australia, China and Thailand : from 2 up to and included 6 years of age, Children age class for others countries: from 1 up to and included 9 years of age,
17
Approach
Overall approach
Currently, for estimating chronic dietary exposures to veterinary drug residues in foods, JECFA uses the median of the residue depletion, when available, to derive the EDI. These calculations have been carried out as part of the standard work of the 78
th JECFA as well as for this pilot study to
compare to the GECDE. Where a median residue cannot be derived, the MRL may be substituted for the median residue to calculate the TMDI, as was the case with derquantel at the 78
th JECFA meeting.
Both the EDI and TMDI assume that the food consumption applies to a standard human with a body weight of 60 kg. This weight represents the average body weight of the whole population including adults, children, male and female. The model diet is also intended to also cover the consumption of all processed foods with these foods as ingredients. All muscle tissues are equivalent, so meat and fish consumed are considered as equivalent in the calculations.
As was discussed above, the GECDE and GEADE take a different approach. The GECDE and
GEADE given below differ from the EDI by having estimated specific dietary exposure for additional population groups (children aged 12 months and older and infants younger than 12 months) and by using more realistic global consumption amounts as inputs into the calculations. Consumption data used are based on surveys (see tables above) and have been expressed per person for the whole population estimates to be compared with the current approach, or per kilogram body weight, based on values reported in food consumption surveys. Instead of the set amounts of food in the model diet, more detailed food consumption data have been used where available. For example, muscle tissue has been differentiated by species, and finfish have been considered separately from molluscs and crustaceans.
As discussed above, The EDI is not suitable for estimating acute dietary exposure, which should be based on the highest probable exposure from a single commodity on a single day. In contrast, the GEADE is an explicit estimate that can be used to calculate acute dietary exposures. Estimates have been derived specifically for children as well as for the general population, following the principle that dietary exposure assessments should cover the whole population, including children. Only in the case of emamectin was a health-based guidance value (HBGV) available and the GEADE was expressed as a proportion of the ARfD.
Principles
The following guiding principles apply to all exposure assessments:
• Objectives must be clear before food consumption and concentration data are selected. • Different approaches should provide equivalent consumer protection. • The most appropriate data and method should be used. • International assessments should provide estimates that are equal to or lower than national
estimates.
• Assessments need to cover the general population as well as vulnerable groups.
Age groups
The GEADCE and GEADE have been used to estimate exposure for population groups other than the whole population. Ideally, dietary exposure assessments should cover the whole population and should also include relevant population sub-groups, such as young children, ‘at risk’ or target groups. Regardless of the method of dietary exposure assessment used, if dietary exposure of young children to the food chemical in question is estimated it will generally be reported separately from that of the whole population.
On a body weight basis, children have higher energy needs than adults because they are growing and developing and therefore they eat more food in relation to their size than adults. Children may have unusual eating patterns, ranging from picky and irregular eating, overeating, to disinhibited or binge eating (Lewinsohn et al 2005, Marcus and Kalarchian 2003), that may be particularly relevant when assessing exposure to some hazards. Very young children may eat a more limited range of foods than older children and adults, and therefore can be vulnerable to a hazard found in a particular

18
food they consume (Buck Louis et al., 2006). Children are unlikely to have higher dietary exposure per kilogram body weight than adults except when exposure occurs through a food or beverage not usually consumed by children (e.g. alcoholic beverages).
Model diets compared to individual records of consumption
The GECDE and GEADE shown below used a more detailed set of consumption data than the EDI. The use of appropriate food consumption data in dietary exposure assessments is obviously extremely important. Many methods can be used to collect food consumption data, with the type of food chemical and the purpose of the assessment determining the most appropriate source of data.
Where no consumption data for individuals are available, a model diet such as is used in the EDI
(also referred to as ‘simulated’ or ‘theoretical’ diets) may be constructed to represent a ‘typical’ diet for a given population group. The advantages of the model diet approach are that it:
• is cost effective; • can take different population sub-groups into account; • can take different chemical levels into account; and • is useful when limited data are available.
The disadvantages of the model diet approach are that:
• it is subject to error when many foods are involved; • the outcome is very dependent on assumptions made; and • it does not account for individual variation in consumption.
The best data for conducting dietary exposure estimates are food consumption data collected from
individuals, as is used in the new approach. Dietary exposure assessments using food consumption data for individuals may be necessary if the results of exposure assessments, using screening methods or model diets, are not conclusive or indicate that potential dietary exposure to a food chemical is likely to approach or exceed a HBGV.
Alternatively, they may be used in the first instance if the data are available and an accurate
estimate of dietary exposure is likely to be required. The usual dietary modelling approach involves the use of individual dietary records derived from national nutrition surveys. These individual consumption records may be used in a deterministic assessment, as typically occurs for agricultural and veterinary chemicals, or they can be used as inputs in semi or fully probabilistic techniques.
The advantages of using individual food consumption data are:
• dietary exposure for a wide range of food chemicals can be estimated if the consumption data are representative and comprehensive;
• a range of consumption amounts for each food/food group can be taken into account; • dietary exposures for different population sub-groups can be estimated, • dietary exposure of consumers at low and high points of the distribution can be assessed to
represent low or high consumers; and • scenarios of food chemical concentrations can be modelled to predict exposure under different
risk management options. The disadvantages of using individual food consumption data include:
• data collection is resource intensive; • their use is more time consuming than use of data from screening techniques and requires
more technical expertise; and
• some critical groups may not be adequately represented (e.g. very young children).

19
Duration of exposure – acute or chronic assessments?
GEADE or GECDE were used in dietary exposure assessments in the context of whether or not a
hazard presents a short term or long-term risk. A short-term risk is assessed using acute dietary exposure assessment techniques, while chronic dietary exposure assessment techniques are used to assess long-term risks. Each of these assessments presents challenges in the appropriate use of food chemical and food consumption data. Although there are different general approaches that are followed for acute compared to chronic assessments, the exact nature of the hazard being assessed determines the final dietary exposure assessment approach on a case-by-case basis.
Acute dietary exposure assessments
An estimate of acute dietary exposure is required for each food or commodity for which an MRL is proposed for those agricultural and veterinary chemicals where an ARfD has been established. Acute dietary exposure assessments are conducted for food chemicals that have toxic effects from short-term exposure (from one meal or over one day). In estimating acute dietary exposure, the aim is to generate a ‘worst case’ assessment that takes into account the potential occurrence of someone who eats a large amount of a food happening to also select food that has a high concentration of the chemical in question. Therefore, in a deterministic acute exposure assessment, a high consumption amount (typically the 97.5
th percentile) is multiplied by a high chemical concentration amount, where a
distribution of chemical concentrations is known. In some circumstances, a factor is also included to account for variability in the chemical concentration data set arising from lack of homogeneity in foods or due to small data sets being use. Although acute dietary exposure assessments generally focus on exposure from a single food, exposure from a range of dietary sources can be taken into account if this is relevant.
Chronic dietary exposure assessments
Chronic dietary exposure assessments are conducted for food chemicals that have toxicological effects from exposure over a long period. Because exposure over a long time is being assessed, it is not usually appropriate to select extremes of food chemical concentration data. Mean or median concentration data are most often used as, over a lifetime, people are most likely to consume an average concentration of a chemical in a food rather than continually be exposed to high levels of a chemical (FAO/WHO, 2009b). There may be assessments involving a subset of a population who have unusual eating patterns and who may select foods with persistent high chemical levels. For example, recreational fishers or indigenous peoples who regularly eat fish caught in a single area may have long-term high exposures to chemicals present in waters in that area.
For chronic dietary exposure assessment, it would be beneficial for long-term food consumption data to be used. Considerable care must be taken to use data that represent long-term food consumption patterns.
Estimating exposure to residues from foods derived from multiple species
When estimating exposure, it is necessary to consider the contribution of all foods to the total exposure that may be experienced by a population. For example, if a residue is contained in muscle meat of more than one species that both types of foods are potential contributors to exposure. This is the case with the EDI as well as the GEADE and GECDE.
The EDI calculation considers this by assigning worst-case median residues to the various foods
in the model diet. For each food commodity, the highest species-specific median residue value is used in the calculation. For example, the calculation of an EDI for the antimicrobial colistin (Table 2) uses the median residue for turkey muscle to assign to muscle meat, pig liver to assign to liver, rabbit kidney to assign to kidney and so on. It is important, when reporting the EDI, to identify the relevant species for each of the edible commodities used in the calculation.
The proposed new approaches follow a similar approach to the EDI calculations. For the chemicals piloted, exposure from multiple species did not emerge as an issue. Using colistin again to illustrate the approach, for mammalian offal the worst-case median residues found in pig liver would

20
be assigned to mammalian liver and the worst-case median residue in rabbit kidney would be mapped to mammalian kidney. However, in some cases, such as mammalian muscle meat, the exposure estimates may include residues from more than one species, say from cattle as well as poultry. It should be noted that for the GECDE there is only a single major contributor to exposure: the food that is the highest contributor to exposure using the chronic 97.5
th percentile of consumption. This makes it
unlikely that including additional foods in the exposure assessment would substantially increase chronic exposure estimates.
Pilot Study Results
In the tables below, exposure on a per person basis is given rounded to one decimal place. Exposures on a per kg bodyweight basis were rounded to two decimal places. Exposures expressed as %ADI or %ARfD were rounded to whole numbers.
Derquantel
Summary of TMDI
There were insufficient data to establish median residues for derquantel. Therefore, a TMDI was calculated using the MRLs set for liver, kidney, muscle and fat from sheep. Based on the established model diet, the TMDI was estimated to be 6.7 µg/person per day. This was equivalent to 38% of the upper bound of the ADI of 0–0.3 µg/kg bw per day.
Table 6. TMDI for derquantel based on MRLs in sheep tissues: 0.3 µg/kg in muscle, 0.4 µg/kg in kidney, 0.8 µg/kg in liver and 7.0 µg/kg in fat.
Exposure (TMDI)
TMDI, general population µg/person/day 6.7
ADI, general population %ADI/person/day 38
Assumptions for dietary exposure assessment
The following assumptions were used in dietary exposure estimates: • Residues are only found in sheep and other ovines. • Residues are found only in muscle, liver and kidney and fat. • For infants, all offal consumed is assumed to be worst case.
Inputs
The inputs for the dietary exposure assessment are given in Tables 7 and 8. The consumption figures used for estimating exposure to derquantel are given in tables (Tables 9 and 10).
Table 7. Reference values for derquantel exposure assessment.
LOAEL 0.1 mg/kg bw/d
Safety factor 300
ADI 0-0.3 µg/kg bw/d
21
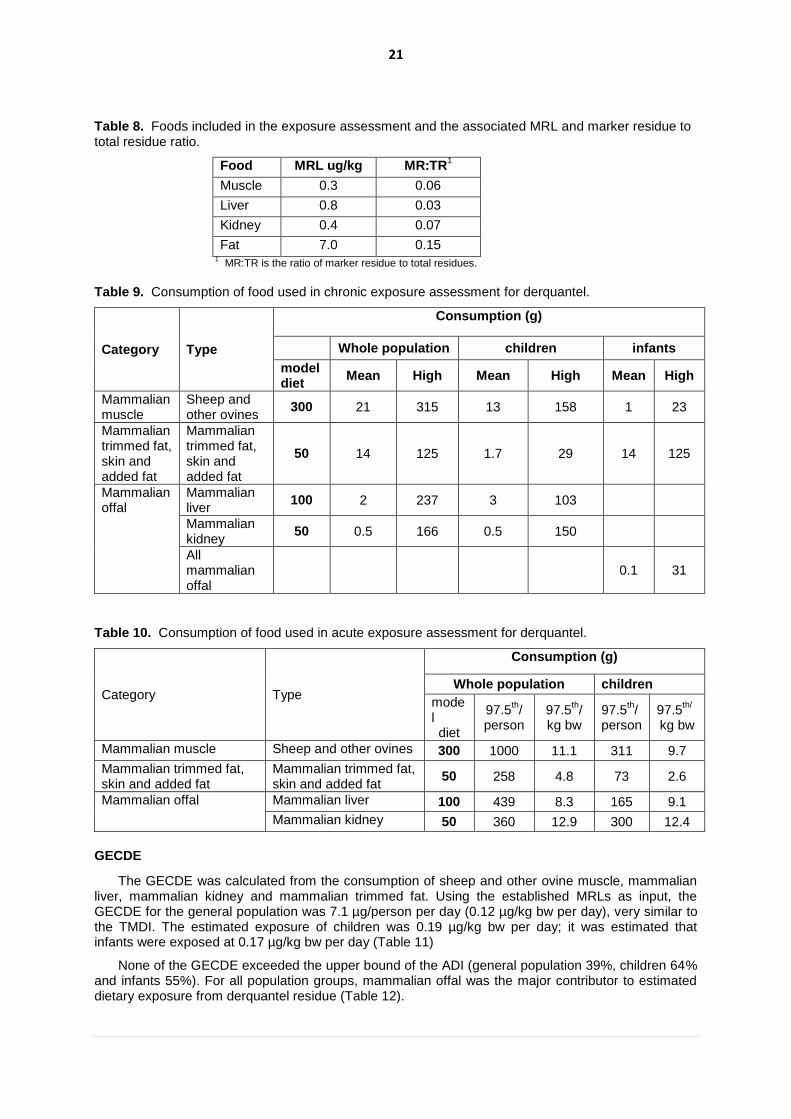
Table 8. Foods included in the exposure assessment and the associated MRL and marker residue to total residue ratio.
Food MRL ug/kg MR:TR1
Muscle 0.3 0.06
Liver 0.8 0.03
Kidney 0.4 0.07
Fat 7.0 0.15 1 MR:TR is the ratio of marker residue to total residues.
Table 9. Consumption of food used in chronic exposure assessment for derquantel.
Category Type
Consumption (g)
Whole population children infants
model diet
Mean High Mean High Mean High
Mammalian muscle
Sheep and other ovines
300 21 315 13 158 1 23
Mammalian trimmed fat, skin and added fat
Mammalian trimmed fat, skin and added fat
50 14 125 1.7 29 14 125
Mammalian offal
Mammalian liver
100 2 237 3 103
Mammalian kidney
50 0.5 166 0.5 150
All mammalian offal
0.1 31
Table 10. Consumption of food used in acute exposure assessment for derquantel.
Category Type
Consumption (g)
Whole population children
model diet
97.5th/
person 97.5
th/
kg bw 97.5
th/
person 97.5
th/
kg bw
Mammalian muscle Sheep and other ovines 300 1000 11.1 311 9.7
Mammalian trimmed fat, skin and added fat
Mammalian trimmed fat, skin and added fat
50 258 4.8 73 2.6
Mammalian offal Mammalian liver 100 439 8.3 165 9.1
Mammalian kidney 50 360 12.9 300 12.4
GECDE
The GECDE was calculated from the consumption of sheep and other ovine muscle, mammalian liver, mammalian kidney and mammalian trimmed fat. Using the established MRLs as input, the GECDE for the general population was 7.1 µg/person per day (0.12 µg/kg bw per day), very similar to the TMDI. The estimated exposure of children was 0.19 µg/kg bw per day; it was estimated that infants were exposed at 0.17 µg/kg bw per day (Table 11)
None of the GECDE exceeded the upper bound of the ADI (general population 39%, children 64% and infants 55%). For all population groups, mammalian offal was the major contributor to estimated dietary exposure from derquantel residue (Table 12).

22
Table 11. GECDE for the general population, children and infants based on the corrected MRL and an ADI of 0.3 µg/kg bodyweight/day for derquantel.
Population Bodyweight GECDE ADI
(kg) µg/person/day µg/kg bw/day (%)
General population 60 7.1 0.12 39
Children 15 2.9 0.19 64
Infants 5 0.8 0.17 55
Table 12. Exposure by food for the general population, children and infants (up to 11 months). The major contributors to exposure (based on high usual consumers at the 97.5
th percentile) are shown in
red.
Category Type Exposure µg/person/day
General population
Children Infants
Mammalian muscle Sheep and other ovines 0.1 0.1 <0.1
Mammalian offal Mammalian liver 6.3 2.7 N/A1
Mammalian offal Mammalian kidney <0.1 <0.1 N/A1
Mammalian offal All mammalian offal N/A1 N/A
1 0.8
Mammalian fat Mammalian trimmed fat 0.7 0.1 NC2
1 N/A = Not applicable, 2 NC =Not Consumed
GEADE
95th percentile residue data were not available for derquantel. Therefore, the GEADE was
calculated based on the same concentrations used for the TMDI and GECDE, i.e. the adjusted MRL.
Unlike chronic exposure estimates, fat is one of the major contributors to exposure in the general population. However, liver is still an equal contributor. For children, liver and fat are both major contributors to exposure, but the other tissues are also of importance (Table 13).
The GEADE for the general population was 0.58 µg/kg bw/day. For children, the GEADE was 0.48 µg/kg bw/day. As there is no ARfD established for derquantel, these numbers were not compared against reference values.
Table 13. Exposure based on 97.5th percentile consumption by food for the general population and
children. The major contributors to exposure are shown in red.
Category Type Exposure
General population
(µg/kg bw/day)
Children (µg/kg bw/day)
Mammalian muscle Sheep and other ovines 0.06 0.05
Mammalian offal Mammalian liver 0.22 0.24
Mammalian offal Mammalian kidney 0.07 0.07
Mammalian Fat Mammalian fat 0.22 0.12
TOTAL (GEADE) 0.58 0.48
Comparison to TMDI estimates
The TMDI calculations based on the model diet found that the MRL resulted in exposure estimates below the ADI. Similarly, the GECDE calculations found that exposure estimates were below the ADI for all population groups. Mammalian liver was the major contributor to chronic exposure. Fat was a major contributor to acute (GEADE) exposure in the general population, but the liver was also important when estimating overall acute exposure.

23
Emamectin benzoate
Summary of EDI
In this dietary exposure assessment, fish was the only contributor to dietary exposure. The EDI for emamectin benzoate was calculated based on median residues found in fish muscle. The estimated dietary exposure was 11.2 µg/person per day, which is equivalent to 37% of the upper bound of the ADI of 0–0.5 μg/kg bw per day (or 30 µg/person per day) (Table 14).
Table 14. EDI calculations for emamectin based on the median residue associated with the MRLs of 100 μg/kg in muscle and fillet (muscle with adhering skin) for salmon and trout.
Exposure (EDI)
EDI, general population µg/person/day 11
ADI, general population %ADI/person/day 37
Assumptions for dietary exposure assessment
The following assumptions were used in dietary exposure estimates: • Residues of emamectin are only found in finfish.
Inputs
The inputs for the dietary exposure assessment for emamectin are given in Tables 15-18.
Table 15. Reference values for emamectin exposure assessment.
NOEL 0.25 mg/kg bw/d
Safety factor 500
ADI 0-0.5 µg/kg bw/d
“ARfD” 10 µg/kg bw/d
Table 16. Foods included in the exposure assessment for emamectin and the associated MRL and marker residue to total residue ratio.
1
MR:TR is the ratio of marker residue to total residue.
Table 17. Consumption of food used in chronic exposure assessment for emamectin.
Category Type
Consumption (g)
whole population children infants
Model diet
Mean High Mean High Mean High
Fish and seafood
Fish 300 27 655 24 226 1.3 32.5
Food median µg/kg
95th
percentile µg/kg
MR:TR1
Muscle (Fish) 33.5 67.9 0.9

24
Table 18. Consumption of food used acute exposure assessment for emamectin.
Category Type
Consumption (g)
Whole population Children
model diet
97.5th/
person 97.5
th/
kg bw 97.5
th/
person 97.5
th/
kg bw
Fish and seafood Fish 300 2000 27.8 345 24.9
GECDE
Using the median residue and fish consumption as inputs, the GECDE for the general population was 24.2 µg/person per day (0.40 µg/kg bw per day), which is equivalent to 81% of the upper bound of the ADI. The higher exposure estimate compared with the EDI was due to the higher consumption of fish used in the GECDE, 10 g/kg bw per day (655 g/person), compared with 300 g of muscle (fish) per person used in the model diet. The consumption data for fish are based on 1043 consumers from a Brazilian nutrition survey and are considered a robust estimate of high-level chronic fish consumption. This estimate is considered conservative for the 97.5
th percentile of the global population (Table 19).
In children, the GECDE was 0.56 µg/kg bw per day, which represented 111% of the upper bound of the ADI. This estimate above the ADI was due to a consumption amount of fish (226 g) that was very similar to the model diet being combined with the lower body weight of the population group, resulting in a comparatively high exposure on a body weight basis. Exposure of infants was estimated to be lower, at 0.24 µg/kg bw per day, because fish consumption in infants is 10% of that in the model diet.
Table 19. Estimated chronic exposure (GECDE) to emamectin for the general population, children and infants based on the corrected MRL and an ADI of 0.5 µg/kg bodyweight/day.
Population Bodyweight GECDE ADI
kg µg/person/day µg/kg bw/day %
General population 60 24.2 0.40 81
Children 15 8.4 0.56 112
Infants 5 1.2 0.24 48
GEADE
The Committee derived an “ARfD”2 of 10 µg/kg bw for emamectin residues. Therefore, an
estimate of acute dietary exposure was carried out to characterize the risk of dietary exposure. The GEADE was calculated based on the 95
th percentile residues, adjusted for the marker to total residue
ratio. The GEADE for the general population was approximately 1.97 µg/kg bw per day. For children, the GEADE was approximately 1.77 µg/kg bw per day. For the general population, the GEADE represented 20% of the “ARfD”. For children, the acute dietary exposure estimate was 18% of the “ARfD” (Table 20).
2 The Committee developed an “ARfD” for emamectin benzoate solely for the purpose of this pilot study.

25
Table 20. GEADE for emamectin for the general population, children and infants, based on the MRL and proposed MRL adjusted for Marker/total ratio.
Population GEADE
µg/kg bw/day %ARfD
General population 1.97 20
Children 1.80 18
Comparison to EDI estimates
The calculations based on the model diet found that the median residue for emamectin resulted in exposure estimates below the ADI for the general population. Similarly, the GECDE calculations found that exposure estimates were below the ADI for the general population and for infants. However, the GECDE identified children as a population group that may experience high exposure to emamectin residues. This appears to a realistic estimate, in particular in those populations where fish consumption is high on a day-to-day basis. It should be noted that, while the consumption amounts appear reasonable, the assumptions that all fish consumed contains emamectin residues at the median concentration found in trials is highly protective of consumers as emamectin is only used (when required) in the production of some aquacultured species.
Lasalocid sodium
Summary of the EDI
The EDI for lasalocid residues was calculated from the median residues found in poultry muscle, liver, kidney and fat. Based on the established model diet, the dietary exposure to lasalocid expressed as the EDI was 80.0 µg/person per day. Dietary exposure was estimated to be 26.7% of the upper bound of the ADI of 0–5 µg/kg bw per day (Table 21).
Table 21. EDI calculations for lasalocid, based on the median residues associated with the MRLs for chicken tissues.
Exposure (EDI)
EDI, general population µg/person/day 80.0
ADI, general population %ADI/person/day 26.7
Assumptions for dietary exposure assessment
The following assumptions were used in dietary exposure estimates:
• Residues are only found in poultry. • Residues are found in muscle, liver and kidney, skin and fat. • All poultry offal is assumed to be liver (worst case scenario). • Following the approach set out in the monograph egg consumption was not included in the
exposure assessment.
Inputs
The inputs used in the dietary exposure assessment for lasalocid are given in Tables 22-25.
Table 22. Reference values for lasalocid exposure assessment.
NOAEL 0.5 mg/kg bw/d
Safety factor 100
ADI 0-5 µg/kg bw/d
26
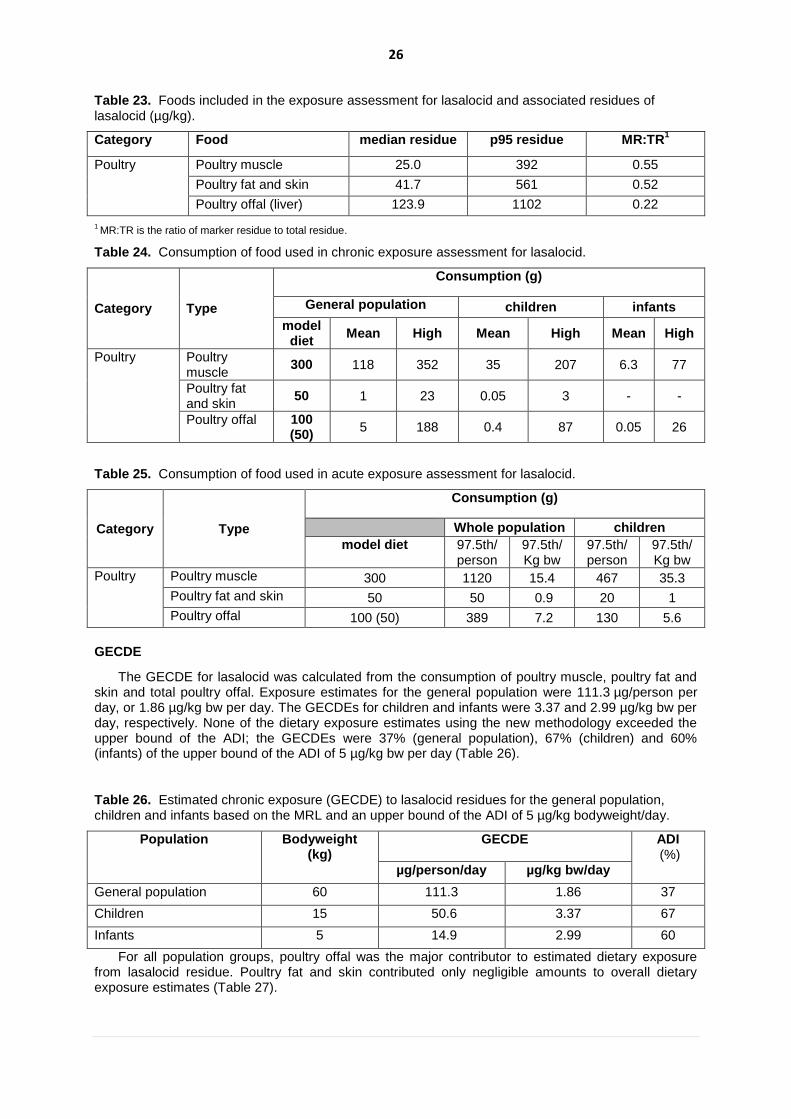
Table 23. Foods included in the exposure assessment for lasalocid and associated residues of lasalocid (µg/kg).
Category Food median residue p95 residue MR:TR1
Poultry Poultry muscle 25.0 392 0.55
Poultry fat and skin 41.7 561 0.52
Poultry offal (liver) 123.9 1102 0.22
1 MR:TR is the ratio of marker residue to total residue.
Table 24. Consumption of food used in chronic exposure assessment for lasalocid.
Category Type
Consumption (g)
General population children infants
model diet
Mean High Mean High Mean High
Poultry Poultry muscle
300 118 352 35 207 6.3 77
Poultry fat and skin
50 1 23 0.05 3 - -
Poultry offal 100 (50)
5 188 0.4 87 0.05 26
Table 25. Consumption of food used in acute exposure assessment for lasalocid.
Category Type
Consumption (g)
Whole population children
model diet 97.5th/ person
97.5th/ Kg bw
97.5th/ person
97.5th/ Kg bw
Poultry Poultry muscle 300 1120 15.4 467 35.3
Poultry fat and skin 50 50 0.9 20 1
Poultry offal 100 (50) 389 7.2 130 5.6
GECDE
The GECDE for lasalocid was calculated from the consumption of poultry muscle, poultry fat and skin and total poultry offal. Exposure estimates for the general population were 111.3 µg/person per day, or 1.86 µg/kg bw per day. The GECDEs for children and infants were 3.37 and 2.99 µg/kg bw per day, respectively. None of the dietary exposure estimates using the new methodology exceeded the upper bound of the ADI; the GECDEs were 37% (general population), 67% (children) and 60% (infants) of the upper bound of the ADI of 5 µg/kg bw per day (Table 26).
Table 26. Estimated chronic exposure (GECDE) to lasalocid residues for the general population, children and infants based on the MRL and an upper bound of the ADI of 5 µg/kg bodyweight/day.
Population Bodyweight (kg)
GECDE ADI (%)
µg/person/day µg/kg bw/day
General population 60 111.3 1.86 37
Children 15 50.6 3.37 67
Infants 5 14.9 2.99 60
For all population groups, poultry offal was the major contributor to estimated dietary exposure from lasalocid residue. Poultry fat and skin contributed only negligible amounts to overall dietary exposure estimates (Table 27).

27
Table 27. Estimated exposure of the general population, children and infants (up to 11 months)
to lasalocid residues from animal foods. The major contributors to exposure (based on high
usual consumers at the 97.5th
percentile) are shown in red.
Category Type Exposure µg/person/day
General population Children Infants
Poultry Poultry muscle 5.4 1.6 0.3
Poultry Poultry fat and skin 0.1 <0.1 NC1
Poultry Poultry offal 105.9 49.0 14.6 1 NC= Not consumed
GEADE
The GEADE for the general population was 39.00 µg/kg bw/day. For children, the GEADE was 42.67 µg/kg bw/day. As there is no ARfD, these numbers were not compared against reference values (Table 28). The GEADE was calculated based on the 95
th percentile of lasalocid residues. Like chronic
exposure estimates, poultry offal is the major contributor to estimated exposure in the general population and children. Muscle is also a major contributor for both populations.
Table 28. Estimated acute exposure to lasalocid by food for the general population and children. The major contributors to estimated exposure are shown in red.
Category Type
Exposure µg/kg bw/day
General population Children
Poultry Poultry muscle 7.97 18.27
Poultry Poultry fat and skin 0.75 0.83
Poultry Poultry offal 30.28 23.55
TOTAL (GEADE) 39.0 42.67
Comparison to EDI estimates
The calculations based on the model diet found that the median residues resulted in exposure estimates below the ADI. Similarly, the GECDE calculations found that exposure estimates were below the ADI for all population groups. However, GECDE were higher than the EDI, particularly for children and infants. Poultry offal was the major contributor to both chronic and acute exposure estimates.
Monepantel
Summary of EDI
The EDI for monepantel was calculated based on median residues found in muscle, liver, kidney and fat of sheep, determined after a 7-day withdrawal period. The estimated dietary exposure was 443 µg/person per day, which is equivalent to 37% of the upper bound of the ADI of 0–20 µg/kg bw per day (Table 29).
Table 29. Calculation of the EDI for monepantel based on the median residues associated with the MRLs for sheep tissues.
Exposure (EDI)
EDI, general population µg/person/day 443
ADI, general population %ADI/person/day 37
28
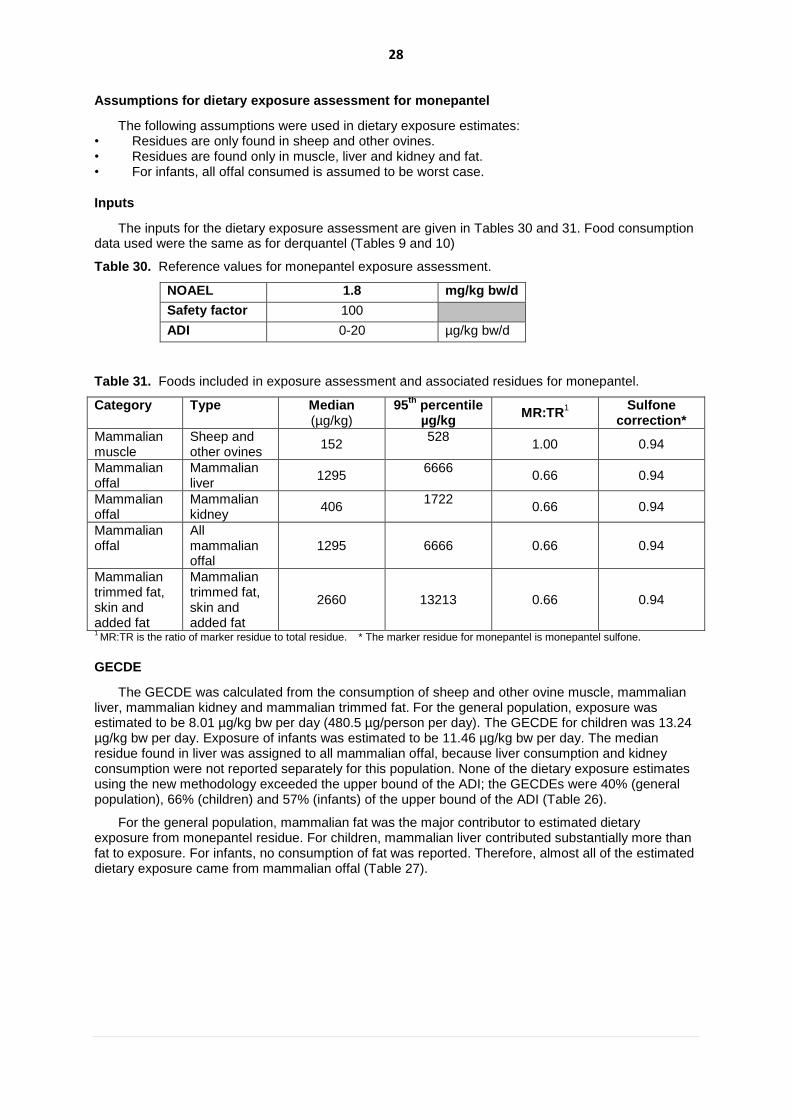
Assumptions for dietary exposure assessment for monepantel
The following assumptions were used in dietary exposure estimates: • Residues are only found in sheep and other ovines. • Residues are found only in muscle, liver and kidney and fat. • For infants, all offal consumed is assumed to be worst case.
Inputs
The inputs for the dietary exposure assessment are given in Tables 30 and 31. Food consumption data used were the same as for derquantel (Tables 9 and 10)
Table 30. Reference values for monepantel exposure assessment.
NOAEL 1.8 mg/kg bw/d
Safety factor 100
ADI 0-20 µg/kg bw/d
Table 31. Foods included in exposure assessment and associated residues for monepantel.
Category Type Median (µg/kg)
95th
percentile µg/kg
MR:TR1
Sulfone correction*
Mammalian muscle
Sheep and other ovines
152 528
1.00 0.94
Mammalian offal
Mammalian liver
1295 6666
0.66 0.94
Mammalian offal
Mammalian kidney
406 1722
0.66 0.94
Mammalian offal
All mammalian offal
1295 6666 0.66 0.94
Mammalian trimmed fat, skin and added fat
Mammalian trimmed fat, skin and added fat
2660 13213 0.66 0.94
1 MR:TR is the ratio of marker residue to total residue. * The marker residue for monepantel is monepantel sulfone.
GECDE
The GECDE was calculated from the consumption of sheep and other ovine muscle, mammalian liver, mammalian kidney and mammalian trimmed fat. For the general population, exposure was estimated to be 8.01 µg/kg bw per day (480.5 µg/person per day). The GECDE for children was 13.24 µg/kg bw per day. Exposure of infants was estimated to be 11.46 µg/kg bw per day. The median residue found in liver was assigned to all mammalian offal, because liver consumption and kidney consumption were not reported separately for this population. None of the dietary exposure estimates using the new methodology exceeded the upper bound of the ADI; the GECDEs were 40% (general population), 66% (children) and 57% (infants) of the upper bound of the ADI (Table 26).
For the general population, mammalian fat was the major contributor to estimated dietary exposure from monepantel residue. For children, mammalian liver contributed substantially more than fat to exposure. For infants, no consumption of fat was reported. Therefore, almost all of the estimated dietary exposure came from mammalian offal (Table 27).

29
Table 26. Chronic exposure (GECDE) to monepantel residue for the general population, children and infants, based on the Median Residue, and MRL and proposed MRL adjusted for Marker/Total residue ratio and correction factor for measurement as sulfone.
Population Bodyweight
(kg)
GECDE ADI (%) µg/person/day µg/kg bw/day
General population 60 480.5 8.01 40
Children 15 198.6 13.24 66
Infants 5 57 11.46 57
Table 27. Exposure to monepantel residues by food for the general population, children and infants (up to 11 months). The major contributors to exposure (based on high usual consumers at the 97.5
th
percentile) are shown in red.
Category Type Exposure µg/person/day
General population
Children Infants
Mammalian muscle Sheep and other ovines 3.0 1.9 0.1
Mammalian offal Mammalian liver 3.7 190.0 N/A1
Mammalian offal Mammalian kidney 0.3 0.3 N/A1
Mammalian offal All mammalian offal N/A1 N/A
1 57.2
Mammalian fat Mammalian trimmed fat 473.6 6.4 NC2
1 N/A = Not applicable, 2 NC =Not Consumed
GEADE
The GEADE for monepantel was calculated based on the 95th percentile of monepantel residues.
The GEADE for the 206.28 µg/kg bw/day. For children, the GEADE was 170.55 µg/kg bw/day. As there is no ARfD, these numbers were not compared against reference values (Table 28).
Like chronic exposure estimates, mammalian fat is the major contributor to exposure in the general population and mammalian liver is the main contributor in children, but both tissues are substantial contributors to acute dietary exposure estimates in both population groups (Table 28).
Table 28. Exposure based on 97.5th percentile consumption by food for the general population and
children. The major contributors to exposure are shown in red.
Category Type Exposure
General population
(µg/kg bw/day)
Children (µg/kg bw/day)
Mammalian muscle Sheep and other ovines 5.51 4.81
Mammalian offal Mammalian liver 78.80 86.40
Mammalian offal Mammalian kidney 31.64 30.41
Mammalian Fat Mammalian fat 90.33 48.93
TOTAL (GEADE) 206.28 170.55
Comparison to EDI estimates
The calculations for monepantel based on the model diet found that EDI resulted in exposure estimates of 37% of the ADI. The GECDE estimates were very close to the EDI, but it was shown that exposure was higher in children and infants, 66 and 571% of the ADI of 20 µg/kg bw/day. In summary, none of the chronic exposure estimates exceeded the ADI.
30
Outcomes, conclusions and further investigation
Outcomes
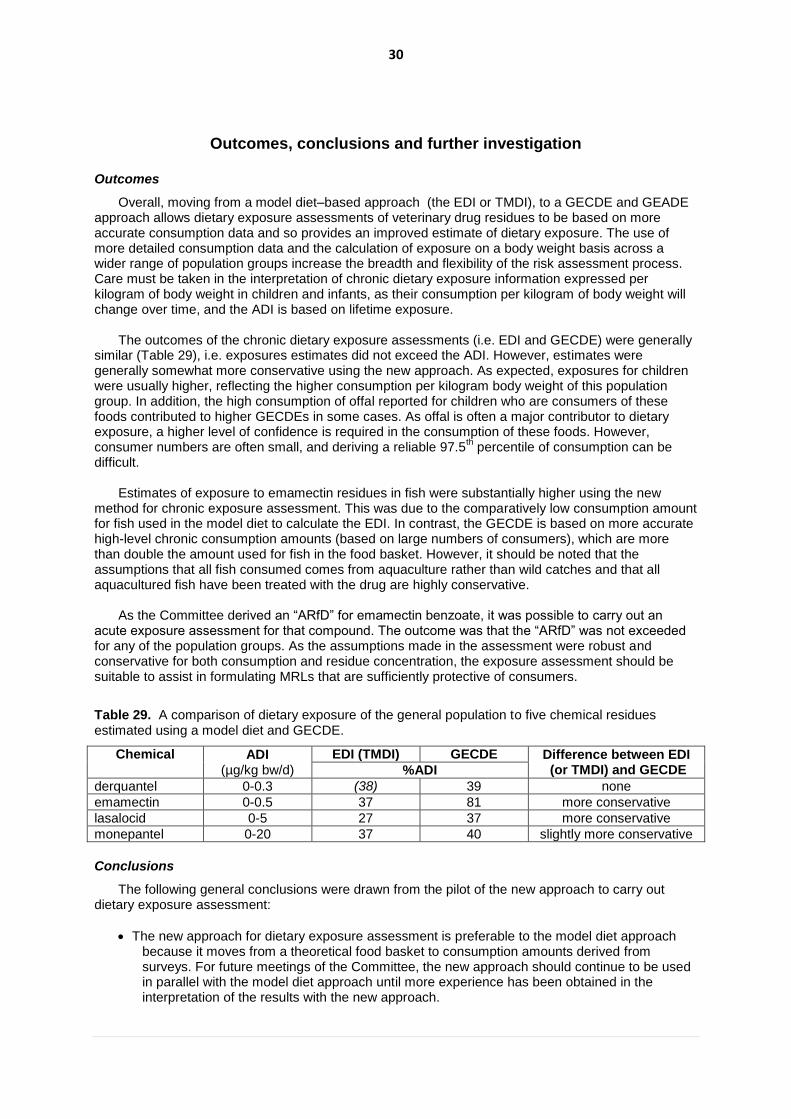
Overall, moving from a model diet–based approach (the EDI or TMDI), to a GECDE and GEADE approach allows dietary exposure assessments of veterinary drug residues to be based on more accurate consumption data and so provides an improved estimate of dietary exposure. The use of more detailed consumption data and the calculation of exposure on a body weight basis across a wider range of population groups increase the breadth and flexibility of the risk assessment process. Care must be taken in the interpretation of chronic dietary exposure information expressed per kilogram of body weight in children and infants, as their consumption per kilogram of body weight will change over time, and the ADI is based on lifetime exposure.
The outcomes of the chronic dietary exposure assessments (i.e. EDI and GECDE) were generally similar (Table 29), i.e. exposures estimates did not exceed the ADI. However, estimates were generally somewhat more conservative using the new approach. As expected, exposures for children were usually higher, reflecting the higher consumption per kilogram body weight of this population group. In addition, the high consumption of offal reported for children who are consumers of these foods contributed to higher GECDEs in some cases. As offal is often a major contributor to dietary exposure, a higher level of confidence is required in the consumption of these foods. However, consumer numbers are often small, and deriving a reliable 97.5
th percentile of consumption can be
difficult.
Estimates of exposure to emamectin residues in fish were substantially higher using the new method for chronic exposure assessment. This was due to the comparatively low consumption amount for fish used in the model diet to calculate the EDI. In contrast, the GECDE is based on more accurate high-level chronic consumption amounts (based on large numbers of consumers), which are more than double the amount used for fish in the food basket. However, it should be noted that the assumptions that all fish consumed comes from aquaculture rather than wild catches and that all aquacultured fish have been treated with the drug are highly conservative.
As the Committee derived an “ARfD” for emamectin benzoate, it was possible to carry out an acute exposure assessment for that compound. The outcome was that the “ARfD” was not exceeded for any of the population groups. As the assumptions made in the assessment were robust and conservative for both consumption and residue concentration, the exposure assessment should be suitable to assist in formulating MRLs that are sufficiently protective of consumers.
Table 29. A comparison of dietary exposure of the general population to five chemical residues estimated using a model diet and GECDE.
Chemical ADI (µg/kg bw/d)
EDI (TMDI) GECDE Difference between EDI (or TMDI) and GECDE %ADI
derquantel 0-0.3 (38) 39 none
emamectin 0-0.5 37 81 more conservative
lasalocid 0-5 27 37 more conservative
monepantel 0-20 37 40 slightly more conservative
Conclusions
The following general conclusions were drawn from the pilot of the new approach to carry out dietary exposure assessment:
The new approach for dietary exposure assessment is preferable to the model diet approach because it moves from a theoretical food basket to consumption amounts derived from surveys. For future meetings of the Committee, the new approach should continue to be used in parallel with the model diet approach until more experience has been obtained in the interpretation of the results with the new approach.

31
Like the EDI, the GECDE and GEADE rely on realistic and reliable median and 95th percentile
residue data in all foods that are contributors to exposure to a veterinary drug residue. It should be communicated to sponsors and Codex member states that such data form an essential part of the data package needed by the Committee to establish MRLs.
Global food consumption data change over time. The latest and best quality consumption data available should be used in all dietary exposure assessments.
Exposure can be estimated for population groups other than the general population, such as children and infants.
For future assessments, it would be better practice to express dietary exposure on a body weight basis rather than a per person basis to allow for easier comparison with the ADI across population groups. Care should be taken in interpreting the comparisons.
The GEADE approach is suitable for deriving an estimate of acute dietary exposure.
GECDE and GEADE use higher consumption amounts to calculate exposure to residues of veterinary drugs from fish. This would result in higher estimates of dietary exposure to veterinary drug residues in fish compared with the EDI.
In some categories, such as mammalian muscle, the exposure estimates following the new methodology may include residues from more than one species (e.g. from cattle as well as poultry). When estimating the GECDE, there is only a single major contributor to exposure: that food that is the highest contributor to exposure using the chronic 97.5
th percentile of
consumption. In most cases, this makes it unlikely that including additional foods in the exposure assessment would substantially increase chronic exposure estimates.
Areas for further investigation
A number of areas were identified that should be investigated further to improve dietary exposure assessment methodology of residues in veterinary chemicals. The Committee recommends that a working group should be set up to investigate the following:
The EDI, GECDE and GEADE assign residue concentrations to specific tissues. If, for example, the concentration of residues in liver is higher in pigs than in sheep, the higher level is used in the estimate. If later higher residue data are submitted to establish MRLs for additional species, the dietary exposure estimate (and consequently the MRL) that was derived previously may be affected. A process should be elaborated for assessing the need to re-evaluate MRLs.
Some veterinary drugs (e.g. emamectin benzoate) produce residues that are also found in plant-based agricultural commodities. There is a need to estimate total dietary exposure from all foods. The methods and data requirements for this need to be further explored.
Finfish, molluscs and crustaceans are different from most other animal products, as they are consumed from wild as well as aquaculture sources. When calculating the GECDE and GEADE, options should be investigated to obtain data from Member countries that would assist in estimating the proportion of farmed fish and other seafood in the food supply.
The highest contributor of dietary exposure to veterinary drug residues is typically the residues in organ meats (offal). Many of the data for these foods that underpin the GECDE and GEADE are based on small numbers of consumers. Guidance should be elaborated on the use of these figures.
References
FAO. 1967. Specifications for the identity and purity of food additives and their toxicological evaluation: some flavouring substances and non-nutritive sweetening agents (Eleventh report of the Joint FAO/WHO Expert Committee on Food Additives). FAO Nutrition Meetings Report Series, No. 44. Food and Agriculture Organization, Rome. FAO/WHO. 2009a. Report of the Eighteenth Session of the Codex Committee on Residues of Veterinary Drugs in Foods, Natal, Brazil, 11–15 May 2009. Rome, Italy, Food and Agriculture Organization of the United Nations, Joint FAO/WHO Food Standards Programme, Codex Alimentarius Commission, 2009 (ALINORM 09/32/31. Available at: http://www.codexalimentarius.net/web/archives.jsp?year=09)

32
FAO/WHO. 2009b. Principles and Methods for the Risk Assessment of Chemicals in Food, Environmental Health Criteria 240, a joint publication of the Food and Agriculture Organization of the United Nations and the World Health Organization, ISBN 978 92 4 157240 8, World Health Organization, Geneva. Available at: http://www.who.int/foodsafety/chem/principles/en/index1.html FAO/WHO. 2010. Request for data on dietary intake (consumption) of standard and non-standard animal tissues and food of animal origin (Issued 26 October 2010). Geneva, World Health Organization (http://www.who.int/foodsafety/chem/JECFA75.pdf). FAO/WHO. 2011. Report of the Nineteenth Session of the Codex Committee on Residues of Veterinary Drugs in Foods, Burlington, USA, 30 August – 3 September 2010. Rome, Italy, Food and Agriculture Organization of the United Nations, Joint FAO/WHO Food Standards Programme, Codex Alimentarius Commission, 2011 (REP11/RVDF. Available at: http://www.codexalimentarius.net/web/archives.jsp?year=11) FAO/WHO. 2011. Joint FAO/WHO Expert Meeting on Dietary Exposure Assessment Methodologies for Residues of Veterinary Drugs, Final Report including Report of Stakeholder Meeting, Rome, Italy, ISBN 978 92 4 156449 6. World Health Organization, Geneva; available at: http://www.who.int/foodsafety/chem/jecfa/FAO-WHO_exposure_report.pdf Lewinsohn, P., Holm-Denoma, J.M., Gau, J.M., Joiner, T.E., Streigel-Moore, R. & Bear, P., Lamoureux, B. 2005. Problematic eating and feeding behaviours of 36-month-old children. International Journal of Eating Disorders 38(3):208-219. Marcus M., & Kalarchian, M. 2003. Binge eating in children and adolescents. International Journal of Eating Disorders, 34: S47-S57. TRS 788. 1989. Evaluation of certain veterinary drug residues in food (Thirty-fourth report of the Joint FAO/WHO Expert Committee on Food Additives). WHO Technical Report Series, No. 788. World Health Organization, Geneva. Available at: http://www.who.int/foodsafety/chem/jecfa/publications/reports/en/index.html TRS 893. 2000. Evaluation of certain veterinary drug residues in food (Fifty-second report of the Joint FAO/WHO Expert Committee on Food Additives). WHO Technical Report Series, No. 893. World Health Organization, Geneva. Available at: http://www.who.int/foodsafety/chem/jecfa/publications/reports/en/index.html TRS 939. 2006. Evaluation of certain veterinary drug residues in food (Sixty-sixth report of the Joint FAO/WHO Expert Committee on Food Additives). WHO Technical Report Series, No. 939. World Health Organization, Geneva. Available at: http://www.who.int/foodsafety/chem/jecfa/publications/reports/en/index.html TRS 954. 2009. Evaluation of certain veterinary drug residues in food (Seventieth report of the Joint FAO/WHO Expert Committee on Food Additives). WHO Technical Report Series, No. 954. World Health Organization, Geneva. Available at: http://www.who.int/foodsafety/chem/jecfa/publications/reports/en/index.html TRS969. 2012. Evaluation of certain veterinary drug residues in food (Seventy-fifth report of the Joint FAO/WHO Expert Committee on Food Additives). WHO Technical Report Series, No. 969. World Health Organization, Geneva. Available at: http://www.who.int/foodsafety/chem/jecfa/publications/reports/en/index.html WHO. 2013. Global Environment Monitoring System - Food Contamination Monitoring and Assessment Programme (GEMS/Food), modified June 20, 2013; World Health Organization, Geneva.
Available at: http://www.who.int/foodsafety/chem/gems/en/