joint fao/who expert meeting on dietary exposure ... · on dietary exposure assessment...
TRANSCRIPT

Joint FAO/WHO Expert Meeting
on Dietary Exposure Assessment Methodologies for
Residues of Veterinary Drugs
Final
Report
including
Report of Stakeholder Meeting
7–11 November 2011
Rome, Italy
WHO Library Cataloguing-in-Publication Data
Joint FAO/WHO expert meeting on dietary exposure assessment methodologies for residues
of veterinary drugs: final report including report of stakeholder meeting.
1.Food contamination – analysis. 2.Drug residues – analysis. 3.Veterinary drugs – toxicity.
4.Veterinary drugs – adverse effects. 5. I.World Health Organization. II.Food and
Agriculture Organization of the United Nations.
ISBN 978 92 4 156449 6 (NLM classification: WA 701)
© World Health Organization 2012
All rights reserved. Publications of the World Health Organization are available on the WHO web site (www.who.int) or can be purchased from WHO Press, World Health Organization, 20 Avenue Appia, 1211 Geneva 27, Switzerland (tel.: +41 22 791 3264; fax: +41 22 791 4857; e-mail: [email protected]). Requests for permission to reproduce or translate WHO publications – whether for sale or for noncommercial distribution – should be addressed to WHO Press through the WHO web site (http://www.who.int/about/licensing/copyright_form/en/index.html).
The designations employed and the presentation of the material in this publication do not imply the expression of any opinion whatsoever on the part of the World Health Organization concerning the legal status of any country, territory, city or area or of its authorities, or concerning the delimitation of its frontiers or boundaries. Dotted lines on maps represent approximate border lines for which there may not yet be full agreement. The mention of specific companies or of certain manufacturers’ products does not imply that they are endorsed or recommended by the World Health Organization in preference to others of a similar nature that are not mentioned. Errors and omissions excepted, the names of proprietary products are distinguished by initial capital letters. All reasonable precautions have been taken by the World Health Organization to verify the information contained in this publication. However, the published material is being distributed without warranty of any kind, either expressed or implied. The responsibility for the interpretation and use of the material lies with the reader. In no event shall the World Health Organization be liable for damages arising from its use.

iii
Table of contents
List of acronyms and abbreviations ...........................................................................................v
1. Introduction ..........................................................................................................................1
1.1 Declarations of interest .................................................................................................2
2. Background ..........................................................................................................................3
2.1 Development of the current model diet ........................................................................3
2.2 Concerns raised about the use of the model diet ..........................................................5
3. Summary of food consumption data submitted ...................................................................7
4. Proposed approach to dietary exposure estimates for veterinary drug residues ..................9
4.1 General considerations .................................................................................................9
4.2 Acute dietary exposure assessments ...........................................................................10
4.3 Chronic dietary exposure assessments .......................................................................11
4.4 Data for use in acute dietary exposure assessments ...................................................13
4.5 Data for use in chronic dietary exposure assessments ...............................................15
5. Worked examples...............................................................................................................22
5.1 Triclabendazole ..........................................................................................................22
5.2 Monepantel .................................................................................................................23
5.3 Comparison of the approach for chronic dietary exposure assessment used by
JMPR with the current and proposed JECFA models ................................................23
5.4 Illustration of the proposed approach for chronic dietary exposure assessments
using the example of colistin ......................................................................................25
6. Limitations, assumptions and uncertainties in dietary exposure estimates for veterinary
drug residues ......................................................................................................................28
6.1 Food consumption data ..............................................................................................28
6.2 Residue data ...............................................................................................................30
6.3 Modelling methods .....................................................................................................31
6.4 Uncertainty analysis ...................................................................................................31
7. Discussion, conclusions and recommendations for further development ..........................32
7.1 Discussion and conclusions ........................................................................................32
7.2 Recommendations for further development ...............................................................33
7.2.1 Data requirements ............................................................................................33
7.2.2 Approaches for dietary exposure assessment ..................................................35
References ................................................................................................................................38
Glossary ...................................................................................................................................40
Annex 1: List of participants ...................................................................................................44
Annex 2: Report of FAO/WHO stakeholder meeting .............................................................45
Annex 3: Summary of food consumption data submitted, by country ...................................52

iv
Annex 4: Comparison between distributional approach and two models for chronic
dietary exposure estimates .......................................................................................58
Annex 5: Food consumption data for the general population aged 2+ years ..........................63
Annex 6: Food consumption data for children aged 2–6 years ...............................................70
Annex 7: Canadian proposal for simplification of the exposure assessment model ...............74

v
List of acronyms and abbreviations
ADI acceptable daily intake
ARfD acute reference dose
bw body weight
CCRVDF Codex Committee on Residues of Veterinary Drugs in Foods
EDI estimated daily intake
EFSA European Food Safety Authority
EHC Environmental Health Criteria monograph
FAO Food and Agriculture Organization of the United Nations
GEADE global estimated acute dietary exposure
GECDE global estimated chronic dietary exposure
GEMS/Food Global Environment Monitoring System – Food Contamination Monitoring
and Assessment Programme
IEDI international estimated daily intake
IPCS International Programme on Chemical Safety
JECFA Joint FAO/WHO Expert Committee on Food Additives
JMPR Joint FAO/WHO Meeting on Pesticide Residues
LOD limit of detection
LOQ limit of quantification
MRL maximum residue limit
STMR supervised trials median residue
TMDI theoretical maximum daily intake
USA United States of America
WHO World Health Organization
1
1. Introduction
At the seventieth meeting of the Joint FAO/WHO Expert Committee on Food Additives
(JECFA), the Committee discussed a hypothesis-driven decision-tree approach for the safety
evaluation of residues of veterinary drugs in foods (FAO/WHO, 2009a). This approach had
been developed by a small working group, in response to recommendations of the sixty-sixth
JECFA (FAO/WHO, 2006b), and considered the output of a workshop on maximum residue
limits (MRLs) in pesticides and veterinary drugs (FAO/WHO, 2006a). As part of the
discussion, the Committee identified that further work was required on approaches for
exposure assessments for veterinary drug residues in foods, in particular for chronic and acute
exposures, for integration into the decision-tree approach.
At its Nineteenth Session in Burlington, Vermont, United States of America (USA), held
from 30 August to 3 September 2010, the Codex Committee on Residues of Veterinary Drugs
in Foods (CCRVDF) requested that FAO and WHO convene an expert consultation on
exposure assessment methodologies for residues of veterinary drugs in foods (FAO/WHO,
2010a). This request was a reiteration of the request made at the Eighteenth Session of
CCRVDF (FAO/WHO, 2009b). CCRVDF requested that FAO and WHO address the
following:
• review of the current “model diet” (also called the “market basket” or “food basket”
approach) applied by JECFA;
• possible simplification of the current model diet;
• possible development of several model diets to reflect regional differences in
consumption patterns; and
• development of approaches for acute and subchronic1 dietary exposure assessment.
To help address this need for updated methodology, FAO and WHO issued a call for data on
the consumption of foods of animal origin (FAO/WHO, 2010b). To provide an opportunity
for stakeholders and interested parties to present their views, FAO and WHO held an open
stakeholder meeting in Rome on 7 November 2011. The stakeholder meeting was attended by
members of a meeting of experts convened to review and update the principles and
methodology to assess dietary exposure to residues of veterinary drugs, held in Rome from 7
to 11 November 2011 (see list of participants in Annex 1), as well as participants at the
seventy-fifth meeting of JECFA (see Attachment 2 of Annex 2). The key findings, concerns
and recommendations presented by the stakeholders with respect to potential changes to the
way in which dietary exposure assessments are currently conducted by JECFA (see Annex 2)
were provided to the participants of the meeting of experts to be considered in their
discussions. It should be noted that the methods proposed by the meeting of experts were not
presented at the stakeholder meeting.
The key objectives of the meeting of experts were twofold:
1) to summarize data recently submitted to FAO and WHO on the consumption of food
products derived from animal sources and to compare these data with the existing levels
1 For the purposes of this report, subchronic and chronic exposures are included together under the term
“chronic exposure”.

2
of food consumption in the model diet currently used by JECFA to estimate dietary
exposure to veterinary drug residues; and
2) to outline a proposed new approach for estimating dietary exposure to veterinary drug
residues for consideration by JECFA that is consistent with approaches to dietary
exposure assessments used in risk assessments at an international level for other food
chemicals and is appropriate for use in acute and chronic dietary exposure assessments
for veterinary drug residues.
The exploration of new approaches to the assessment of dietary exposure to veterinary drug
residues is part of the ongoing process of ensuring that evaluations undertaken by JECFA
incorporate recent advances in methodology and scientific knowledge. This report proposes a
new approach to dietary exposure assessment for veterinary drug residues and is not intended
to describe the full process for deriving MRLs for veterinary drug residues.
1.1 Declarations of interest
The experts completed the standard WHO form for declaration of interests prior to the
meeting. At the start of the meeting, all participants were asked to confirm their interests and
to provide any additional information relevant to the subject matter of the meeting. All
experts were reimbursed for their travel expenses by FAO. Dr Baines is part of the regulatory
process to establish food standards for veterinary drugs for Australia and New Zealand.
Similarly, Dr Edwards and Dr Friedlander contribute to the food chemical risk assessment for
the United States Food and Drug Administration. Dr Tennant, Dr Leclercq and Dr Dutra
Caldas declared no potentially conflicting interests relevant to the subject matter of the
meeting. It was therefore determined that there were no actual or potential conflicts of
interest, among any of the participants, of relevance to the subject of the meeting.
3
2. Background
The first meeting of JECFA devoted exclusively to veterinary drugs was held in 1987 (the
thirty-second meeting of JECFA), one of the specific tasks of the Committee being to
establish principles for evaluating the safety of residues of veterinary drugs in food
(FAO/WHO, 1988).
A chemical risk assessment is usually defined as the likelihood of an adverse health effect
occurring given a characterization of the potential adverse health effects and the human
exposure to the chemical hazard. The principles and methods for the risk assessment of
chemicals in food are described in a recent FAO/WHO monograph (FAO/WHO, 2009c). By
convention, the risk assessment process for food chemicals has been divided into four steps:
1) hazard identification; 2) hazard characterization/dose–response assessment; 3) exposure
assessment; and 4) risk characterization.
The first two steps lead to the identification of a health-based guidance value that establishes
the maximum level of exposure that is acceptable for a particular food chemical; examples
include the upper bound of an acceptable daily intake (ADI) and an acute reference dose
(ARfD). The health-based guidance value for veterinary drug residues traditionally
established by the Committee is the ADI: the estimated amount of a substance in food or
drinking-water, expressed on a body weight basis, that can be consumed every day for a
lifetime by humans without presenting an appreciable risk to their health (FAO/WHO,
2009c). On rare occasions, the Committee has established ARfDs for veterinary drug
residues.
The third step of the risk assessment process as applied to veterinary drug residues is to
assess exposure to veterinary drug residues from the diet, undertaken by combining food
consumption data with residue data. The resultant estimated dietary exposure can then be
compared with the relevant health-based guidance value in the fourth step of risk assessment,
the risk characterization step.
2.1 Development of the current model diet
JECFA developed a model diet (or standard food basket) for use in dietary exposure assess-
ments for veterinary drug residues. The model diet was intended to provide a conservative
estimate of dietary exposure. Initially (at the thirty-second meeting), the Committee used a
model diet of 500 g of meat for the purposes of assessing dietary exposure to veterinary drug
residues (FAO/WHO, 1988). At the thirty-fourth meeting of JECFA, the diet was revised to
include amounts of other raw commodities, such as offal, fish, eggs and milk. The 500 g meat
was divided into 300 g muscle, 100 g liver, 50 g kidney and 50 g tissue fat; and 100 g egg
and 1.5 litres of milk were added (FAO/WHO, 1989). At later meetings, honey was added to
the model diet, and fish muscle with skin in natural proportions was identified as an
alternative to meat. The food consumption amounts, assumed to be consumed daily by a 60
kg person, were chosen from available information to represent the upper limit of the range of
consumption for individual edible tissues and animal products (including processed foods
with animal products as ingredients) eaten daily over a lifetime (i.e. chronic exposure).

4
Hence, it was assumed that the same diet could be used to cover both potential acute (short-
term) exposure as well as chronic (long-term) exposure.
The model diet was reviewed at the fortieth meeting of JECFA (FAO/WHO, 1993), the
Committee noting that the type of food consumption data used to derive the model diet had
been derived from different sources, such as food balance sheet data and dietary survey data,
which were not directly comparable. The Committee reaffirmed the position of the thirty-
fourth meeting (FAO/WHO, 1989) that the food consumption values in the model diet were
adequately conservative.
Dietary exposure estimates based on the model diet were considered conservative because it
was assumed that the food consumption amounts were maximum values, that all animals used
as food were treated with the veterinary drug and that all foods produced from these animals
contained the drug residue at a given concentration. For the purposes of chronic dietary
exposure assessment, it was also assumed that these food amounts were consumed daily over
a lifetime. Initially, the residue concentration used in the dietary exposure assessment by the
Committee was the MRL for each commodity in the model diet, with a correction for the
ratio of the concentration of the marker residue to that of the total residue. The resultant
dietary exposure estimate was termed the theoretical maximum daily intake (TMDI). The
MRL is derived from depletion studies when sufficient data are available to establish a
depletion curve for a specific tissue. It is defined as a point concentration of the marker
residue on the residue depletion curve describing the upper one-sided 95% confidence limit
over the 95th percentile (FAO/WHO, 2009c), with all appropriate tissue MRLs based on the
same time point (the time of slaughter consistent with good practice in the use of veterinary
drugs, i.e. the withdrawal time). In a limited number of instances, where insufficient
quantifiable values (i.e. fewer than four values) were available to derive an MRL using this
approach, alternative, more approximate methods were used. If the TMDI exceeded the ADI,
the MRL was readjusted to ensure that the TMDI remained at or below the ADI.
The calculation of a TMDI for colistin (ADI = 0–420 µg/person) is given as an example in
Table 1.
Table 1. Example calculation of a TMDI: colistin
Food MRL (µg/kg)a Consumption value (kg/person per day) Marker/totalb
Dietary exposure (µg/person per day)
Muscle 150 0.3 0.8 56
Liver 150 0.1 0.8 19
Kidney 200 0.05 0.8 13
Fat 150 0.05 0.8 9
Milk 50 1.5 0.8 94
Eggs 300 0.1 0.8 38
TMDI 229
ADI (upper bound) 420 a The MRLs for all target tissues and eggs were based on twice the limit of quantification of the analytical method. The tissue
MRLs were the same for all species. b The colistin residues were measured by a microbiological method that does not report all relevant residues. As the marker
residue colistin A + B represents approximately 80% of the microbiologically active residues, the marker/total ratio of 0.8 is incorporated into the calculation of dietary exposure estimates to ensure that they correctly reflect residues of microbiological concern.

5
The use of the median residue concentration, instead of the MRL, was introduced at the sixty-
sixth meeting of JECFA (FAO/WHO, 2006b). During that meeting, the Committee agreed
that the median concentration represents the best point estimate of a central tendency over a
prolonged period of time because the concentration of residues in a given tissue consumed
varies from day to day, as reflected in the distribution. At the seventieth meeting of JECFA
(FAO/WHO, 2009a), the Committee reaffirmed the use of the median residue concentration
from depletion studies, with a correction for marker/total residues, for chronic dietary expo-
sure estimates; the resultant dietary exposure estimate using the median residue concentration
is termed the estimated daily intake (EDI). During the Expert Meeting, the experts recognized
that the distribution of residues is unlikely to be normal, but agreed to use the median residue
concentration to estimate long-term dietary exposure. The use of the median residue con-
centration was restricted to chronic dietary exposure estimation and where there were
adequate data.
The experts noted that a recent European Food Safety Authority (EFSA) document on
handling concentration data below the limit of detection (LOD) in dietary exposure assess-
ment recommends estimating both the lower bound (non-detects replaced by 0) and the upper
bound (non-detects replaced by the LOD). If the discrepancy between the two values is
significant, EFSA recommends that both of them be reported (EFSA, 2010). However, results
below the LOD or limit of quantification (LOQ) are typically assigned a value of one half of
the respective limit when calculating the median residue concentration.
The EDI calculation, where “muscle” refers to either meat or fish, is as follows:
EDI = (300 g × median residuemuscle) + (100 g × median residueliver) + (50 g × median residuekidney) +
(50 g × median residuefat) + (100 g × median residueeggs) + (1500 g × median residuemilk) + (50 g × median residuehoney)
The calculation of an EDI for the antimicrobial colistin (ADI = 0–420 µg/person) is given as
an example in Table 2. As the median residue value for an edible commodity such as muscle
may vary between different food-producing species, it is important, when reporting, to
identify the relevant species for each of the edible commodities. For each food commodity,
the highest species-specific median residue value is used in the calculation.
At the seventieth meeting of JECFA (FAO/WHO, 2009a), it was again noted that the use of
the EDI was applicable only to chronic dietary exposure assessments. JECFA to date has not
developed principles for acute dietary exposure assessments.
2.2 Concerns raised about the use of the model diet
One of the major concerns raised about the use of the model diet has been that it is overly
conservative for a chronic dietary exposure assessment.
At the Nineteenth Session of CCRVDF (FAO/WHO, 2010a), a report from a working group
(led by France) that was tasked with consideration of all relevant factors in the MRL setting
process noted that consumers are not likely to be ingesting high amounts of different animal
products simultaneously. Hence, a limited number of target tissues consumed in large
amounts may be used for a model diet. One suggested option was to consider a modified
model diet of “one meat + two eggs + milk + honey”, an approach currently used in the USA,
which could be used without changing the foods listed in the present standard model diet. It
was also noted that the EDI was applicable only for substances exhibiting chronic toxicity.

6
Table 2. Example calculation of an EDI: colistina
Food Median residue
(µg/kg)b Consumption value (kg/person per day) Marker/totalc
Dietary exposure (µg/person per day)
Muscle (turkey) 38 0.3 0.8 14.3
Liver (pigs) 38 0.1 0.8 4.8
Kidney (rabbits) 145 0.05 0.8 9.1
Fat (rabbits) 82 0.05 0.8 5.1
Milk (cattle) 11 1.5 0.8 20.6
Eggs (chickens) 24 0.1 0.8 3.0
EDI 56.9
ADI (upper bound) 420 a It should be noted that this example was selected because data were available from a recent JECFA evaluation, even
though the ADI for colistin was based on an acute end-point. The goal of the exercise was to compare the outcomes of different approaches to estimating dietary exposure with the ADI, not to discuss the hazard characterization.
b In this example, the median values for each target tissue and eggs were taken from the species with the highest tissue-specific median residue value.
C The colistin residues were measured by a microbiological method that does not report all relevant residues. As the marker residue colistin A + B represents approximately 80% of the microbiologically active residues, the marker/total ratio of 0.8 is incorporated into the calculation of the dietary exposure estimates to ensure that they correctly reflect residues of micro-biological concern.
This working group did consider as an option the use of regional diets for chronic dietary
exposure assessment, as put forth by CCRVDF for consideration by the FAO/WHO Expert
Meeting (FAO/WHO, 2010a), but in the end proposed an alternative approach.
During its discussions of the β-agonist ractopamine, a veterinary drug that may be found in
lung as well as other tissues, the Nineteenth Session of CCRDVF also noted that data on
consumption of lung tissues were lacking in the model diet (FAO, 2010; FAO/WHO, 2010a).
It was noted that tissues such as lung or intestine had been reported to be consumed in
countries such as China. In recommending that a meeting of experts be held on dietary
exposure assessments for veterinary drugs, CCVRDF noted that the meeting should consider
enlarging the scope of the model diet to include other target tissues (FAO/WHO, 2010b).
The Expert Meeting also recognized the need to consider the objectives of the project to
update the principles and methods for the risk assessment of chemicals in food when
reviewing the model diet. These objectives were to harmonize (as appropriate) 1) the risk
assessment procedures for different classes of chemicals in food (e.g. additives, contamin-
ants, pesticide residues, veterinary drug residues and natural toxicants) and 2) the approaches
to risk assessment by JECFA and the Joint FAO/WHO Meeting on Pesticide Residues
(JMPR) with those of other scientific groups (e.g. national, regional, public health, environ-
mental) (FAO/WHO, 2009c).

7
3. Summary of food consumption data submitted
In order to assess whether the food consumption amounts used in the current model diet were
overly conservative for the purpose of undertaking a chronic dietary exposure assessment or
were suitable for the purpose of undertaking an acute dietary exposure assessment, it was
necessary to obtain up-to-date food consumption data from Member countries.
A request for food consumption data for standard and non-standard animal tissues and food
of animal origin was issued by FAO and WHO on 26 October 2010 (FAO/WHO, 2010b).
Forty-seven countries submitted data in response to this request. For some countries, more
than one data set was submitted.
A variety of methods were used to collect these data, as summarized in Annex 3:
• Individual-level survey data were submitted by 24 countries, including Argentina,
Australia, Brazil, Cambodia, China, Thailand, Viet Nam, the USA and 21 European
countries summarized in the EFSA Comprehensive European Food Consumption
Database.
• Household budget survey data were submitted by Brazil and Cameroon.
• Food balance sheet data were submitted by 17 Latin American countries. Two countries
(Argentina and Brazil) that submitted food balance sheet data also submitted individual-
level survey data.1
The type of food consumption data sets submitted varied, also summarized in Annex 3:
• Population group: Mean consumption for the total population (consumers and non-
consumers) only and/or means, medians and high percentiles (95th, 97.5th and/or 99th
percentiles) for consumers only and the total population were provided.
• Food amounts reported: Food amounts were expressed on an as consumed basis (i.e.
cooked or otherwise prepared for consumption) and/or on a raw weight basis (converted
from as consumed).2
• Large portion size: Survey data were typically expressed on a person-day basis for acute
data and on an average per day basis for chronic data; however, sometimes data were
provided only on an average per day basis.
• Survey duration: Survey duration ranged from 1 day (nine countries) to 7 days (five
countries), with one country submitting data from a 15-day survey of household
expenditures. The majority of surveys were of 2–3 days’ duration and used 24-hour recall
or food record methods.
• Age group: Data were available for the specific population of children aged 2–6 years
from a subset of countries (Australia, China, USA), and EFSA compiled data for infants
(<1 year), toddlers (ages 1–3 years) and other children (ages 3–9 years). For the purposes
1 Per capita food balance sheet data apply to the total population (all ages) within a particular country and
represent the total amount of food available for consumption in a given year (food produced plus imports minus
exports and non-food use, sometimes adjusted for waste) divided by the total population and adjusted to a per
person per day basis. 2 Conversion factors would need to be applied to convert food consumption data provided on an as consumed
basis to a raw weight basis for appropriate comparison of data sets.
8
of this exercise, EFSA data for children that best fitted the 2- to 6-year age group were
evaluated. Surveys from some other countries reported data only for people aged 2 and
over (2+) or for adults only, which was defined differently in different countries. For the
purposes of this exercise, general population data for ages 2+ were compiled from
available data for ages 2+ and data for adults, if no other data were submitted from a
particular country. It was decided to include adults-only data, as they provided a
conservative but generally similar estimate of food consumption amounts to that for
populations aged 2+, with the possible exception of milk consumption. No additional
weightings were applied to account for undersampling or oversampling of certain ages
within a given survey.
• Individual body weight correction: Of the countries that submitted either individual or
household survey data, 26 countries provided food consumption data corrected for each
individual’s body weight, and 6 countries provided uncorrected data. Six of the 26
countries provided body weight–corrected data based on 1-day surveys; hence, these data
sets could be used for acute but not chronic dietary exposure estimates. Individual body
weights per se were not submitted.

9
4. Proposed approach to dietary exposure estimates for veterinary drug residues
4.1 General considerations
Dietary exposure assessment combines food consumption data with data on the concentration
of chemicals in food. The resulting dietary exposure estimate may then be compared with the
relevant health-based guidance value for the food chemical of concern, if available, as part of
the risk characterization. Assessments may be undertaken for acute or chronic exposures,
where acute exposure covers a period of up to 24 hours and chronic or long-term exposure
covers average daily exposure over the entire lifetime.
The general equation for both acute and chronic dietary exposure is:
Dietary exposure = Σ (Concentration of chemical in food × Food consumption)
Body weight
for all foods containing the residue.
The Environmental Health Criteria (EHC) monograph on Principles and methods for the risk
assessment of chemicals in food (FAO/WHO, 2009c), referred to hereafter as EHC 240,
recommends certain general principles and considerations when undertaking dietary exposure
assessments. These principles were considered when developing proposed methods for the
assessment of acute and chronic exposures to veterinary drug residues in food. In particular,
the current approach considered the following:
• With regard to the proposed dietary exposure methods, similar methods appropriate for
contaminants, pesticides, food additives (including flavourings), processing aids and other
chemicals in foods were considered.
• No screening methods were proposed, because it was considered unlikely that a high
number of substances would need to be assessed.
• Dietary exposure assessment methods used at an international level use residue data from
trials and depletion studies. These studies tend to be well controlled but of small sample
size and may not reflect residue concentrations resulting from actual use of a pesticide,
food additive or veterinary drug. In the future, more refined estimates could be made in
addition to these more conservative estimates if residue data based on a sufficient number
of samples collected by monitoring and surveillance programmes in individual countries
were made available to JECFA. However, for dietary exposure estimates, random
representative data, which provide an indication of actual residue concentrations to which
consumers are exposed, are preferred to data from targeted surveys, which are considered
unlikely to be representative of the food supply available.
• Data from the Global Environment Monitoring System – Food Contamination Monitoring
and Assessment Programme (GEMS/Food), both the consumption cluster diets
(http://www.who.int/foodsafety/chem/gems/en/index1.html) and the large portion size
database (http://www.who.int/foodsafety/chem/gems/en/index2.html), were evaluated as
a source of food consumption data, in addition to the submitted data.
10
• For both acute and chronic dietary exposure estimates, food consumption data derived
from surveys conducted at the individual level should ideally be used to provide a
realistic representation of people’s actual consumption patterns.
• Methodologies should take into consideration non-average individuals, such as those who
consume large portions of specific food items, as recommended in EHC 240.
• International dietary exposure assessment methods should provide exposure estimates
that are equal to or greater than the best available (i.e. most accurate) estimates carried
out at a national level, to ensure sufficient conservatism. It is assumed that the inter-
national estimate covers potential dietary exposure in countries for which no data are
available.
• Possible population subgroups of concern were considered. It was decided to include
separate data on infants and children, because the amount of food they consume in
relation to body weight is higher than for older age groups, and the composition of
people’s diets changes as they age. Infants and young children may, for example, be more
dependent on particular commodities such as milk than are people in other age groups.
The proposed approach to dietary exposure assessments therefore covers the general
population as well as groups that are potentially vulnerable or are expected to have
dietary exposures that are significantly different from those of the general population. It is
recognized that infants and young children have energy and nutrient intake requirements
met by food consumption that, when expressed per kilogram body weight, are higher than
those for older children due to their higher requirements for both growth and body
maintenance. Infants aged 0–3 months and children aged 2–6 years were taken to
represent the most conservative cases of potentially vulnerable subpopulation groups:
infants aged 0–3 months because milk (breast milk or infant formula) is their sole source
of nutrition; and children aged 2–6 years due to higher total food consumption per
kilogram body weight than for any other age group in the population.
4.2 Acute dietary exposure assessments
Acute dietary exposure estimates cover a time period of food consumption over a single meal
or 24 hours and are intended to be used for comparison with ARfD values in a risk assess-
ment process (FAO/WHO, 2009c). Hence, the need for an acute dietary exposure assessment
will depend (to some extent) on whether an ARfD for the residue has been established.
The proposed acute dietary exposure model considers high-level exposure from each
relevant food of animal origin singly—that is, the concurrent occurrence of the selected high
residue concentration in each food to which a consumer might be exposed (e.g. MRL or high
residue concentration derived from depletion studies, such as the upper one-sided 95%
confidence limit over the 95th percentile residue concentration) combined with a high daily
consumption (97.5th percentile) of that food (meat, offal, milk, others).
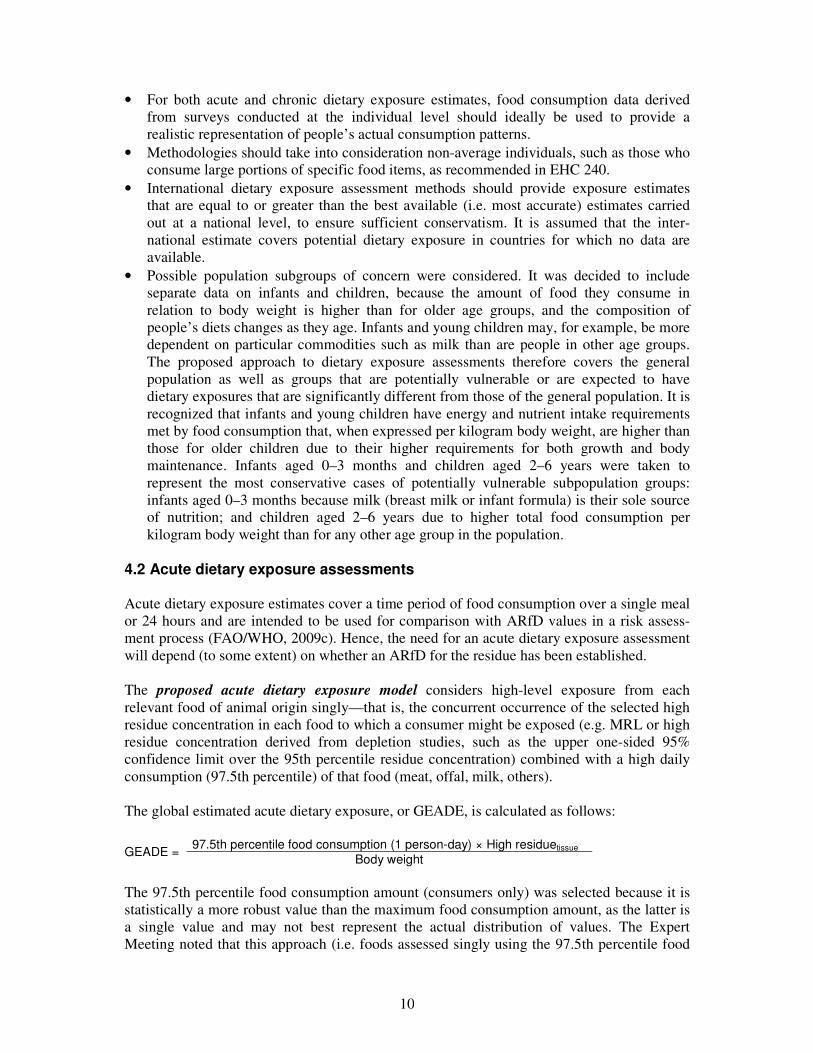
The global estimated acute dietary exposure, or GEADE, is calculated as follows:
GEADE = 97.5th percentile food consumption (1 person-day) × High residuetissue
Body weight
The 97.5th percentile food consumption amount (consumers only) was selected because it is
statistically a more robust value than the maximum food consumption amount, as the latter is
a single value and may not best represent the actual distribution of values. The Expert
Meeting noted that this approach (i.e. foods assessed singly using the 97.5th percentile food

11
consumption amount and a high residue concentration) was consistent with that used by
JMPR for acute dietary exposure assessments for pesticides. There is also an extensive
GEMS/Food large portion size database available with 97.5th percentile consumption values
for raw commodities of animal origin.
It is noted that for raw commodities subject to mixing before sale and consumption or subject
to further processing, such as milk, oils and grains, the supervised trials median residue
(STMR) concentration is considered by JMPR to be an appropriate residue value for acute
assessments for pesticide residues (FAO/WHO, 2009c). However, as milk may not be mixed
prior to consumption or use in the production of dairy products in all countries, the Expert
Meeting decided to take a more conservative approach and use the selected high residue
concentration in the acute dietary exposure assessment for veterinary drug residues in milk.
It is possible that, in a single meal or over 1 day, a person could have background exposure to
the veterinary drug residue from other foods consumed in that time period in addition to high
levels of exposure from a single food. However, the acute exposure estimate is conservative
in that it assumes that the single food contains a high residue concentration, which
monitoring data indicate is unlikely to be actually found in the food supply. It was therefore
assumed that the estimated dietary exposure from a single food would be a much higher value
than the level of background exposure and that inclusion of background exposure in the
estimate would not substantially improve the accuracy of the estimate. However, the Expert
Meeting noted that this assumption needs to be further investigated.
In the risk characterization stage of a risk assessment, the GEADEs for all relevant foods for
the general population, children aged 2–6 years and infants (milk only, assumed to be infant
formula) would be compared with the health-based guidance value for acute toxicity (ARfD).
If any one of these estimates exceeded the ARfD, then the assumptions underlying the risk
characterization would first be re-evaluated before determining if there may be cause for
concern.
4.3 Chronic dietary exposure assessments
Chronic dietary exposure estimates cover food consumption over the long term and are
intended to be used for comparison with a health-based guidance value based on chronic
toxicity, such as an ADI, in a risk assessment process (FAO/WHO, 2009c).
For most regulatory purposes for food chemicals, as recommended in EHC 240, non-average
individuals who may consume one or more foods in higher than average amounts over a long
period of time should also be considered in the risk assessment. The Expert Meeting noted
that the use of mean food consumption data for the total population (consumers and non-
consumers of the foods containing veterinary drug residues) as a basis for chronic dietary
exposure assessments would exclude habitual consumers of specific food categories
(FAO/WHO, 2009c).
In one simple approach designed to account for the habitual high consumer (originally
described by Verger, 1995; see also Counil, Verger & Volatier, 2006), the 95th percentile
dietary exposure (calculated considering consumers only) from each relevant food category is
added to the mean dietary exposure from all other foods (consumers and non-consumers) in
the diet to estimate the total dietary exposure of high-level consumers of each food type. The
highest of these estimates is then selected for use in the risk assessment. This approach has

12
been used for estimating intakes of food and feed additives and nutrients from food (Tennant,
Becquet & Jans, 2009).
A more conservative version of this approach consists of summing the 95th percentile of
exposure for the two highest categories that are the main contributors with the mean exposure
for the other categories (EFSA, 2008). The method employing the two highest individual
foods is applicable to situations in which chemicals are likely to be present in a diverse
number of food categories that may be consumed at a high level by the same individuals. In
addition, it is important to note that this method is only valid when using a small number of
broad food groups (around 20 food groups). However this method is not acceptable when
using a database containing a higher number of food categories ( around 160 food groups). If
foods are defined at a high level of disaggregation (it is possible for one person to consume
up to eight or nine foods at a high level over a period of time (EFSA, 2011).
Based on research undertaken prior to the Expert Meeting into the use of different approaches
(see Annex 4) for veterinary drug residues that are solely found in a limited number of food
groups, including only foods of animal origin, it was considered overly conservative to
assume that even two foods would be consumed at a high level over a long period of time.
The proposed chronic dietary exposure model for veterinary drug residues assumes that in
the longer term, an individual would be a high-level consumer of only one category of food
and that his or her consumption of other foods containing the residue would remain at the
population average (total population). The Expert Meeting proposed that the 97.5th percentile
food consumption amount for consumers only should be used, to be derived from surveys
with individual records of 2 or more days’ duration by first calculating the average food
consumption amount per day per person, preferably expressed on a per kilogram body weight
basis for each individual. The choice of a high percentile, such as the 97.5th percentile, was
justified by its application for a single commodity (instead of two, as applied for other food
chemicals). The 97.5th percentile was proposed because it was more commonly reported in
the data submitted. However, the experts recognized that the 90th or 95th percentile can also
be considered to represent chronic (regular) high consumption. In any case, it is essential to
document information on the number of consumers on which the percentile is based.
It is logical and statistically valid to sum the mean dietary exposure to a veterinary drug
residue from each food to estimate the total mean exposure from all foods in the diet for the
total population. On the other hand, high-level consumption of different foods relates to
different subpopulations of consumers, as not every person reports consumption of all foods
each day of a survey. Hence, higher percentiles of food consumption cannot be summed to
estimate total high-level food consumption from all foods.
In order to select the single animal product that contributes the highest dietary exposure for a
specific veterinary drug residue, the following calculation is undertaken for each food in the
diet that has residue values:
High-level exposure from
each animal product =
97.5th percentile consumption
× Median residue1
(mg/kg body weight per day or
mg/day) (kg/kg body weight per day or kg/day) (mg/kg)
1 It should be noted that the median has to be determined based on at least four or five observations; reporting of
the 95% confidence interval around the median is advisable.
13
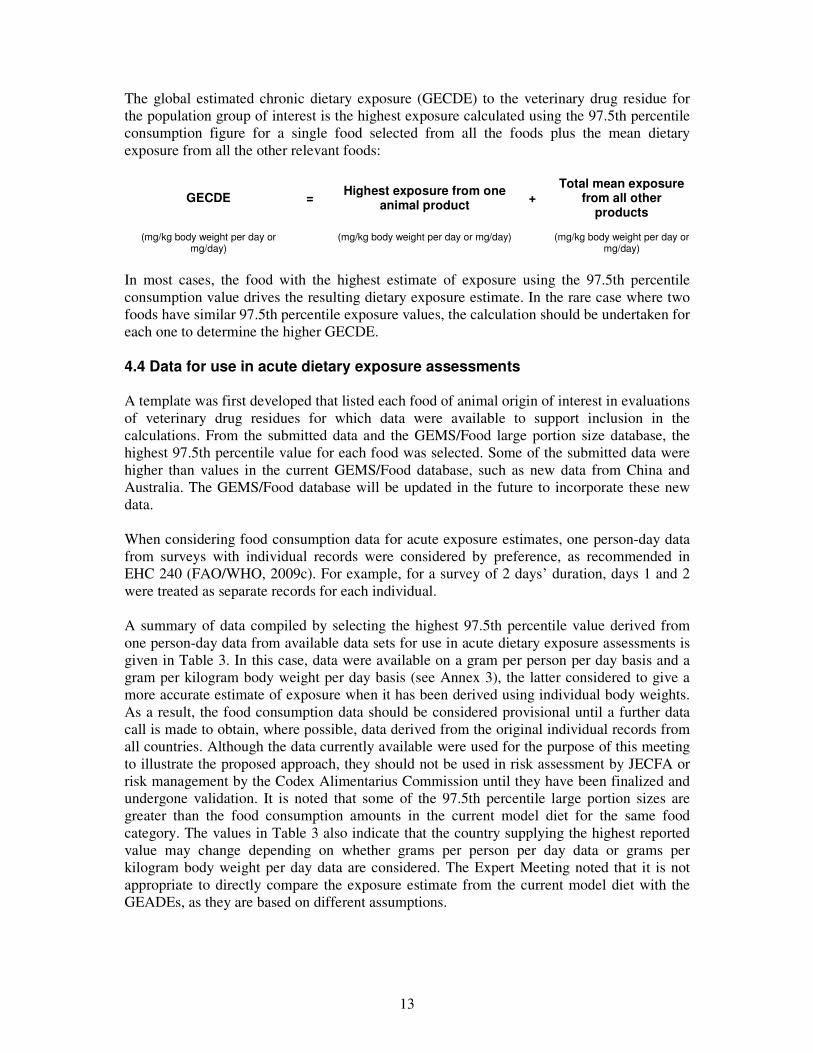
The global estimated chronic dietary exposure (GECDE) to the veterinary drug residue for
the population group of interest is the highest exposure calculated using the 97.5th percentile
consumption figure for a single food selected from all the foods plus the mean dietary
exposure from all the other relevant foods:
GECDE = Highest exposure from one
animal product +
Total mean exposure from all other
products
(mg/kg body weight per day or mg/day)
(mg/kg body weight per day or mg/day) (mg/kg body weight per day or mg/day)
In most cases, the food with the highest estimate of exposure using the 97.5th percentile
consumption value drives the resulting dietary exposure estimate. In the rare case where two
foods have similar 97.5th percentile exposure values, the calculation should be undertaken for
each one to determine the higher GECDE.
4.4 Data for use in acute dietary exposure assessments
A template was first developed that listed each food of animal origin of interest in evaluations
of veterinary drug residues for which data were available to support inclusion in the
calculations. From the submitted data and the GEMS/Food large portion size database, the
highest 97.5th percentile value for each food was selected. Some of the submitted data were
higher than values in the current GEMS/Food database, such as new data from China and
Australia. The GEMS/Food database will be updated in the future to incorporate these new
data.
When considering food consumption data for acute exposure estimates, one person-day data
from surveys with individual records were considered by preference, as recommended in
EHC 240 (FAO/WHO, 2009c). For example, for a survey of 2 days’ duration, days 1 and 2
were treated as separate records for each individual.
A summary of data compiled by selecting the highest 97.5th percentile value derived from
one person-day data from available data sets for use in acute dietary exposure assessments is
given in Table 3. In this case, data were available on a gram per person per day basis and a
gram per kilogram body weight per day basis (see Annex 3), the latter considered to give a
more accurate estimate of exposure when it has been derived using individual body weights.
As a result, the food consumption data should be considered provisional until a further data
call is made to obtain, where possible, data derived from the original individual records from
all countries. Although the data currently available were used for the purpose of this meeting
to illustrate the proposed approach, they should not be used in risk assessment by JECFA or
risk management by the Codex Alimentarius Commission until they have been finalized and
undergone validation. It is noted that some of the 97.5th percentile large portion sizes are
greater than the food consumption amounts in the current model diet for the same food
category. The values in Table 3 also indicate that the country supplying the highest reported
value may change depending on whether grams per person per day data or grams per
kilogram body weight per day data are considered. The Expert Meeting noted that it is not
appropriate to directly compare the exposure estimate from the current model diet with the
GEADEs, as they are based on different assumptions.

14
Table 3. Large portion size data (97.5th percentile consumption, one person-day data)a for use in acute
dietary exposure estimate (provisional)
Food type as raw commodity
97.5th percentile, general population, 1 day (g/person per day)
97.5th percentile, general population, 1 day (g/kg body weight per day)a
97.5th percentile, children aged 2–6, 1 day (g/person per day)
97.5th percentile, children aged 2–6, 1 day (g/kg body weight per day)a
Mammalian muscle
Beef and other bovines
522 (France)
10 (France) 255 (France) 13.4 (France)
Pork and other porcines
665 (Brazil) 10 (Brazil) 261 (China)b 16.2 (China)
Sheep and other ovines
490 (South Africa) 8.8 (South Africa) 262 (China)b 16.4 (China)
Goat and other caprines
477 (USA) 7.3 (USA) 76 (USA) 4.2 (USA)c
Horse and other equines
525 (China)b 9.9 (China) na na
Rabbit 419 (China)b 7.9 (China) na na
All mammalian muscle
559 (Australia) 8.3 (Australia) 254 (Australia) 16.7 (Australia)
Mammalian trimmed fat, skin and added fat
254 (China)b 4.8 (China) 65 (France) 3.4 (France)
Mammalian offal
Mammalian liver
465 (USA) 7.2 (USA) 200 (China) 12.5 (China)c
Mammalian kidney
788 (USA) 12.1 (USA) 225 (China) 14.1 (China)c
Mammalian lung
300 (China) 5.7 (China)c 150 (China) 9.4 (China)c
All mammalian offal
524 (South Africa) 9.4 (South Africa) 238 (China)b 14.9 (China)
Fish and seafood
Fish 1200 (Brazil) 19 (Brazil) 315 (China) 19.7 (China)
Crustaceans 747 (Brazil) 11.8 (Brazil) 350 (China) 21.9 (China)
Molluscs 650 (Germany) 14.3 (Greece) 327 (Italy) 7.6 (Germany)
All fish and seafood
600 (Hungary) 8.3 (Bulgaria) 345 (Italy) 14.8 (Italy)
Poultry muscle
535 (China)b 10.1 (China) 333 (China)b 20.8 (China)
Poultry fat and skin
43 (USA) 0.7 (USA) 15 (USA) 0.8 (USA)
Poultry offal
348 (France) 6.07 (China) 248 (USA) 13.8 (USA)

15
Food type as raw commodity
97.5th percentile, general population, 1 day (g/person per day)
97.5th percentile, general population, 1 day (g/kg body weight per day)a
97.5th percentile, children aged 2–6, 1 day (g/person per day)
97.5th percentile, children aged 2–6, 1 day (g/kg body weight per day)a
Eggs (all) 383 (France) 7.3 (France) 201 (France) 12.1 (China)
Milkd 2466 (USA) 37.9 (USA) 1933 (Australia) 101.7 (Australia)
Honey 165 (Brazil) 2.4 (Brazil) 43 (Australia) 2.3 (Australia)
na, not available a 97.5th percentiles in grams per kilogram body weight per day were calculated in one of two ways: 1) based on the observed
distribution expressed per kilogram body weight; or 2) by dividing the 97.5th percentiles in grams per day by the observed average body weight in the population.
b All grams per day data for China have been back-calculated from the grams per kilogram body weight per day data, considering the average body weight provided for that population.
c For Chinese data, standard body weights of 53 kg for the general population 2+ years and 16 kg for children aged 2–6 years were used, provided by China; for USA data, body weights of 65 kg for the general population 2+ years and18 kg for children aged 2–6 years were used, provided by the USA.
d Includes whole liquid milk, secondary milk products (e.g. skimmed milk, evaporated milk, milk powders), derived milk products (e.g. cream, butter) and manufactured milk products (yoghurt, cheese, ice cream).
4.5 Data for use in chronic dietary exposure assessments When considering food consumption data for chronic dietary exposure assessments, the
duration of the survey from which the food consumption data are derived should be taken
into account. For chronic exposure estimates, it is preferable to use surveys of more than 1
day’s duration to represent “usual” consumption patterns so that the average food consump-
tion is calculated per day for each individual in the survey over the number of days of the
survey before the high percentile is derived from the distribution of food consumption values.
The range of distribution therefore tends to decrease towards the central measure the longer
the duration of the survey; hence, a 97.5th percentile consumption from a 2-day survey will
tend to be lower than that derived from 1-day data and provides a better representation of
high chronic consumption; that from a 7-day survey would tend to be lower again.
For exposure estimates based on broad food categories (e.g. muscle or milk) that are likely to
be consumed daily by the majority of the population, survey duration is not such a critical
issue; in a given population, the amounts of these foods consumed tend not to vary signifi-
cantly from day to day, so the difference between food consumption estimates from 1 and 2
or more days of data is minimal. Survey duration is much more important when considering
foods that are less frequently consumed in some countries, such as liver and kidney, and it is
significant to note that these commodities are more likely to contain higher concentrations of
veterinary drug residues. For foods such as liver and kidney, the longer the duration of the
survey, the more consumers are identified, so that the proportion of the population consuming
(% consumers) appears to increase. Conversely, the average amount that a consumer eats
(g/day) appears to decline as the survey duration is extended. As the proportion of the
population consuming is frequently very small, this makes reliable estimates of long-term
consumption of such commodities extremely difficult (see section 6).
From the information submitted, the most comprehensive data sets for high food consump-
tion values were for one person-day 97.5th percentile food consumption values (e.g.
GEMS/Food large portion size database). However, some information was available on
97.5th percentile food consumption from surveys of 2 or more days’ duration, where the
amount of food consumed by each individual in the survey was averaged over the number of
days of the survey before the 97.5th percentile for the population group of interest was
16
derived. This last type of data is more appropriate for use in chronic dietary exposure
assessment.
Annexes 5 and 6 summarize data submitted for use in chronic dietary exposure assessments
for general populations aged 2 years and over and for children aged 2–6 years, respectively
(mean, 97.5th percentile, consumers only, averaged per day over the survey duration where
these data were available).
As a conservative approach, the highest reported mean food consumption values of those
available for different countries were selected for animal products for the total population
(Table 4). The highest 97.5th percentile value derived from surveys with individual records
of 2 or more days’ duration from available data sets for use in chronic dietary exposure
assessments is also given in Table 4 for the general population aged 2 years and over and for
children aged 2–6 years. Information from countries reporting food balance sheet data or
using a food frequency method to collect data on food consumption were not included in this
exercise, although submitted data are still listed in Annexes 5 and 6. These values are
therefore considered provisional, as food consumption expressed as grams per kilogram body
weight, derived from the original individual records, would be preferred. A further data call is
required to obtain these data, to confirm survey duration for some data sets from some
countries where this information was not submitted and, if possible, to obtain chronic high-
percentile consumption data (i.e. 90th, 95th and 97.5th percentiles) from surveys of 2 or more
days’ duration where not previously available. Although the data currently available were
used for the purpose of this meeting to illustrate the proposed approach, they should not be
used in risk assessment by JECFA or risk management by the Codex Alimentarius
Commission until they have been finalized and undergone validation.
Food consumption values are currently reported in grams per day. In this case, standard body
weight values need to be used to assess exposure per kilogram body weight: 60 kg for adults,
15 kg for children and 5 kg for infants. The same model should be developed where con-
sumption levels are expressed per kilogram body weight per day. The proposed model diet
reports levels of consumption at a more disaggregated level by distinguishing mammalian
products from poultry products in terms of muscle, offal, fat and skin. Moreover, among
mammals, levels of consumption for muscle are provided according to five different
categories: beef and other bovines, sheep and other ovines, goat and other caprines, horse and
other equines, and rabbit. This is because different residue concentrations may be provided in
different species and a more refined exposure assessment may be provided by combining
these residue concentrations to the appropriate level of consumption. Similarly, the fish and
seafood category is disaggregated into fish, molluscs and crustaceans to allow appropriate
combination of residue concentrations with levels of consumption. Where residue concen-
trations would not be available at a disaggregated level or would be available for species not
reported in the list, the overall level of consumption for the category would be used (e.g. “All
mammalian muscle”, “All fish and seafood”).
The levels of consumption considered in the current model diet used by JECFA are higher
than the highest average consumption among countries for which data were made available to
the Expert Meeting. In the case of milk, the levels of consumption in the current model are
also higher than the highest high-level chronic consumption (assessed as the highest 97.5th
percentile in consumers only for surveys lasting at least 2 days) among countries for which
data were made available to the Expert Meeting. For muscle, the level of consumption in the
current model diet (300 g) is lower than chronic high consumption of total mammalian

17
Table 4. Comparative food consumption data for use in the chronic dietary exposure assessment derived from surveys with individual records of 2 days’ duration or more, with food consumption averaged over number of days of survey (provisional)
Food type as raw commodity
Current JECFA model diet for
veterinary drug
residues (g/person per day)
General populationa Childrenb Infantsc
Mean total
population (g/person per day) Comments
Mean total population (highest
GEMS/Food cluster)
(g/person per day)
High-level chronic
consumers (g/person per day) Comments
Mean total
population (g/person per day) Comments
High-level chronic
consumers (g/person per day) Comments
(g/person per day)
Mammalian muscle
Beef and other bovines
127 Highest GEMS/Food cluster, higher than
all individual surveys: 97 Brazil,
>10 years
127 (M) 325 Brazil, 2 days, 97.5th percentile consumers
only, 2 days
39 Australia, 2–6 years
88 USA, 97.5th percentile
consumers only, 2 days, 2–6 years
—
Pork and other porcines
69 Highest GEMS/Food cluster, higher than
all individual surveys
69 (F) 428 Brazil, 97.5th percentile, 2 days, consumers only, unpublished data
25 Australia, 2–6 years
90 USA, 97.5th percentile
consumers only, 2 days, 2–6 years
—
Sheep and other ovines
11 Highest GEMS/Food cluster; 25 Australia,
but 1-day survey only
11 (B) 373 Brazil, 2 days, 97.5th percentile consumers
only, 2 days
13 Australia, 2–6 years
— No chronic consumption
reported in any country
—
Goat and other caprines
5 Highest GEMS/Food cluster, higher than Brazil household
budget survey (0.3), not available in
individual surveys
5 (J) 401 Brazil, 2 days, 97.5th percentile consumers
only, 2 days, unpublished data
— No chronic consumption reported in any country
— No chronic consumption
reported in any country
—
Horse and other equines
2 Highest GEMS/Food cluster
2 (M) — No chronic consumption reported
in any country
— No chronic consumption reported in any country
— No chronic consumption
reported in any country
—
Rabbit 5 Highest GEMS/Food 5 (B) — No chronic — No chronic — No chronic —

18
Food type as raw commodity
Current JECFA model diet for
veterinary drug
residues (g/person per day)
General populationa Childrenb Infantsc
Mean total
population (g/person per day) Comments
Mean total population (highest
GEMS/Food cluster)
(g/person per day)
High-level chronic
consumers (g/person per day) Comments
Mean total
population (g/person per day) Comments
High-level chronic
consumers (g/person per day) Comments
(g/person per day)
cluster consumption reported in any country
consumption reported in any country
consumption reported in any
country
All mammalian muscle
300 158 Highest GEMS/Food cluster (sum of
different species)
158 (M) 428 Highest value reported in different species
above
57 Australia, 2–6 years (sum of different species)
90 Highest value reported in different
species above
—
Mammalian trimmed fat, skin and added fat
50 37 Highest GEMS/Food cluster, higher than
Czech Republic, adults (21)
37 (K) 53.1 USA, 97.5th percentile consumers only, 2
days, unique survey with this category and
more than 1 day
9 USA, 2–6 years
30 USA, 97.5th percentile
consumers only, 2 days, unique survey
with this category and more than 1 day
—
Mammalian offal
Mammalian liver
100 4 Highest GEMS/Food cluster
4 (B; cattle) 250 USA, 97.5th percentile, 2 days
0.04 USA, based on 2
consumers, 2–6 years
— No chronic consumption
reported in any country
—
Mammalian kidney
50 4 Highest GEMS/Food cluster
4 (B; cattle) 200 USA, 97.5th percentile, 2 days
0.05 Australia, based on 3 consumers, 2–6 years
— No chronic consumption
reported in any country
—
Mammalian lung
— No chronic consumption
reported in any country
— — No chronic consumption reported
in any country
— No chronic consumption reported in any country
— No chronic consumption
reported in any country
—
All mammalian offal
14 Highest GEMS/Food cluster, higher than Brazil, >2 years (12)
14 (B) 250 Highest value observed in the different organs
2 Czech Republic, 4–
9 years
109 Czech Republic, 4–9 years, 2 days, 97.5th
percentile
—

19
Food type as raw commodity
Current JECFA model diet for
veterinary drug
residues (g/person per day)
General populationa Childrenb Infantsc
Mean total
population (g/person per day) Comments
Mean total population (highest
GEMS/Food cluster)
(g/person per day)
High-level chronic
consumers (g/person per day) Comments
Mean total
population (g/person per day) Comments
High-level chronic
consumers (g/person per day) Comments
(g/person per day)
(edible offal, farmed
animals)
consumers only, includes poultry offal
Fish and seafood
Fish 57 Spain, 17–60 years 34 (F) 1000 Brazil, 97.5th percentile, 2 days, unpublished data
31 Spain, 3–9 years
175 Spain, 3–9 years, 97.5th percentile consumers only
—
Crustaceans 5 Highest GEMS/Food cluster
5 (M) 376 Brazil, 97.5th percentile, 2 days, unpublished data
2 Italy, 3–9 years
124 Netherlands, 97.5th percentile
consumers only, 2–6 years, 3 days
—
Molluscs 15 Highest GEMS/Food cluster, higher than Spain (12), 17–60
years
15 (G) 325 Germany, 97.5th percentile consumers
only, 2 days
9 Italy, 3–9 years
216 Italy, 3–9 years, 97.5th percentile
consumers only, 3 days, 37 consumers
—
All fish and seafood
300 80 Japan 71 (L) 237 Spain, 97.5th percentile consumers
only, 2 days
40 Italy, 3–9 years; 36
Japan, 1–6 years
181 Italy, 3–9 years, 97.5th percentile
consumers only, 3 days
—
Poultry muscle
300 131 Highest GEMS/Food cluster, higher than individual surveys;
Australia 164, but 1-day survey only
131 (K) 300 Brazil, 97.5th percentile, 2 days, unpublished data
37 Spain, 3–9 years; 32
Hungary, 3–5 years
207 Czech Republic, 97.5th percentile
consumers only, 2 days
—
Poultry fat and skin
50 37 No data available; copied from mammalian
21 (H) 43 No data available; copied from
GEMS/Food large portion diet (USA)
9 No data available;
copied from mammalian
fat
15 No data available; copied from
GEMS/Food large portion diet (USA)
—

20
Food type as raw commodity
Current JECFA model diet for
veterinary drug
residues (g/person per day)
General populationa Childrenb Infantsc
Mean total
population (g/person per day) Comments
Mean total population (highest
GEMS/Food cluster)
(g/person per day)
High-level chronic
consumers (g/person per day) Comments
Mean total
population (g/person per day) Comments
High-level chronic
consumers (g/person per day) Comments
(g/person per day)
Poultry offal
100 + 50 10 Hungary, 3 days, consumers only, >18
years
2 (I) 188 Brazil, 97.5th percentile, 2 days, unpublished data
2 Czech Republic, 4–
9 years, includes
mammalian offal
109 Czech Republic, 4–9 years , 2 days,
97.5th percentile consumers only,
includes mammalian offal
—
Eggs (all) 100 71 Highest GEMS/Food cluster, higher than individual surveys
71 (H) 150 Brazil, 97.5th percentile, 2 days, unpublished data
28 Japan, 1–6 years
115 Italy, 3–9 years, 97.5th percentile
consumers only, 3 days
—
Milkd
1500 378 Spain; Australia 758, but 1-day survey
only
302 (G) 1057 Denmark, 97.5th percentile consumers
only, 7 days
634 Australia, 2–6 years, 2
days
1065 USA, 97.5th percentile
consumers only, 2–6 years, 2 days
750
Honey 50 2.5 Germany 2 (B) 140 Belgium, 2 days, consumers only, 72 consumers; second
highest: 74, Hungary, 3 days, consumers only,
>18 years, 155 consumers
2 Czech Republic, 4–
9 years
84 Spain, 3–9 years, 97.5th percentile
consumers only, 2 days
—
a The values provided are assumed to apply to the general population aged 2 years and over; however, some of the data sets submitted did not cover this specific age range (see Annex 3 for details).
b Children 2–6 years of age. c Infants 0–3 months of age. d Includes whole liquid milk, secondary milk products (e.g. skimmed milk, evaporated milk, milk powders), derived milk products (e.g. cream, butter) and manufactured milk products (yoghurt,
cheese, ice cream).

21
muscle but higher than chronic high consumption of sheep and other ovines (146 g), goat and
other caprines (169 g) and poultry (244 g).
As the highest data point from any country was taken to represent the food consumption
amount for each food, the Expert Meeting emphasized that the proposed chronic dietary
exposure model is a constructed diet and is not intended to represent the diet of any specific
population. Rather, it is intended to make a conservative estimate of chronic dietary exposure
that takes into account the non-average person who may be a high consumer of a single food.
22
5. Worked examples
The proposed chronic dietary exposure model was applied to two worked examples, as
summarized in sections 5.1 and 5.2 below. In addition, for comparative purposes, the chronic
exposures for the two chemicals used in these worked examples were recalculated using the
existing JMPR approach for estimating chronic dietary exposure to pesticide residues (section
5.3). Finally, GECDE values for the antimicrobial colistin have been derived for the general
population aged 2 years and over, children 2–6 years of age and infants, for comparison with
estimates of TMDI and EDI values provided previously in this report (section 5.4).
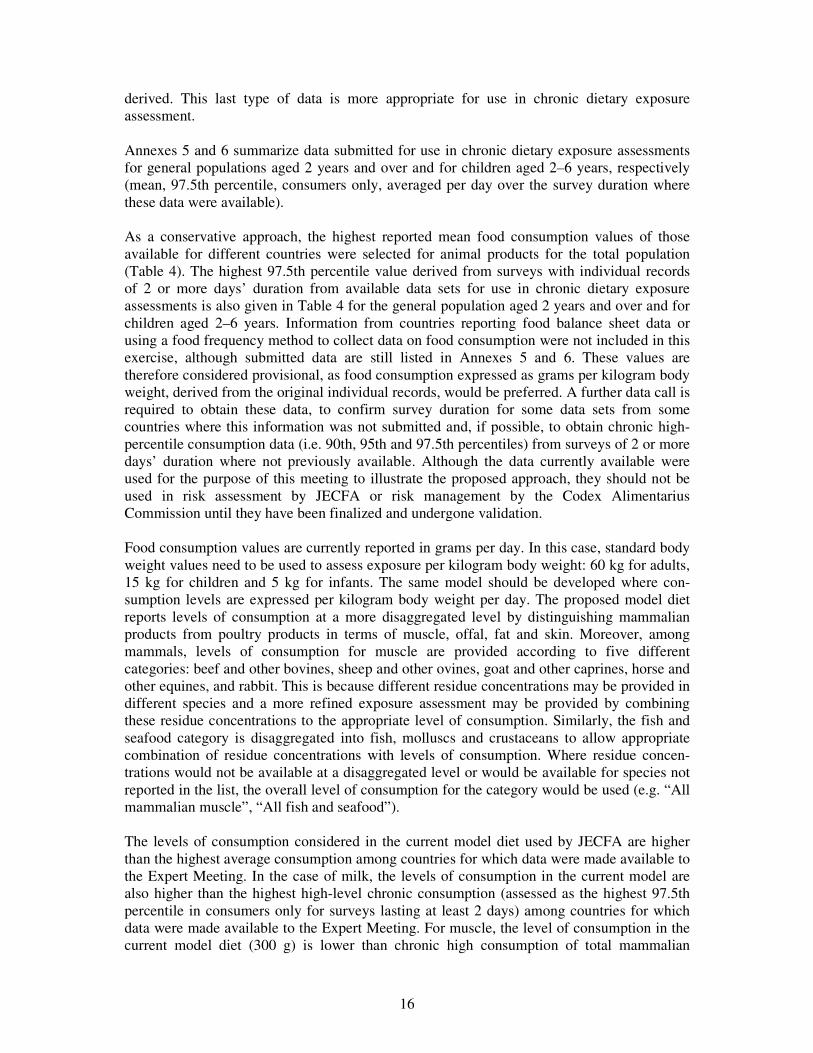
5.1 Triclabendazole
The proposed chronic dietary exposure model was applied to the anthelminthic triclabenda-
zole based on median residue concentrations from the depletion curve at the 28th day after
treatment for cattle and sheep. These were corrected by the marker/total ratio for each com-
modity and bioavailability of 13%. The GECDE was calculated by first assessing high
chronic exposure for all foods individually, and second by determining which food gave the
highest estimated exposure value. In this case, cattle liver gave the highest value. This high
value was then added to the sum of mean chronic dietary exposures for the general popu-
lation for all other foods (highlighted values) to give a GECDE of 83 µg/person per day
(Table 5). It is noted that as food consumption data were available for “all kidney”, “all liver”
and “all fat” only and not by individual animal species, the same consumption data were used
for cattle and sheep tissues to determine which species was likely to result in the higher
Table 5. GECDE calculation for triclabendazole for cattle and sheep (general population)
a The correction includes the ratio of marker residue concentration to total residue concentration for each tissue and the factor for bioavailability. Total residue = marker residue/ratio (marker/total) × bioavailability. Ratios of 0.32, 0.24, 0.14 and 0.4 for cattle muscle, kidney, liver and fat and of 0.4, 0.24, 0.25 and 0.4 for sheep muscle, kidney, liver and fat. Bioavailability of 13%.
b The GECDE is the sum of the highlighted values for high chronic exposure and mean chronic exposure.
Food categories
Median residue concentration
from regression line (µg/kg)
Corrected residue
concentration (µg/kg)a
Food consumption, high chronic
(g/day)
Food consumption, mean chronic
(g/day)
High chronic exposure
(µg/person per day)
Mean chronic
exposure (µg/person
per day)
Cattle muscle
160.6 65.3 325 127 21.2 8.3
Cattle kidney
172.5 93.5 200 4 18.7 0.4
Cattle liver 423.1 289.5 250 4 72.4 1.2
Cattle fat 100.0 32.5 53 37 2.3 1.2
Sheep muscle
103.4 33.6 373 11 12.5 0.4
Sheep kidney
93.3 50.5 200 4 10.1 0.2
Sheep liver
154.1 80.1 250 4 20.0 0.3
Sheep fat 100.0 32.5 70 37 2.3 1.2
GECDE 82.7b

23
dietary exposure. In this case, it was cattle liver, cattle kidney and cattle fat. To avoid double-
counting the amount of offal consumed, the values for sheep for these organs were not
included in the total estimate. The main contributor to the estimated chronic dietary exposure
to triclabendazole was cattle liver.
Dietary exposure values can be calculated for both the general population and children. Table
5 shows the results for the general population; results for children are not given here, as
children have lower consumption of offal (see Table 4).
5.2 Monepantel
The proposed chronic dietary exposure model was applied to the anthelminthic monepantel
based on residue concentrations from the depletion curve at the 28th day after treatment for
sheep, using the approach detailed above; however, this calculation was straightforward, as
only one animal species was included. The GECDE was calculated to be 275 µg/person per
day (Table 6) using the high exposure value for sheep liver and the mean exposures for all
other foods. The main contributor to the estimated chronic dietary exposure was sheep liver.
Table 6. GECDE for monepantel for sheep (general population)
Food categories
Median residue
concentration from
regression line (µg/kg)
Corrected residue
concentration (µg/kg)a
Food consumption, high chronic
(g/day)
Food consumption, mean chronic
(g/day)
High chronic exposure
(µg/person per day)
Mean chronic exposure
(µg/person per day)
Sheep muscle 76.0 71.4 373 11 26.6 0.8
Sheep kidney 169.0 240.7 200 4 48.1 1.0
Sheep liver 595.0 847.4 250 4 211.9 3.4
Sheep fat 1156 1646.4 70 37 115.3 60.9
GECDE 274.6b
a The correction includes the ratio of marker residue concentration to total residue concentration for each tissue and the molecular weight correction. Total residue = marker residue/ratio (marker/total) × molecular weight correction. Ratios of 1.0 for muscle and 0.66 for kidney, liver and fat. Molecular weight correction of 0.94.
b The GECDE is the sum of the highlighted values for high chronic exposure and mean chronic exposure.
Dietary exposure values can be calculated for both the general population and children. Table
6 shows the results for the general population; results for children are not given here, as
children have lower consumption of offal (see Table 4).
5.3 Comparison of the approach for chronic dietary exposure assessment used by JMPR with the current and proposed JECFA models
For comparison with the existing JMPR approach for estimating chronic dietary exposure to
pesticide residues, the chronic exposures for the two chemicals used in the examples above
were recalculated using the JMPR method. Chronic dietary exposure assessments for pesti-
cide residues in food commodities, including those from animal origin (arising from the use
of pesticides on foodstuffs used as feed), are conducted by JMPR for each pesticide residue
by multiplying the concentration of residues (STMR concentration found in the studies) by
the average daily per capita consumption for each commodity from the 13 GEMS/Food
consumption cluster diets (http://www.who.int/foodsafety/chem/gems/en/index1.html). The

24
international estimated daily intake (IEDI) for a compound in each cluster diet is the sum of
the per capita dietary exposure from the consumption of all commodities for each diet.
Table 7 shows the chronic dietary exposure assessments for monepantel (evaluated at the
seventy-fifth meeting of JECFA) and triclabendazole (evaluated at the seventieth and
seventy-fifth meetings of JECFA) calculated using the current model diet (EDI), the proposed
model diet (GECDE) and the cluster diet approach (IEDI) for one withdrawal period (days
after treatment). The Expert Meeting did not receive adequate consumption data to develop a
model that could report specific values for sheep fat, liver and kidney. Therefore, in this case,
the larger categories, mammalian fat, mammalian liver and mammalian kidney, were used in
the estimation of the GECDE. This is likely to lead to an overestimation of the exposure for
monepantel, which is used only in sheep. The IEDI approach aims to reflect the average long-
term exposure of the total population to a residue from a wide range of food commodities and
is not expected to reflect the long-term exposure of habitual consumers of specific commodi-
ties. The predicted dietary exposure using the IEDI approach tends to be lower in value than
that predicted using the EDI and GECDE approaches.
Table 7. Comparison of chronic dietary exposure assessments for monepantel and triclabendazole
Food categories
Median total residue (µg/kg)
Dietary exposure (µg/person per day)
Current model diet (EDI)
Proposed modela (GECDE)
Cluster dietb,c (IEDI)
Monepanteld (13 days after
treatment)
Sheep muscle 71 191.7 274.6 5.9 (cluster B)
Sheep kidney 241
Sheep liver 847
Sheep fat, subcutaneous 1646
Triclabendazolee (28 days after
treatment)
Cattle muscle 65.2 54.8
(cattle only)
82.7 8.9 (cluster M)
Cattle kidney 93.4
Cattle liver 289.5
Cattle fat 32.5
Sheep muscle 33.6 22.2
(sheep only) Sheep kidney 50.5
Sheep liver 80.1
Sheep fat 32.5 a Consumption data on mammalian fat, kidney and liver, cattle and sheep muscle (see Tables 5 and 6). b IEDI for the cluster diet with the highest value. c The GEMS/Food consumption cluster diet does not include consumption data for sheep liver and kidney. d Total residue = maker residue/ratio (marker/total) × molecular weight correction. Ratios of 1.0 for muscle and 0.66 for kidney,
liver and fat. Molecular weight correction of 0.94. e Total residue = marker residue/ratio (marker/total) × bioavailability. Ratios of 0.32, 0.24, 0.14 and 0.4 for cattle muscle,
kidney, liver and fat and of 0.4, 0.24, 0.25 and 0.4 for sheep muscle, kidney, liver and fat. Bioavailability of 13%.

25
5.4 Illustration of the proposed approach for chronic dietary exposure assess-ments using the example of colistin1
Estimates of TMDI and EDI values for the antimicrobial colistin, based on the residues
monograph considered by the sixty-sixth meeting of JECFA in 2006 (FAO/WHO, 2006b),
are provided in Tables 1 and 2 of this report. For comparison, the same data have been used
to derive GECDE values for the general population, children and infants.
Residues of colistin reported in the residues monograph were below the LOQ for the method
of analysis in most tissues of most species. Low but quantifiable residues were detected in the
fat of orally treated rabbits and in eggs of laying hens treated by intramuscular injection.
Quantifiable residues of colistin were also found in cows’ milk following intramammary
infusion and intramuscular injection. As a consequence, the highest residue values reported in
Table 2 also represent the only residue values that need to be taken into consideration in the
GECDE assessments. This allows for direct comparison between the EDI and GECDE.
The ADI for colistin is 0–7 µg/kg bw. The TMDI value for colistin, based on MRL values,
was 229 µg/person per day (3.8 µg/kg body weight per day for a 60 kg adult). Using median
residue values, the EDI value was 56.9 µg/person per day (1.0 µg/kg body weight per day for
a 60 kg adult). The GECDE values for adults, children and infants are 53.8 µg/person per day
(0.9 µg/kg body weight per day for a 60 kg adult), 18.2 µg/person per day (1.2 µg/kg body
weight per day for a 15 kg child) and 10.3 µg/person per day (2.1 µg/kg body weight per day
for a 5 kg infant) (Tables 8 and 9).
Table 8. Assessment of GECDE for colistin for the general population
Food type as raw commodity (including food consumed processed)
Food consumption (g/day) Median residue (µg/kg)a
Exposure from each food (µg/day)
Mean chronic High chronic
High consumers
Mean total population
Mammalian muscle
Beef and other bovines 127 325
Pork and other porcines 69 428
Sheep and other ovines 11 373
Goat and other caprines 5 401
Horse and other equines 2
Rabbit 5
All mammalian muscle 158 428
Mammalian trimmed fat, skin and added fat
37 70 82 7.2 3.8
Mammalian offal
Mammalian liver 4 250 38 11.9 0.2
Mammalian kidney 4 200 145 36.3 0.7
Mammalian lung
All mammalian offal 14 250
1 It should be noted that this example was selected because data were available from a recent JECFA evaluation,
even though the ADI for colistin was based on an acute end-point. The goal of the exercise was to compare the
outcomes of different approaches to estimating dietary exposure with the ADI, not to discuss the hazard
characterization.

26
Food type as raw commodity (including food consumed processed)
Food consumption (g/day) Median residue (µg/kg)a
Exposure from each food (µg/day)
Mean chronic High chronic
High consumers
Mean total population
Fish and seafood
Fish 57 1000
Crustaceans 5 376
Molluscs 15 325
All fish and seafood 80 237
Poultry muscle 131 300 38 14.3 6.2
Poultry fat and skin 37 43
Poultry offal 10 188
Eggs (all) 71 150 24 4.5 2.1
Milk 378 1057 11 14.5 5.2
Honey 2.5 140
Mean exposure from all foods 18.3
µg/day per person
Mean exposure for adult of 60 kg body weight 0.3 µg/kg body weight per day
GECDE 53.8 µg/day per person
GECDE for adult of 60 kg body weight 0.9 µg/kg body weight per day
a The colistin residues were measured by a microbiological method that does not report all analytes. As the marker residue colistin A + B represents approximately 80% of the microbiologically active residues, the marker/total ratio of 0.8 is incor-porated into the calculation of dietary exposure estimates to ensure that they correctly reflect residues of microbiological concern.
Table 9. Assessment of GECDE for colistin for children and infants
(a) Children
Food type as raw commodity (including food consumed processed)
Food consumption (g/day) Median residue (µg/kg)a
Exposure from each food (µg/day)
Mean chronic High chronic
High consumers
Mean total population
Mammalian muscle
Beef and other bovines 39 88
Pork and other porcines 25 90
Sheep and other ovines 13
Goat and other caprines
Horse and other equines
Rabbit
All mammalian muscle 57 90
Mammalian trimmed fat, skin and added fat
9 30 82 3.1 0.9
Mammalian offal
Mammalian liver 0.04 38 0.0
Mammalian kidney 0.05 145 0.0
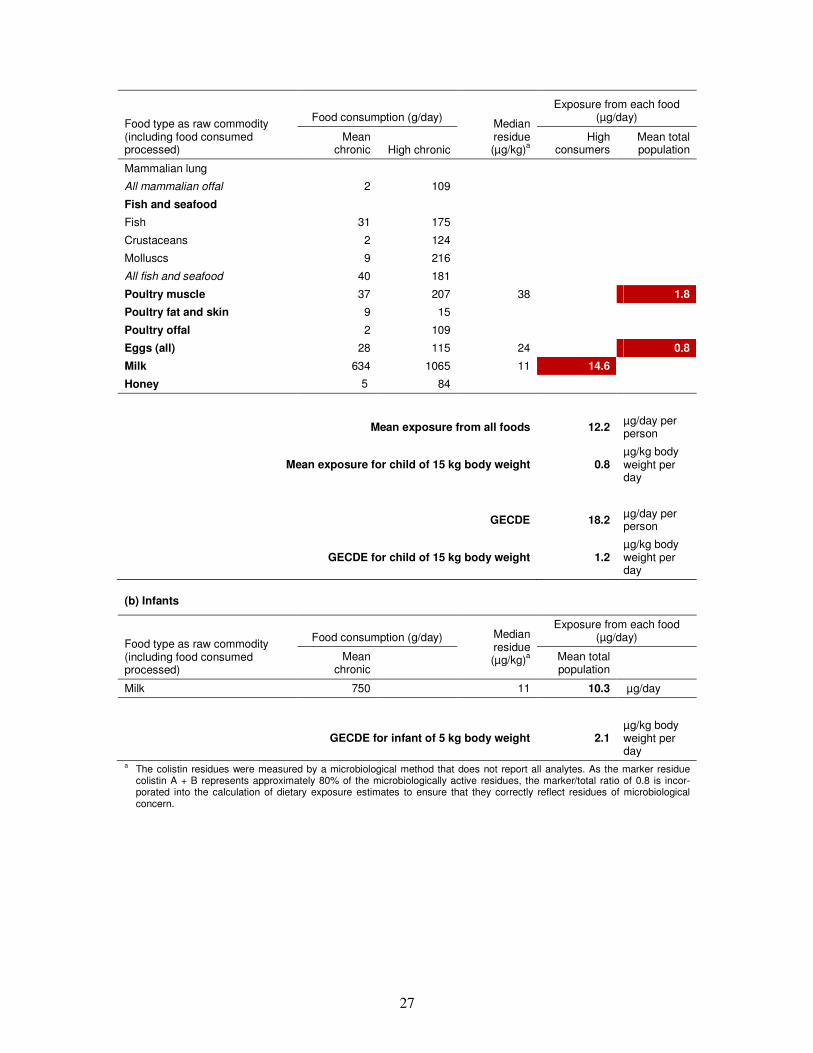
27
Food type as raw commodity (including food consumed processed)
Food consumption (g/day) Median residue (µg/kg)a
Exposure from each food (µg/day)
Mean chronic High chronic
High consumers
Mean total population
Mammalian lung
All mammalian offal 2 109
Fish and seafood
Fish 31 175
Crustaceans 2 124
Molluscs 9 216
All fish and seafood 40 181
Poultry muscle 37 207 38 9.8 1.8
Poultry fat and skin 9 15
Poultry offal 2 109
Eggs (all) 28 115 24 3.5 0.8
Milk 634 1065 11 14.6 8.7
Honey 5 84
Mean exposure from all foods 12.2 µg/day per person
Mean exposure for child of 15 kg body weight 0.8 µg/kg body weight per day
GECDE 18.2 µg/day per person
GECDE for child of 15 kg body weight 1.2 µg/kg body weight per day
(b) Infants
Food type as raw commodity (including food consumed processed)
Food consumption (g/day) Median residue (µg/kg)a
Exposure from each food (µg/day)
Mean chronic
Mean total population
Milk 750 11 10.3 µg/day
GECDE for infant of 5 kg body weight 2.1 µg/kg body weight per day
a The colistin residues were measured by a microbiological method that does not report all analytes. As the marker residue colistin A + B represents approximately 80% of the microbiologically active residues, the marker/total ratio of 0.8 is incor-porated into the calculation of dietary exposure estimates to ensure that they correctly reflect residues of microbiological concern.

28
6. Limitations, assumptions and uncertainties in dietary exposure estimates for veterinary drug residues
The development of an exposure model is dependent on the availability of food consumption
data and on the statistical methods available to evaluate them. It is also necessary to consider
the appropriate residue data (median, high concentration or MRL) for use in dietary exposure
calculations.
6.1 Food consumption data
Food consumption data available at the national level are gathered for many purposes,
including nutritional and economic, but seldom for the purpose of the dietary exposure
assessment of food chemicals. This means that the ways in which the data are collected,
summarized and presented may not always be relevant to the categories of food for which
veterinary drug residue data are available. Particular data limitations are briefly described
below.
• Level of food classification
Depending on the purpose of the survey and the degree of aggregation of the reported results,
information about consumption of specific categories of food may or may not be available. In
particular, some surveys may record consumption of products from specific animal species
such as beef, lamb and pork, whereas others may record “meat and meat products” only. This
means that when selecting data for use in a dietary exposure assessment, either the highest
level of food grouping must be selected, resulting in loss of specificity, or lower food
classification levels are used, which may result in data gaps for some data sets.
Data for fat are not always available, and assumptions may need to be made about the pro-
portion of meat product that is trimmable fat (e.g. 10% poultry or 20% meat). Consumption
of dairy products (cream, cheese, butter, etc.) has been incorporated into the consumption
figure for milk in some countries that express these products as whole milk equivalents,
assuming set conversion factors. If consumption is not reported in this way, conversion
factors would need to be applied to the amounts of processed dairy products consumed.
In general, there may be some difficulties in matching food consumption data to the defini-
tions of the commodities used in veterinary drug residue evaluations (see Glossary).
• Composite foods
Food consumption surveys usually record amounts of food “as eaten”, so that products
derived from animal products (e.g. cheese or yoghurt) and composite foods that may include
animal products as ingredients (e.g. sausages or casseroles) are recorded separately from
direct consumption of meat offal, eggs or milk. In such cases, it is necessary to convert the
consumption of animal products in processed foods and composite foods back to the raw
animal product equivalent amount using “recipe” data. Some food consumption surveys do
not distinguish between animal products in composite and processed foods and those con-
sumed directly, which results in a further source of uncertainty in the models.

29
These consumption data need to be incorporated into the total consumption figure for each
raw animal product included in the chronic exposure model.
• Representation of high-level consumers
There is variability in the amounts of animal products consumed by individuals that should be
taken into account when considering both acute and chronic dietary exposures to food
chemicals. Surveys that report per capita consumption only will underestimate consumption
of food by consumers of that food, in particular by high-level consumers. Many sets of
survey data do report high-level consumption, but the value provided may be a 90th, 95th,
97.5th or some other percentile. The maximum is seldom used, because it is considered
statistically unreliable. In order to provide consistency, the 97.5th percentile value for
consumers only of the food of interest has been chosen whenever available for use in dietary
exposure estimates for veterinary drug residues. GEMS/Food compiles a large portion size
database of 97.5th percentile food consumption amounts based on 1-day records that are
suitable for use in acute dietary exposure estimates. In this case, if records are available for
individuals participating in the survey for more than 1 day, each of their 1-day records is
treated as a separate record, and the individual is counted as a consumer of the food of
interest if he or she reported consuming that food on the day of the record.
The choice of the 97.5th percentile to represent high consumers of a single food in the
chronic dietary exposure model was justified by its application for a single commodity
(instead of two, as for other food chemicals), noting that in this case, this value should be
derived from food consumption records reported in surveys of 2 or more days’ duration by
first calculating the average food consumption amount per day over the number of survey
days. In this case, an individual is counted as a consumer of the food of interest if he or she
reported consuming that food on 1 or more of the survey days.
Another reason was that the 97.5th percentile of food consumption was more commonly
reported in the data submitted. However, the experts recognized that the 90th or 95th
percentile can also be considered to represent chronic (regular) high consumption. It should
be noted that for infrequently consumed foods, the number of consumers could be insufficient
to calculate a reliable high percentile. In any case, it is essential to document information on
the number of consumers on which the percentiles are based.
• Duration of food consumption survey
In general, for infrequently consumed foods in particular, as the duration of the survey
increases, the number of consumers counted increases (a survey participant is counted as a
consumer of the food of interest if he or she reported consumption on 1 or more days of the
survey), but the average daily consumption amount decreases. It was noted that for very
infrequently consumed foods, even the use of 2- to 7-day survey data might underestimate the
true number of consumers and overestimate true consumption in the longer term.
If data on the amounts consumed (portion size) and frequency of consumption (days on
which eaten) are available, then it may be possible to extrapolate the average consumption
over any time period (Slob, 2006). Other statistical techniques may also be applied if the
original raw population data are available (Carrington & Bolger, 2001). The subject of
extrapolating dietary data to estimate “usual” food consumption amounts or dietary exposure
has been reviewed by van der Voet & van Klaveren (2010), Kipnis et al. (2009), Zhang et al.

30
(2011) and Tooze et al. (2006, 2010). Unfortunately, most data made available to the Expert
Meeting were summarized survey data, not allowing such extrapolations.
• Age of subject
The most common age banding for reporting consumption by children was found to be 2–6
years, and so this was adopted as a standard for the dietary exposure models. However, in
order to make best use of available data, all children’s data were considered, even if the age
range reported did not fit exactly with the standard age category.
Very few food consumption data for infants were provided by contributing countries. As a
consequence, a single figure approach, based on the WHO default assumptions for a 3-
month-old infant of consumption of 0.75 litre of infant formula and a body weight of 5 kg
(WHO, 2011), was proposed for use in both acute and chronic dietary exposure estimates.
• Body weight correction
For many surveys, food consumption data are not reported on a gram per kilogram body
weight basis, calculated on an individual basis. However, these data may be available upon
request to submitting countries. Using food consumption data expressed per kilogram body
weight is the most accurate and preferred data set for use in generating dietary exposure
estimates that are directly comparable with the relevant health-based guidance value, such as
the ADI.
When data are reported only on a gram per day basis, they must be corrected using either a
record of an individual’s body weight or an average body weight for that age group. The
former method is the preferred one. In the latter case, if the survey covers a wide range of
ages, then the use of average body weight for the whole population may result in an over-
estimation of dietary exposure in individuals with lower actual body weights and an under-
estimation of dietary exposure in individuals with higher body weights. Average body
weights by country are to be made available shortly on the WHO JECFA web site.
6.2 Residue data
It is anticipated that the MRL value could occur in food only where a food product consists
entirely of an unprocessed tissue, such as a steak. For a food sourced from different animals
that is mixed before entering the food-chain, it is assumed that the residue would be
distributed throughout a batch of product and the residue concentration would not be higher
than in the raw commodity. In such circumstances, the median residue concentration from
depletion studies could be considered to represent the maximum concentration in the
commodity offered for sale instead of using the maximum residue concentration from an
individual sample analysed prior to the mixing process. This may apply to milk and to prod-
ucts that are mixed, but should be assessed on a case-by-case basis. However, for evaluations
at an international level, it was considered that the high residue concentration should be
selected for all commodities for use in acute dietary exposure estimates, because some
countries do not produce food in this way. As these details are often unknown, this represents
a source of uncertainty in the data.
The chronic dietary exposure model relates to long-term exposure. In accordance with the
conclusions of the sixty-sixth meeting of JECFA (FAO/WHO, 2006b), the median value or

31
the upper limit of the 95% confidence interval of the median from depletion studies should be
used in exposure estimates, because consumers are unlikely to be repeatedly exposed to
tissues containing the MRL in the longer term. It was noted that in the absence of reliable
occurrence data, it must be assumed that all foods in an individual’s diet contain the residue
of concern at the median concentration and at all times. In reality, only a proportion of the
supply of animal products in the food-chain will contain residues of veterinary products, and
so this represents a conservative assumption.
6.3 Modelling methods
Modelling uncertainties relate to the statistical methods available for summarizing and
managing data. Ideally, the original individual daily food consumption records from dietary
surveys would be available in a database that could be interrogated to answer specific
questions. The reality is that often only summary data (population means, percentiles, etc.)
are available at an international level, and so methods are required that generate the best
representation of the likely results of more realistic exposure models.
In this proposed approach for chronic dietary exposure assessment, the highest reported mean
consumption values were selected for different animal species from countries contributing
data. Therefore, the addition of mean consumption amounts for animal species for a total con-
sumption amount for each commodity is likely to result in a higher total value than would be
found in any one country (e.g. adding beef, pork, ovine and other muscle consumption to
create a total mammalian muscle consumption figure).
6.4 Uncertainty analysis
The International Programme on Chemical Safety (IPCS) Harmonization Project, Guidance
document on characterizing and communicating uncertainty in exposure assessment, which
was published in December 2008, recommends a tiered approach to the evaluation of uncer-
tainties in exposure assessment (IPCS, 2008). This could be applied to estimation of acute
and chronic exposures to veterinary drug residues in food. A simple qualitative uncertainty
table is recommended in EFSA guidelines to provide methods for addressing uncertainties in
dietary exposure assessment (EFSA, 2006).
32
7. Discussion, conclusions and recommendations for further development
7.1 Discussion and conclusions
The Expert Meeting reviewed the current model diet in the light of data submitted on mean
total consumption for different population groups and noted that for some food commodities
in some countries, actual food consumption data at the 97.5th percentile (one person-day data
or averaged over survey duration) were higher per person per day than those used in the
current model diet to represent a high level of consumption. In some cases, the current model
diet may not be as conservative as previously assumed.
The experts noted that a model cannot be both simple and accurate and that simplifying the
model may lead to higher exposure estimates.1 From the data available, the Expert Meeting
concluded that it was not helpful to simplify the current model diet, as it would not result in
an improvement in the accuracy of either acute or chronic dietary exposure assessments.
Rather, to enable a more accurate dietary exposure estimate, the list of foods in the new
approach was expanded to incorporate available food consumption data for different animal
species where sufficient data were available. This expansion of the list of foods was consid-
ered to be an improvement on the previous simplified model. Moreover, the experts’ analysis
of the simplified model showed that replacing the default food consumption estimates with
actual food consumption figures failed to demonstrate the predicted decrease in modelled
estimates of dietary exposure to veterinary drug residues.
A template of food commodities was developed that could be used in assessments of both
acute and chronic dietary exposure to veterinary drug residues. For acute dietary exposure
assessments, each food is evaluated singly, and for chronic dietary exposure assessments, all
foods for which residue data are available are included in the constructed model diet. Food
consumption amounts were derived for the general population aged 2 years and over, for the
subpopulation of children aged 2–6 years and for infants (milk only), for mean and high
consumers of each food.
Worked examples were completed using information available at the seventy-fifth meeting of
JECFA to illustrate the proposed new approach to determining chronic dietary exposure
estimates. A comparison with the current JMPR approach for chronic dietary exposure
assessments was also made, noting that the proposed approach for JECFA aims to take a
habitual high consumer of a single food into account, whereas that for JMPR is an estimate
for the average population. This difference can be explained by the larger number of food
commodities generally under consideration for pesticide residues and was noted by the JMPR
Secretariat to be the subject of further discussions within JMPR.
The Expert Meeting noted that the currently available data did not support the development
of a constructed model diet for different regions of the world.
1 A simplified model for chronic dietary exposure estimation was submitted by Canada when the draft of this
report was posted for public comment (see Annex 7). The experts recognized its validity and noted that it would
lead to slightly higher exposure estimates.

33
The development of newer dietary exposure models for veterinary drug residues requires the
incorporation of both new data and updated approaches to dietary exposure assessment. Food
consumption database managers in approximately 50 Member countries have provided
significant amounts of data, but the presentation of many of the data is inconsistent in terms
of the level of description of food categories, the methods of data collection, handling of raw
versus processed products and the provision of individual body weight–corrected data. This
means that a further round of data collection will be required, and it is hoped that this will
bring in data from additional countries.
A consequence of this inconsistency is that the data currently provided in the acute and
chronic dietary exposure models must be considered provisional until the final data sets have
been audited and the modelling methods validated.
The development of a new dietary exposure modelling approach for veterinary drug residues
that was simple to use and yet provided conservative estimates of both acute and chronic
dietary exposure, while reflecting national differences in food consumption patterns, pre-
sented a considerable challenge. Therefore, the proposed approaches will need careful evalua-
tion before being adopted for routine use.
7.2 Recommendations for further development
Recommendations for further work to enable the evaluation of the approaches for acute and
chronic dietary exposure assessment for veterinary drug residues proposed in this report are
listed below.
7.2.1 Data requirements
This description of a proposed new approach to estimating dietary exposures to veterinary
drug residues is based on information made available by Member countries responding to a
call for data in 2010. At that time, it was not possible to provide a detailed specification for
the information required. Now that a proposed model structure is available, there is an
opportunity to improve the model by expanding the scope of and level of detail in the food
consumption data.
• National data
There are currently insufficient data from different world regions to support a regional diet
approach. Additional information from more countries spread across global regions would
allow a more representative model diet. With more national data available, the potential for a
regional diet approach could be explored in the future.
• Level of food classification
Some countries have been able to provide data on food consumption described at the animal
species level, such as beef, pig or sheep liver. For other countries, only composite data, such
as “mammalian liver” or “liver and offal”, are available. This issue particularly affects
European countries, where EFSA’s Comprehensive Food Consumption Database does not
provide species-categorized data. More species-specific data would improve precision in both
acute and chronic models by better linking the models to actual residue concentrations in the
tissues in which they may occur.

34
• Individual body weight correction
Within the general population and for children aged 2–6 years, there is a wide range of body
weights. Therefore, dividing food consumption data presented on a gram per day basis by
population-average body weights rather than individual body weights introduces uncertainty.
Many countries have already provided food consumption data on a gram per kilogram body
weight per day basis, where each individual in the survey has had his or her food consump-
tion corrected for his or her individual body weight. Obtaining more individual body weight–
corrected data would allow an increase in the accuracy of the acute and chronic dietary
exposure assessment methods.
• Food consumption data age ranges
Food consumption surveys may contain data on varying age ranges depending on the purpose
of the survey. For the acute and chronic veterinary drug residue exposure models, the key
groups have been identified as the general population (i.e. all potential consumers of solid
foods aged 2 years and over), children between the ages of 2 and 6 years and infants 0–3
months of age (consuming entirely milk or formulated products). The precision of the
exposure models would be improved if database managers could provide data that correspond
better to these age categories.
• Less frequently consumed foods
Tissues such as liver and kidney or minor species such as rabbit or quail, which can be
consumed in significant portions on eating occasions, may be consumed relatively infre-
quently. There are also other tissue types (e.g. lung, intestine, heart) and species (e.g. horse
and some fish species that may be farmed) for which limited or no data are available from
individual surveys.
Basing food consumption estimates on surveys of only a few days’ duration may result in a
significant underestimation of the proportion of consumers consuming that food (or miss
them entirely), while significantly overestimating average daily consumption in the longer
term for those who do report consumption. Moreover, the limited number of eating days
during the survey makes it difficult to assess high percentiles of both acute and chronic
consumption for infrequently consumed foods. Improved estimates of true long-term
consumption of such foods can be derived by combining portion sizes with food frequency
data. Obtaining national information about portion sizes and frequency of consumption of
certain tissues and minor species would improve the accuracy of the acute and chronic dietary
exposure estimates. In the absence of such data, the consumption value for the more generic
food category should be used (e.g. all mammalian offal), with various high percentiles, such
as the 90th, 95th and 97.5th, reported with the corresponding number of consumers and
number of days of survey duration on which they were based. Such an approach would cover
the substitution between food items from the same category occurring over the long term for
a high consumer of offal, but may overestimate the exposure of the high consumer of a single
specific food item within the food category.
• Composite foods
Individual food consumption surveys are often conducted at the level of foods “as eaten” so
that meat pies, soups, cakes and pastries are recorded separately from meat and other specific

35
animal products. As a consequence, it is necessary to estimate the meat, milk and egg content
from composite foods in order to provide total consumption for the exposure model. Many
data providers have national “recipe databases” that enable composite foods to be subdivided
into their constituent parts. Obtaining food consumption data broken into their constituent
animal product components would improve the precision of the acute and chronic dietary
exposure assessment models.
• Data audit and verification
Before the models can be applied in veterinary drug residue risk assessments, it is necessary
to ensure that the data contained in them are reliable. This can be undertaken in three steps:
1) Check all values in the dietary exposure models against the original values provided by
national database managers.
2) Confirm with national database managers the nature of the data provided (survey days
over which averaged, whether individual body weight applied, etc.) and seek confirma-
tion that values used to represent total consumption (raw plus processed products) for
each category reflect the database managers’ understanding of the data.
3) Before finalizing the food consumption databases, FAO/WHO should consider a policy to
manage data sets where there are too few data points to make reliable estimates of high-
percentile food consumption. If necessary, high-percentile consumption estimates based
on too few data points may be removed.
7.2.2 Approaches for dietary exposure assessment
The methods proposed for estimating acute and chronic dietary exposures to veterinary drug
residues reflect a compromise between complex computer-based models utilizing raw
individual data from food consumption surveys and simple, practical tools for making quick,
conservative estimates. They are based on current practice in other sectors, such as food
additives and pesticide residues, even if the methods are not strictly similar, and are intended
to provide statistically robust approaches that make optimal use of the available data.
However, there will always be scope for further development, and in particular some of the
underlying assumptions warrant further consideration. There is also a need to better under-
stand how the methods relate to actual consumer exposures so that the degree of conservatism
(assuming this is present) can be assessed and, if possible, quantified.
• Taking consumers of foods into account
For veterinary drug residues with acute toxicity, the dietary exposure is calculated for a single
food, taking a high level (97.5th percentile) of consumption of each of the foods nominated to
contain the veterinary drug residue over one meal or 24 hours for consumers of that food
only.
Normally, for a single data set, it is considered valid to add mean exposures from different
foods together to get a total mean chronic dietary exposure for the total population (i.e.
consumers and non-consumers), but it is not considered valid to sum the exposure for
consumers only of each food to derive a total chronic dietary exposure, as the consumers are
drawn from different subpopulations, and the total amount of food assumed to be consumed
would be unrealistically high.

36
The chronic model is a constructed model diet that aims to take account of people who
consistently consume one food or food group at a high level over a long period of time. It is
based on estimates of mean consumption for all individuals in a population and high-level
consumption by consumers only of one food, that one food being selected from all those
nominated to contain the veterinary drug residue, because it is likely to give rise to the
highest dietary exposure for a high consumer of the food. This is done because the compara-
tive exercise on national-level data (see Annex 4) indicates that, in most cases, a constructed
model such as the one proposed gives a similar answer to one based on the same data set but
using a calculated high percentile of dietary exposure from distributional data for individuals.
Obviously, if distributional data are available at a national level, it would be preferable to use
the full data set to determine high percentiles of dietary exposure to veterinary drug residues,
not the proposed model. At an international level, however, this model is proposed as a
“proxy”, as individual data are not available for use for all regions in the world by com-
mittees such as JECFA. However, this approach may introduce some uncertainty into the
method, and so its consequences require further investigation (see section on uncertainty
analysis below).
• Veterinary drugs with other uses or occurrence
Certain substances used in veterinary medicines may also be used in other product types,
such as pesticides, or may occur in natural products or as contaminants (e.g. in drinking-
water). The acute and chronic exposure models require expansion and modification so that
such simultaneous occurrence can be incorporated into the models.
• Background exposure in acute exposure modelling
The acute exposure model makes the assumption that the distribution of occurrence of
veterinary residues in food is such that it is unlikely that a consumer will be exposed from
more than one significant source during an acute exposure episode. However, there may be
other residues present, or there may be background uptake resulting from previous long-term
exposure. The possible effect of background exposure on estimates of acute exposure
requires further investigation.
• Uncertainty analysis and conservatism
All of the input variables and the model itself are subject to uncertainty. The current report
includes an initial evaluation of uncertainty as recommended in IPCS (2008) guidelines.
However, the quantitative impact of uncertainties within the data and methods and their
impact on results require further consideration. This will allow the degree of conservatism
associated with the method to be assessed and quantified. In particular, estimation of actual
exposure based on monitoring data for veterinary drugs should be useful to quantify the
degree of conservatism of median residue values for long-term exposure assessment. The
Expert Meeting noted that monitoring data are likely to be available only at a national level
and that for many veterinary drugs, the MRL is set at or near the limit of reporting.
• Development of worked examples
Additional worked examples will provide a means of identifying the strengths and weak-
nesses of the proposed approaches.
37
• Testing and evaluation
The proposed approaches for acute and chronic dietary exposure assessment have been
compared with results that would be obtained using the current model diet approach in a
limited number of cases. Further comparisons are required to investigate the full utility of the
new methods and identify areas where further refinements may be required. There is also a
need to evaluate the approaches against results that would be obtained using individual data
from food consumption surveys at a national level.
As stated in the Introduction, the purpose of this report is not to describe the process for
deriving MRLs for veterinary drugs. However, if adopted by JECFA, the approaches
described in this report would be used in estimating dietary exposures to veterinary drug
residues. Consideration should be given to the potential impact that this would have on the
MRLs that can be recommended.
• Need for periodic review
Food consumption patterns change, and food consumption surveys are constantly being
renewed. This means that revised estimates of the amounts of food consumed for the food
categories considered can be anticipated in the future. However, given the conservatism
associated with the current approach, any such revised food consumption estimates may not
be meaningful in terms of the results. Thus, any updates of food consumption data should be
evaluated within the context of the uncertainty analysis and the models revised only if the
change is likely to be meaningful.
Periodic review will be necessary to take account of cumulative changes in food consumption
data and developments in the science of exposure analysis. Therefore, it is recommended that
a review of the methods be undertaken on a regular basis, and no less than every 10 years.

38
References
Carrington CD, Bolger PM (2001). Methods for projecting long-term dietary exposure from short-
term survey data for environmental contaminants. Toxicology and Industrial Health, 17:176–179.
Counil E, Verger P, Volatier J-L (2006). Fitness-for-purpose of dietary exposure duration: a case-study with the assessment of exposure to ochratoxin A. Food and Chemical Toxicology, 44:499–509.
EFSA (2006). Guidance of the Scientific Committee on a request from EFSA related to uncertainties
in dietary exposure assessment. The EFSA [European Food Safety Authority] Journal, 438:1–54
(http://www.efsa.europa.eu/de/scdocs/doc/438.pdf).
EFSA (2008). Guidance document for the use of the Concise European Food Consumption Database
in exposure assessment. Parma, European Food Safety Authority (EFSA/DATEX/2008/01;
http://www.efsa.europa.eu/en/datex/docs/datexfooddbguidance.pdf).
EFSA (2010). Management of left-censored data in dietary exposure assessment of chemical
substances. EFSA [European Food Safety Authority] Journal, 8(3):1557 (http://www.efsa.europa.eu/
en/efsajournal/doc/1557.pdf).
EFSA (2011). Use of the EFSA Comprehensive European Food Consumption Database in exposure
assessment. EFSA [European Food Safety Authority] Journal, 9(3):2097 (http://www.efsa.europa.eu/
en/efsajournal/doc/2097.pdf).
FAO (2010). Evaluation of data on ractopamine residues in pig tissues. In: Residue evaluation of
certain veterinary drugs. Rome, Food and Agriculture Organization of the United Nations (FAO
JECFA Monographs, No. 9; http://www.fao.org/ag/agn/agns/jecfa/JECFAMonographs9.pdf).
FAO/WHO (1988). Evaluation of certain veterinary drug residues in food (Thirty-second report of
the Joint FAO/WHO Expert Committee on Food Additives). Geneva, World Health Organization
(WHO Technical Report Series, No. 763).
FAO/WHO (1989). Evaluation of certain veterinary drug residues in food (Thirty-fourth report of the Joint FAO/WHO Expert Committee on Food Additives). Geneva, World Health Organization (WHO
Technical Report Series, No. 788).
FAO/WHO (1993). Evaluation of certain veterinary drug residues in food (Fortieth report of the Joint
FAO/WHO Expert Committee on Food Additives). Geneva, World Health Organization (WHO
Technical Report Series, No. 832).
FAO/WHO (2006a). Updating the principles and methods of risk assessment: MRLs for pesticides
and veterinary drugs. Rome, Food and Agriculture Organization of the United Nations
(http://www.fao.org/ag/AGP/AGPP/Pesticid/JMPR/DOWNLOAD/bilthoven_2005.pdf).
FAO/WHO (2006b). Evaluation of certain veterinary drug residues in food (Sixty-sixth report of the
Joint FAO/WHO Expert Committee on Food Additives). Geneva, World Health Organization (WHO
Technical Report Series, No. 939).
FAO/WHO (2009a). Evaluation of certain veterinary drug residues in food (Seventieth report of the
Joint FAO/WHO Expert Committee on Food Additives). Geneva, World Health Organization (WHO
Technical Report Series, No. 954).
39
FAO/WHO (2009b). Report of the Eighteenth Session of the Codex Committee on Residues of
Veterinary Drugs in Foods, Natal, Brazil, 11–15 May 2009. Rome, Food and Agriculture
Organization of the United Nations, Joint FAO/WHO Food Standards Programme, Codex
Alimentarius Commission (ALINORM 09/32/31, paragraphs 22, 135, 146 and 150).
FAO/WHO (2009c). Principles and methods for the risk assessment of chemicals in food (A joint
publication of the Food and Agriculture Organization of the United Nations and the World Health
Organization). Geneva, World Health Organization (Environmental Health Criteria 240;
http://www.who.int/entity/foodsafety/chem/principles/en/index.html). FAO/WHO (2010a). Report of the Nineteenth Session of the Codex Committee on Residues of
Veterinary Drugs in Foods, Burlington, Vermont, United States of America, 30 August – 3 September
2010. Rome, Food and Agriculture Organization of the United Nations, Joint FAO/WHO Food
Standards Programme, Codex Alimentarius Commission (ALINORM REP11/RVDF, paragraphs 72,
87–89 and 100).
FAO/WHO (2010b). Request for data on dietary intake (consumption) of standard and non-standard
animal tissues and food of animal origin (Issued 26 October 2010). Geneva, World Health
Organization (http://www.who.int/foodsafety/chem/JECFA75.pdf).
IPCS (2008) Part 1: Guidance document on characterizing and communicating uncertainty in
exposure assessment. In: Uncertainty and data quality in exposure assessment. Geneva, World Health
Organization, International Programme on Chemical Safety (Harmonization Project Document, No. 6;
http://www.who.int/ipcs/publications/methods/harmonization/exposure_assessment.pdf).
Kipnis V et al. (2009). Modelling data with excess zeros and measurement error: application to
evaluating relationships between episodically consumed foods and health outcomes, Biometrics,
65(4):1003–1010.
Slob W (2006). Probabilistic dietary exposure assessment taking into account variability in both
amount and frequency of consumption. Food and Chemical Toxicology, 44(7):933–951.
Tennant DR, Becquet P, Jans D (2009). Modelling consumer exposures to nutrients and additives in
animal products. Food Additives & Contaminants: Part A: Chemistry, Analysis, Control, Exposure &
Risk Assessment, 26(1):2–11.
Tooze JA et al. (2006). A new statistical method for estimating usual intake of episodically consumed
foods with application to their distribution. Journal of the American Dietetic Association, 106:1575–
1587.
Tooze AJ et al. (2010). A mixed-effects model approach for estimating the distribution of usual intake
of nutrients: the NCI method. Statistics in Medicine, 29(27):2857–2868.
van der Voet H, van Klaveren JD (2010). Statistical modelling of usual intake. Scientific report
submitted to European Food Safety Authority. Parma, European Food Safety Authority (EFSA-Q-
2009-00841; http://www.efsa.europa.eu/en/supporting/pub/86e.htm).
Verger P (1995). One example of utilisation of the “French approach”. Paper presented at the
International Life Sciences Institute (ILSI) Europe Workshop on Food Additive Intake, 29–30 March,
Brussels, Belgium.
WHO (2011). Guidelines for drinking-water quality, 4th ed. Geneva, World Health Organization.
Zhang S et al. (2011). A new multivariate measurement error model with zero-inflated dietary data,
and its application to dietary assessment. Annals of Applied Statistics, 5(2B):1456–1487.

40
Glossary1
Acceptable daily intake (ADI): An estimate by the Joint FAO/WHO Expert Committee on
Food Additives of the amount of a veterinary drug, expressed on a body weight basis, that
can be ingested daily over a lifetime without appreciable health risk.
Acute reference dose (ARfD)*: The estimate of the amount of a substance in food or
drinking-water, expressed on a body weight basis, that can be ingested in a period of 24 hours
or less without appreciable health risk to the consumer. It is derived on the basis of all the
known facts at the time of evaluation. The ARfD is expressed in milligrams of the chemical
per kilogram of body weight.
Edible offal: Historically considered by the Joint FAO/WHO Expert Committee on Food
Additives to include only liver and kidney. For the purposes of this report, the definition of
edible offal has been expanded to include lung.
Egg: The fresh edible portion of the spheroid body produced by female birds, especially
domestic fowl. Portion of the commodity to which the maximum residue limit applies: The
edible portion of the egg including the yolk and egg white after removal of the shell.
Estimated daily intake (EDI)**: An estimate of dietary exposure to residues of veterinary
drugs for use in the evaluation of chronic toxicity and chronic dietary exposure based on a
specific model diet and median residue concentrations, adjusted for marker total. In calcu-
lating the median from an array of results including values below the limit of quantification
or below the limit of detection, half of the respective limit is used for the calculation of
median concentrations of residues.
Fat: The lipid-based tissue that is trimmable from an animal carcass or cuts from an animal
carcass. It may include subcutaneous, omental or perirenal fat. It does not include interstitial
or intramuscular carcass fat or milk fat. Portion of the commodity to which the maximum
residue limit (MRL) applies: The whole commodity. For fat-soluble compounds, the fat is
analysed, and MRLs apply to the fat. For those compounds where the trimmable fat is
insufficient to provide a suitable test sample, the whole commodity (muscle and fat but
without bone) is analysed, and the MRL applies to the whole commodity (e.g. rabbit meat).
Fish: Any of the cold-blooded aquatic vertebrate animals commonly known as such. This
includes Pisces, Elasmobranchs and Cyclostomes. Aquatic mammals, invertebrate animals
and amphibians are not included. It should be noted, however, that this term may also apply
to certain invertebrates, particularly Cephalopods.
Food balance sheet*: Gross estimates of national per capita availability of food commodities
derived from a country’s annual food production plus imports minus exports. Food waste,
refuse, losses from spoilage and other sources of waste are not taken into account.
1 Definitions have been taken directly or with slight modification from the Codex glossary of terms and
definitions (residues of veterinary drugs in foods), CAC/MISC 5-1993, amended 2003 (not marked with an
asterisk); EHC 240 (FAO/WHO, 2009c) (marked with an asterisk); or FAO/WHO (2006b) (marked with a
double asterisk).

41
GEMS/Food consumption cluster diets*: Per capita consumption of raw and semiprocessed
agricultural commodities expressed in grams per person per day for distinct groups of the
world’s population that share similar dietary patterns. Based on FAO food balance sheet data,
the diets were generated using a cluster analysis, which assigned countries to one of the 13
cluster diets.
Health-based guidance value*: A numerical value derived by dividing a point of departure
(a no-observed-adverse-effect level, benchmark dose or benchmark dose lower confidence
limit) by a composite uncertainty factor to determine a concentration that can be ingested
over a defined time period (e.g. lifetime or 24 hours) without appreciable health risk.
International estimated daily intake (IEDI)*: A prediction of the long-term daily intake of
a pesticide residue on the basis of the assumptions of average daily food consumption per
person and median residues from supervised trials, allowing for residues in the edible portion
of a commodity and including residue components defined by the Joint FAO/WHO Meeting
on Pesticide Residues for estimation of dietary intake. Changes in residue concentrations
resulting from preparation, cooking or commercial processing are included. When informa-
tion is available, dietary intake of residues resulting from other sources should be included.
The IEDI is expressed in milligrams of residue per person.
Large portion size*: A food consumption amount that represents the 97.5th percentile con-
sumption (eaters only) of a food that is derived from individual consumer days in a food
consumption survey. This is useful in calculating acute dietary exposures.
Limit of detection (LOD)*: The minimum concentration of a component in a dietary sample
that can be qualitatively detected, but cannot be quantitatively determined, under a pre-
established set of analytical conditions.
Limit of quantification (LOQ)*: The minimum concentration of a component that can be
determined quantitatively with acceptable accuracy and consistency. It often approximates to
a value of 3 times the limit of detection.
Margin of exposure*: Ratio of the no-observed-adverse-effect level or benchmark dose
lower confidence limit for the critical effect to the theoretical, predicted or estimated expo-
sure dose or concentration.
Marker residue: A residue whose concentration decreases in a known relationship to the
level of total residues in tissues, eggs, milk or other animal tissues. A specific quantitative
analytical method for measuring the concentration of the residue with the required sensitivity
must be available.
Marker/total ratio: The ratio between the concentration of the marker residue in a tissue or
commodity and the concentration of the total residue expressed as equivalents of parent drug.
Maximum residue limit (for veterinary drugs) (MRL): The maximum concentration of
residue resulting from the use of a veterinary drug (expressed in milligrams per kilogram or
micrograms per kilogram on a fresh weight basis) that is recommended by the Codex
Alimentarius Commission to be legally permitted or recognized as acceptable in or on a food.
It is based on the type and amount of residue considered to be without toxicological hazard
for human health as expressed by the acceptable daily intake (ADI) or on the basis of a

42
temporary ADI that utilizes an additional safety factor. It also takes into account other
relevant public health risks as well as food technological aspects. When establishing an MRL,
consideration is also given to residues that occur in food of plant origin and/or the
environment. Furthermore, the MRL may be reduced to be consistent with good practices in
the use of veterinary drugs and to the extent that practical analytical methods are available.
The MRLs elaborated by the Joint FAO/WHO Expert Committee on Food Additives are
“recommended MRLs” that are forwarded to the Codex Committee on Residues of
Veterinary Drugs in Foods for consideration.
Meat: The edible part of any mammal.
Milk: The normal mammary secretion of milking animals obtained from one or more
milkings without either addition to it or extraction from it, intended for consumption as liquid
milk or for further processing. Portion of the commodity to which the maximum residue limit
(MRL) applies: Codex MRLs for fat-soluble compounds in milk are expressed on a whole
commodity basis.
Model diet*: A method used in dietary exposure assessments that assumes fixed default
consumption levels, usually for categories of foods and beverages. Model diets can be based
on hypothetical consumption data assuming maximum consumption amounts for broad food
groups (e.g. the budget method) or can be derived from national food supply or consumption
data (e.g. Global Environment Monitoring System – Food Contamination Monitoring and
Assessment Programme consumption cluster diets or total diet studies). For assessing dietary
exposure to residues of veterinary drugs, the Joint FAO/WHO Expert Committee on Food
Additives uses a set model diet consisting of 300 g muscle (or 300 g fish muscle and skin in
natural proportions), 100 g liver, 50 g kidney, 50 g tissue fat, 100 g egg, 50 g honey and 1.5
litres milk.
Muscle: The skeletal tissue of an animal carcass or cuts of these tissues from an animal
carcass that contains interstitial and intramuscular fat. The muscular tissue may also include
bone, connective tissue and tendons as well as nerves and lymph nodes in natural proportions.
It does not include edible offal or trimmable fat.
Poultry: Any domesticated bird, including chickens, turkeys, ducks, geese, guinea-fowl or
pigeons.
Residues of veterinary drugs: Include the parent compounds and/or their metabolites in any
edible portion of the animal product, and include residues of associated impurities of the
veterinary drug concerned.
Supervised trials median residue (STMR)*: The expected residue concentration in the
food commodity (expressed in milligrams of residue per kilogram of commodity) when a
pesticide has been used according to maximum good agricultural practice (GAP) conditions.
The STMR is estimated as the median of the residue values (one from each trial) from
supervised trials conducted according to maximum GAP conditions and includes residue
components defined by the Joint FAO/WHO Meeting on Pesticide Residues for estimation of
dietary intake. For some commodities, such as banana, STMR concentrations may be
determined directly from concentrations measured in the edible portion when data are
available.

43
Theoretical maximum daily intake (TMDI)*: For veterinary drugs, an estimate of dietary
exposure to residues of veterinary drugs based on a specific model diet and residue
concentrations at the maximum residue limit, adjusted for marker total; for pesticides, a
prediction of the maximum daily intake of, for example, a pesticide residue, assuming that
residues are present at the maximum residue concentrations/limits and average daily
consumption of foods per person (e.g. as represented by Global Environment Monitoring
System – Food Contamination Monitoring and Assessment Programme consumption cluster
diets). The TMDI can be calculated for the various regional or consumption cluster diets and
is expressed in milligrams of residue per person.
Tissue: All edible animal tissue, including muscle and by-products.
Total residue: For a drug in animal-derived food, the parent drug together with all the
metabolites and drug-based products that remain in the food after administration of the drug
to food-producing animals. The amount of total residues is generally determined by means of
a study using the radiolabelled drug and is expressed as the parent drug equivalent in
milligrams per kilogram of the food.
Veterinary drug: Any substance applied or administered to any food-producing animal, such
as meat- or milk-producing animals, poultry, fish or bees, whether used for therapeutic,
prophylactic or diagnostic purposes or for modification of physiological functions or
behaviour.
Withdrawal period*: The interval between the time of the last administration of a veterinary
drug and the time when the animal can be safely slaughtered for food or when milk or eggs
can be safely consumed.

44
Annex 1
Joint FAO/WHO Expert Meeting on Dietary Exposure Assessment Methodologies for Residues of Veterinary Drugs
Rome, Italy, 7–11 November 2011
List of participants
Ms Janis Baines, Food Composition, Evaluation and Modelling Section, Food Standards
Australia New Zealand, Canberra, Australia (Chair)
Professor Eloisa Dutra Caldas, Pharmaceutical Sciences Department, Faculty of Health
Sciences, University of Brasilia, Brasilia, Brazil
Dr Alison Edwards, Division of Biotechnology and GRAS Notice Review, Office of Food
Additive Safety, Food and Drug Administration, Department of Health and Human
Services, College Park, MD, USA
Dr Lynn G. Friedlander, Office of New Animal Drug Evaluation, Division of Human Food
Safety, Center for Veterinary Medicine, Food and Drug Administration, Department of
Health and Human Services, Rockville, MD, USA
Dr Catherine Leclercq, Research Group on Food Safety Exposure Analysis, Istituto
Nazionale di Ricerca per gli Alimenti e la Nutrizione (INRAN), Rome, Italy
Dr David R. Tennant, Food Chemical Risk Analysis, Brighton, England
Secretariat
Dr Masami Takeuchi, Food Safety Officer, Agriculture and Consumer Protection
Department, Food and Agriculture Organization of the United Nations, Rome, Italy
Dr Philippe Verger, WHO Joint Secretary to Joint FAO/WHO Meeting on Pesticide
Residues, Department of Food Safety and Zoonoses, World Health Organization, Geneva,
Switzerland
Ms Marla Sheffer, FAO/WHO Editor, Orleans, Ontario, Canada

45
Annex 2
Report of FAO/WHO stakeholder meeting on:
Project to review and update the principles and methodology to assess dietary exposure to residues of veterinary drugs
Rome, Italy, 7 November 2011
In order to provide an opportunity for stakeholders and interested parties to present their
views on the current project to review and update the principles and methodology to assess
dietary exposure to residues of veterinary drugs in food, the Food and Agriculture Organiza-
tion of the United Nations (FAO) and the World Health Organization (WHO) issued a public
announcement for a stakeholder meeting. Persons or organizations interested in participating
were asked to submit a written request, and interested parties were then invited to attend the
meeting.
Four of seven stakeholders participating in the meeting made presentations. The list of the
stakeholders participating in this meeting is included at the end of this report. The meeting
was attended by all members of the FAO/WHO meeting of experts on dietary exposure
assessment methodologies (see Annex 1 for list of participants) as well as participants of the
seventy-fifth meeting of the Joint FAO/WHO Expert Committee on Food Additives (JECFA)
(see Attachment 2 at the end of the stakeholder report for the list of participants). The
meeting was chaired by Ms Janis Baines, and Ms Marla Sheffer acted as rapporteur. The
agenda is attached at the end of the stakeholder report as Attachment 1. It should be noted
that the methods proposed by the Expert Meeting were not presented and discussed at the
stakeholder meeting.
Although a number of deficiencies with the existing market basket were highlighted in the
presentations, stakeholders nevertheless considered that the benefits associated with the
basket outweighed the deficiencies. The key findings, concerns and recommendations pre-
sented by the stakeholders with respect to potential changes to the way in which dietary
exposure assessments are currently conducted by JECFA, as compiled below, were provided
to the Expert Meeting on dietary exposure assessment methodologies to be considered in
their discussions. It is emphasized that these are the views presented by stakeholders at the
meeting and do not necessarily represent the views of FAO and WHO or other meeting
participants.
Advantages of current standard food basket
- It is simple to use.
- Its conservative nature compensates for differences in diet.
- As it is not influenced by changes in regional diets, it allows for maximum residue
limits (MRLs) that are harmonized across regions and across time.
46
- International harmonization of MRLs based on the current food basket facilitates
trade.
- It provides more than adequate protection for the average consumer from long-term
exposure to veterinary drug residues.
Disadvantages of current standard food basket - It overestimates the average consumer’s consumption for evaluation of chronic
exposure for most commodities and age groups.
- It underestimates consumption for evaluation of acute exposure when compared with
large portion size for numerous commodities in various regions, so use of the food
basket may not be sufficiently protective for human health for substances for which
acute toxicity is the key health concern.
- It includes only a limited number of foods.
Advantages of changing standard food basket - Regional diets and individual consumption data would more accurately reflect actual
consumption patterns.
- Improving the food basket could provide for improvements in terms of health pro-
tection.
Disadvantages of changing standard food basket
- Using regional diets and individual consumption data would be a far more compli-
cated approach.
- It is difficult for developing countries to collect detailed food consumption data for
use in deriving regional diets.
- Regional consumption factors could have a negative impact on MRL harmonization.
- The degree of uncertainty inherent in deriving acceptable daily intakes (ADIs) brings
into question the logic of using precise consumption data.
- Changing the food basket would mean continual reassessment and revision of MRLs.
As revised MRLs must be paralleled by revised withdrawal periods, this would entail
a very heavy burden for industry and regulators, resulting in a need for additional
testing. Costs associated with reviewing MRLs and withdrawal periods could lead to
reduced availability of or higher prices for veterinary drugs.
Consumption of tissues not included in standard food basket - Issues to be considered include methods for choosing tissues to be included, the need
for residue data for each tissue, and the impact on MRLs for existing tissues and the
portion of the ADI available for these (MRLs for existing tissues may need to be
decreased and withdrawal periods increased, or ADI could be distributed between
different tissues in different regions, such that MRLs would not be harmonized).
- Guideline 48 of the International Cooperation on Harmonisation of Technical
Requirements for Registration of Veterinary Products (VICH) on marker residue
depletion studies to establish product withdrawal periods offers scope for additional
tissues and establishment of withdrawal periods.
- A new tissue could be substituted for an existing tissue in the current food basket (e.g.
lung for liver). The tissues to be substituted must be appropriate for the circumstances
under consideration (e.g. lung for muscle may be appropriate in certain countries).
- Alternatively, daily intake could be calculated using a single edible meat tissue (in
addition to milk, eggs and honey), which would avoid the possibility of adding
47
numerous new tissues to a food basket, where each addition would lower the MRL in
the traditional four edible tissues (muscle, kidney, liver, fat).
- Injection sites should be treated as a separate edible tissue and not as muscle.
- It is not necessary to incorporate other tissues into the food basket, as residue
concentrations should not be higher than those in metabolically active tissues already
included in the food basket, such as liver and kidney.
Methodology for calculating MRLs - Regional MRLs should be avoided, as they do not facilitate international harmoniza-
tion and trade.
- Calculation of MRLs needs to be reconsidered, as poorer data sets may lead to higher
MRLs.
Methodology for estimating chronic and acute dietary exposure
- Median residues (for use in the calculation of the estimated daily intake, or EDI) are
appropriate for evaluating chronic dietary exposure to veterinary residues.
- Although the EDI approach is more realistic for assessing chronic exposure, the
minimum criteria that need to be met to allow its use are not clearly defined.
- The MRL (for use in the calculation of the theoretical maximum daily intake, or
TMDI) should be used to evaluate short-term (acute) dietary exposure to veterinary
residues.
- There is a need to clearly determine how to address drugs for which there are acute
toxicity concerns.
- Care should be taken in acute toxicity assessment, as animal metabolism eliminates a
lot of the risk (compared with the use of chemicals on plants).
Key discussion points
- JECFA is involved with risk assessment, not risk management. Therefore, the Com-
mittee takes only scientific principles into consideration in its deliberations, not social
and economic consequences.
- JECFA does not support the concept (as proposed by one of the stakeholders) of
“utilization of the full ADI”, due to, for example, exposure from other sources and the
general principle for compounds intentionally added to foods of using the lowest
concentration to achieve the intended technical purpose. This position is reflected in
the presentation of the ADI as a range from zero to an upper limit.
- Concern about a move to regional diets may be unjustified, as their use to provide a
more accurate estimate of dietary exposure to veterinary drug residues would not
result in regional MRLs being established. The Expert Meeting on dietary exposure
assessment methodologies needs to better explain how the new approach, based on
informed science, would work.
- It would be helpful if more countries would look at their own food consumption data
to see if the data fit well with those in the food basket.
- It may be important to consider different age groups using different food baskets.
- Often only the target tissue, the one most likely to contain the chemical, is included in
monitoring programmes.
- It would be helpful if radiolabel studies were designed to acquire information on
concentrations in the gastrointestinal tract, lungs and oral cavity.
- The “average consumer” does not exist; in other words, no one person eats all foods at
an “average” level on a daily basis. Rather, food consumption data should be chosen
to protect a high proportion of the population.

48
- It is important to remember that the MRL is not based on the ADI, but is derived from
residue depletion studies. Dietary exposure is compared with the ADI to determine
whether or not an estimated MRL can be recommended. The same residue data set is
used for dietary exposure assessment and estimation of MRLs in a parallel process.
- JECFA needs to consider differentiating between ADIs and acute reference doses
(ARfDs) as appropriate. In some cases in the past, JECFA has derived ADIs based on
acute end-points and has clearly described them as such.
List of stakeholders1
1. Thomas Burnett, International Federation for Animal Health, Brussels, Belgium
2. Olivier Espeisse, Corporate Affairs, Elanco Santé Animale, Suresnes, France
3. Barbara Freischem,* International Federation for Animal Health, Brussels,
Belgium
4. Andre Muller,* National Institute for Public Health and the Environment (RIVM),
Bilthoven, the Netherlands
5. Gavin Ryan,* Committee for Medicinal Products for Veterinary Use, European
Medicines Agency
6. Laura Carina Sbordi,* Directorate for Veterinary Products and Feed, National
Directorate of Agrochemicals, Veterinary Products and Feed, SENASA (National
Service for Agrifood Quality and Health), Buenos Aires, Argentina
7. Joseph Shavila, United Kingdom Food Standards Agency, London, England
1 Stakeholders who gave oral presentations are marked with an asterisk (*).

49
Attachment 1: Stakeholder meeting agenda
Project to review and update the principles and methodology to assess dietary exposure to residues of veterinary drugs: Stakeholder meeting
FAO Rome, 7 November 2011, 9:00–15:00
The Philippines Room
Monday, 7 November 2011
Chair: Janis Baines, Rapporteur: Marla Sheffer
Time Item Note
09:00–09:15 Opening and welcome by FAO/WHO Angelika Tritscher
Annika Wennberg
Janis Baines
09:15–09:30 Introductory presentation
• Background, objectives and scope of the meeting
• Expected output
Masami Takeuchi
09:30–10:00 Presentation “CVMP reflections on the current exposure assessment approach and possible developments”
[European Medicines Agency’s Committee for Medicinal Products for Veterinary Use (CVMP)]
Q & A
Gavin Ryan
10:00–10:30 Presentation “The animal health industry’s view on assessment of dietary exposure to residues of veterinary drugs”
[International Federation for Animal Health (IFAH)]
Q & A
Barbara Freischem
10:30–11:00 Coffee break
11:00–11:30 Presentation “The current model diet applied by JECFA: its applicability to Argentina’s national model”
[Directorate for Veterinary Products and Feed, National Directorate of Agrochemicals, Veterinary Products and Feed, SENASA (National Service for Agrifood Quality and Health), Argentina]
Q & A
Laura Carina Sbordi
11:30–12:00 Presentation “Comparison of the food basket with consumption data from various regions”
[National Institute for Public Health and the Environment (RIVM), the Netherlands]
Q & A
Andre Muller
12:00–12:45 Discussions All
12:45–13:00 Summary and closing FAO/WHO
Janis Baines

50
Attachment 2: List of participants of the seventy-fifth meeting of the Joint FAO/WHO Expert Committee on Food Additives, Rome, Italy, 7–17 November 2011 Members
Professor A. Anadón, Department of Toxicology and Pharmacology, Faculty of Veterinary Medicine, Universidad Complutense de Madrid, Madrid, Spain
Dr D. Arnold, Consultant, Berlin, Germany (Vice-Chairman)
Professor A.R. Boobis, Centre for Pharmacology & Therapeutics, Department of Experimental Medicine, Division of Medicine, Faculty of Medicine, Imperial College London, London, England (Chairman)
Dr R. Ellis, Consultant, Myrtle Beach, SC, USA (Joint Rapporteur)
Dr A. Fernández Suárez, Ciencias Veterinarias, Universidad del Salvador, Buenos Aires, Argentina
Dr L.G. Friedlander, Office of New Animal Drug Evaluation, Center for Veterinary Medicine, Food and Drug Administration, Department of Health and Human Services, Rockville, MD, USA
Dr K.J. Greenlees, Office of New Animal Drug Evaluation, Center for Veterinary Medicine, Food and Drug Administration, Department of Health and Human Services, Rockville, MD, USA (Joint Rapporteur)
Professor J. Palermo-Neto, Department of Pathology, Faculty of Veterinary Medicine, University of São Paulo, São Paulo, Brazil
Dr L. Ritter, Canadian Network of Toxicology Centres, Professor Emeritus, School of Environ-mental Sciences, University of Guelph, Guelph, Ontario, Canada
Dr P. Sanders, National Reference Laboratory for Veterinary Drug Residues and Antimicrobial Resistance, Agence nationale de sécurité sanitaire de l’alimentation, de l’environnement et du travail (ANSES), Fougères, France
Professor G.E. Swan, Faculty of Veterinary Science, University of Pretoria, Onderstepoort, South Africa1
Secretariat
Dr J. Boison, Centre for Veterinary Drug Residues, Canadian Food Inspection Agency, Saskatoon, Saskatchewan, Canada (FAO Expert)
Dr A. Bruno, Joint FAO/WHO Food Standards Programme, Food and Agriculture Organization of the United Nations, Rome, Italy (FAO Codex Secretariat)
Dr C.E. Cerniglia, Division of Microbiology, National Center for Toxicological Research, Food and Drug Administration, Department of Health and Human Services, Jefferson, AR, USA (WHO Temporary Adviser)
1 Dr Swan was invited but unable to attend the meeting.
51
Dr P.L. Chamberlain, Office of the Chief/Office of the Chief Scientist/Office of Counterterrorism and Emerging Threats, Food and Drug Administration, Department of Health and Human Services, Silver Spring, MD, USA (WHO Temporary Adviser)
Dr S. Ghimire, Veterinary Drugs Directorate, Health Canada, Ottawa, Ontario, Canada (WHO Temporary Adviser)
Dr N. Jarrett, European Medicines Agency, London, England (WHO Temporary Adviser)
Professor S.H. Jeong, Department of Applied Biotoxicology, Hoseo University, Hoseo Toxicology Research Centre, Asan City, Chungnam, Republic of Korea (WHO Temporary Adviser)
Professor B. Le Bizec, Laboratoire d’Étude des Résidus et des contaminants dans les aliments (LABERCA), École Nationale Vétérinaire, Agroalimentaire et de l’Alimentation Nantes Atlantique (ONIRIS), Nantes, France (FAO Expert)
Dr K. Ogawa, Division of Pathology, Biological Safety Research Center, National Institute of Health Sciences, Tokyo, Japan (WHO Temporary Adviser)
Dr F. Ramos, Bromatology, Pharmacognosy and Analytical Sciences Group, Pharmacy Faculty, Coimbra University, Coimbra, Portugal (FAO Expert)
Dr G. Roberts, Consultant, Preston, Victoria, Australia (WHO Temporary Adviser)
Ms M. Sheffer, Orleans, Ontario, Canada (FAO/WHO Editor)
Dr A. Tritscher, Department of Food Safety and Zoonoses, World Health Organization, Geneva, Switzerland (WHO Joint Secretary)
Dr P. Verger, Department of Food Safety and Zoonoses, World Health Organization, Geneva, Switzerland (WHO Joint Secretary to Joint FAO/WHO Meeting on Pesticide Residues)
Dr A. Wennberg, Nutrition and Consumer Protection Division, Food and Agriculture Organization of the United Nations, Rome, Italy (FAO Joint Secretary)

52
Annex 3
Summary of food consumption data submitted, by countrya
Countryb Name of study Survey period
Food raw or as consumed
Age range (years)
No. of survey days
Food consumption, C-only (g/person per day)
Food consumption, Total pop (g/person per day)
Food consumption, C-only (g/kg bw per day)
Food consumption, Total pop (g/kg bw per day)
Person-day data available
Individual-based survey data submitted to JECFAc
Argentina General Rodriguez* (n = 236); Mar del Plata* (n = 199)
? ? 18–65 30 (FFQ)
√
Australia NNS of Australia (n = ~14 000)
1995 Raw 2+, 2–6 1 √ √ √ √ √
NCNPAS (n = ~5000)
2007 Raw 2–16 2 √ √
Austria (EFSA) ASNS (n = 2123)
2005–2006
As consumed 19–65 1 √ √ √
Belgium (EFSA)
Regional Flanders* (n = 661)
2002–2003
Mixed 2.5–6.5 3 √ √ √ √ √
Diet National 2004 (n = 3245)
2004–2005
As consumed >15 2 √ √ √ √ √
Brazil Pesquisa de Orcamento Familiar (n = 34 003)
2008–2009
Raw ≥10 2 √ √ √ √ √
Bulgaria (EFSA)
NSFIN (n = 1204)
2004 Raw >16 1 √ √ √ √ √
NUTRICHILD (n = 1723)
2007 Mixed <5 2 √ √ √ √ √
Cambodia Regional* (n = 941)
? As consumed 25–65 2 √ √

53
Countryb Name of study Survey period
Food raw or as consumed
Age range (years)
No. of survey days
Food consumption, C-only (g/person per day)
Food consumption, Total pop (g/person per day)
Food consumption, C-only (g/kg bw per day)
Food consumption, Total pop (g/kg bw per day)
Person-day data available
China National Nutrition and Health Survey (n = 69 205)
2002 As consumed All ages, 2–6
1 √ √ √
Hong Kong SAR Population-Based Food Consumption Survey* (n = ~5000)
2005–2007
As consumed 20–84 2 √ √
Cyprus (EFSA) Childhealth (n = 303)
2003 Mixed 11–18 3 √ √ √ √ √
Czech Republic (EFSA)
SISP04 (n = 1751)
2003–2004
Raw >4 2 √ √ √ √ √
Denmark (EFSA)
Danish Dietary Survey (n = 4118)
2000–2002
Raw 4–75 7 √ √ √ √ √
Estonia (EFSA) NDS 1997 (n = 1866)
1997 Mixed 19–64 1 √ √ √
Finland (EFSA) FINDIET 2007 (n = 2038)
2007 Raw 25–74 1 √ √ √ √ √
DIPP* (n = 1448)
2003–2006
Mixed 1, 3, 6 3 √ √ √ √ √
STRIP* (n = 250)
2000 Mixed 7–8 4 √ √ √ √ √
France (EFSA) INCA2 (n = 4079)
2005–2007
As consumed 3–79 7 √ √ √ √ √
Germany (EFSA)
DONALD* (n = 926)
2006–2008
Mixed 1–10 3 √
National Nutrition Survey II (n = 13 926)
2005–2007
As consumed 14–80 2 √ √ √ √ √

54
Countryb Name of study Survey period
Food raw or as consumed
Age range (years)
No. of survey days
Food consumption, C-only (g/person per day)
Food consumption, Total pop (g/person per day)
Food consumption, C-only (g/kg bw per day)
Food consumption, Total pop (g/kg bw per day)
Person-day data available
Greece (EFSA) Regional Crete*
(n = 874) 2004–2005
Mixed 4–6 3 √ √ √ √ √
Hungary (EFSA)
National Representative Survey (n = 1360)
2003 Raw >18 3 √ √ √ √ √
Ireland (EFSA) NSIFCS (n = 958)
1997–1999
Raw 18–64 7 √ √ √ √ √
Italy (EFSA) INRAN-SCAI (n = 3323)
2005–2006
Raw >0.1 3 √ √ √ √ √
Japan National Health and Nutrition Survey (n = ~18 000)
2009 As consumed 1+,
<15, ≥15
1
√ √ √
Latvia (EFSA) EFSA_TEST (n = 2070)
2008 As consumed 7–66 2 √ √ √ √ √
Netherlands (EFSA)
VCP_kids (n = 279)
2005–2006
Raw 2–6 3 √ √ √ √ √
DNFCS-2003 (n = 750)
2003 Raw 19–30 2 √ √ √ √ √
Poland (EFSA, other)
IZZ-FAO-2000 (n = 4134)
2000 Raw 1–96 1 √ √ √ √ √
Household Budget Survey
2008 Raw 18+ ? √d
Slovakia (EFSA)
SK MON 2008 (n = 2761)
2008 Mixed 19–59 1 √ √ √
Slovenia (EFSA)
CRP-2008 (n = 410)
2007–2008
As consumed 18–65 1 √ √ √
Spain (EFSA)
enKid (n = 382) 1998–2000
Mixed 1–14 2 √ √ √ √ √
NUT-INK05*
(n = 1050) 2004–2005
Mixed 4–18 2 √ √ √ √ √

55
Countryb Name of study Survey period
Food raw or as consumed
Age range (years)
No. of survey days
Food consumption, C-only (g/person per day)
Food consumption, Total pop (g/person per day)
Food consumption, C-only (g/kg bw per day)
Food consumption, Total pop (g/kg bw per day)
Person-day data available
AESAN-FIAB (n = 1068)
1999–2001
As consumed 17–60 3 √ √ √ √ √
AESAN (n = 418)
2009 As consumed 18–60 2 √ √ √ √ √
Sweden (EFSA)
NFA (n = 2495) 2003 As consumed 3–18 4 √ √ √ √ √
RIKSMATEN (n = 1210)
1997–1998
As consumed 18–74 7 √ √ √ √ √
Thailand National Consumer Survey (n = 18 998)
2004–2005
Raw 3+ 30 (FFQ)
√
United Kingdom (EFSA)
NDNS (n = 1724)
2000–2001
As consumed 19–64 7 √ √ √ √ √
USA NHANES (n = ~20 000)
2003–2006
Raw 2+, 2–6 2 √ √ √ √ √
Viet Nam Nationwide survey (n = 8267)
2009 ? All ages ? √
Household-level survey data submitted to JECFA
Brazil Household Budget Survey (n = 55 970)
2008–2009
Mixed All ages 2 √
Cameroon National Nutrition and Health Survey (n = 69 205)
2002 Mixed 2+ 15 √ (?) √ (?)
Food balance sheet (poundage) data from Latin America
Argentina 2000–2010
Raw √
Bolivia (Plurinational
2000, 2009
Raw √
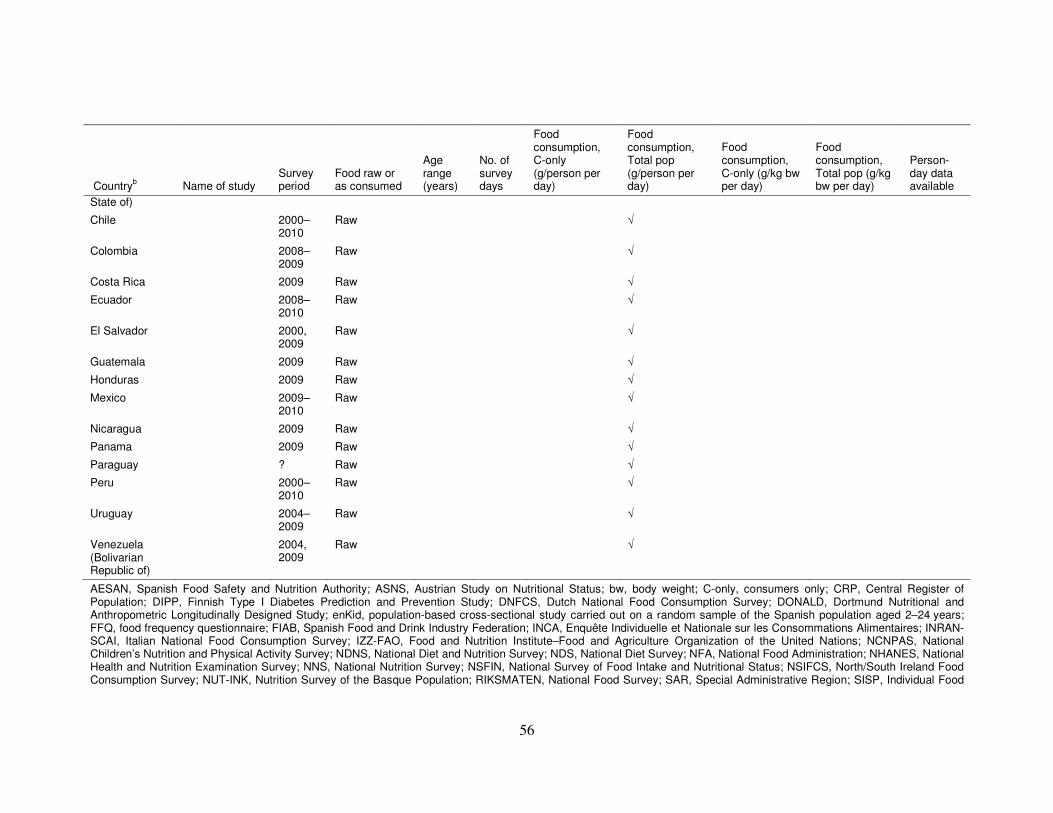
56
Countryb Name of study Survey period
Food raw or as consumed
Age range (years)
No. of survey days
Food consumption, C-only (g/person per day)
Food consumption, Total pop (g/person per day)
Food consumption, C-only (g/kg bw per day)
Food consumption, Total pop (g/kg bw per day)
Person-day data available
State of)
Chile 2000–2010
Raw √
Colombia 2008–2009
Raw √
Costa Rica 2009 Raw √
Ecuador 2008–2010
Raw √
El Salvador 2000, 2009
Raw √
Guatemala 2009 Raw √
Honduras 2009 Raw √
Mexico 2009–2010
Raw √
Nicaragua 2009 Raw √
Panama 2009 Raw √
Paraguay ? Raw √
Peru 2000–2010
Raw √
Uruguay 2004–2009
Raw √
Venezuela (Bolivarian Republic of)
2004, 2009
Raw √
AESAN, Spanish Food Safety and Nutrition Authority; ASNS, Austrian Study on Nutritional Status; bw, body weight; C-only, consumers only; CRP, Central Register of Population; DIPP, Finnish Type I Diabetes Prediction and Prevention Study; DNFCS, Dutch National Food Consumption Survey; DONALD, Dortmund Nutritional and Anthropometric Longitudinally Designed Study; enKid, population-based cross-sectional study carried out on a random sample of the Spanish population aged 2–24 years; FFQ, food frequency questionnaire; FIAB, Spanish Food and Drink Industry Federation; INCA, Enquête Individuelle et Nationale sur les Consommations Alimentaires; INRAN-SCAI, Italian National Food Consumption Survey; IZZ-FAO, Food and Nutrition Institute–Food and Agriculture Organization of the United Nations; NCNPAS, National Children’s Nutrition and Physical Activity Survey; NDNS, National Diet and Nutrition Survey; NDS, National Diet Survey; NFA, National Food Administration; NHANES, National Health and Nutrition Examination Survey; NNS, National Nutrition Survey; NSFIN, National Survey of Food Intake and Nutritional Status; NSIFCS, North/South Ireland Food Consumption Survey; NUT-INK, Nutrition Survey of the Basque Population; RIKSMATEN, National Food Survey; SAR, Special Administrative Region; SISP, Individual Food
57
Consumption – the National Survey; SK MON, Monitoring of Nutritional Status of Slovak Citizens; STRIP, Special Turku Coronary Risk Factor Intervention Project; Total pop, total population; VCP, Voedselconsumptiepeiling onder jongvolwassenen a “√” indicates whether data were submitted. b “(EFSA)” indicates that data were submitted by EFSA, not by the individual country. c Surveys marked with an asterisk (*) are regional. d Data from Poland’s 2008 survey are expressed in consumption units normalized to an adult male as the consumption unit.

58
Annex 4
Comparison between distributional approach and two models for chronic dietary exposure estimates
Two deterministic approaches to modelling chronic dietary exposure were discussed.
In the first method, the highest 97.5th percentile dietary exposure (calculated considering
consumers only) from each food category is added to the mean dietary exposure from all
other foods (all subjects) in the diet to estimate the total dietary exposure of high-level
consumers of each food type. Highest plus mean of rest of diet approach (Method A):
High-level exposure from
each animal product =
97.5th percentile consumption
× Median residue
(mg/kg body weight per day or
mg/day) (kg/kg body weight per day or kg/day) (mg/kg)
Chronic dietary exposure = Highest exposure from one
animal product +
Total mean exposure from all other
products
(mg/kg body weight per day or mg/day)
(mg/kg body weight per day or mg/day) (mg/kg body weight per day or mg/day)
A more conservative version of this approach consists of summing the 97.5th percentile of
exposure for the two highest categories that are the main contributors with the mean exposure
for the other categories. Two highest plus mean of rest of diet approach (Method B):
High-level exposure from
each animal product =
97.5th percentile consumption
× Median residue
(mg/kg body weight per day or
mg/day) (kg/kg body weight per day or kg/day) (mg/kg)
Chronic dietary exposure = Highest exposures from two
animal products +
Total mean exposure from all other
products
(mg/kg body weight per day or mg/day)
(mg/kg body weight per day or mg/day) (mg/kg body weight per day or mg/day)
The algorithm used in the chronic model has been explored by taking JECFA MRL values
1
and comparing the results obtained with the two possible methods (highest plus mean of rest
of diet or two highest plus mean of rest of diet) with the results based on the same food
consumption data but using a distributional model. In the distributional model, each
individual’s dietary exposure is calculated, and then the population mean and percentiles are
1 http://www.fao.org/ag/agn/jecfa-
vetdrugs/results.html?vetdrugName=&status=MRL_F&techFunction=&searchBy=astatus

59
estimated from the distribution. The same food categories and residue concentrations are used
in both models. MRL values used in all models are provided in Table A4-1.
This comparative exercise was undertaken prior to the Expert Meeting and relates to the
chronic model where individual records of food consumption data from the United Kingdom
were used. It did not include the new data obtained through the FAO/WHO meeting of
experts reported elsewhere in this report. Chronic dietary exposures were calculated using
Methods A and B and also by a distributional model. The distributional model estimated
dietary exposure for each individual in the United Kingdom survey, and then the population
mean and high percentile values were derived from these individual results. The same food
categories and residue concentrations were used in each model. In this preliminary exercise,
the high percentile value selected for Methods A and B and the distributional model was the
95th percentile.
The results of the comparative exercise for nine veterinary drug MRLs are summarized in
Table A4-2. Both Methods A and B appear to provide a reliable prediction of the 95th
percentile dietary exposure derived from the distribution of actual records of individual
exposures, apart from cases where residues are present in a small number of tissues
(clenbuterol and zeranol), where they both overestimate the exposure calculated using the
distributional approach by a large margin. Results are presented graphically without (Figure
A4-1) and with (Figure A4-2) body weight correction.
Given the uncertainties inherent in the methods and the underlying conservative assumptions
within the data (i.e. all food products can contain residues and maximum concentrations), the
“highest plus mean from rest of the diet” method is probably the preferred approach, because
it gives a result close to the value that would be obtained in a distributional model and it is
relatively simple to apply.
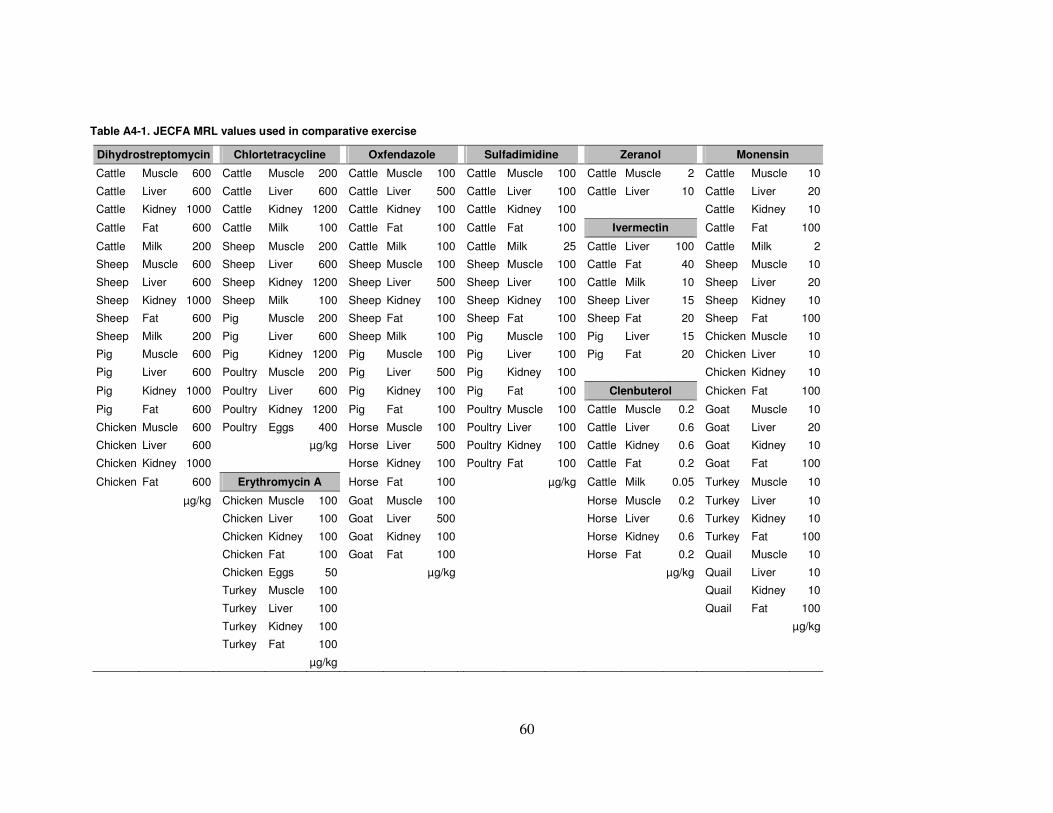
60
Table A4-1. JECFA MRL values used in comparative exercise
Dihydrostreptomycin Chlortetracycline Oxfendazole Sulfadimidine Zeranol Monensin
Cattle Muscle 600 Cattle Muscle 200 Cattle Muscle 100 Cattle Muscle 100 Cattle Muscle 2 Cattle Muscle 10
Cattle Liver 600 Cattle Liver 600 Cattle Liver 500 Cattle Liver 100 Cattle Liver 10 Cattle Liver 20
Cattle Kidney 1000 Cattle Kidney 1200 Cattle Kidney 100 Cattle Kidney 100 Cattle Kidney 10
Cattle Fat 600 Cattle Milk 100 Cattle Fat 100 Cattle Fat 100 Ivermectin Cattle Fat 100
Cattle Milk 200 Sheep Muscle 200 Cattle Milk 100 Cattle Milk 25 Cattle Liver 100 Cattle Milk 2
Sheep Muscle 600 Sheep Liver 600 Sheep Muscle 100 Sheep Muscle 100 Cattle Fat 40 Sheep Muscle 10
Sheep Liver 600 Sheep Kidney 1200 Sheep Liver 500 Sheep Liver 100 Cattle Milk 10 Sheep Liver 20
Sheep Kidney 1000 Sheep Milk 100 Sheep Kidney 100 Sheep Kidney 100 Sheep Liver 15 Sheep Kidney 10
Sheep Fat 600 Pig Muscle 200 Sheep Fat 100 Sheep Fat 100 Sheep Fat 20 Sheep Fat 100
Sheep Milk 200 Pig Liver 600 Sheep Milk 100 Pig Muscle 100 Pig Liver 15 Chicken Muscle 10
Pig Muscle 600 Pig Kidney 1200 Pig Muscle 100 Pig Liver 100 Pig Fat 20 Chicken Liver 10
Pig Liver 600 Poultry Muscle 200 Pig Liver 500 Pig Kidney 100 Chicken Kidney 10
Pig Kidney 1000 Poultry Liver 600 Pig Kidney 100 Pig Fat 100 Clenbuterol Chicken Fat 100
Pig Fat 600 Poultry Kidney 1200 Pig Fat 100 Poultry Muscle 100 Cattle Muscle 0.2 Goat Muscle 10
Chicken Muscle 600 Poultry Eggs 400 Horse Muscle 100 Poultry Liver 100 Cattle Liver 0.6 Goat Liver 20
Chicken Liver 600 µg/kg Horse Liver 500 Poultry Kidney 100 Cattle Kidney 0.6 Goat Kidney 10
Chicken Kidney 1000 Horse Kidney 100 Poultry Fat 100 Cattle Fat 0.2 Goat Fat 100
Chicken Fat 600 Erythromycin A Horse Fat 100 µg/kg Cattle Milk 0.05 Turkey Muscle 10
µg/kg Chicken Muscle 100 Goat Muscle 100 Horse Muscle 0.2 Turkey Liver 10
Chicken Liver 100 Goat Liver 500 Horse Liver 0.6 Turkey Kidney 10
Chicken Kidney 100 Goat Kidney 100 Horse Kidney 0.6 Turkey Fat 100
Chicken Fat 100 Goat Fat 100 Horse Fat 0.2 Quail Muscle 10
Chicken Eggs 50 µg/kg µg/kg Quail Liver 10
Turkey Muscle 100 Quail Kidney 10
Turkey Liver 100 Quail Fat 100
Turkey Kidney 100 µg/kg
Turkey Fat 100
µg/kg

61
Table A4-2. Results of comparative exercise for estimating chronic dietary exposurea
Residue
Deterministic model Distributional model Ratiosb
µg/day µg/kg bw per day µg/day µg/kg bw per day Method A Method B
Pop mean Method A Method B Pop mean Method A Method B Mean P95 Mean P95 / P95 / P95
Clenbuterol 0.017 0.120 0.135 0.0002 0.0015 0.0018 0.017 0.035 0.0002 0.0005 3.2 3.7
Dihydrostreptomycin 93.3 153.7 190.4 1.25 2.11 2.61 93.3 174.3 1.25 2.35 0.9 1.1
Chlortetracycline 48.1 89.6 119.9 0.65 1.16 1.59 48.1 86.9 0.65 1.19 1.0 1.3
Oxfendazole 29.5 59.7 81.4 0.40 0.83 1.12 29.5 60.7 0.40 0.82 1.0 1.4
Sulfadimidine 13.8 21.4 27.5 0.19 0.29 0.38 13.9 26.0 0.19 0.34 0.9 1.1
Zeranol 0.041 0.438 0.546 0.0005 0.0056 0.0070 0.059 0.152 0.0008 0.0020 2.9 3.6
Ivermectin 4.56 9.95 13.92 0.061 0.131 0.181 4.57 9.93 0.061 0.132 1.0 1.4
Monensin 1.28 2.14 2.91 0.017 0.029 0.039 1.27 2.47 0.017 0.033 0.9 1.2
Erythromycin A 3.9 10.1 14.3 0.05 0.14 0.19 4.0 9.9 0.05 0.13 1.0 1.5
Avilamycin 11.0 23.2 33.6 0.15 0.31 0.44 11.4 25.7 0.15 0.34 0.9 1.3
bw, body weight; P95, 95th percentile; Pop mean, general population mean dietary exposure a Method A, Sum of highest exposure at 95th percentile (consumers only) for one food and general population mean exposure for all other foods; Method B, Sum of highest exposure at 95th
percentile (consumers only) for two foods and general population mean exposure for all other foods. b Ratio of estimated dietary exposure using Method A or B to the 95th percentile dietary exposure estimate derived from individual dietary records using the distributional model.

62
Figure A4-1. Comparison of deterministic and distributional models without body weight correction
0
20
40
60
80
100
120
140
160
180
200
0 50 100 150 200
Methods A and B
Dis
trib
uti
on
al
P95
Method A
Method B
Figure A4-2. Comparison of deterministic and distributional models with body weight correction
0.0
0.5
1.0
1.5
2.0
2.5
3.0
0 1 1 2 2 3 3
Methods A and B
Dis
trib
uti
on
al p
95
Method A
Method B

63
Annex 5 Food consumption data for the general population aged 2+ years
Table A5-1. Mean food consumption for the general population aged 2+ yearsa
Part A: Argentina to Honduras
Food type as raw commodity
Food consumption (g/person per day)
Arg
entin
a
Aus
tral
ia
Bel
gium
Bol
ivia
(P
lurin
atio
nal
Sta
te o
f)
Bra
zil
Chi
le
Chi
na
Col
ombi
a
Cos
ta R
ica
Cze
ch
Rep
ublic
Den
mar
k
Ecu
ador
El S
alva
dor
Fin
land
Fra
nce
Ger
man
y
Gua
tem
ala
Hon
dura
s
Mammalian muscle
Beef and other bovines
196 79 55 97 62 4 47 51 27
Pork and other porcines
26 46 16
12 66 48 12 30 23
Sheep and other ovines
16 25 12 0.5 0.8
Goat and other caprines
0.8 0.01
Horse and other equines
Rabbit
All mammalian muscle
124 44 56 57 80 38 64 34
Mammalian trimmed fat, skin and added fat
5 21 16 4 12 10

64
a The values provided are assumed to apply to the general population aged 2 years and over; however, some of the data sets submitted did not cover this specific age range (see Annex 3 for details). b Includes whole liquid milk, secondary milk products (e.g. skimmed milk, evaporated milk, milk powders), derived milk products (e.g. cream, butter) and manufactured milk products (yoghurt, cheese, ice
cream).
Food type as raw commodity
Food consumption (g/person per day)
Arg
entin
a
Aus
tral
ia
Bel
gium
Bol
ivia
(P
lurin
atio
nal
Sta
te o
f)
Bra
zil
Chi
le
Chi
na
Col
ombi
a
Cos
ta R
ica
Cze
ch
Rep
ublic
Den
mar
k
Ecu
ador
El S
alva
dor
Fin
land
Fra
nce
Ger
man
y
Gua
tem
ala
Hon
dura
s
Mammalian offal
1
Mammalian liver 2.3
(bovine)
Mammalian kidney
Mammalian lung
All mammalian offal
0.4 11.6 4 0.8 1 3 0.9
Fish and seafood
Fish 17 16 15 25 21 13
Crustaceans 2 4 0.7 0.1 2 0.9 2 0.6
Molluscs 2 2 0 0.1 0.2 3 0.4
All fish and seafood
8 24 26 25 82 18 17 18 19 26 30 17
Poultry muscle 99 164 22 82 51 217 12 64 71 37 25 71 51 30 31 16 62 50
Poultry fat and skin
Poultry offal 0.51 0.4 0.2 4 0.8 1 3 0.9
Eggs (all) 17 10 16 17 24 22 26 32 20 16 17 28 16 15 12 24 16
Milkb 544 758 172 119 178 382 10 540 172 376 283 451 205 185
Honey 0.55 3 10 0.3 0.22 0.2 5 0.4 0.27 4 4 8

65
Table A5-1. Mean food consumption for the general population aged 2+ yearsa
Part B: Hungary to Venezuela (Bolivarian Republic of)
Food type as raw commodity
Food consumption (g/person per day)
Hun
gary
Irel
and
Italy
Japa
n
Latv
ia
Mex
ico
Net
herl
ands
Nic
arag
ua
Pan
ama
Par
agua
y
Per
u
Pol
and
Spa
in
Sw
eden
Uni
ted
Kin
gdom
Uru
guay
US
A
Ven
ezue
la
(Bol
ivar
ian
Rep
ublic
of
)
Mammalian muscle
Beef and other bovines
49 14 159 41 66
Pork and other porcines
41 13 26 13
Sheep and other ovines
0.7 12 0.5
Goat and other caprines
Horse and other equines
Rabbit
All mammalian muscle
60 70 61 79 63 55 61 27 35 77
Mammalian trimmed fat, skin and added fat
10 10 3 10 7 2 6 2 4

66
Food type as raw commodity
Food consumption (g/person per day)
Hun
gary
Irel
and
Italy
Japa
n
Latv
ia
Mex
ico
Net
herla
nds
Nic
arag
ua
Pan
ama
Par
agua
y
Per
u
Pol
and
Spa
in
Sw
eden
Uni
ted
Kin
gdom
Uru
guay
US
A
Ven
ezue
la
(Bol
ivar
ian
Rep
ublic
of)
Mammalian offal
0.4
Mammalian liver
Mammalian kidney
Mammalian lung
All mammalian offal
10 1 (M+P)
1 (M+P)
3 (M+P)
0.4 (M+P) 2 (M+P)
1 (M+P)
2 (M+P)
Fish and seafood
Fish 9 20 31 16 5 57 17 22
Crustaceans 0 0.8 4 0 1 5 4 3 3
Molluscs 0 0.2 10 0.0 0.4 12 0.1 0.5 0.7
All fish and seafood
9 21 46 79 18 9 75 33 27 30 16 30
Poultry muscle
44 42 21 23 74 24 43 95 88 33 7 37 52 126 95
Poultry fat and skin
Poultry offal 10 1 1 3 0.4 2 1 2 0.2
Eggs (all) 26 20 21 35 9 49 12 11 16 19 29 12 5 24 18
Milkb 260 303 186 96 138 350 359 93 180 378 359 260 650 296 340
Honey 8 5 6 1 4 3 3 0.76

67
M+P, mammalian plus poultry a The values provided are assumed to apply to the general population aged 2 years and over; however, some of the data sets submitted did not cover this specific age range (see Annex 3 for details). b Includes whole liquid milk, secondary milk products (e.g. skimmed milk, evaporated milk, milk powders), derived milk products (e.g. cream, butter) and manufactured milk products (yoghurt, cheese, ice
cream).

68
Table A5-2. Chronic 97.5th percentile food consumption for the general population aged 2+ yearsa
Food type as raw commodity B
elgi
um
Bra
zil
Chi
na (
Hon
g K
ong
SA
R)
Cze
ch R
epub
lic
Den
mar
k
Fin
land
Fra
nce
Ger
man
y
Hun
gary
Irel
and
Italy
Japa
n
Latv
ia
Net
herl
ands
Spa
in
Sw
eden
Uni
ted
Kin
gdom
US
A
Mammalian muscle
Beef and other bovines 325 150
182.5
Pork and other porcines 428 189.9 142
Sheep and other ovines 373 121.5 146.3
Goat and other caprines
401 169.4
Horse and other equines
Rabbit
All mammalian muscle 247.5 257.1 200 219.1 168.7 238.5 191.7 206.5 200 265.4 300.0 250 264.8 91.4 120.9 264
Mammalian trimmed fat, skin and added fat
70 14.7 70 54 19.6 42.6 65 52.7 57.3 24.7 33.9 50.0 36.9 30 34.3 27.2 53.1
Mammalian offal
Mammalian liver 203 (bovine)
102.7
Mammalian kidney 102.3 (includes
kidney)
Mammalian lung
All mammalian offal 112.5
(M+P)
12.86
126.3
(M+P)
61.8
(M+P)
95.2
(M+P)
50
(M+P)
175
(M+P)
111.3
(M+P)
62.7
(M+P)
128.7
(M+P)
125.0
(M+P)
93.8
(M+P)
115.8
(M+P)
38.6
(M+P)
41.7
(M+P)
34.7
Fish and seafood
Fish 183.2 1000 250 225 62 195.3 85.9 190.2 200 97.1 132.3 200.0 110.7 206.7 86.4 92.9 178.1
Crustaceans 117.5 376 185.8 75 22.9 75.0 18.5 109.4 26.7 24.7 134.6 35.0 150 97.8 51.4 37 167.4
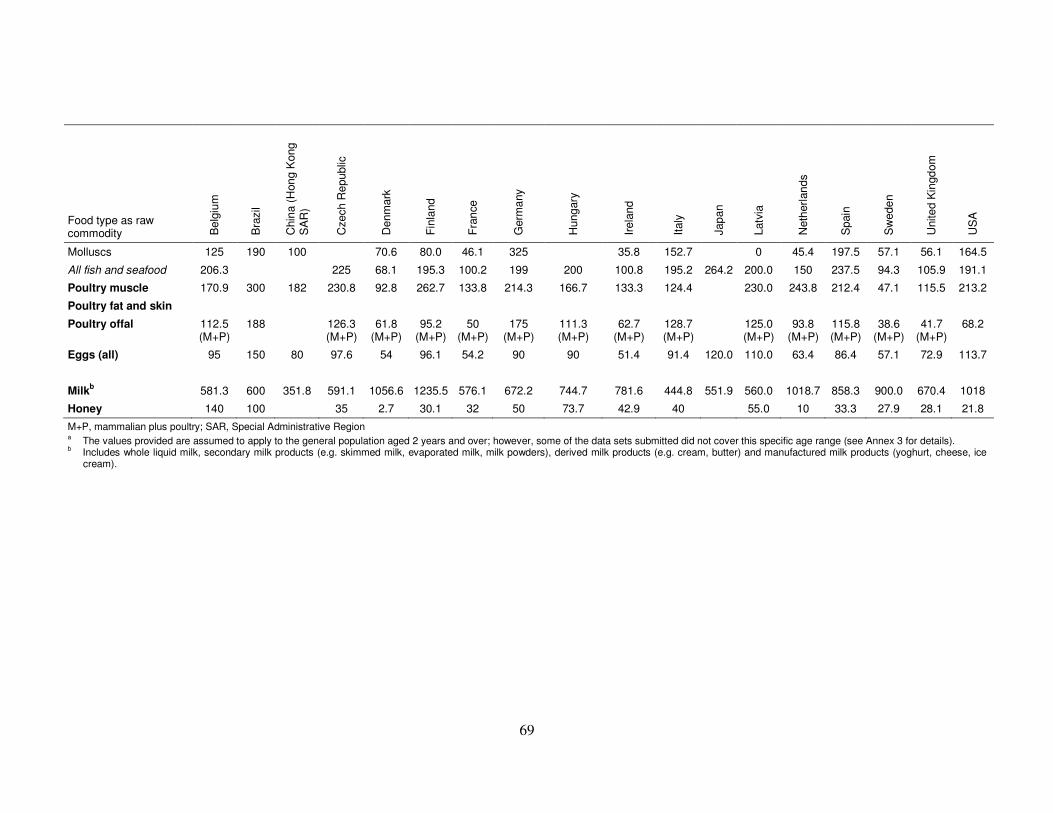
69
Food type as raw commodity B
elgi
um
Bra
zil
Chi
na (
Hon
g K
ong
SA
R)
Cze
ch R
epub
lic
Den
mar
k
Fin
land
Fra
nce
Ger
man
y
Hun
gary
Irel
and
Italy
Japa
n
Latv
ia
Net
herl
ands
Spa
in
Sw
eden
Uni
ted
Kin
gdom
US
A
Molluscs 125 190 100 70.6 80.0 46.1 325 35.8 152.7 0 45.4 197.5 57.1 56.1 164.5
All fish and seafood 206.3 225 68.1 195.3 100.2 199 200 100.8 195.2 264.2 200.0 150 237.5 94.3 105.9 191.1
Poultry muscle 170.9 300 182 230.8 92.8 262.7 133.8 214.3 166.7 133.3 124.4 230.0 243.8 212.4 47.1 115.5 213.2
Poultry fat and skin
Poultry offal 112.5 (M+P)
188 126.3 (M+P)
61.8 (M+P)
95.2 (M+P)
50 (M+P)
175 (M+P)
111.3 (M+P)
62.7 (M+P)
128.7 (M+P)
125.0 (M+P)
93.8 (M+P)
115.8 (M+P)
38.6 (M+P)
41.7 (M+P)
68.2
Eggs (all) 95 150 80 97.6 54 96.1 54.2 90 90 51.4 91.4 120.0
110.0 63.4 86.4 57.1 72.9 113.7
Milkb 581.3 600 351.8 591.1 1056.6 1235.5 576.1 672.2 744.7 781.6 444.8 551.9 560.0 1018.7 858.3 900.0 670.4 1018
Honey 140 100 35 2.7 30.1 32 50 73.7 42.9 40 55.0 10 33.3 27.9 28.1 21.8
M+P, mammalian plus poultry; SAR, Special Administrative Region a The values provided are assumed to apply to the general population aged 2 years and over; however, some of the data sets submitted did not cover this specific age range (see Annex 3 for details). b Includes whole liquid milk, secondary milk products (e.g. skimmed milk, evaporated milk, milk powders), derived milk products (e.g. cream, butter) and manufactured milk products (yoghurt, cheese, ice
cream).

70
Annex 6
Food consumption data for children aged 2–6 years Table A6-1. Mean food consumption for children aged 2–6 years
Food type as raw commodity
Food consumption (g/person per day)
Australia
(2–6 years)
Belgium
(2–6 years)
Bulgaria
(3–<5 years)
China
(2–6 years)
Czech Republic
(4–9 years)
Denmark
(4–9 years)
France
(3–9 years)
Germany
(3–9 years)
Greece
(3–9 years)
Italy
(3–9 years)
Japan
(1–6 years)
Netherlands
(3–6 years)
Spain
(3–9 years)
Sweden
(3–9 years)
USA
(2–6 years)
Mammalian muscle
Beef and other bovines
39.2 2 19.8
Pork and other porcines
24.8 28.1 13.9
Sheep and other ovines
12.7 2.1 0.09
Goat and other caprines
0
Horse and other equines
0.2 0
Rabbit
All mammalian muscle
56.9 12;4 31.1 31.2 50.9 41.6 9.6 22.7 50.9 61.8 (all
meats)
10 40.1 16.9 39.6
Mammalian trimmed fat, skin and added fat
2.9 0.5 (all fats)a 8.2 (all fats)a
1.9 (all fats)a 0.2 (all fats)a 0.6 (all fats)a 0 (all fats)a 0.1 (all fats)a
2.5 (all
fats)a
7.9 (all fats)a
0 (all fats)a 1.1 (all
fats)a
0.2 (all fats)a
9.3

71
Food type as raw commodity
Food consumption (g/person per day)
Australia
(2–6 years)
Belgium
(2–6 years)
Bulgaria
(3–<5 years)
China
(2–6 years)
Czech Republic
(4–9 years)
Denmark
(4–9 years)
France
(3–9 years)
Germany
(3–9 years)
Greece
(3–9 years)
Italy
(3–9 years)
Japan
(1–6 years)
Netherlands
(3–6 years)
Spain
(3–9 years)
Sweden
(3–9 years)
USA
(2–6 years)
Mammalian offal
Mammalian liver
0.01 0.04
Mammalian kidney
0.05
Mammalian lung
All mammalian offal
0.22 1.5 1.2
(M+P)
74.4 1.9 0.2 0.6 0 0.2
(M+P)
0.7
(M+P)
0 0.7
(M+P)
0 0.16
Fish and seafood
Fish 7.1 5.9 6.7 10.6 10.1 11.3 4.2 10.7 21.7 2.2 30.8 7.9 4.2
Crustaceans 0.22 0.3 0 0 0.8 0.6 0 0.2 2.4 0 1.1 0.4 0.7
Molluscs 0.26 0.1 0 0 0 0.6 0 2 0.8 0 3.1 0.1 0.14
All fish and seafood
9.1 6.7 11.6 12.2 20.7 9.9 13 40.2 35.9 5.2 36.5 15.6 5
Poultry muscle
17.2 8 32.3 8.4 32.2 15.9 20 7.1 11 11.6 5.7 36.5 11.5 29.3
Poultry fat and skin
Poultry offal
0.12 1.5 1.2
(M+P)
260.7 1.9 0.2 0.6 0 0.2
(M+P)
0.7
(M+P)
0 0.7
(M+P)
0 0.08
Eggs (all) 9.1 0 13.6 18.7 15.8 12.7 11.7 11.6 6.9 19.9 27.9 5.6 0.5 3.6 15.9
Milka 634 428 234 16.9 281 528 308 284 360 259 199.3 416 487 470 446.4
Honey 1.7 1.9 3.1 5 0.4 2.5 4.1 1.9 1.3 0.4
bw, body weight; M+P, mammalian plus poultry a All animal oils and fats.

72
b Includes whole liquid milk, secondary milk products (e.g. skimmed milk, evaporated milk, milk powders), derived milk products (e.g. cream, butter) and manufactured milk products (yoghurt, cheese, ice cream).
Table A6-2. Chronic 97.5th percentile food consumption for children aged 2–6 years
Food type as raw commodity
Food consumption (g/person per day)
Belgium
(2–6 years)
Bulgaria
(3–<5 years)
Czech Republic
(4–9 years)
Denmark
(4–9 years)
France
(3–9 years)
Germany
(3–9 years)
Greece
(4–6 years)
Italy
(3–9 years)
Netherlands
(3–6 years)
Spain
(3–9 years)
Sweden
(3–9 years)
USA
(2–6 years)
Mammalian muscle
Beef and other bovines 88.3
Pork and other porcines 90.3
Sheep and other ovines
Goat and other caprines
Horse and other equines
Rabbit
All mammalian muscle 68 112.5 144 114 112 79.7 100 141 65 145 59.3 126
Mammalian trimmed fat, skin and added fat
20
(all fats)a
24.8
(all fats)a
48.7
(all fats)a
38.3
(all fats)a
23.8
(all fats)a
24.6
(all fats)a
6.7
(all fats)a
20.8
(all fats)a
16.3
(all fats)a
17.5
(all fats)a
13.8
(all fats)a
30.1
Mammalian offal
Mammalian liver
Mammalian kidney
Mammalian lung
All mammalian offal 62
(M+P)
104.9
(M+P)
109.4
(M+P)
34
(M+P)
18.6
(M+P)
9.5
(M+P)
6.7
(M+P)
20.8
(M+P)
0
(M+P)
17.5
(M+P)
0 6.3
Fish and seafood
Fish 62 100.2 115 46 47 74.6 83.3 114 87.5 175 50 85.7
Crustaceans 17 0 0 18.2 11 16.7 33.3 88.1 124 45 25 92.4
Molluscs 29 0 5 3.5 33 0 83.3 216 10 100 37.5
All fish and seafood 73 100.2 115 47.3 64.8 75.3 100 181 91.4 160 61.3 94.5
Poultry muscle 57 132.3 207 65 65.7 66.8 73.3 110.9 250 157 58.3 123.9

73
Food type as raw commodity
Food consumption (g/person per day)
Belgium
(2–6 years)
Bulgaria
(3–<5 years)
Czech Republic
(4–9 years)
Denmark
(4–9 years)
France
(3–9 years)
Germany
(3–9 years)
Greece
(4–6 years)
Italy
(3–9 years)
Netherlands
(3–6 years)
Spain
(3–9 years)
Sweden
(3–9 years)
USA
(2–6 years)
Poultry fat and skin
Poultry offal 62
(M+P)
104.9
(M+P)
109.4
(M+P)
34
(M+P)
18.6
(M+P)
9.5
(M+P)
6.7
(M+P)
20.8
(M+P)
0
(M+P)
17.5
(M+P)
0 179.5
(M+P)
Eggs (all) 17 72 35.8 46.5 54..6 50 115 50 30 37.5 87.7
Milkb 980 581.2 614 107 661 795 813 531 962 907 895 1065
Honey 25 17.3 35 2.4 22.6 26.3 21.5 23.3 35 84 15.8 14
M+P, mammalian plus poultry a All animal oils and fats. b Includes whole liquid milk, secondary milk products (e.g. skimmed milk, evaporated milk, milk powders), derived milk products (e.g. cream, butter) and manufactured milk products (yoghurt, cheese, ice
cream).

74
Annex 7
Canadian proposal for simplification of the exposure assessment model
Canada proposes a simplified model for exposure assessment utilizing the food consumption
data reviewed and methodology proposed in the report of the Expert Meeting. The difference
between the Canadian proposed model and the one proposed in the Expert Meeting report is a
high-level aggregation of food consumption data (e.g. one consumption factor for total
muscle consumption, as opposed to beef muscle + pork muscle + chicken muscle etc.) to
avoid additive estimation between species. This approach simplifies the exposure assessment,
especially when done iteratively for establishing withdrawal periods. However, Canada
acknowledges that there might be situations where exposure assessment at the individual
animal species level would be required or preferred, using specific data at a much lower level
of segregation (e.g. a product that will never be developed for use in more than one food-
producing animal species). Hence, the data in Table 4 of the Expert Meeting report may have
to be used in those specific situations.
Chronic exposure assessment
A simplified food basket system for chronic exposure is proposed in Table A7-1. A detailed
description of how these values were derived is presented in Appendix 1.
Table A7-1. Simplified food consumption factors proposed for use in chronic exposure assessment (modified based on the data and method proposed by the Expert Meeting)
General population (60 kg) Children (2–6 years) (15 kg)
Infants (5 kg) (g/person per
day) Food type
Mean total population
(g/person per day)
High-level chronic
consumer (g/person per
day)
Mean total population
(g/person per day)
High-level chronic consumer
(g/person per day)
Musclea 300 425 100 200 —
Liver 15 250 — — —
Kidney 10 200 — — —
Other offalb 25 250 2 110 —
Fatc 75 75 10 30 —
Eggs 75 150 30 115 —
Milk 400 1050 600 1050 750
Honey 5 50 2 20 — a For fish, muscle and skin in natural proportion. b When unconventional offal tissues are to be included in the exposure assessment, 25 g mean consumption and 250 g high-
level consumption for adults and 2 g mean consumption and 110 g high-level consumption for children to be divided between conventional (liver and kidney) and unconventional (e.g. lungs) offal tissues.
c For swine and poultry, skin and fat.
The simplified model was tested using the examples and data used by the Expert Meeting.
The simplified model slightly overestimates the exposure compared with the model proposed
in the Expert Meeting report. For example, using the simplified model and the data provided
in Table 5 of the report, the exposure estimate for triclabendazole residues from cattle tissue
would be 95.3 µg/person per day (72.4 + 19.6 + 0.9 + 2.4) and that from sheep tissue would
be 33 µg/person per day. These represented 53% and 33% of the ADI, respectively. The
75
estimation from the experts’ proposed model represented 46% of the ADI, but could increase
if a new animal species is added to the label claim. However, in the simplified model, as the
exposure is assessed for each species separately, adding a label claim subsequently will have
no impact on exposure assessment, as well as on the withdrawal period or the MRLs.
The advantages of the proposed simplified approach are as follows:
1. The simplified model meets the specific requests made by CCRVDF to JECFA:
a. It uses the current international food consumption data.
b. It provides a simple model (similar to the existing JECFA food basket) for
exposure assessment.
c. It proposes approaches for acute and chronic exposure assessment.
d. It provides simplicity for including non-standard tissues (e.g. lungs) in the
exposure assessment. For example, as, per the data reviewed, mean total offal
consumption is 25 g and a habitual heavy consumer could consume a maximum of
250 g of standard (e.g. liver) or non-standard offal (e.g. lungs), this model could
assess total exposure from both standard (i.e. muscle, liver, kidney and fat) as well
as non-standard (e.g. lungs) tissue consumption.
2. The simplified model also addresses stakeholders’ major concerns:
a. It provides a simplified method that could be harmonized across nations.
b. It simplifies the approach, thereby avoiding a potential requirement for additional
data for exposure assessment (especially by the national authority) each time a new
species is added to the label claim.
3. The simplified method can be easily adopted by national regulators. Although JECFA
does not establish withdrawal periods or set the use conditions of a veterinary drug,
national authorities do this in conjunction with the establishment of MRLs. A simple
and practical approach that can be used not only by JECFA but also by national
regulators (including developing countries) would facilitate harmonization of data
requirements and MRL/withdrawal period setting and would also simplify public
safety assessment and facilitate international trade. By removing the additive approach,
the simplified model eliminates the need to reassess exposure every time a new species
is added to the label, thereby greatly facilitating its adoption by national regulators.
4. The exposure assessment becomes independent of the number of species for which the
drug is approved—i.e. exposure assessment is conducted for each species separately
(similar to existing JECFA practice).
5. The exposure estimates derived from this approach would be supportive of JECFA’s
traditional way of expressing ADI as a range (e.g. 0–50 µg/kg body weight) and
factoring in the good veterinary practice philosophy in the safety assessment of
veterinary drug residues.
6. This method could still retain the flexibility of using the species-specific consumption
data in exposure assessment for special circumstances (e.g. drug would be used only in
one species, or species-specific exposure assessment would be required for
establishing withdrawal period to meet good agricultural practice).
Acute exposure assessment
For acute exposure assessment, it could be assumed that a person consuming a very large
quantity of one type of meat or eggs would not also consume a large quantity of another meat
or eggs. So, the proposed acute exposure assessment is not an additive model. As a result, the
acute exposure assessment would be specific to each species for which the drug is assessed.

76
However, the acute exposure model could also benefit from some simplification. For
example, the highest muscle consumption value recommended for acute exposure assessment
(see Table 3 of the Expert Meeting report) is 419–665 g/person per day. A possible
simplification would be to specify, for example, 600 g as the consumption value of
mammalian (or all) muscle to be used in exposure assessment. Similar values for all
commodities could also be identified.
One additional point that might need consideration for acute exposure assessment is whether
some heavy consumers of meat (muscle, liver, kidney, fat or eggs) could also consume a high
quantity of milk on the same day. If so, exposure estimates from tissues and milk might have
to be added to compare with the ARfD.
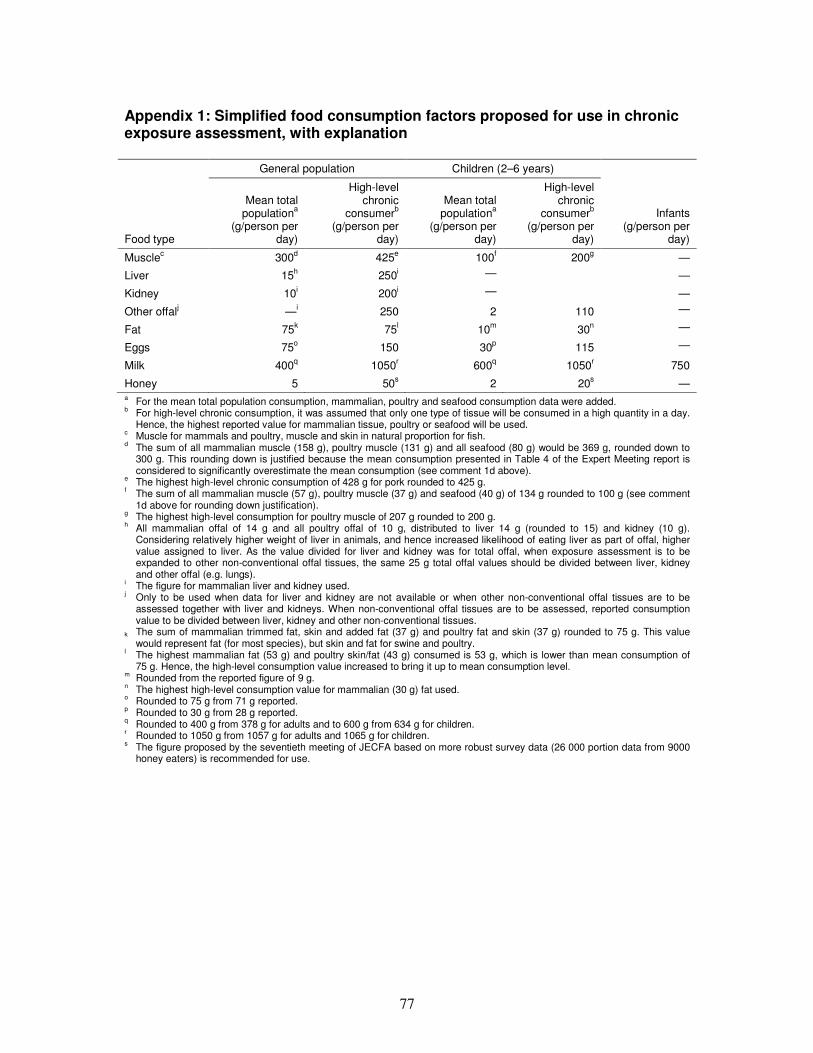
77
Appendix 1: Simplified food consumption factors proposed for use in chronic exposure assessment, with explanation
General population Children (2–6 years)
Infants (g/person per
day) Food type
Mean total populationa
(g/person per day)
High-level chronic
consumerb (g/person per
day)
Mean total populationa
(g/person per day)
High-level chronic
consumerb (g/person per
day)
Musclec 300d 425e 100f 200g —
Liver 15h 250i — —
Kidney 10i 200i — —
Other offalj —i 250 2 110 —
Fat 75k 75l 10m 30n —
Eggs 75o 150 30p 115 —
Milk 400q 1050r 600q 1050r 750
Honey 5 50s 2 20s — a For the mean total population consumption, mammalian, poultry and seafood consumption data were added. b For high-level chronic consumption, it was assumed that only one type of tissue will be consumed in a high quantity in a day.
Hence, the highest reported value for mammalian tissue, poultry or seafood will be used. c Muscle for mammals and poultry, muscle and skin in natural proportion for fish. d The sum of all mammalian muscle (158 g), poultry muscle (131 g) and all seafood (80 g) would be 369 g, rounded down to
300 g. This rounding down is justified because the mean consumption presented in Table 4 of the Expert Meeting report is considered to significantly overestimate the mean consumption (see comment 1d above).
e The highest high-level chronic consumption of 428 g for pork rounded to 425 g. f The sum of all mammalian muscle (57 g), poultry muscle (37 g) and seafood (40 g) of 134 g rounded to 100 g (see comment
1d above for rounding down justification). g The highest high-level consumption for poultry muscle of 207 g rounded to 200 g. h All mammalian offal of 14 g and all poultry offal of 10 g, distributed to liver 14 g (rounded to 15) and kidney (10 g).
Considering relatively higher weight of liver in animals, and hence increased likelihood of eating liver as part of offal, higher value assigned to liver. As the value divided for liver and kidney was for total offal, when exposure assessment is to be expanded to other non-conventional offal tissues, the same 25 g total offal values should be divided between liver, kidney and other offal (e.g. lungs).
i The figure for mammalian liver and kidney used. j Only to be used when data for liver and kidney are not available or when other non-conventional offal tissues are to be
assessed together with liver and kidneys. When non-conventional offal tissues are to be assessed, reported consumption value to be divided between liver, kidney and other non-conventional tissues.
k The sum of mammalian trimmed fat, skin and added fat (37 g) and poultry fat and skin (37 g) rounded to 75 g. This value would represent fat (for most species), but skin and fat for swine and poultry.
l The highest mammalian fat (53 g) and poultry skin/fat (43 g) consumed is 53 g, which is lower than mean consumption of 75 g. Hence, the high-level consumption value increased to bring it up to mean consumption level.
m Rounded from the reported figure of 9 g. n The highest high-level consumption value for mammalian (30 g) fat used. o Rounded to 75 g from 71 g reported. p Rounded to 30 g from 28 g reported. q Rounded to 400 g from 378 g for adults and to 600 g from 634 g for children. r Rounded to 1050 g from 1057 g for adults and 1065 g for children. s The figure proposed by the seventieth meeting of JECFA based on more robust survey data (26 000 portion data from 9000
honey eaters) is recommended for use.

78
Joint FAO/WHO Expert Meeting on Dietary
Exposure Assessment Methodologies
for Residues of Veterinary Drugs