pig pocketbook - ahdb pork index - pig pocketbook chapter 1 - marketing chain 3 table 1.1 uk pig...
TRANSCRIPT

Pig Pocketbook

1
Index - Pig Pocketbook
Chapter 1 - Marketing Chain 3Table 1.1 UK pig meat supply balance 3Figure 1.1 UK product flows in the pig meat marketing chain in 2016 3Table 1.2 EU pig meat supply balance 4
Chapter 2 - Pig Numbers 5Figure 2.1 Density of pigs, June 2013 5Table 2.1 UK pig numbers, June survey 6Table 2.2 UK female breeding pig herd and holding numbers, June survey 6Figure 2.2 Breeding sow numbers 7Table 2.3 Breeding pig numbers by region, June survey 7Figure 2.3 Breeding pig numbers in the EU 8
Chapter 3 - Abattoirs 9Figure 3.1 English pig abattoir numbers 9Table 3.1 Abattoirs slaughtering pigs in England 9Table 3.2 Size profile of all abattoirs slaughtering pigs in England, 2016 10Table 3.3 Size profile of specialist pig abattoirs in England, 2016 10
Chapter 4 - Slaughterings and Production 11Table 4.1 UK pig slaughterings 11Figure 4.1 Trends in UK clean pig slaughterings 11Figure 4.2 Weekly clean pig slaughter, UK 12Figure 4.3 Weekly sow culling, UK 12Figure 4.4 Average clean pig carcase weights, UK 13Figure 4.5 Pig meat production trends, UK 13Table 4.2 Industry trends (productivity and production) 14Figure 4.6 Clean pig slaughterings: three-week rolling average, Germany 15Figure 4.7 Weekly sow slaughterings, Germany 15Figure 4.8 EU pig meat production, 2016 16Figure 4.9 Average pig carcase weights in the EU, 2016 16
Chapter 5 - Livestock and Meat Prices 17Table 5.1 GB deadweight pig prices 17Table 5.2 GB weaner prices 18Figure 5.1 GB average producer pig prices 19Figure 5.2 GB average weaner prices 19Figure 5.3 GB retail producer price spreads 20Figure 5.4 UK and EU pig meat reference prices 20Figure 5.5 Global pork export prices 21
2
Chapter 6 - Imports and Exports 22Table 6.1 Volume of total UK pig meat imports 22Table 6.2 Value of total UK pig meat imports 22Table 6.3 UK fresh/frozen pork imports by source 23Table 6.4 UK bacon imports by source 23Table 6.5 Volume of total UK pig meat exports 24Table 6.6 Value of total UK pig meat exports 24Table 6.7 Volume of UK fresh/frozen pork exports by destination 25Table 6.8 Value of UK fresh/frozen pork exports by destination 25Figure 6.1 Map of UK fresh/frozen pork exports by destination 26Table 6.9 Volume of UK pig offal exports by destination 27Table 6.10 Value of UK pig offal exports by destination 27Table 6.11 EU fresh/frozen pig meat exports to non-EU countries 28Table 6.12 EU fresh/frozen pork exports by destination 29Table 6.13 EU pig offal exports by destination 30
Chapter 7 - Consumption 31Table 7.1 UK per capita consumption of major meats 31Table 7.2 GB retail value sales by type of outlet 31Figure 7.1 GB retailer shares of pork market by value, 2016 32Figure 7.2 Trends in GB household pork purchases by volume 32Figure 7.3 Change in GB retail volume and value sales of pig meat products, 2016 33Figure 7.4 GB volume sales of pig meat by product, 2016 33Figure 7.5 Average GB retail price of pig meat products, 2016 34Figure 7.6 Share of pig meat products sold on promotion in GB retail outlets 34Figure 7.7 Per capita consumption of pig meat in selected EU Member States, 2016 35Figure 7.8 Percentage of product facings with British logo sold in the total GB market 36Figure 7.9 Percentage of product facings with Red Tractor quality standard mark sold in the total GB market 36
Chapter 8 - Pig Carcase Classification 37 Figure 8.1 Locations of probing on a pig carcase 38Figure 8.2 Distribution of the GB classified sample by carcase weight 39Figure 8.3 Average carcase weights of the GB collected sample 40Figure 8.4 Distribution of the classified sample in EC grade by weight band, 2016 40Figure 8.5 Distribution of the GB classified sample by EC grade, 2016 41Figure 8.6 Trends in P2 fat depth 41
Chapter 9 - Feed Prices 42 Figure 9.1 Average pig compound feed prices, GB 42Figure 9.2 Feed wheat and soya meal prices 42
3
Chapter 1 - Marketing Chain
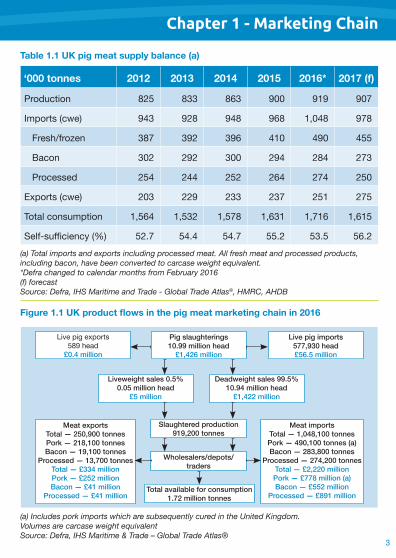
Table 1.1 UK pig meat supply balance (a)
Figure 1.1 UK product flows in the pig meat marketing chain in 2016
‘000 tonnes 2012 2013 2014 2015 2016* 2017 (f)
roduction 25 900 919 90
Im orts (cwe) 9 92 9 9 1 0 9
resh ro en 92 9 10 90 55
acon 02 292 00 29 2 2
rocessed 25 2 252 2 2 250
orts (cwe) 20 229 2 2 251 2 5
Total consumption 1 5 1 5 2 1 5 1 1 1 1 1 15
Sel su ciency ( ) 52 5 5 55 2 5 5 5 2(a) Total imports and exports including processed meat. All fresh meat and processed products, including bacon, have been converted to carcase weight equivalent.*Defra changed to calendar months from February 2016 (f) forecast Source: Defra, IHS Maritime and Trade - Global Trade Atlas®, HMRC, AHDB
ive ig e orts5 9 head
£0.4 million
Pig slaughterings10.99 million head
£1,426 million
Liveweight sales 0.5%0.05 million head
£5 million
Deadweight sales 99.5%10.94 million head
£1,422 million
Live pig imports577,930 head£56.5 million
Meat exportsTotal — 250,900 tonnesPork — 218,100 tonnesBacon — 19,100 tonnes
Processed — 13,700 tonnesTotal — £334 millionPork — £252 millionBacon — £41 million
Processed — £41 million
Meat imports Total — 1,048,100 tonnesPork — 490,100 tonnes (a)Bacon — 283,800 tonnes
Processed — 274,200 tonnesTotal — £2,220 millionPork — £778 million (a)Bacon — £552 million
Processed — £891 million
Slaughtered production919,200 tonnes
Wholesalers/depots/traders
Total available for consumption1.72 million tonnes
(a) Includes pork imports which are subsequently cured in the United Kingdom. Volumes are carcase weight equivalent Source: Defra, IHS Maritime & Trade – Global Trade Atlas®

Marketing Chain
Table 1.2 EU pig meat supply balance
‘000 tonnes 2012 2013 2014 2015 2016 2017 (f)
Net production 22 519 22 5 22 5 2 25 2 09 2 2
Im orts 19 15 1 11 12 12
orts 2 191 2 2 1 9 2 21 2 95 2 5
onsum tion 20 20 1 20 00 21 050 20 52 20 0
Sel su ciency ( ) 111 111 110 111 11 112
All data is carcase weight equivalent. (f) forecastNote: The EU Commission has revised the series compared with last year’s edition of the pocketbookSource: EU Commission
What does this mean for the industry?
el ing our levy ayers ma e sense o the issues as they evolve el ing ey sta eholders and overnment to see
the best ossible deal or our industries outside the
htt : www ahdb org u bre it

5
Figure 2.1 Density of pigs, June 2013
Source: AHDB, Defra, Welsh Government, DARD, Scottish GovernmentNote: Data covers commercial holdings only
Chapter 2 - Pig Numbers
Pig density(pigs per square km)
Under 5
5-10
10-20
20-50
50+
Orkney and Shetlands
468
Jun06
Dec06
Jun07
Dec07
Jun08
Dec08
Jun09
Dec09
Jun10
Dec10
Jun11
Dec11
Jun12
Dec12
Jun13
Dec13
Jun14
Dec14
Jun15
Dec15
Jun16
Dec16
449 455
436421 426 426
417427 423
432
409425
400
421
398406
390408 401
415 409
300
350
400
450
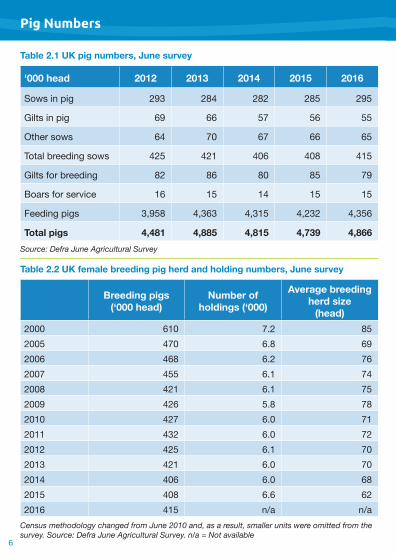
500‘000 head'000 head 2012 2013 2014 2015 2016
Sows in ig 29 2 2 2 2 5 295
ilts in ig 9 5 5 55
Other sows 0 5
otal breeding sows 25 21 0 0 15
ilts or breeding 2 0 5 9
oars or service 1 15 1 15 15
Feeding pigs 95 15 2 2 5
Total pigs 4,481 4,885 4,815 4,739 4,866
Breeding pigs (‘000 head)
Number of holdings (‘000)
Average breeding herd size
(head)2000 10 2 52005 0 9200 2200 55 1200 21 1 52009 2 52010 2 0 12011 2 0 22012 25 1 0201 21 0 0201 0 02015 0 2201 15 n a n a
Table 2.1 UK pig numbers, June survey
Table 2.2 UK female breeding pig herd and holding numbers, June survey
Source: Defra June Agricultural Survey
Census methodology changed from June 2010 and, as a result, smaller units were omitted from the survey. Source: Defra June Agricultural Survey. n/a = Not available
Pig Numbers

Pig Numbers
2012 2013 2014 2015 2016
ngland 2 1 2
ales 1 1 1 1 1
Scotland
orthern Ireland 9 10 10 10
Table 2.3 Breeding pig numbers by region, June survey
Figure 2.2 Breeding sow numbers
Source: Defra June Agricultural Survey
Source: Defra June Agricultural Survey, December census
468
Jun06
Dec06
Jun07
Dec07
Jun08
Dec08
Jun09
Dec09
Jun10
Dec10
Jun11
Dec11
Jun12
Dec12
Jun13
Dec13
Jun14
Dec14
Jun15
Dec15
Jun16
Dec16
449 455
436421 426 426
417427 423
432
409425
400
421
398406
390408 401
415 409
300
350
400
450
500‘000 head'000 head 2012 2013 2014 2015 2016
Sows in ig 29 2 2 2 2 5 295
ilts in ig 9 5 5 55
Other sows 0 5
otal breeding sows 25 21 0 0 15
ilts or breeding 2 0 5 9
oars or service 1 15 1 15 15
Feeding pigs 95 15 2 2 5
Total pigs 4,481 4,885 4,815 4,739 4,866
Table 2.2 UK female breeding pig herd and holding numbers, June survey
Census methodology changed from June 2010 and, as a result, smaller units were omitted from the survey. Source: Defra June Agricultural Survey. n/a = Not available

185
147
124115 116 118
0
20
40
60
80
100
120
140
160
180
200
2000 2005 2010 2014 2015 2016
Number
0
250
500
750
1,000
1,250
1,500
1,750
2,000
2,250
2,500
2,750
Spai
n
Ger
man
y
Den
mar
k
Net
herla
nds
Fran
ce
Pola
nd Italy
Uni
ted
King
dom
Belg
ium
Rom
ania
‘000 head
Dec-15 Dec-16
Pig Numbers
Figure 2.3 Breeding pig numbers in the EU
Source: Eurostat

9
Chapter 3 - Abattoirs
185
147
124115 116 118
0
20
40
60
80
100
120
140
160
180
200
2000 2005 2010 2014 2015 2016
Number
Figure 3.1 English pig abattoir numbers
Table 3.1 Abattoirs slaughtering pigs in England
Abattoir numbers
Of which specialist pig
abattoir numbers
Average annual throughput (head)
2000 1 5 2 5 00
2005 1 15 20
2010 12 15 59 2
201 115 1 05
2015 11 1 299
201 11 1 9
Source: AHDB data based on abattoirs operating in the calendar year.

10
12,370
8,791 9,41110,277 10,627 10,733
0
2,000
4,000
6,000
8,000
10,000
12,000
14,000
2000 2005 2010 2014 2015 2016**
‘000 head
Abattoirs
Table 3.2 Size profile of all abattoirs slaughtering pigs in England, 2016
Table 3.3 Size profile of specialist pig abattoirs in England, 2016
Size group (head)
Number of abattoirs
Total throughput
(head)
Average throughput
(head)
Share of throughput
(%)1 10 000 9 20 502 2 9 2
10 001 0 000 1 2 0 1 0 2
0 001 100 000 9 95 9 5 0
100 001 500 000 0 005 21 501 9
500 001 191 9 9 1 9
Total 118 9,008,018 76,339 100.0
Size group (head)
Number of abattoirs
Total throughput
(head)
Average throughput
(head)
Share of throughput
(%)1 100 000 5 5 10 1 022 1 0
100 001 9 55 9 0 1 1 99 0
Total 14 6,421,068 458,648 100.0
Source: AHDB data based on abattoirs operating in the calendar year.
Note: Specialist pig abattoirs are defined as plants where 95 per cent of slaughterings are pigs.Source: AHDB data based on abattoirs operating in the calendar year.
he e ood hain a rom is an interactive
ma which lots a range o in ormation including the location o abattoirs auction mar ets meat rocessors and meat traders using colour coded pins.
he ma can be accessed at the website: https://www.emap.org.uk/map.aspx

11
Chapter 4 - Slaughterings and Production
Table 4.1 UK pig slaughterings
Figure 4.1 Trends in UK clean pig slaughterings
‘000 head Sows and boars Clean pigs Total pigs
2000 21 12 0 12 92
2005 202 9 1 9 1
2010 225 9 11 9 5
201 2 10 22 10 0
2015 2 5 10 2 10 2
201 25 10 10 990
*53-week statistical year**Defra changed to calendar months from February 2016Source: Defra, AHDB
*53-week statistical year**Defra changed to calendar months from February 2016Source: Defra
12,370
8,791 9,41110,277 10,627 10,733
0
2,000
4,000
6,000
8,000
10,000
12,000
14,000
2000 2005 2010 2014 2015 2016**
‘000 head
*
Note: Specialist pig abattoirs are defined as plants where 95 per cent of slaughterings are pigs.Source: AHDB data based on abattoirs operating in the calendar year.
12
70.8
75.2
78.4
80.9 81.382.1
66
68
70
72
74
76
78
80
82
84
2000 2005 2010 2014 2015 2016
kg/pig
923.1
705.6
772.3
862.9898.6
919.2
600
700
800
900
1,000
2000 2005 2010* 2014 2015 2016**
‘000 tonnes
Slaughterings and Production
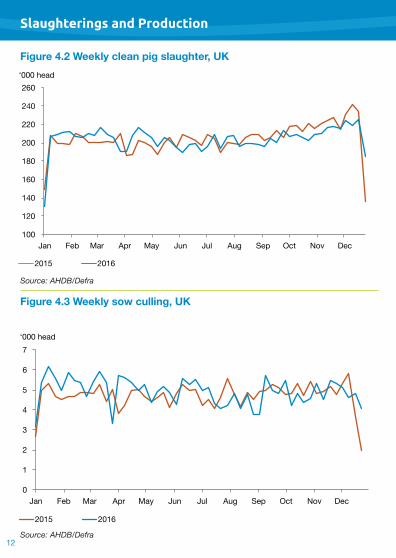
Figure 4.3 Weekly sow culling, UK
Figure 4.2 Weekly clean pig slaughter, UK
100
120
140
160
180
200
220
240
260
Jan Feb Mar Apr May Jun Jul Aug Sep Oct Nov Dec
2015 2016
‘000 head
0
1
2
3
4
5
6
7
Jan Feb Mar Apr May Jun Jul Aug Sep Oct Nov Dec
2015 2016
‘000 head
Source: AHDB/Defra
Source: AHDB/Defra

13
Slaughterings and Production
Figure 4.4 Average clean pig carcase weights, UK
Figure 4.5 Pig meat production trends, UK
70.8
75.2
78.4
80.9 81.382.1
66
68
70
72
74
76
78
80
82
84
2000 2005 2010 2014 2015 2016
kg/pig
923.1
705.6
772.3
862.9898.6
919.2
600
700
800
900
1,000
2000 2005 2010* 2014 2015 2016**
‘000 tonnes
Source: Defra
*53-week statistical year**Defra changed to calendar months from February 2016Source: Defra
100
120
140
160
180
200
220
240
260
Jan Feb Mar Apr May Jun Jul Aug Sep Oct Nov Dec
2015 2016
‘000 head

1
750
800
850
900
950
1,000
1.050
1,100
Jan Feb Mar Apr May Jun Jul Aug Sep Oct Nov Dec
2015 2016
‘000 head
Slaughterings and Production
Table 4.2 Industry trends (productivity and production)
2000 2005 2010** 2014 2015 2016***
UK average sow productivity (a)
igs er sow 19 0 1 20 2 2 9 25 25
ig meat er sow ( g) 1 5 1 1 1 5 1 9 2 0 2 121
Slaughterings and production
lean ig slaughter ( 000 head) 12 0 9 1 9 11 10 22 10 2 10
( g) 0 5 2 0 9 1 2 1
= clean pig production ( 000 tonnes) 5 2 1
Sow boar slaughter ( 000 head) 21 202 225 2 2 5 25
( g) 1 155 5 15 5 1 5 1 5 1 0
sow boar meat roduction ( 000 tonnes) 31 5 5
Total pig meat production ('000 tonnes) 923 706 772 863 899 919
*ACW = Average carcase weight **53-week statistical year***Defra changed to calendar months from February 2016 (a) NOT survey results. Based on relationship between clean pig slaughter and lagged breeding herd.Source: Defra, AHDB

15
Slaughterings and Production
Figure 4.6 Clean pig slaughterings: three-week rolling average, Germany
Figure 4.7 Weekly sow slaughterings, Germany
750
800
850
900
950
1,000
1.050
1,100
Jan Feb Mar Apr May Jun Jul Aug Sep Oct Nov Dec
2015 2016
‘000 head
Source: AMI
Source: AMI
6
8
10
12
14
16
18
20
22
24
26‘000 head
Jan Feb Mar Apr May Jun Jul Aug Sep Oct Nov Dec
2015 2016
1
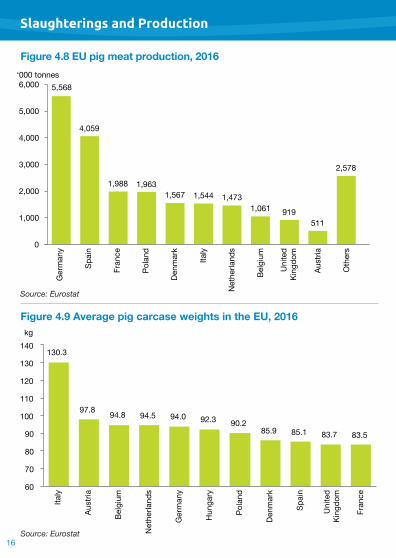
5,568
4,059
1,988 1,9631,567 1,544 1,473
1,061 919511
2,578
0
1,000
2,000
3,000
4,000
5,000
6,000‘000 tonnes
Ger
man
y
Spai
n
Fran
ce
Pola
nd
Denm
ark
Italy
Net
herla
nds
Belg
ium
Uni
ted
King
dom
Aust
ria
Oth
ers
Slaughterings and Production
Figure 4.8 EU pig meat production, 2016
Figure 4.9 Average pig carcase weights in the EU, 2016
Source: Eurostat
Source: Eurostat
130.3
97.8 94.8 94.5 94.0 92.3 90.285.9 85.1 83.7 83.5
60
70
80
90
100
110
120
130
140kg
Italy
Aust
ria
Belg
ium
Net
herla
nds
Ger
man
y
Hun
gary
Pola
nd
Denm
ark
Spai
n
Uni
ted
King
dom
Fran
ce
1
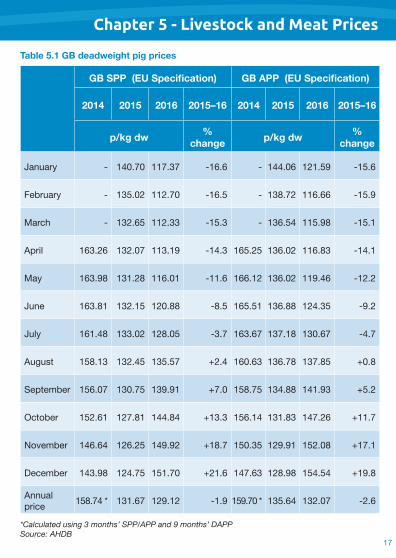
Table 5.1 GB deadweight pig prices
GB SPP (EU Specification) GB APP (EU Specification)
2014 2015 2016 2015–16 2014 2015 2016 2015–16
p/kg dw % change p/kg dw %
change
anuary 1 0 0 11 1 1 0 121 59 15
February 1 5 02 112 0 1 5 1 2 11 15 9
arch 1 2 5 112 15 1 5 115 9 15 1
April 1 2 1 2 0 11 19 1 1 5 25 1 02 11 1 1
ay 1 9 1 1 2 11 01 11 1 12 1 02 119 12 2
une 1 1 1 2 15 120 5 1 5 51 1 12 5 9 2
uly 1 1 1 02 12 05 1 1 1 1 0
August 15 1 1 2 5 1 5 5 2 1 0 1 1 5 0
Se tember 15 0 1 0 5 1 9 91 0 15 5 1 1 1 9 5 2
October 152 1 12 1 1 1 15 1 1 1 1 2 11
ovember 1 12 25 1 9 92 1 150 5 129 91 152 0 1 1
ecember 1 9 12 5 151 0 21 1 12 9 15 5 19
Annual price 15 1 1 129 12 1 9 159 0 1 5 1 2 0 2
*Calculated using 3 months’ SPP/APP and 9 months’ DAPP Source: AHDB
Chapter 5 - Livestock and Meat Prices
Figure 4.8 EU pig meat production, 2016
1
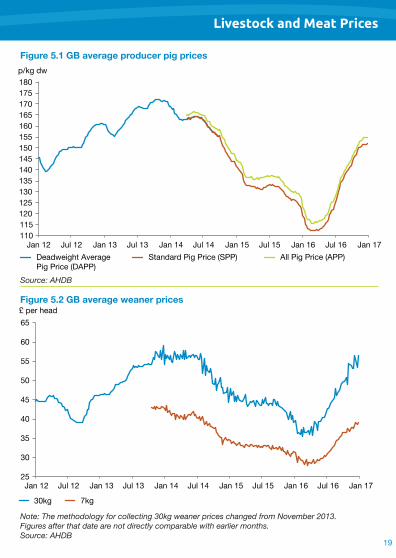
110115120125130135140145150155160165170175180
Jan 12 Jul 12 Jan 13 Jul 13 Jan 14 Jul 14 Jan 15 Jul 15 Jan 16 Jul 16 Jan 17Deadweight Average Pig Price (DAPP)
Standard Pig Price (SPP) All Pig Price (APP)
p/kg dw
25
30
35
40
45
50
55
60
65
Jan 12 Jul 12 Jan 13 Jul 13 Jan 14 Jul 14 Jan 15 Jul 15 Jan 16 Jul 16 Jan 17
30kg 7kg
£ per head
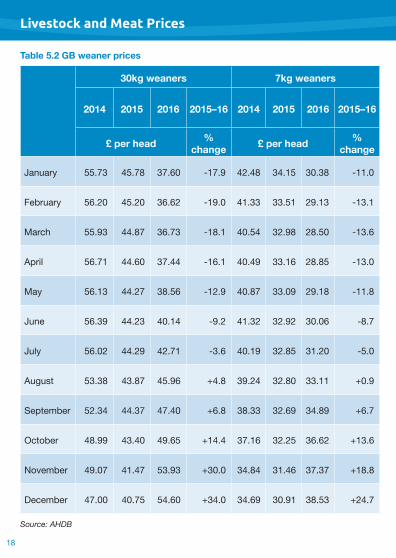
Table 5.2 GB weaner prices
30kg weaners 7kg weaners
2014 2015 2016 2015–16 2014 2015 2016 2015–16
£ per head % change £ per head %
change
anuary 55 5 0 1 9 2 15 0 11 0
February 5 20 5 20 2 19 0 1 51 29 1 1 1
arch 55 9 1 1 0 5 2 9 2 50 1
April 5 1 0 1 1 0 9 1 2 5 1 0
ay 5 1 2 5 12 9 0 09 29 1 11
une 5 9 2 0 1 9 2 1 2 2 92 0 0
uly 5 02 29 2 1 0 19 2 5 1 20 5 0
August 5 5 9 9 2 2 0 33.11 0 9
Se tember 52 0 2 9 9
October 99 0 9 5 1 1 2 25 2 1
ovember 9 0 1 5 9 0 0 1 1
ecember 00 0 5 5 0 0 9 0 91 5 2
Source: AHDB
Livestock and Meat Prices
19
110115120125130135140145150155160165170175180
Jan 12 Jul 12 Jan 13 Jul 13 Jan 14 Jul 14 Jan 15 Jul 15 Jan 16 Jul 16 Jan 17Deadweight Average Pig Price (DAPP)
Standard Pig Price (SPP) All Pig Price (APP)
p/kg dw
Figure 5.1 GB average producer pig prices
Figure 5.2 GB average weaner prices
Source: AHDB
Note: The methodology for collecting 30kg weaner prices changed from November 2013. Figures after that date are not directly comparable with earlier months. Source: AHDB
25
30
35
40
45
50
55
60
65
Jan 12 Jul 12 Jan 13 Jul 13 Jan 14 Jul 14 Jan 15 Jul 15 Jan 16 Jul 16 Jan 17
30kg 7kg
£ per head
Livestock and Meat Prices

20
38.636.6 38.2
40.4
35.0 34.7
0
10
20
30
40
50
2000 2005 2010 2014 2015 2016
% of retail price
Note: Graph shows the average percentage of the retail price received by producers.
7 0
8 0
9 0
100
110
120
13 0
14 0
150
16 0
17 0
18 0
J u l 12J a n 12 J a n 13 J u l 13 J a n 14 J u l 14 J a n 15 J u l 15 J a n 16 J u l 16 J a n 17UK E U a v era g e
p / k g dw
Figure 5.3 GB retail:producer price spreads
Figure 5.4 UK and EU pig meat reference prices
Source: AHDB
Source: EU Commission
Livestock and Meat Prices
21
Livestock and Meat Prices
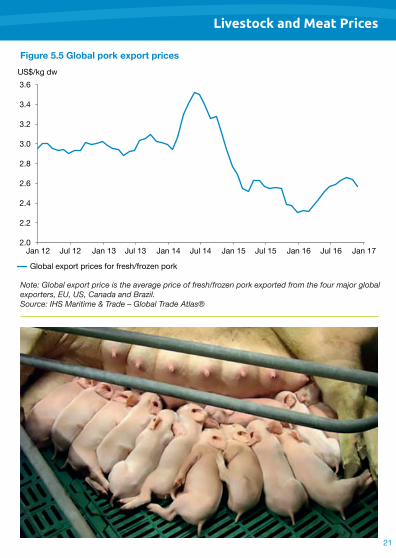
Figure 5.5 Global pork export prices
Note: Global export price is the average price of fresh/frozen pork exported from the four major global exporters, EU, US, Canada and Brazil.Source: IHS Maritime & Trade – Global Trade Atlas®
2.0
2.2
2.4
2.6
2.8
3.0
3.2
3.4
3.6
Jan 12 Jan 13Jul 12 Jul 13 Jan 14 Jul 14 Jan 15 Jul 15 Jan 16 Jul 16 Jan 17
Global export prices for fresh/frozen pork
US$/kg dw
7 0
8 0
9 0
100
110
120
13 0
14 0
150
16 0
17 0
18 0
J u l 12J a n 12 J a n 13 J u l 13 J a n 14 J u l 14 J a n 15 J u l 15 J a n 16 J u l 16 J a n 17UK E U a v era g e
p / k g dw

22
Chapter 6 - Imports and Exports
Tonnes, product weight 2012 2013 2014 2015 2016
resh ro en meat 9 19 51 2 5 1 1 9 9
acon ham 25 1 2 9 25 155 251 050 2 2 555
Sausages 10 5 105 109 2 122 2 122 9 0
rocessed hams shoulders and ieces 1 1 251 1 51 1 9 9 1 0 125 1 9 10
Total 855,800 841,919 862,559 885,603 954,311
ive igs (head) 91 9 55 212 9 1 20 91 5 9 0
£‘000 2012 2013 2014 2015 2016
resh ro en meat 90 1 9 99 0 1 125
acon ham 10 1 01 5 5 551 909
Sausages 0 20 9 52 0 95 1 5
rocessed hams shoulders and ieces 19 11 51 9 1 2 0 95 55
Total 2,088,104 2,194,205 2,143,239 1,956,178 2,220,280
ive igs (head) 2 5 9 2 1 2 0 5
Table 6.1 Volume of total UK pig meat imports
Table 6.2 Value of total UK pig meat imports
*Including canned Source: IHS Maritime & Trade – Global Trade Atlas®, HMRC
*Including canned Source: IHS Maritime & Trade – Global Trade Atlas®, HMRC

2
Tonnes, product weight 2012 2013 2014 2015 2016
Total 257,814 249,847 256,155 251,050 242,555
enmar 105 9 2 10 0 115 150 95 2 92 2
etherlands 10 92 90 09 1 92 295
ermany 2 1 0 12 5 0 2 1
Tonnes, product weight 2012 2013 2014 2015 2016
Total 349,198 351,723 358,138 371,746 439,693
enmar 99 5 1 5 9 0 9 5 1 9
ermany 1 51 5 9 0
etherlands 9 0 5 55 55 95 9 1
S ain 2 5 2 1 2 0 9 5 2 2
elgium 2 0 2 09 5 502 5
Ireland 52 1 1 9 2 52 2
France 55 0 0 9 1 9 2 2 0 2 995
oland 2 95 2 19 9 11 292 1 29
ortugal 22 1 5 2 1 2 2
Italy 2 9 2 2 5 90 2 0
omania 0 222 1 1 11
nited States 9 5 909 95
Table 6.4 UK bacon imports by source
Table 6.3 UK fresh/frozen pork imports by source
Source: IHS Maritime & Trade – Global Trade Atlas®, HMRC
Source: IHS Maritime & Trade – Global Trade Atlas®, HMRC
Imports and Exports
£‘000 2012 2013 2014 2015 2016
resh ro en meat 90 1 9 99 0 1 125
acon ham 10 1 01 5 5 551 909
Sausages 0 20 9 52 0 95 1 5
rocessed hams shoulders and ieces 19 11 51 9 1 2 0 95 55
Total 2,088,104 2,194,205 2,143,239 1,956,178 2,220,280
ive igs (head) 2 5 9 2 1 2 0 5

2
Imports and Exports
Tonnes, product weight 2012 2013 2014 2015 2016
resh ro en meat 15 00 1 0 9 1 1 1 1 0 0 205
acon ham 15 509 1 5 9 1 909 15 921 1 0
Sausages 9 02 10 10 12 9 1 2 0
rocessed hams shoulders and ieces 12 2 12 02 1 02 1 1 1 12 1
ig offal 5 1 5 0 5 929 00
Total 240,313 258,836 265,120 284,442 318,164
ive igs (head) 10 2 0 9 1 295 12 5 9
£‘000 2012 2013 2014 2015 2016
resh ro en meat 1 9 2 21 1 209 1 19 05 251 9
acon ham 9 9 1 9 25 1 2 1 20
Sausages 1 20 1 20 1 2 9 1 15 15 5
rocessed hams shoulders and ieces 2 90 29 002 2 1 1 11 25 0
ig offal 0 2 9 2 091 5 0 5
Total 306,678 329,572 334,992 321,276 398,102
ive igs (head) 1 1 1 1 1 2 52
Table 6.5 Volume of total UK pig meat exports
Table 6.6 Value of total UK pig meat exports
*includes cannedSource: IHS Maritime & Trade – Global Trade Atlas®, HMRC
*includes cannedSource: IHS Maritime & Trade – Global Trade Atlas®, HMRC

25
Imports and Exports
Tonnes, product weight 2012 2013 2014 2015 2016
Total 154,300 180,749 181,713 187,080 205,886
2 112 1 12 2 12 90 1 0 122 1 0 9
Ireland 2 1 29 110 2 950 1 0 2 5
ermany 2 529 0 9 0 0 9 1 20 2 5 1
enmar 12 255 20 9 2 02 2 0 22 1 0
etherlands 1 5 21 19 1 0 1
Sweden 0 2 10 025 9 05
elgium 5 5 9 1 21 5 5
hina 11 5 25 00 2 9 2 250 0 01
Hong Kong 19 025 15 2 1 11 12 10
nited States 2 112 2 5 99 1
Table 6.7 Volume of UK fresh/frozen pork exports by destination
Table 6.8 Value of UK fresh/frozen pork exports by destination
Source: IHS Maritime & Trade – Global Trade Atlas®, HMRC
Source: IHS Maritime & Trade – Global Trade Atlas®, HMRC
£‘000 2012 2013 2014 2015 2016
Total 189,342 218,136 209,178 197,405 251,889
2 1 00 1 52 15 1 11 159 5
Ireland 9 9 1 1 0 5 509 0 5 1
ermany 9 5 1 9 5 2 2 112 2 1 2
enmar 15 1 22 2 2 22 25 000
etherlands 1 101 19 1 0 1 19 9 512 10
Sweden 551 2 529 259 15
elgium 99 55 219 2 9
hina 10 5 20 1 19 19 25 02
nited States 9 5 9 10 9 2 10 2 9 1 99 2 0
Hong Kong 1 0 1 1 5 11 9 0 2 10 2
Tonnes, product weight 2012 2013 2014 2015 2016
resh ro en meat 15 00 1 0 9 1 1 1 1 0 0 205
acon ham 15 509 1 5 9 1 909 15 921 1 0
Sausages 9 02 10 10 12 9 1 2 0
rocessed hams shoulders and ieces 12 2 12 02 1 02 1 1 1 12 1
ig offal 5 1 5 0 5 929 00
Total 240,313 258,836 265,120 284,442 318,164
ive igs (head) 10 2 0 9 1 295 12 5 9
£‘000 2012 2013 2014 2015 2016
resh ro en meat 1 9 2 21 1 209 1 19 05 251 9
acon ham 9 9 1 9 25 1 2 1 20
Sausages 1 20 1 20 1 2 9 1 15 15 5
rocessed hams shoulders and ieces 2 90 29 002 2 1 1 11 25 0
ig offal 0 2 9 2 091 5 0 5
Total 306,678 329,572 334,992 321,276 398,102
ive igs (head) 1 1 1 1 1 2 52
2
Imports and Exports
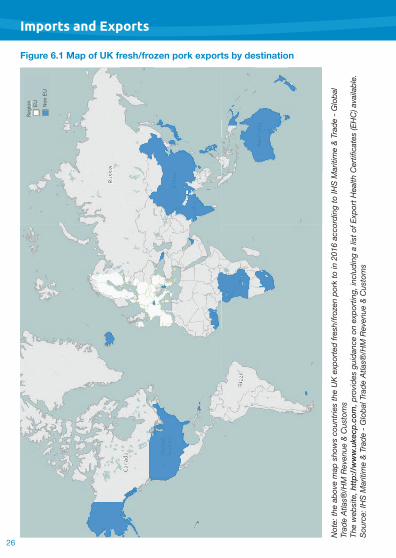
Figure 6.1 Map of UK fresh/frozen pork exports by destination
Regi
on EU
Non
EU
Figu
re 6
.1 M
ap o
f UK
fres
h/fr
ozen
por
k ex
port
s by
des
tinat
ion
Not
e: T
he a
bove
map
sho
ws
coun
trie
s th
e U
K e
xpor
ted
fres
h/fr
ozen
por
k to
in 2
016
acco
rdin
g to
IHS
Mar
itim
e &
Tra
de –
Glo
bal T
rade
Atla
s®/H
M R
even
ue &
Cus
tom
s.
The
web
site
bel
ow p
rovi
des
guid
ance
on
expo
rtin
g, in
clud
ing
a lis
t of E
xpor
t Hea
lth C
ertif
icat
es (
EH
C)
avai
labl
e: ht
tp://
ww
w.u
kecp
.com
/ So
urce
: IH
S M
ariti
me
& T
rade
– G
loba
l Tra
de A
tlas®
/HM
Rev
enue
& C
usto
ms
Not
e: th
e ab
ove
map
sho
ws
coun
tries
the
UK
expo
rted
fresh
/froz
en p
ork
to in
201
6 ac
cord
ing
to IH
S M
ariti
me
& Tr
ade
- Glo
bal
Trad
e At
las®
/HM
Rev
enue
& C
usto
ms
The
web
site,
http
://w
ww
.uke
cp.c
om, p
rovid
es g
uida
nce
on e
xpor
ting,
incl
udin
g a
list o
f Exp
ort H
ealth
Cer
tifica
tes
(EH
C) a
vaila
ble.
Sour
ce: I
HS
Mar
itim
e &
Trad
e - G
loba
l Tra
de A
tlas®
/HM
Rev
enue
& C
usto
ms

2
Imports and Exports
Table 6.9 Volume of UK pig offal exports by destination
Table 6.10 Value of UK pig offal exports by destination
Source: IHS Maritime & Trade – Global Trade Atlas®, HMRC
Source: IHS Maritime & Trade – Global Trade Atlas®, HMRC
£‘000 2012 2013 2014 2015 2016
Total 30,249 26,091 35,048 38,464 64,353
2 1 22 10 11 5 50 5 21 9
etherlands 5 2 25 1 59 1 50 0
Ireland 2 2 2 0 2 1 1 1
elgium 1 0 12 290 500
hina 10 5 555 11 5 1 9 1 5
Hong Kong 255 10 1 12 11 15 1 9
hili ines 5 2 9 1 1 0 121
South orea 199 19 9 92 1 9
ietnam 512 595
ote d Ivoire 150 1 19 0
Tonnes, product weight 2012 2013 2014 2015 2016
Total 48,534 41,648 45,084 58,929 77,007
2 5 000 22 2 11 1 0 1 29 15 92
etherlands 11 1 10 5 09 2 5
enmar 2 1 2 2 0 9 1
Ireland 5 9 1 951 2 1 91 2 21
elgium 9 0 01 1 2 1 1
hina 0 9 2 1 202 2 2 0 1
Hong Kong 9 5 5 11 9 0 10 95 15 19
hili ines 19 52 1 2 2 005 2 9
South orea 22 21 1 9 1 55
ote d Ivoire 9 1 01 1 09
2
Imports and Exports
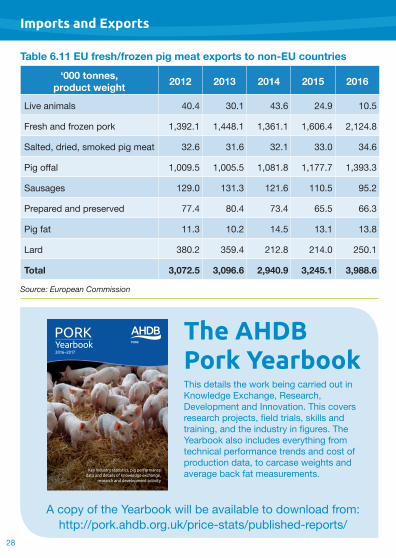
‘000 tonnes, product weight 2012 2013 2014 2015 2016
ive animals 0 0 1 2 9 10 5
resh and ro en or 1 92 1 1 1 1 1 1 1 0 2 12
Salted dried smo ed ig meat 2 1 2 1 0
ig offal 1 009 5 1 005 5 1 0 1 1 1 1 9
Sausages 129 0 131.3 121 110 5 95 2
re ared and reserved 0 5 5
ig at 11.3 10 2 1 5 13.1 1
ard 0 2 59 212 21 0 250 1
Total 3,072.5 3,096.6 2,940.9 3,245.1 3,988.6
Table 6.11 EU fresh/frozen pig meat exports to non-EU countries
Source: European Commission
The AHDB Pork Yearbook
his details the wor being carried out in nowledge change esearch evelo ment and Innovation his covers
research rojects field trials s ills and training and the industry in figures he earboo also includes everything rom
technical er ormance trends and cost o roduction data to carcase weights and
average bac at measurements
co y o the earboo will be available to download rom:htt : or ahdb org u rice stats ublished re orts
Yearbook 2016–2017
PORK
Key industry statistics, pig performance data and details of knowledge exchange,
research and development activity

29
Tonnes, product weight 2012 2013 2014 2015 2016
Total 1,557,007 1,603,400 1,562,951 1,741,397 2,308,270
hina 229 95 0 1 290 95 5 1 9 52
a an 22 122 2 9 1 292 1 05
South orea 1 252 99 1 19 9 5 1 92 219 1
Hong Kong 10 11 1 1 0 995 9 92 1 0
hili ines 2 9 0 10 9 5 90 0 9
nited States 2 992 1 1 1 2 2
Australia 1 95 222 25 0 1 5 5
aiwan 5 11 2 2 111 0 0 2 2
ew ealand 12 0 12 502 19 520 25 5 0 15
Singa ore 2 05 1 2 19 2 2 25 25
Serbia 9 90 10 510 19 2 20 22 15
South rica 22 5 0 1 05 1 129 2 1 21 919
ontenegro 1 1 91 2 2 19 90 20 5 0
ussia 09 1 55 1 9 3 15
Imports and Exports
Table 6.12 EU fresh/frozen pork exports by destination
Source: IHS Maritime & Trade – Global Trade Atlas®, HMRCNote: Totals are higher than those of the EU Commission reported in Table 6.11 as the latter excludes meat from non-domestic swine

0
Table 6.13 EU pig offal exports by destination
Source: IHS Maritime & Trade – Global Trade Atlas®, HMRCNote: Totals are higher than those of the EU Commission reported in Table 6.11 as the latter excludes meat from non-domestic swine
Tonnes, product weight 2012 2013 2014 2015 2016
Total 1,007,656 1,003,841 1,083,962 1,176,103 1,391,017
hina 5 99 0 9 1 501 22 51
Hong Kong 292 2 2 1 5 2 1 51 20 51 2 9 2
hili ines 9 2 5 9 1 95 0 5
ietnam 5 2 15 9 59 25 1 1 5
South orea 1 99 1 00 1 5 0 9 29 0
hailand 12 51 1 0 2 9 1 2 59 2 5
a an 0 12 2 1 90 25 9
raine 2 15 19 0 22 2 2 1 22 59
ussia 121 2 9 55 5 01 2 21
Imports and Exports
31
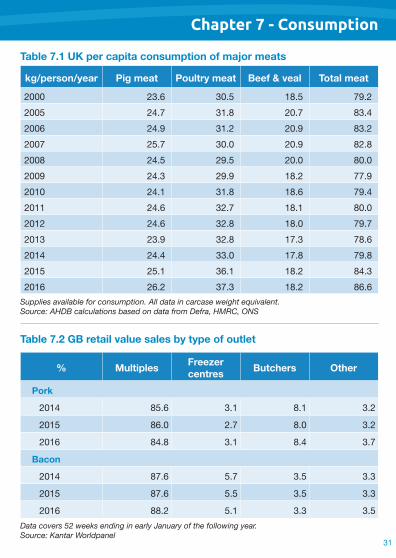
Chapter 7 - Consumption
kg/person/year Pig meat Poultry meat Beef & veal Total meat
2000 2 0 5 1 5 9 22005 2 1 20200 2 9 1 2 20 9 2200 25 0 0 20 9 2200 2 5 29 5 20 0 0 02009 2 29 9 1 2 92010 2 1 1 1 92011 2 2 1 1 0 02012 2 2 1 0 9201 2 9 2 1201 2 0 1 92015 25 1 1 1 2201 2 2 1 2
% Multiples Freezer centres Butchers Other
Pork
201 5 3.1 1 2
2015 0 2 0 2
201 3.1
Bacon
201 5 5 3.3
2015 5 5 5 3.3
201 2 5 1 3.3 5
Table 7.1 UK per capita consumption of major meats
Table 7.2 GB retail value sales by type of outlet
Supplies available for consumption. All data in carcase weight equivalent.Source: AHDB calculations based on data from Defra, HMRC, ONS
Data covers 52 weeks ending in early January of the following year. Source: Kantar Worldpanel
Tonnes, product weight 2012 2013 2014 2015 2016
Total 1,007,656 1,003,841 1,083,962 1,176,103 1,391,017
hina 5 99 0 9 1 501 22 51
Hong Kong 292 2 2 1 5 2 1 51 20 51 2 9 2
hili ines 9 2 5 9 1 95 0 5
ietnam 5 2 15 9 59 25 1 1 5
South orea 1 99 1 00 1 5 0 9 29 0
hailand 12 51 1 0 2 9 1 2 59 2 5
a an 0 12 2 1 90 25 9
raine 2 15 19 0 22 2 2 1 22 59
ussia 121 2 9 55 5 01 2 21
2
-2.4
-9.7
-0.7
5.0
-7.3
0.5 1.8
-2.7
7.6
-8.7
-20.0
-5.2 -4.9-7.6 -6.2 -5.9 -4.2
2.1
-4-8
-12-16-20-24
048
12
FreshPork
FrozenPork
FreshPork
Sausages
FrozenPork
Sausages
LoosePork
Sausages
Bacon Gammon SlicedCooked
Ham
SlicedCooked
Pork
yoy % change
Volume Value
0
20
40
60
80
100
120
140
160
180
FreshPork
FrozenPork
FreshPork
Sausages
FrozenPork
Sausages
LoosePork
Sausages
Bacon Gammon SlicedCooked
Ham
SlicedCooked
Pork
‘000 tonnes
158.27
4.99
119.92
32.33
10.62
157.32
57.60
127.94
3.84
Consumption
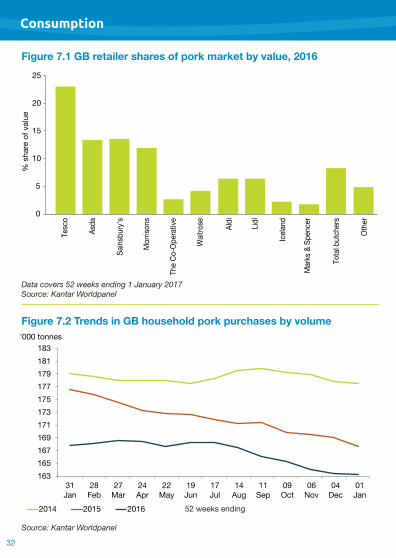
Figure 7.1 GB retailer shares of pork market by value, 2016
Figure 7.2 Trends in GB household pork purchases by volume
0
Tesc
o
Asda
Sains
bury
’s
Mor
rison
s
The
Co-O
pera
tive
Wait
rose Aldi Lid
l
Icela
nd
Mar
ks &
Spe
ncer
Tota
l but
cher
s
Othe
r
5
10
15
20
25
% s
hare
of v
alue
Data covers 52 weeks ending 1 January 2017Source: Kantar Worldpanel
Source: Kantar Worldpanel
163165167169171173175177179181183
31Jan
28Feb
27Mar
24Apr
22May
19Jun
17Jul
14Aug
11Sep
09Oct
06Nov
04Dec
01Jan
2014 2015 2016
'000 tonnes
52 wee s ending

33
Consumption
Figure 7.3 Change in GB retail volume and value sales of pig meat products, 2016
Figure 7.4 GB volume sales of pig meat by product, 2016
Data covers 52 weeks ending early January of the following year.Source: Kantar Worldpanel
Data covers 52 weeks ending 1 January 2017.Source: Kantar Worldpanel
-2.4
-9.7
-0.7
5.0
-7.3
0.5 1.8
-2.7
7.6
-8.7
-20.0
-5.2 -4.9-7.6 -6.2 -5.9 -4.2
2.1
-4-8
-12-16-20-24
048
12
FreshPork
FrozenPork
FreshPork
Sausages
FrozenPork
Sausages
LoosePork
Sausages
Bacon Gammon SlicedCooked
Ham
SlicedCooked
Pork
yoy % change
Volume Value
0
20
40
60
80
100
120
140
160
180
FreshPork
FrozenPork
FreshPork
Sausages
FrozenPork
Sausages
LoosePork
Sausages
Bacon Gammon SlicedCooked
Ham
SlicedCooked
Pork
‘000 tonnes
158.27
4.99
119.92
32.33
10.62
157.32
57.60
127.94
3.84
0
10
20
30
40
50
60
Spai
n
Denm
ark
Aust
ria
Pola
nd
Euro
pe
Net
herla
nds
Portu
gal
Cze
ch R
epub
lic
Italy
Fran
ce
Uni
ted
King
dom
kg per head
Consumption
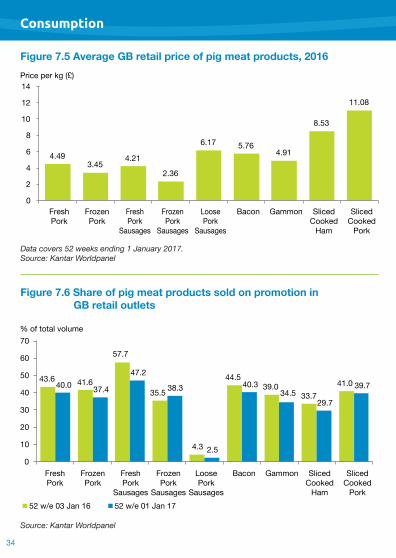
Figure 7.5 Average GB retail price of pig meat products, 2016
Figure 7.6 Share of pig meat products sold on promotion in GB retail outlets
Data covers 52 weeks ending 1 January 2017.Source: Kantar Worldpanel
Source: Kantar Worldpanel
4.493.45
4.21
2.36
6.17 5.764.91
8.53
11.08
0
2
4
6
8
10
12
14Price per kg (£)
FreshPork
FrozenPork
FreshPork
Sausages
FrozenPork
Sausages
LoosePork
Sausages
Bacon Gammon SlicedCooked
Ham
SlicedCooked
Pork
43.6 41.6
57.7
35.5
4.3
44.539.0
33.741.040.0 37.4
47.2
38.3
2.5
40.334.5
29.7
39.7
0
10
20
30
40
50
60
70% of total volume
52 w/e 03 Jan 16 52 w/e 01 Jan 17
FreshPork
FrozenPork
FreshPork
Sausages
FrozenPork
Sausages
LoosePork
Sausages
Bacon Gammon SlicedCooked
Ham
SlicedCooked
Pork
5
Consumption
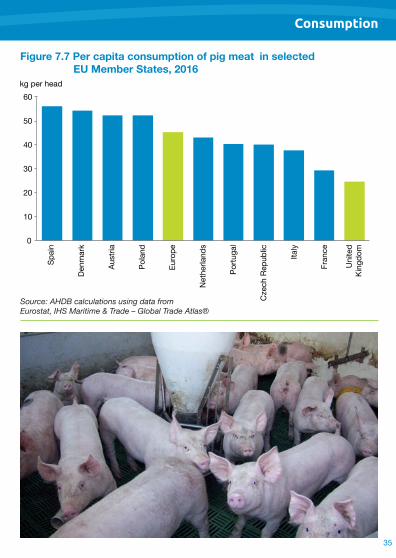
Figure 7.7 Per capita consumption of pig meat in selected EU Member States, 2016
Source: AHDB calculations using data from Eurostat, IHS Maritime & Trade – Global Trade Atlas®
0
10
20
30
40
50
60
Spai
n
Denm
ark
Aust
ria
Pola
nd
Euro
pe
Net
herla
nds
Portu
gal
Cze
ch R
epub
lic
Italy
Fran
ce
Uni
ted
King
dom
kg per head
4.493.45
4.21
2.36
6.17 5.764.91
8.53
11.08
0
2
4
6
8
10
12
14Price per kg (£)
FreshPork
FrozenPork
FreshPork
Sausages
FrozenPork
Sausages
LoosePork
Sausages
Bacon Gammon SlicedCooked
Ham
SlicedCooked
Pork

Consumption
Figure 7.8 Percentage of product facings with British logo sold in the total GB market
Figure 7.9 Percentage of product facings with Red Tractor quality standard mark sold in the total GB market
Source: AHDB/ESA
Source: AHDB/ESA
83
44
64
8382
49
67
8381
49
66
8182
46
65
8478
43
63
83
0102030405060708090
100
Pork Bacon Ham Sausage
%
Jan 15 July 15 Jan 16 July 16 Jan 17
57
2114 14
46
57
2213
4856 56
12
47 5053
23232315
51
0
10
20
30
40
50
60
70
Pork Bacon Ham Sausage
%
Jan 15 July 15 Jan 16 July 16 Jan 17
he in ormation rovided by S s ig arcase uthentication Service is used
widely as the basis or transactions between roducers and slaughterers he current service
which incor orates all o the mandatory re uirements o the ig arcase rading Scheme was introduced in in 2010 he service rovides ig slaughterers with
technically trained S staff who inde endently establish all o the im ortant criteria or trade between ig su liers and abattoirs.
The Service IncludesIdentification arcases are individually serial numbered and the sla mar s are read and recorded to identi y each consignment o igs he igs ( ecords Identification and
ovement) Order 200 re uires all igs going to slaughter to be identified by a e ra allocated herdmar on both shoulders his must be legible be ore and a ter slaughter to allow correct tracing o the igs or both payment and biosecurity.
eighing arcases are individually weighed ot weights are recorded with hot weight rebates and dressing coe cients deducted to establish the ayment weight
egular scale and tare chec s orm an integral art o the service ature boars and sows are not covered by the mandatory scheme but a weighing service is available as art o the uthentication Service
ac at measurement and lean meat ercentage S classifiers are
trained to o erate all o the a roved classification e ui ment
Methods and ProbesS offers all methods o ig carcase
classification or the rediction o lean meat ercentage in accordance with
legislation ach method involves ta ing carcase measurements with a roved e ui ment at s ecified ositions on each carcase
he ollowing e ui ment is a roved or use in the : O tical robe ennessey rading robe ( ) at O eater ( O ) uto O S ltra eater
he O uto O and S ltra eater are all automatic recording
probes.
Method 1O tical robe is used to measure bac at and rind thic ness at the 1 and ositions level with the head o the last rib he robe is inserted 5cm and cm rom the dorsal midline res ectively he sum o the 1 and
measurements is recorded
Method 2O tical robe is used to measure bac at and rind thic ness at the 2 osition level with the head o the last rib he robe is inserted 5cm rom the dorsal midline
The Meat and Livestock Commercial Services Ltd (MLSCL) Independent Authentication Serviceohn essenger uality anager
Chapter 8 - Pig Carcase Classification

0
5
10
15
20
25
30
<60 60–65 65–70 70–75 75–80 80–85 85–90 90–95 95+Weight range (kg)
2015 2016
% of sample
Method 3 or O are used to measure:
ac at and rind thic ness at the 2 osition as or ethod 2 he or O robes are inserted cm rom the
dorsal midline.
ac at and rind thic ness at a oint cm rom the dorsal midline between the third and ourth last rib his measurement is re erred to as rib at
ongissimus dorsi (eye muscle) de th at a oint cm rom the dorsal midline between the third and ourth last rib
his measurement is re erred to as rib muscle.
Lean Meat Percentage and EU Gradeean meat ercentage is calculated as ollows:
Optical probeold carcase weight and 2 (or 1 )
at de ths are used to estimate lean meat percentage.
n grade can be allocated to a carcase by using the lean meat ercentage figure
Visual Appraisalhis is the identification o igs with
carcase aults hese are described as carcases arcases that are scraggy
de ormed blemished igmented and coarse s inned those with so t at or
ale muscle and those devalued by being artially condemned are recorded as
on the carcase record ( 1 or com uter e uivalent) oung boars are identified and recorded arcases with oor con ormation are recorded as carcases at the re uest o the abattoir
Dressing Specificationarcase dressing s ecifications are closely
monitored by S staff and rovide a vital element o the carcase record
Pig Carcase Classification
Figure 8.1 Locations of probing on a pig carcase
Lean meat percentage EU grade0 and above S
55 5950 5 U5 90 O9 or less
9
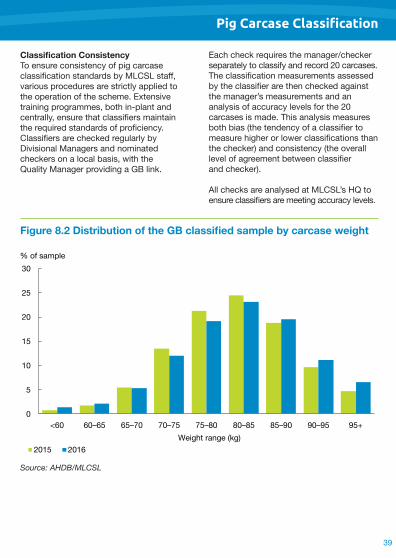
Classification Consistency o ensure consistency o ig carcase
classification standards by S staff various rocedures are strictly a lied to the o eration o the scheme tensive training rogrammes both in lant and centrally ensure that classifiers maintain the re uired standards o roficiency
lassifiers are chec ed regularly by ivisional anagers and nominated
chec ers on a local basis with the uality anager roviding a lin
ach chec re uires the manager chec er se arately to classi y and record 20 carcases
he classification measurements assessed by the classifier are then chec ed against the manager s measurements and an analysis o accuracy levels or the 20 carcases is made his analysis measures both bias (the tendency o a classifier to measure higher or lower classifications than the chec er) and consistency (the overall level o agreement between classifier and chec er)
ll chec s are analysed at S s to ensure classifiers are meeting accuracy levels
Pig Carcase Classification
Figure 8.2 Distribution of the GB classified sample by carcase weight
Source: AHDB/MLCSL
0
5
10
15
20
25
30
<60 60–65 65–70 70–75 75–80 80–85 85–90 90–95 95+Weight range (kg)
2015 2016
% of sample
0
74.5
24.1
1.4 0.10
10
20
30
40
50
60
70
80
S E U Other grades
%
EC grade
6
8
10
12
14
16
18
1990
1995
2000
2005
2010
2011
2012
2013
2014
2015
2016
mm
80kg 60-80kg <60kg
Pig Carcase Classification
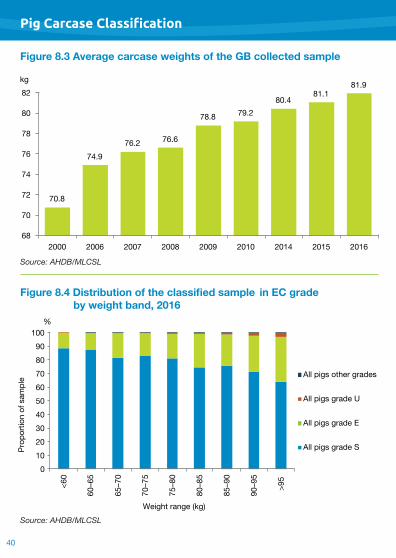
Figure 8.3 Average carcase weights of the GB collected sample
Figure 8.4 Distribution of the classified sample in EC grade by weight band, 2016
Source: AHDB/MLCSL
Source: AHDB/MLCSL
70.8
74.976.2 76.6
78.8 79.280.4
81.181.9
68
70
72
74
76
78
80
82
2000 2006 2007 2008 2009 2010 2014 2015 2016
kg
0102030405060708090
100
<60
60–6
5
65–7
0
70–7
5
75–8
0
80–8
5
85–9
0
90–9
5
>95
Prop
ortio
n of
sam
ple
Weight range (kg)
All pigs other grades
All pigs grade U
All pigs grade E
All pigs grade S
%
1
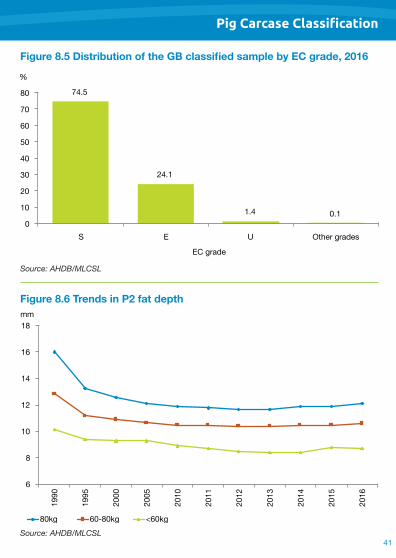
Pig Carcase Classification
Figure 8.5 Distribution of the GB classified sample by EC grade, 2016
Figure 8.6 Trends in P2 fat depth
Source: AHDB/MLCSL
Source: AHDB/MLCSL
74.5
24.1
1.4 0.10
10
20
30
40
50
60
70
80
S E U Other grades
%
EC grade
6
8
10
12
14
16
18
1990
1995
2000
2005
2010
2011
2012
2013
2014
2015
2016
mm
80kg 60-80kg <60kg
0102030405060708090
100
<60
60–6
5
65–7
0
70–7
5
75–8
0
80–8
5
85–9
0
90–9
5
>95
Prop
ortio
n of
sam
ple
Weight range (kg)
All pigs other grades
All pigs grade U
All pigs grade E
All pigs grade S
%
2
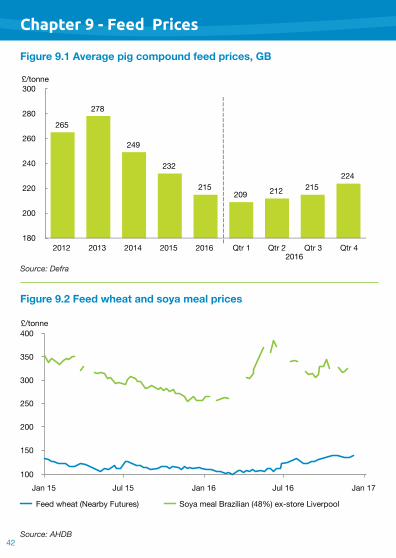
Chapter 9 - Feed Prices
Figure 9.1 Average pig compound feed prices, GB
Figure 9.2 Feed wheat and soya meal prices
Source: Defra
265
278
249
232
215209 212 215
224
180
200
220
240
260
280
300
2012 2013 2014 2015 20162016
Qtr 1 Qtr 2 Qtr 3 Qtr 4
£/tonne
100
150
200
250
300
350
400
Jan 15 Jul 15 Jan 16 Jul 16 Jan 17
£/tonne
Feed wheat (Nearby Futures) Soya meal Brazilian (48%) ex-store Liverpool
Source: AHDB

43
100
150
200
250
300
350
400
Jan 15 Jul 15 Jan 16 Jul 16 Jan 17
£/tonne
Feed wheat (Nearby Futures) Soya meal Brazilian (48%) ex-store Liverpool
AHDB Pork is part of the Agriculture and Horticulture Development Board (AHDB). While the Agriculture and Horticulture Development Board seeks to ensure that the information contained within this document is accurate at the time of publication, no warranty is given in respect thereof and, to the maximum extent permitted by law, the Agriculture and Horticulture Development Board accepts no liability for loss, damage or injury howsoever caused (including that caused by negligence) or suffered directly or indirectly in relation to information and opinions contained in or omitted from this document.
Inner header image:Pig - Pattakorn Uttarasak/Shutterstock.com
ISBN 978-1-904437-97-0
Agriculture and Horticulture Development Board Stoneleigh Park Kenilworth Warwickshire CV8 2TL Tel: 024 7669 2051 ahdb.pork.org.uk
© Agriculture and Horticulture Development Board 2017. All rights reserved.
This publication and its content is produced by the AHDB Market Intelligence team whose systems are certificated to ISO 9001:2015