piaggio - ubi banca
TRANSCRIPT
1
PIAGGIO
Company report Buy (maintained)
08 May 2020 – 5:30 PM MARKET PRICE: EUR1.97 TARGET PRICE: EUR2.45 (from EUR2.0)
Automotive
Data
Shares Outstanding (m): 357.4
Market Cap. (EURm): 706
Enterprise Value (EURm): 1,176
Free Float (%): 43.6%
Av. Daily Trad. Vol. (m): 1.48
Main Shareholder: IMMSI (50.6%)
Reuters/Bloomberg: PIA.MI PIA IM
52-Week Range (EUR) 1.38 3.16
Source: FactSet, UBI Banca estimates
Performance
1m 3m 12m
Absolute 32.3% -21.4% -18.1%
Rel. to FTSE IT 32.8% 7.6% 0.7%
Source: FactSet
Graph area Absolute/Relative 12 M
Source: FactSet
Massimo Vecchio Senior Analyst [email protected]
Tel. +39 02 62753016
Dario Fasani Analyst
Tel. +39 02 62753014
www.ubibanca.com/equity-research
Short term pain, long term gain
Piaggio reported a set 1Q120 results above our and consensus expectations in a tough scenario, where revenues declined 10% YoY and EBITDA 20%. The shutdown impacted heavily on NWC leading to net debt skyrocketing to EUR548.6 million. Two wheelers (-7.9% YoY in revenues) held better than LCV (-14.2% YoY) where the weakness in India was felt. While a guidance was not provided, management stressed its focus on costs and investments (temporary layoffs schemes, renegotiation of suppliers’ contracts, capex review, inventory build-up, credit lines extension). We are not materially changing our estimates as we consider the -35.4% YoY in 2Q20 revenues and the +12% in 2H20 reasonable. While there is no doubt that COVID19 is having a harsh short term impact, the long term changes to transportation habits of the population may end up having structural benefit to the Piaggio group. Therefore, we reiterate our BUY rating raising our TP to EUR2.45 (from EUR2.0) due peers re-rating.
> 1Q20 in more details: Revenues declined 10.1% reaching the EUR321.1
million mark, with volumes down 16.6% implying a positive ARPU (particularly
in India). EBITDA declined more than proportionally reaching EUR39.8 million
or 12.8% margin contracting by 150bps vs. 1Q19 despite cost containments.
The cash flow was negative in the quarter by EUR100 million, in line with
expectations, due to NWC absorption (EUR121.5 million) while management
didn’t have time to adjust capex that ended up in line with 1Q19 (EUR28.5
million). The NWC was hampered by: a) one-off payments delay of around
EUR16 million to support dealers that have reabsorbed as of today; b) higher
inventories reflection of a specific strategy to balance supply chain issues.
> Changing transportation habits may impact registrations by 27%. We
read several survey confirming the general thinking that, in a COVID19 world,
at least one third of the daily commuters would prefer to switch from public to
private transportation. Looking at Italy, for instance, INPS/ISTAT say that there
are 3.6 million workers using public transport every day. If 30% of those would
switch switch to private transport (25% of them needing to buy a vehicle, and
25% of those vehicles being a scooter/motorbike) it would return a potential
demand of 250K units or 27% of 2019 registrations.
> Buy confirmed, TP EUR2.45. The main reason underpinning our stance is
the potential switch from public to private transportation triggered by the
COVID19. Our new target price, raised mostly due to peers re-rating, offers
enough upside (25%). The replacement cycle in Europe provides additional
support to our thesis while scrapping incentives (under analysis in Italy, France
and India) are not included and could trigger an earnings surprise. The
company has enough liquidity to weather this troubled period (more than
EUR380 million, including EUR215 million of undrawn committed credit lines,
enough to cover maturities beyond 2025).
Financials EURm
2019A 2020E 2021E 2022E
Revenues (EURm) 1,521 1,405 1,492 1,598
EBITDA (EURm) 228 200 224 243
EBITDA margin (%) 15.0% 14.2% 15.0% 15.2%
EBIT (EURm) 105 77 107 129
EPS (EUR) 0.13 0.10 0.15 0.19
CFPS (EUR) 0.24 0.28 0.29 0.36
DPS (EUR) 0.11 0.12 0.13 0.14
Source: Company data, UBI Banca estimates
Ratios (priced on 7 May 2020)
2019A* 2020E 2021E 2022E
P/E (x) 19.2 20.6 13.3 10.4
P/CF (x) 4.2 6.7 3.7 3.5
P/BV (x) 2.3 1.8 1.8 1.7
Dividend Yield 4.4% 6.0% 6.5% 7.0%
EV/EBITDA (x) 5.8 5.9 5.1 4.5
Debt/Equity (x) 1.1 1.2 1.1 0.9
Debt/EBITDA (x) 1.9 2.3 1.9 1.6
Source: Company data, UBI Banca est. * average price
1,25
1,50
1,75
2,00
2,25
2,50
2,75
3,00
3,25
Piaggio FTSE Italia All-Share
PIAGGIO GROUP
08 May 2020
2
Key Financials
(EURm) 2019 2020E 2021E 2022E
Revenues 1,521 1,405 1,492 1,598
EBITDA 228 200 224 243
EBIT 105 77 107 129
NOPAT 70 51 72 86
Free Cash Flow 75 6 70 85
Net Capital Employed 814 852 836 818
Shareholders’ Equity 384 389 400 422
Net Financial Position 430 463 436 397
Source: Company data, UBI Banca estimates
Key Profitability Drivers
2019 2020E 2021E 2022E
Net Debt/EBITDA (x) 1.9 2.3 1.9 1.6
Net Debt/Equity (x) 1.1 1.2 1.1 0.9
Interest Coverage (%) 9.5 9.2 10.3 11.5
Free Cash Flow Yield (%) 8.3% 0.8% 9.9% 12.1%
ROE (%) 12.2% 8.8% 13.3% 16.2%
ROI pre-tax (%) 12.9% 9.0% 12.8% 15.7%
ROCE (%) 8.6% 6.0% 8.6% 10.5%
Source: Company data, UBI Banca estimates
Key Valuation Ratios
2019* 2020E 2021E 2022E
P/E (x) 19.2 20.6 13.3 10.4
P/BV (x) 2.3 1.8 1.8 1.7
P/CF (x) 4.2 6.7 3.7 3.5
Dividend Yield (%) 4.4% 6.0% 6.5% 7.0%
EV/Sales (x) 0.9 0.8 0.8 0.7
EV/EBITDA (x) 5.8 5.9 5.1 4.5
EV/EBIT (x) 12.7 15.2 10.7 8.6
EV/CE (x) 1.6 1.4 1.4 1.3
Source: Company data, UBI Banca estimates * Based on 2019 average price
Key Value Drivers
(%) 2019 2020E 2021E 2022E
Payout 84.3% 124.3% 86.4% 72.8%
NWC/Sales -8.7% -6.3% -7.2% -7.9%
Capex/Sales 9.3% 7.1% 8.0% 7.2%
Source: Company data, UBI Banca estimates
PIAGGIO GROUP
08 May 2020
3
Recent developments
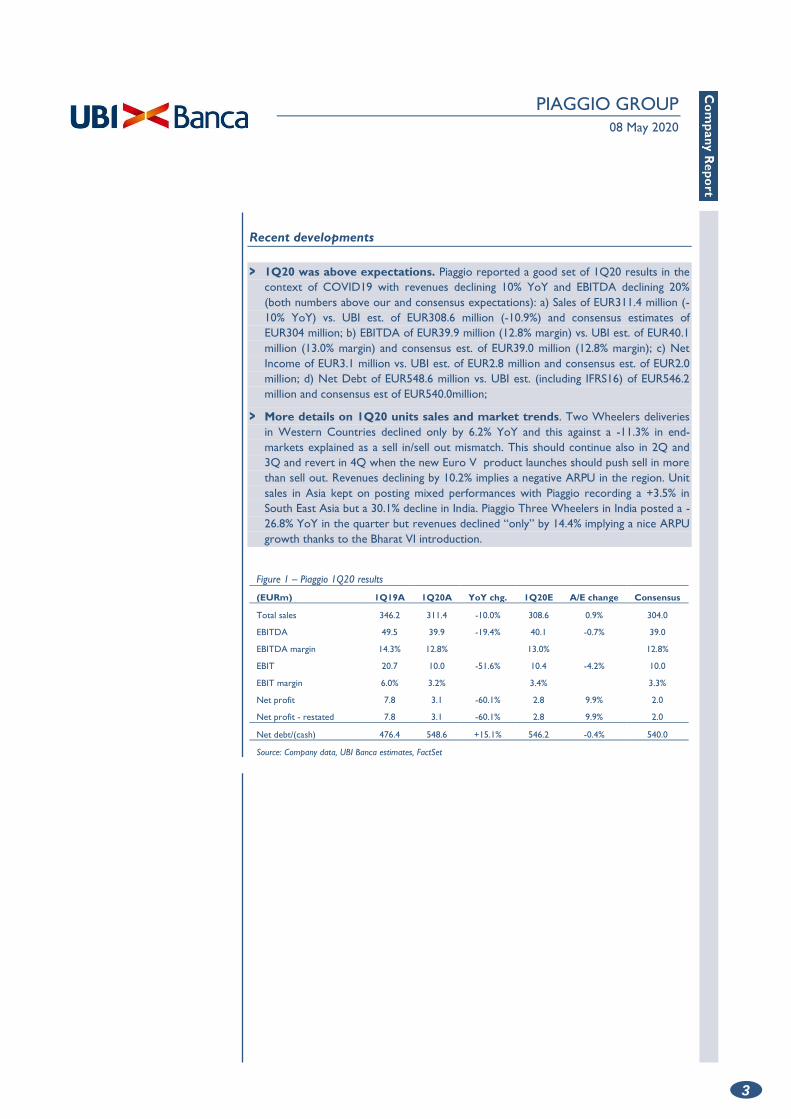
> 1Q20 was above expectations. Piaggio reported a good set of 1Q20 results in the
context of COVID19 with revenues declining 10% YoY and EBITDA declining 20%
(both numbers above our and consensus expectations): a) Sales of EUR311.4 million (-
10% YoY) vs. UBI est. of EUR308.6 million (-10.9%) and consensus estimates of
EUR304 million; b) EBITDA of EUR39.9 million (12.8% margin) vs. UBI est. of EUR40.1
million (13.0% margin) and consensus est. of EUR39.0 million (12.8% margin); c) Net
Income of EUR3.1 million vs. UBI est. of EUR2.8 million and consensus est. of EUR2.0
million; d) Net Debt of EUR548.6 million vs. UBI est. (including IFRS16) of EUR546.2
million and consensus est of EUR540.0million;
> More details on 1Q20 units sales and market trends. Two Wheelers deliveries
in Western Countries declined only by 6.2% YoY and this against a -11.3% in end-
markets explained as a sell in/sell out mismatch. This should continue also in 2Q and
3Q and revert in 4Q when the new Euro V product launches should push sell in more
than sell out. Revenues declining by 10.2% implies a negative ARPU in the region. Unit
sales in Asia kept on posting mixed performances with Piaggio recording a +3.5% in
South East Asia but a 30.1% decline in India. Piaggio Three Wheelers in India posted a -
26.8% YoY in the quarter but revenues declined “only” by 14.4% implying a nice ARPU
growth thanks to the Bharat VI introduction.
Figure 1 – Piaggio 1Q20 results
(EURm) 1Q19A 1Q20A YoY chg. 1Q20E A/E change Consensus
Total sales 346.2 311.4 -10.0% 308.6 0.9% 304.0
EBITDA 49.5 39.9 -19.4% 40.1 -0.7% 39.0
EBITDA margin 14.3% 12.8% 13.0% 12.8%
EBIT 20.7 10.0 -51.6% 10.4 -4.2% 10.0
EBIT margin 6.0% 3.2% 3.4% 3.3%
Net profit 7.8 3.1 -60.1% 2.8 9.9% 2.0
Net profit - restated 7.8 3.1 -60.1% 2.8 9.9% 2.0
Net debt/(cash) 476.4 548.6 +15.1% 546.2 -0.4% 540.0
Source: Company data, UBI Banca estimates, FactSet
PIAGGIO GROUP
08 May 2020
4
Financial Projections
> Our assumptions on COVID-19. Since we developed a scenario to assess the
COVID-19 impact there was a major advancement in terms of therapy (drugs) to treat
the disease: Gilead’s drug should mark the first approval this week from the FDA.
Aside from that, the other assumptions are still valid: a) A vaccine for the mass
population would not be ready before fall 2021 but it should be ready for healthcare
operators in fall 2020; b) Serology testing is probably the faster and easier way to
stabilize the economy by allowing immune people to avoid the lockdown; c) Very likely
the virus would re-emerge in the fall so, social distancing is here to stay for a while.
> Feedback from the conference call. During the call management said that some
countries are perfoming better than one may anticipate and not far from the internal
budget (namely Europe and US) while some other worst (Asia in general and India
specifically). Current management expectations is for India to re-opne at the end of
May. When asked about a minimum level of capex was the scenario to get worse,
management said that its capex is mainly driven by compliance requirements, which as
of now are not fully clear.
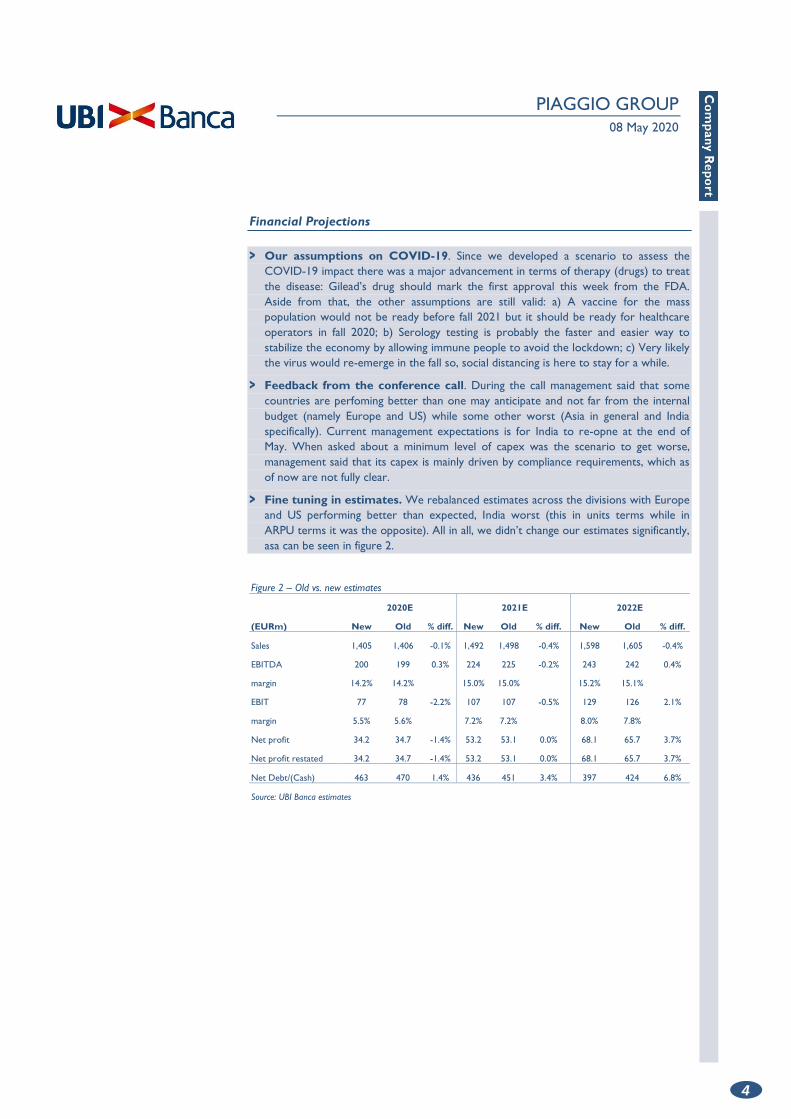
> Fine tuning in estimates. We rebalanced estimates across the divisions with Europe
and US performing better than expected, India worst (this in units terms while in
ARPU terms it was the opposite). All in all, we didn’t change our estimates significantly,
asa can be seen in figure 2.
Figure 2 – Old vs. new estimates
2020E 2021E 2022E
(EURm) New Old % diff. New Old % diff. New Old % diff.
Sales 1,405 1,406 -0.1% 1,492 1,498 -0.4% 1,598 1,605 -0.4%
EBITDA 200 199 0.3% 224 225 -0.2% 243 242 0.4%
margin 14.2% 14.2% 15.0% 15.0% 15.2% 15.1%
EBIT 77 78 -2.2% 107 107 -0.5% 129 126 2.1%
margin 5.5% 5.6% 7.2% 7.2% 8.0% 7.8%
Net profit 34.2 34.7 -1.4% 53.2 53.1 0.0% 68.1 65.7 3.7%
Net profit restated 34.2 34.7 -1.4% 53.2 53.1 0.0% 68.1 65.7 3.7%
Net Debt/(Cash) 463 470 1.4% 436 451 3.4% 397 424 6.8%
Source: UBI Banca estimates
PIAGGIO GROUP
08 May 2020
5
Valuation
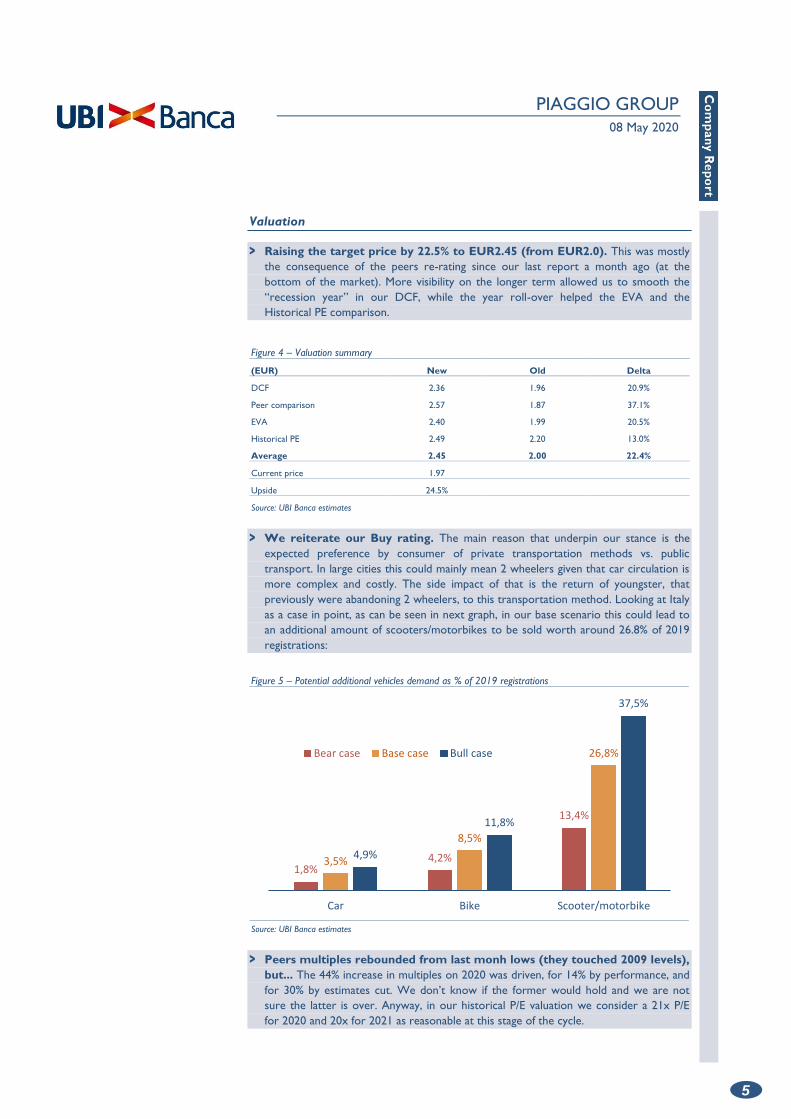
> Raising the target price by 22.5% to EUR2.45 (from EUR2.0). This was mostly
the consequence of the peers re-rating since our last report a month ago (at the
bottom of the market). More visibility on the longer term allowed us to smooth the
“recession year” in our DCF, while the year roll-over helped the EVA and the
Historical PE comparison.
Figure 4 – Valuation summary
(EUR) New Old Delta
DCF 2.36 1.96 20.9%
Peer comparison 2.57 1.87 37.1%
EVA 2.40 1.99 20.5%
Historical PE 2.49 2.20 13.0%
Average 2.45 2.00 22.4%
Current price 1.97
Upside 24.5%
Source: UBI Banca estimates
> We reiterate our Buy rating. The main reason that underpin our stance is the
expected preference by consumer of private transportation methods vs. public
transport. In large cities this could mainly mean 2 wheelers given that car circulation is
more complex and costly. The side impact of that is the return of youngster, that
previously were abandoning 2 wheelers, to this transportation method. Looking at Italy
as a case in point, as can be seen in next graph, in our base scenario this could lead to
an additional amount of scooters/motorbikes to be sold worth around 26.8% of 2019
registrations:
Figure 5 – Potential additional vehicles demand as % of 2019 registrations
Source: UBI Banca estimates
> Peers multiples rebounded from last monh lows (they touched 2009 levels),
but... The 44% increase in multiples on 2020 was driven, for 14% by performance, and
for 30% by estimates cut. We don’t know if the former would hold and we are not
sure the latter is over. Anyway, in our historical P/E valuation we consider a 21x P/E
for 2020 and 20x for 2021 as reasonable at this stage of the cycle.
1,8%4,2%
13,4%
3,5%
8,5%
26,8%
4,9%
11,8%
37,5%
Car Bike Scooter/motorbike
Bear case Base case Bull case
PIAGGIO GROUP
08 May 2020
6
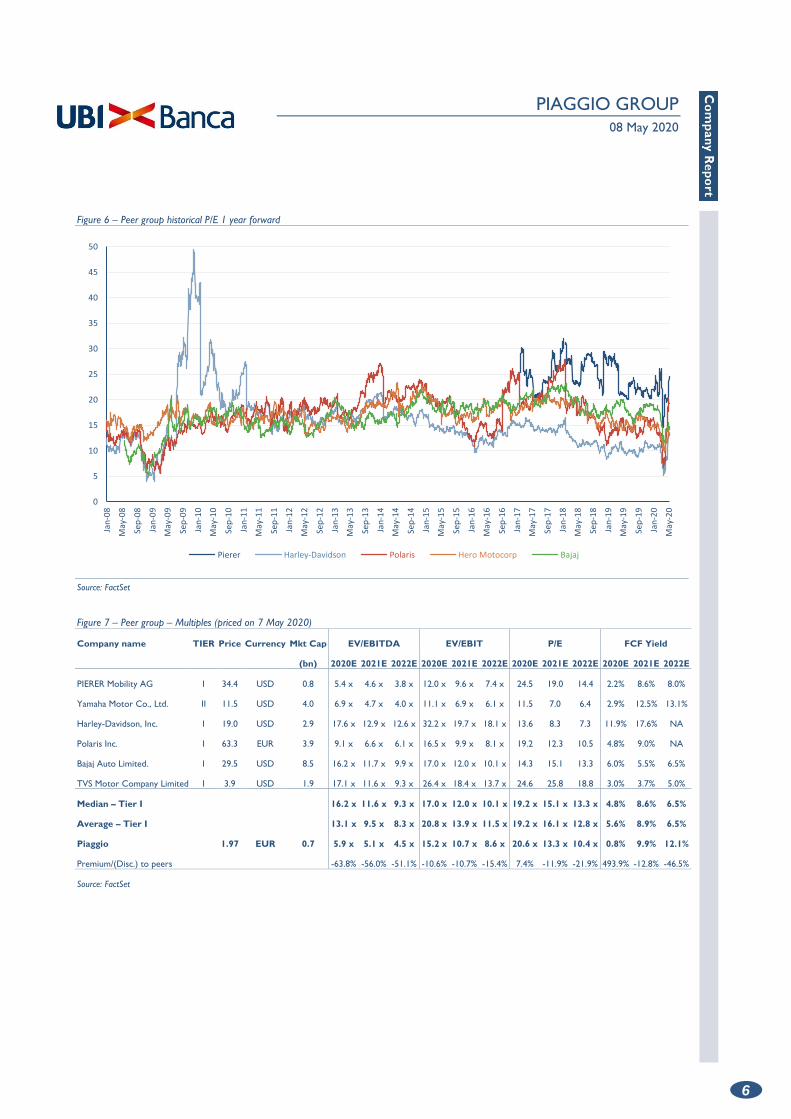
Figure 6 – Peer group historical P/E 1 year forward
Source: FactSet
Figure 7 – Peer group – Multiples (priced on 7 May 2020)
Company name TIER Price Currency Mkt Cap EV/EBITDA EV/EBIT P/E FCF Yield
(bn) 2020E 2021E 2022E 2020E 2021E 2022E 2020E 2021E 2022E 2020E 2021E 2022E
PIERER Mobility AG I 34.4 USD 0.8 5.4 x 4.6 x 3.8 x 12.0 x 9.6 x 7.4 x 24.5 19.0 14.4 2.2% 8.6% 8.0%
Yamaha Motor Co., Ltd. II 11.5 USD 4.0 6.9 x 4.7 x 4.0 x 11.1 x 6.9 x 6.1 x 11.5 7.0 6.4 2.9% 12.5% 13.1%
Harley-Davidson, Inc. I 19.0 USD 2.9 17.6 x 12.9 x 12.6 x 32.2 x 19.7 x 18.1 x 13.6 8.3 7.3 11.9% 17.6% NA
Polaris Inc. I 63.3 EUR 3.9 9.1 x 6.6 x 6.1 x 16.5 x 9.9 x 8.1 x 19.2 12.3 10.5 4.8% 9.0% NA
Bajaj Auto Limited. I 29.5 USD 8.5 16.2 x 11.7 x 9.9 x 17.0 x 12.0 x 10.1 x 14.3 15.1 13.3 6.0% 5.5% 6.5%
TVS Motor Company Limited I 3.9 USD 1.9 17.1 x 11.6 x 9.3 x 26.4 x 18.4 x 13.7 x 24.6 25.8 18.8 3.0% 3.7% 5.0%
Median – Tier I 16.2 x 11.6 x 9.3 x 17.0 x 12.0 x 10.1 x 19.2 x 15.1 x 13.3 x 4.8% 8.6% 6.5%
Average – Tier I 13.1 x 9.5 x 8.3 x 20.8 x 13.9 x 11.5 x 19.2 x 16.1 x 12.8 x 5.6% 8.9% 6.5%
Piaggio 1.97 EUR 0.7 5.9 x 5.1 x 4.5 x 15.2 x 10.7 x 8.6 x 20.6 x 13.3 x 10.4 x 0.8% 9.9% 12.1%
Premium/(Disc.) to peers -63.8% -56.0% -51.1% -10.6% -10.7% -15.4% 7.4% -11.9% -21.9% 493.9% -12.8% -46.5%
Source: FactSet
0
5
10
15
20
25
30
35
40
45
50
Jan
-08
May
-08
Sep
-08
Jan
-09
May
-09
Sep
-09
Jan
-10
May
-10
Sep
-10
Jan
-11
May
-11
Sep
-11
Jan
-12
May
-12
Sep
-12
Jan
-13
May
-13
Sep
-13
Jan
-14
May
-14
Sep
-14
Jan
-15
May
-15
Sep
-15
Jan
-16
May
-16
Sep
-16
Jan
-17
May
-17
Sep
-17
Jan
-18
May
-18
Sep
-18
Jan
-19
May
-19
Sep
-19
Jan
-20
May
-20
Pierer Harley-Davidson Polaris Hero Motocorp Bajaj
PIAGGIO GROUP
08 May 2020
7
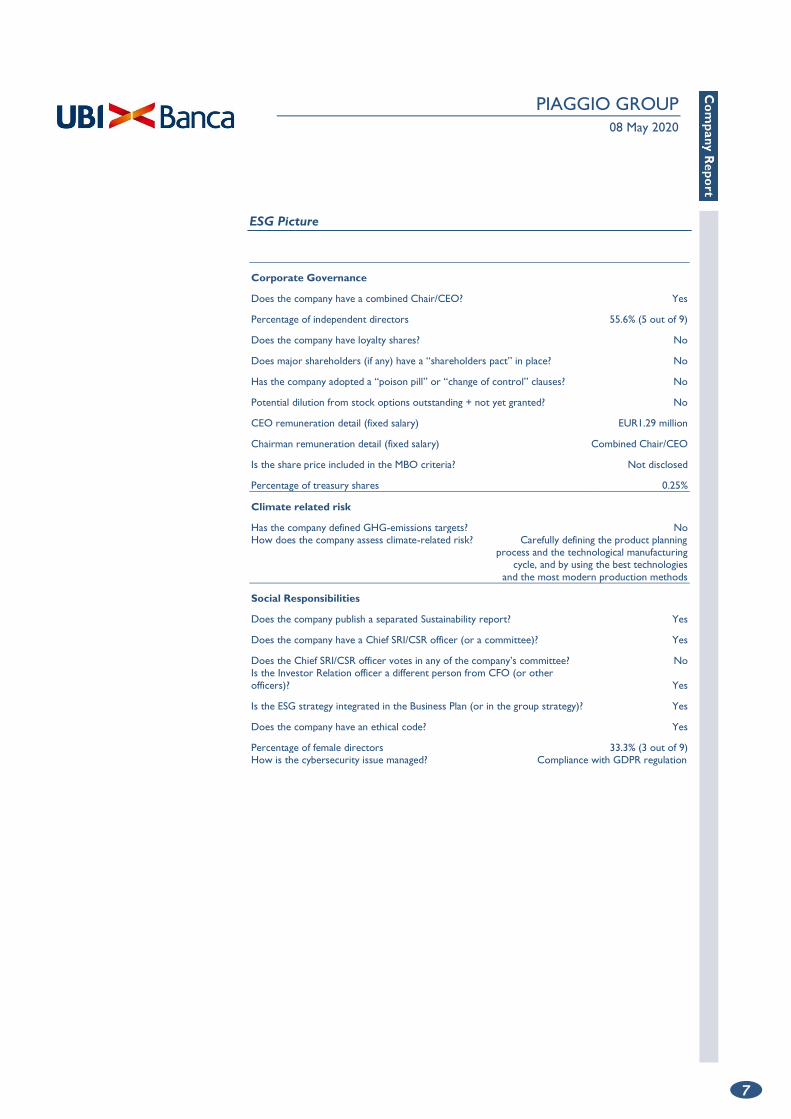
ESG Picture
Corporate Governance
Does the company have a combined Chair/CEO? Yes
Percentage of independent directors 55.6% (5 out of 9)
Does the company have loyalty shares? No
Does major shareholders (if any) have a “shareholders pact” in place? No
Has the company adopted a “poison pill” or “change of control” clauses? No
Potential dilution from stock options outstanding + not yet granted? No
CEO remuneration detail (fixed salary) EUR1.29 million
Chairman remuneration detail (fixed salary) Combined Chair/CEO
Is the share price included in the MBO criteria? Not disclosed
Percentage of treasury shares 0.25%
Climate related risk
Has the company defined GHG-emissions targets? No How does the company assess climate-related risk? Carefully defining the product planning
process and the technological manufacturing cycle, and by using the best technologies
and the most modern production methods
Social Responsibilities
Does the company publish a separated Sustainability report? Yes
Does the company have a Chief SRI/CSR officer (or a committee)? Yes
Does the Chief SRI/CSR officer votes in any of the company’s committee? No Is the Investor Relation officer a different person from CFO (or other
officers)? Yes
Is the ESG strategy integrated in the Business Plan (or in the group strategy)? Yes
Does the company have an ethical code? Yes
Percentage of female directors 33.3% (3 out of 9) How is the cybersecurity issue managed? Compliance with GDPR regulation
PIAGGIO GROUP
08 May 2020
8
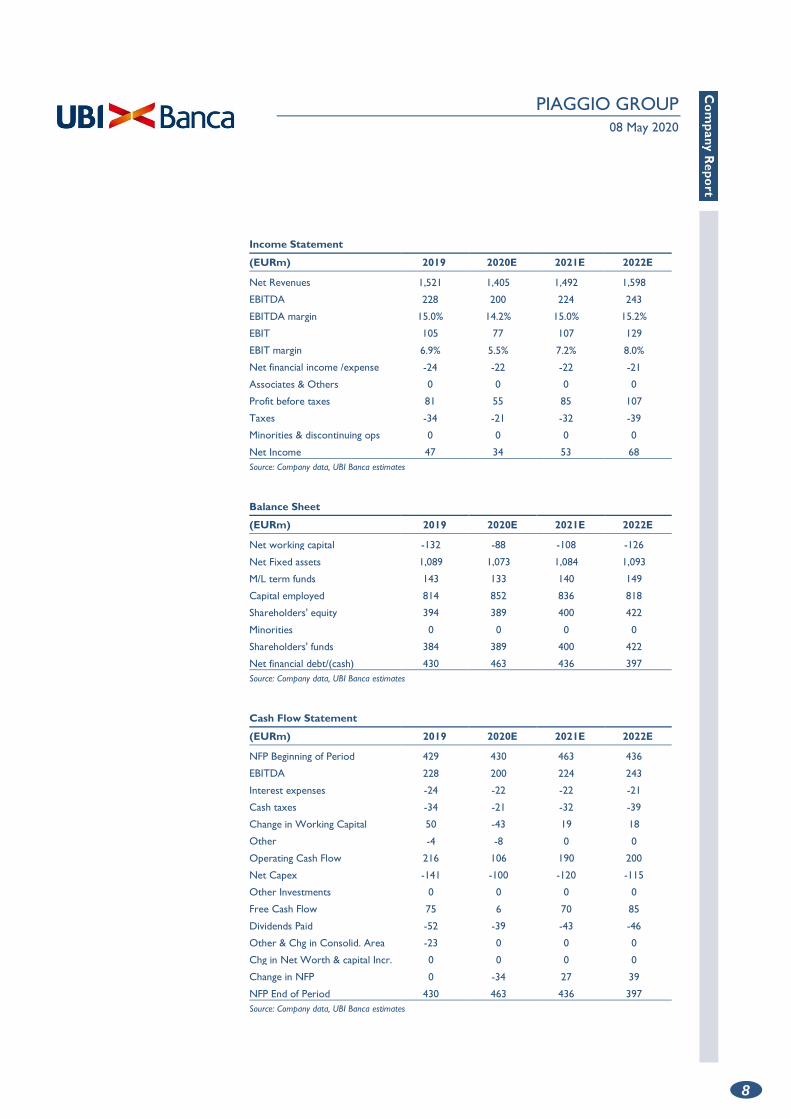
Income Statement
(EURm) 2019 2020E 2021E 2022E
Net Revenues 1,521 1,405 1,492 1,598
EBITDA 228 200 224 243
EBITDA margin 15.0% 14.2% 15.0% 15.2%
EBIT 105 77 107 129
EBIT margin 6.9% 5.5% 7.2% 8.0%
Net financial income /expense -24 -22 -22 -21
Associates & Others 0 0 0 0
Profit before taxes 81 55 85 107
Taxes -34 -21 -32 -39
Minorities & discontinuing ops 0 0 0 0
Net Income 47 34 53 68
Source: Company data, UBI Banca estimates
Balance Sheet
(EURm) 2019 2020E 2021E 2022E
Net working capital -132 -88 -108 -126
Net Fixed assets 1,089 1,073 1,084 1,093
M/L term funds 143 133 140 149
Capital employed 814 852 836 818
Shareholders' equity 394 389 400 422
Minorities 0 0 0 0
Shareholders' funds 384 389 400 422
Net financial debt/(cash) 430 463 436 397
Source: Company data, UBI Banca estimates
Cash Flow Statement
(EURm) 2019 2020E 2021E 2022E
NFP Beginning of Period 429 430 463 436
EBITDA 228 200 224 243
Interest expenses -24 -22 -22 -21
Cash taxes -34 -21 -32 -39
Change in Working Capital 50 -43 19 18
Other -4 -8 0 0
Operating Cash Flow 216 106 190 200
Net Capex -141 -100 -120 -115
Other Investments 0 0 0 0
Free Cash Flow 75 6 70 85
Dividends Paid -52 -39 -43 -46
Other & Chg in Consolid. Area -23 0 0 0
Chg in Net Worth & capital Incr. 0 0 0 0
Change in NFP 0 -34 27 39
NFP End of Period 430 463 436 397
Source: Company data, UBI Banca estimates
PIAGGIO GROUP
08 May 2020
9
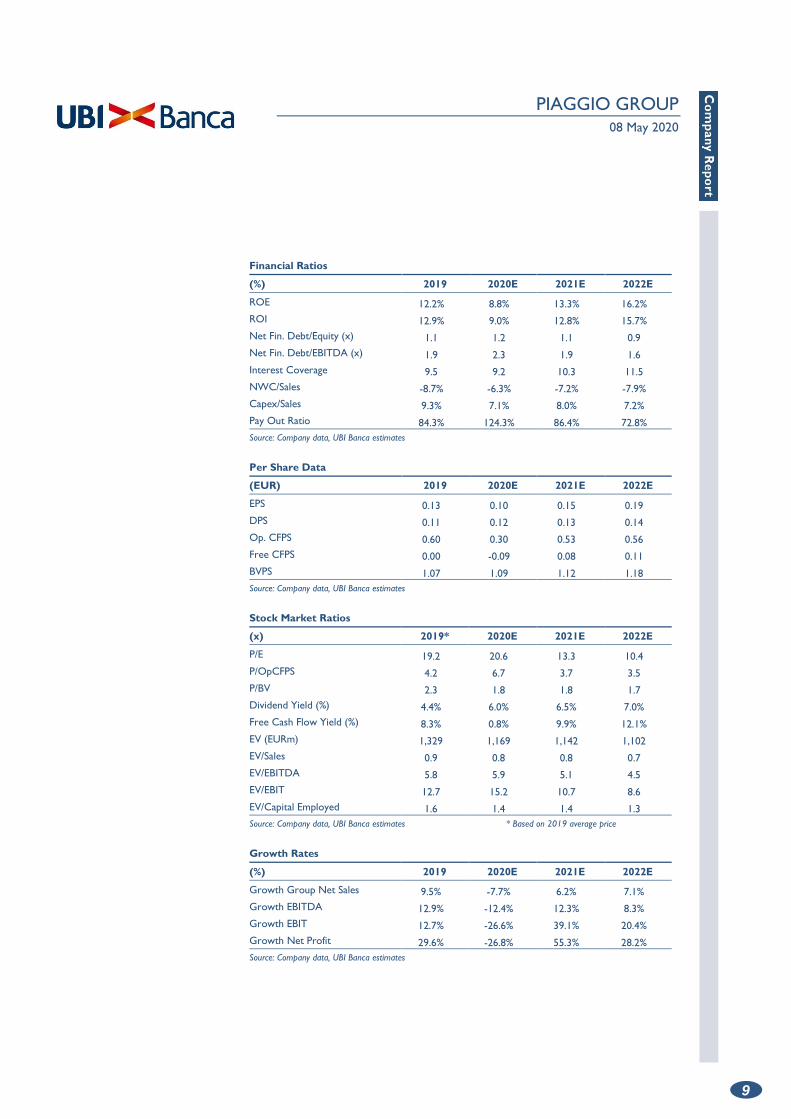
Financial Ratios
(%) 2019 2020E 2021E 2022E
ROE 12.2% 8.8% 13.3% 16.2%
ROI 12.9% 9.0% 12.8% 15.7%
Net Fin. Debt/Equity (x) 1.1 1.2 1.1 0.9
Net Fin. Debt/EBITDA (x) 1.9 2.3 1.9 1.6
Interest Coverage 9.5 9.2 10.3 11.5
NWC/Sales -8.7% -6.3% -7.2% -7.9%
Capex/Sales 9.3% 7.1% 8.0% 7.2%
Pay Out Ratio 84.3% 124.3% 86.4% 72.8%
Source: Company data, UBI Banca estimates
Per Share Data
(EUR) 2019 2020E 2021E 2022E
EPS 0.13 0.10 0.15 0.19
DPS 0.11 0.12 0.13 0.14
Op. CFPS 0.60 0.30 0.53 0.56
Free CFPS 0.00 -0.09 0.08 0.11
BVPS 1.07 1.09 1.12 1.18
Source: Company data, UBI Banca estimates
Stock Market Ratios
(x) 2019* 2020E 2021E 2022E
P/E 19.2 20.6 13.3 10.4
P/OpCFPS 4.2 6.7 3.7 3.5
P/BV 2.3 1.8 1.8 1.7
Dividend Yield (%) 4.4% 6.0% 6.5% 7.0%
Free Cash Flow Yield (%) 8.3% 0.8% 9.9% 12.1%
EV (EURm) 1,329 1,169 1,142 1,102
EV/Sales 0.9 0.8 0.8 0.7
EV/EBITDA 5.8 5.9 5.1 4.5
EV/EBIT 12.7 15.2 10.7 8.6
EV/Capital Employed 1.6 1.4 1.4 1.3
Source: Company data, UBI Banca estimates * Based on 2019 average price
Growth Rates
(%) 2019 2020E 2021E 2022E
Growth Group Net Sales 9.5% -7.7% 6.2% 7.1%
Growth EBITDA 12.9% -12.4% 12.3% 8.3%
Growth EBIT 12.7% -26.6% 39.1% 20.4%
Growth Net Profit 29.6% -26.8% 55.3% 28.2%
Source: Company data, UBI Banca estimates
PIAGGIO GROUP
08 May 2020
10
Disclaimer
Analyst Declaration
This research report (the “Report”) has been prepared by Massimo Vecchio and Dario
Fasani (the “Analysts”) on behalf of UBI Banca S.p.A. (“UBI Banca”) in the context of the ancillary service provided by UBI Banca named “Investment research and financial analysis or other forms of recommendation relating to transactions in financial instruments” under Paragraph 5), Section B, Annex I of the Directive 2014/65/EU (“MiFID II”). UBI Banca is an Italian bank under art. 4 (1)(27) of MiFID II and it is supervised by the European Central Bank and duly authorised to provide investment services pursuant to Article 1, Paragraph 5, letter a), b), c), c-bis), e) and f) of the Legislative Decree 24 February 1998, n° 58 under the supervision of the Italian Authority for the financial markets (Consob). UBI Banca has its head office at Piazza Vittorio Veneto 8, 24122 Bergamo.
The Analyst who prepared the Report, and whose name and role appear on the front page, certifies that:
a. The views expressed on the company, mentioned herein (the “Company”) accurately reflect his personal views, but does not represent the views or opinions of UBI Banca, its management or any other company which is part of or affiliated with UBI Banca group (the “UBI Banca Group”). It may be possible that some UBI Banca Group officers may disagree with the views expressed in this Report;
b. He has not received, and will not receive any direct or indirect compensation in exchange for any views expressed in this Report;
c. The Analyst does not own any securities and/or any other financial instruments issued by the Company or any financial instrument which the price depends on, or is linked to any securities and/or any financial instruments issued by the Company.
d. Neither the Analyst nor any member of the Analyst’s household serves as an officer, director or advisory board member of the Company.
e. The remuneration of the Analyst is not directly tied to transactions for services for investment firms or other types of transactions it or any legal person, part of the same group performs, or to trading fees it or any legal person that is part of the same group receives.
f. The Analyst named in this document is a member of AIAF – Associazione Italiana per l’Analisi Finanziaria.
General disclosure
This Report is for information purposes only. This Report (i) is not, nor may it be construed, to constitute, an offer for sale or subscription or of a solicitation of any offer to buy or subscribe for any securities issued or to be issued by the Company; (ii) should not be regarded as a substitute for the exercise of the recipient’s own judgement; and (iii) should not be considered as an investment advice and is therefore not falling within the scope of the requirements governing the provision of investment advisory services within the meaning of the Directive no. 2014/65/EU. In addition, the information included in this Report may not be suitable for all recipients. Therefore the recipient should conduct their own investigations and analysis of the Company and securities referred to in this document, and make their own investment decisions without undue reliance on its contents. Neither UBI Banca, nor any other company belonging to the UBI Banca Group, nor any of its directors, managers, officers or employees, accepts any direct or indirect liability whatsoever (in negligence or otherwise), and accordingly no direct or indirect liability whatsoever shall be assumed by, or shall be placed on, UBI Banca, or any other company belonging to the UBI Banca Group, or any of its directors, managers, officers or
PIAGGIO GROUP
08 May 2020
11
employees, for any loss, damage, cost, expense, lower earnings howsoever arising from any use of this Report or its contents or otherwise arising in connection with this Report.
The information provided and the opinions expressed in this Report are based upon information and data provided to the public by the Company or news otherwise public, and refers to the date of publication of the Report. The sources (press publications, financial statements, current and periodic releases, as well as meetings and telephone conversations with the Company’s representatives) are believed to be reliable and in good faith, but no representation or warranty, express or implied, is made by UBI Banca as to their accuracy, completeness or correctness. Past performance is not a guarantee of future results. Any opinions, forecasts or estimates contained herein constitute a judgement as of the date of this Report, and there can be no assurance that the future results of the Company and/or any future events involving directly or indirectly the Company will be consistent with any such opinions, forecasts or estimates. Any information herein is subject to change, update or amendment without notice by UBI Banca subsequent to the date of this Report, with no undertaking by UBI Banca to notify the recipient of this Report of such change, update or amendment.
Organizational and administrative arrangements to prevent conflicts of interests
UBI Banca maintains procedures and organizational mechanism (physical and non-physical barriers designed to restrict the flow of information between the unit which performs investment research activity, and other units of UBI Banca) to prevent and professionally manage conflicts of interest in relation to investment research in accordance with art. 23 of Directive 2014/65/EU and under art. 34 (3) and art. 37 of the Regulation 2017/565/EU. UBI Banca is organized in such a way as to minimize conflicts of interest and has within the meaning of art. 20 (1) of the Regulation (EU) No 596/2014/EU and has adequate control procedures in place to counter infringements of the obligations laid down in Article 20 (1) of the Regulation (EU) No 596/2014.
More specifically, UBI Banca has established, implements and maintains an effective conflicts of interests policy aimed at preventing and managing the potential conflicts of interest that could occur during the performance of the investment research services.
Insofar as the above mentioned organizational and administrative arrangements established by UBI Banca to prevent or manage potential conflicts of interests are not sufficient to ensure, with reasonable confidence, that risks of damage to the interests of the client will be prevented, UBI Banca engages to provide a clear disclosure of the specific conflicts of interests arising from the performance of investment research services, including a description of the sources of those conflicts and the steps undertaken to mitigate them, taking into account the nature of the client to whom the disclosure is being made. For further information please see UBI Banca’s website (www.ubibanca.com/equity-research - “Informativa sintetica sull’attività di ricerca”) and (www.ubibanca.com/Mifid - “Policy sintetica conflitti di interessi”). More details about the conflicts of interests policy will be provided by UBI Banca upon request.
Disclosure of interests and conflicts of interests pursuant to Delegated Regulation 2016/958/EU
In relation to the Company the following interest/conflict of interest have been found:
> UBI Banca may have long or short positions not exceeding the threshold of
0.5% of the total issued share capital of the issuer
On the basis of the checks carried out no other interest/conflict of interest arose.
Frequency of updates
UBI Banca aims to provide continuous coverage of the companies in conjunction with the timing of periodical accounting reports and any exceptional event that occurs affecting the issuer’s sphere of operations and in any case at least twice per year. The companies for
PIAGGIO GROUP
08 May 2020
12
which UBI Banca acts as Sponsor or Specialist are covered in compliance with regulations of the market authorities.
For further information please refer to www.ubibanca.com/equity-research
Valuation methodology
UBI Banca’s analysts value the Company subject to their recommendations using several methods among which the most prevalent are: the Discounted Cash Flow method (DCF), the Economic Value Added method (EVA), the Multiple comparison method, the SOP method and the NAV method.
The analysts use the above valuation methods alternatively and/or jointly at their discretion. The assigned target price may differ from their fair value, as it also takes into account overall market/sector conditions, corporate/market events, and corporate specifics (i.e. holding discounts) reasonably considered to be possible drivers of the company’s share price performance. These factors may also be assessed using the methodologies indicated above. For further information please refer to www.ubibanca.com/equity-research.
Rating system
UBI Banca’s analysts use an “absolute” rating system, not related to market performance. The explanation of the rating system is listed below:
Buy: if the target price is 15% higher than the market price, over the next 12 months.
Hold: if the target price is 15% below or 15% above the market price, over the next 12 months.
Sell: if the target price is 15% lower than the market price, over the next 12 months.
No Rating: the investment rating and target price have been suspended as there is not sufficient fundamental basis for determining an investment rating or target. The previous investment rating and target price, if any, are no longer in effect. Alternatively, No Rating is assigned in certain circumstances when UBI Banca is acting in any advisory capacity in a strategic transaction involving the Company.
Target price: the market price that the analyst believes that the share may reach within a one-year time horizon.
Market price: closing price on the day before the issue date of the report, appearing on the first page.
Distribution
Italy: This document is intended for distribution in electronic form to “Professional Clients” and “Qualified Counterparties” as defined by Legislative Decree 24 February 1998, n. 58 and by Consob Regulation n. 20307 dated 15 February 2018, as further amended and supplemented.
Spain: This document is intended for distribution in electronic form to “Professional Clients” and “Eligible Counterparties” as defined by Royal Legislative Decree 4/2015, of 23 October, approving the revised text of the Securities Market Act, as further amended and supplemented. IN THE UNITED KINGDOM, THIS DOCUMENT IS BEING DISTRIBUTED ONLY TO, AND IS DIRECTED ONLY AT PERSONS WHO (A) ARE (I) PERSONS FALLING WITHIN ARTICLE 19 OR ARTICLE 49 OF THE FINANCIAL SERVICES AND MARKETS ACT 2000 (FINANCIAL PROMOTION) ORDER 2005 (AND ONLY WHERE THE CONDITIONS CONTAINED IN THOSE ARTICLES HAVE BEEN, OR WILL AT THE RELEVANT TIME BE, SATISFIED) OR (II) ANY OTHER PERSONS TO WHOM IT MAY BE LAWFULLY COMMUNICATED; AND (B) ARE QUALIFIED INVESTORS WITHIN THE MEANING OF ARTICLE 2(1)(E) OF THE PROSPECTUS DIRECTIVE (DIRECTIVE 2003/71/EC), (ALL SUCH PERSONS BEING REFERRED TO AS "RELEVANT PERSONS"). THIS DOCUMENT MUST NOT BE ACTED ON OR RELIED ON BY PERSONS WHO
PIAGGIO GROUP
08 May 2020
13
ARE NOT RELEVANT PERSONS.
IN FRANCE, THIS DOCUMENT IS BEING DISTRIBUTED ONLY TO, AND IS DIRECTED ONLY AT PERSONS WHO ARE CONSIDERED AS PROFESSIONAL CLIENTS WITHIN THE MEANING OF ARTICLES L. 533-16 AND D. 533-11 ET SEQ. OF THE FRENCH CODE MONETAIRE ET FINANCIER (THE FRENCH FINANCIAL CODE) OR AS ELIGIBLE COUNTERPARTIES, AS DEFINED IN ARTICLES L. 533-20 AND D. 533-13 ET SEQ. OF THE FRENCH FINANCIAL CODE.
IN IRELAND, THIS DOCUMENT IS BEING DISTRIBUTED ONLY TO, AND IS DIRECTED ONLY AT, PERSONS WHO ARE QUALIFIED INVESTORS WITHIN THE MEANING OF ARTICLE 2(1)(E) OF THE PROSPECTUS DIRECTIVE (DIRECTIVE 2003/71/EC, AS AMENDED FROM TIME TO TIME, INCLUDING BY DIRECTIVE 2010/73/EC) ("QUALIFIED PERSONS"). THIS DOCUMENT MUST NOT BE ACTED ON OR RELIED ON BY PERSONS WHO ARE NOT QUALIFIED PERSONS.
Copyright
This Report is being supplied solely for the recipient’s information and may not be reproduced, redistributed or passed on, directly or indirectly to any other person or published, in whole or in part, for any purpose without prior written consent of UBI Banca.
The copyright and intellectual property rights on the data are owned by UBI Banca Group, unless otherwise indicated. The data, information, opinions and valuations contained in this Report may not be subject to further distribution or reproduction, in any form or via any means, even in part, unless expressly consented by UBI Banca.
By accepting this Report the recipient agrees to be bound by all of the forgoing provisions.
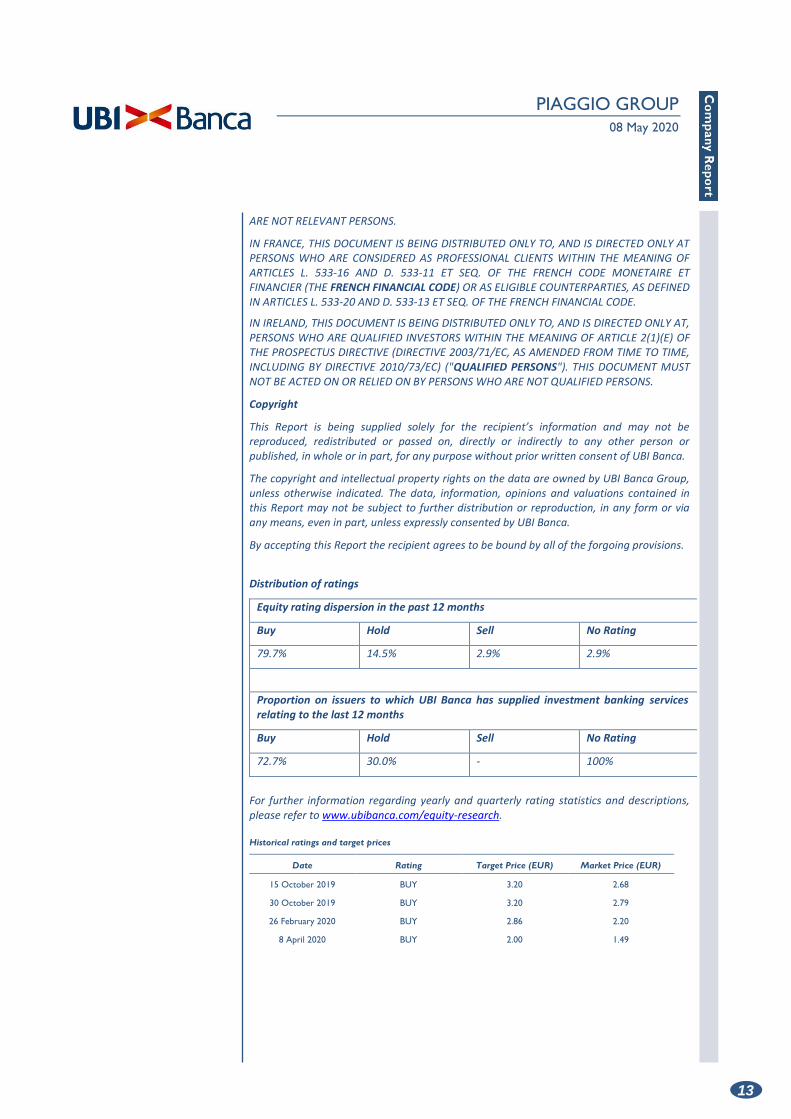
Distribution of ratings
Equity rating dispersion in the past 12 months
Buy Hold Sell No Rating
79.7% 14.5% 2.9% 2.9%
Proportion on issuers to which UBI Banca has supplied investment banking services relating to the last 12 months
Buy Hold Sell No Rating
72.7% 30.0% - 100%
For further information regarding yearly and quarterly rating statistics and descriptions, please refer to www.ubibanca.com/equity-research. Historical ratings and target prices
Date Rating Target Price (EUR) Market Price (EUR)
15 October 2019 BUY 3.20 2.68
30 October 2019 BUY 3.20 2.79
26 February 2020 BUY 2.86 2.20
8 April 2020 BUY 2.00 1.49