personal finance: what i’ve learned after graduation
TRANSCRIPT
Personal Finance: Personal Finance: What I’ve Learned After What I’ve Learned After
GraduationGraduation
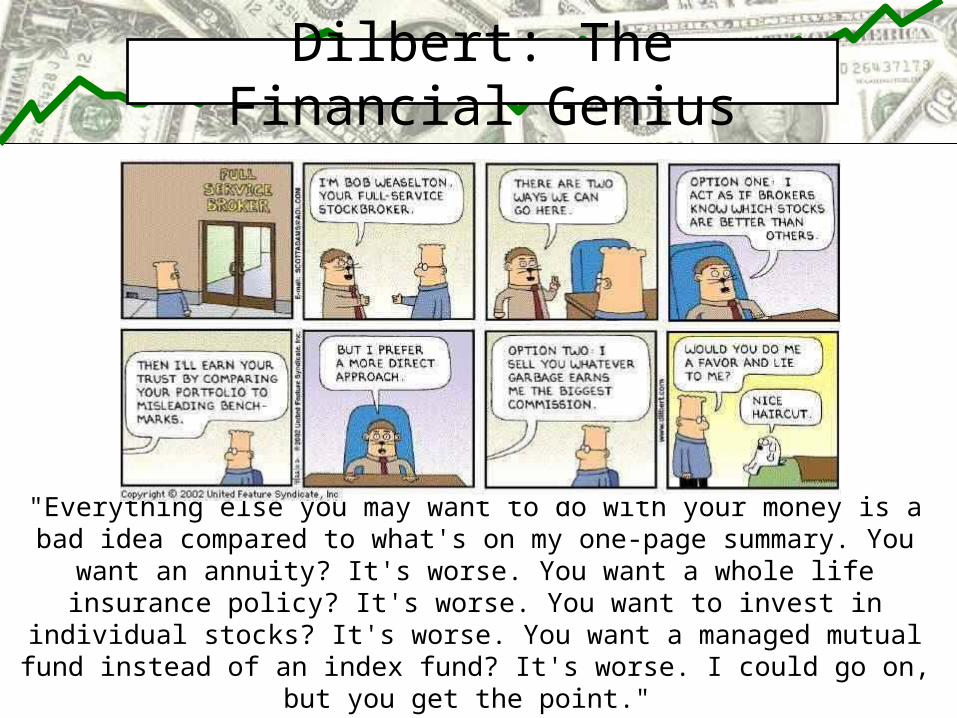
"Everything else you may want to do with your money is a bad idea compared to what's on my one-page summary. You want an annuity? It's worse. You
want a whole life insurance policy? It's worse. You want to invest in individual stocks? It's worse. You want a managed mutual fund instead of an index fund?
It's worse. I could go on, but you get the point." -Scott Adams
Dilbert: The Financial Genius
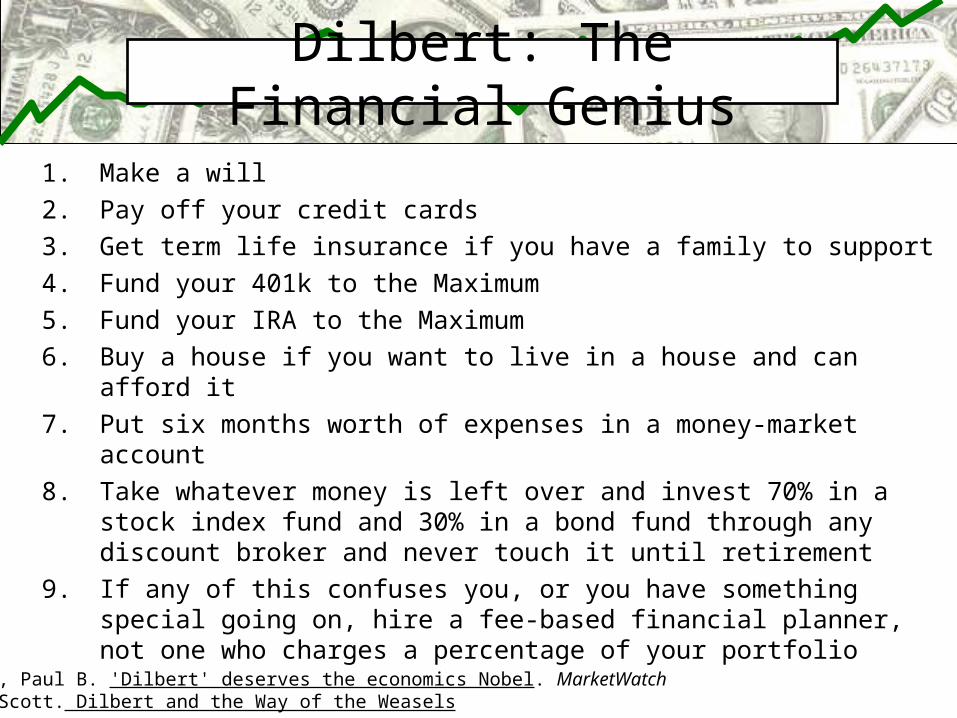
1. Make a will
2. Pay off your credit cards
3. Get term life insurance if you have a family to support
4. Fund your 401k to the Maximum
5. Fund your IRA to the Maximum
6. Buy a house if you want to live in a house and can afford it
7. Put six months worth of expenses in a money-market account
8. Take whatever money is left over and invest 70% in a stock index fund and 30% in a bond fund through any discount broker and never touch it until retirement
9. If any of this confuses you, or you have something special going on, hire a fee-based financial planner, not one who charges a percentage of your portfolio
Dilbert: The Financial Genius
Farrell, Paul B. 'Dilbert' deserves the economics Nobel. MarketWatchAdams, Scott. Dilbert and the Way of the Weasels
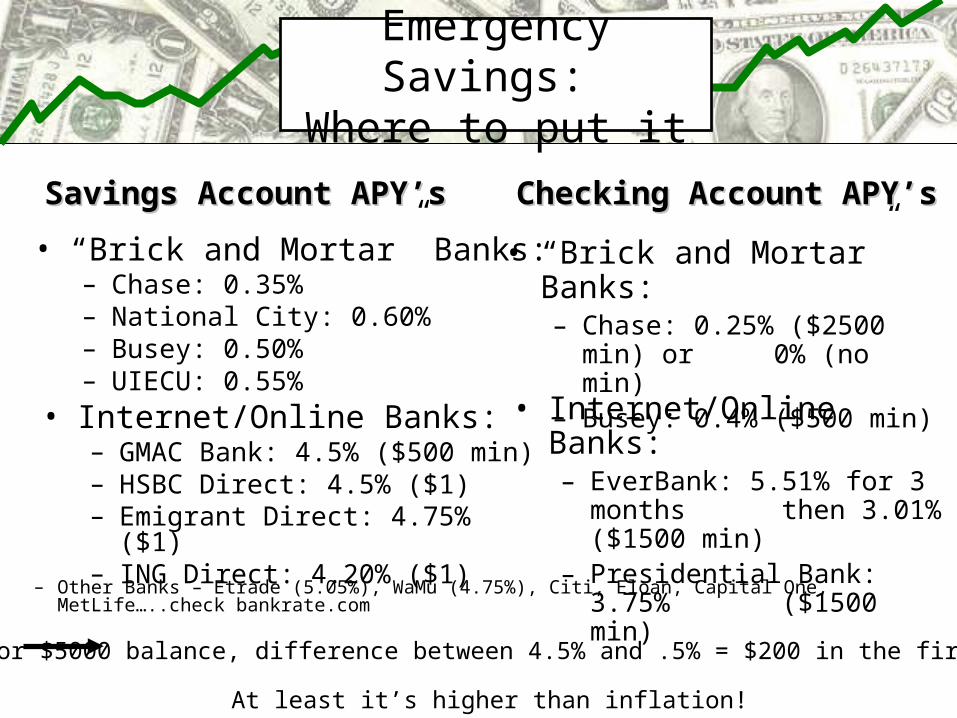
• “Brick and Mortar” Banks: – Chase: 0.35%– National City: 0.60%– Busey: 0.50%– UIECU: 0.55%
Emergency Savings: Where to put it
Savings Account APY’sSavings Account APY’s
• “Brick and Mortar” Banks: – Chase: 0.25% ($2500 min) or
0% (no min)– Busey: 0.4% ($500 min)
Checking Account APY’sChecking Account APY’s
• Internet/Online Banks:– GMAC Bank: 4.5% ($500 min)– HSBC Direct: 4.5% ($1)– Emigrant Direct: 4.75% ($1)– ING Direct: 4.20% ($1)
For $5000 balance, difference between 4.5% and .5% = $200 in the first year
At least it’s higher than inflation!
• Internet/Online Banks:– EverBank: 5.51% for 3 months
then 3.01% ($1500 min)
– Presidential Bank: 3.75% ($1500 min)
– Other Banks – Etrade (5.05%), WaMu (4.75%), Citi, Eloan, Capital One, MetLife…..check bankrate.com
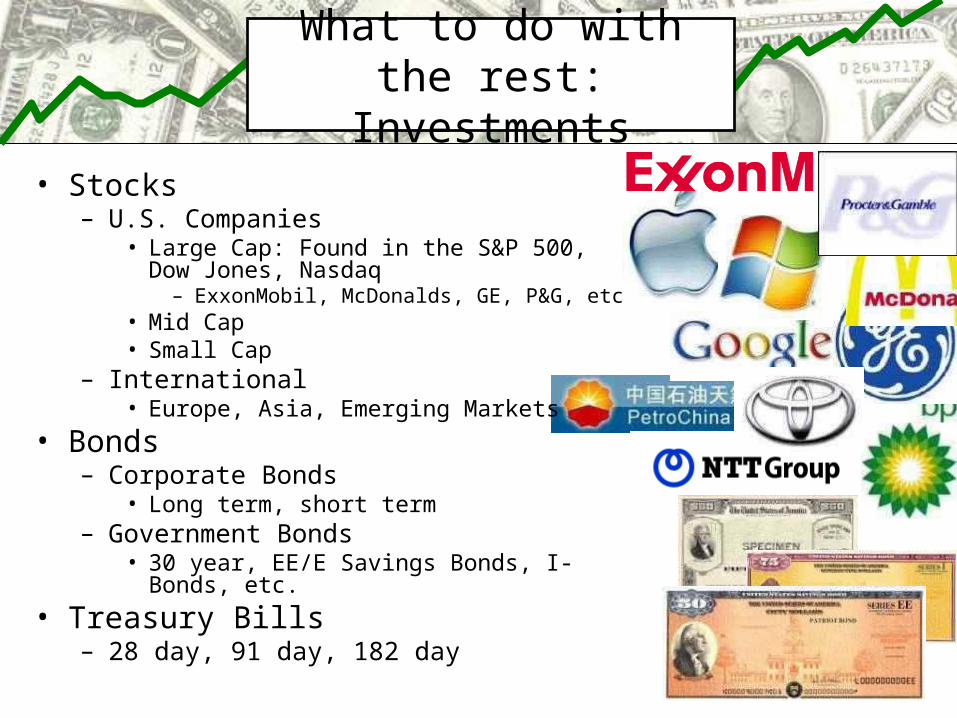
• Stocks– U.S. Companies
• Large Cap: Found in the S&P 500, Dow Jones, Nasdaq
– ExxonMobil, McDonalds, GE, P&G, etc• Mid Cap• Small Cap
– International• Europe, Asia, Emerging Markets
• Bonds– Corporate Bonds
• Long term, short term– Government Bonds
• 30 year, EE/E Savings Bonds, I-Bonds, etc.
• Treasury Bills– 28 day, 91 day, 182 day
What to do with the rest: Investments

• Dow Jones-Wilshire 5000– All U.S. companies that offer stock– ~ $16 trillion total market cap
• S&P 500 – 500 largest U.S. companies– Makes up ~30% of the total value of
the DJW 5000• Dow Jones
– 30 of the biggest U.S. companies– Makes up ~20% of the total value of
the DJW 5000• Nasdaq - 100
– 100 biggest “tech” companies• Russell 2000
– 2000 smallest U.S. companies
U.S. Stock Market: Famous Indexes
3M
AT&TBoeing
Caterpillar
Coca-Cola
Microsoft
Honeywell
Merck
Citigroup
P&G
Home Depot
JPMorgan Chase
DuPont
GM
Pfizer
HP
GE
IBM
ExxonMobil
McDonalds
Walt Disney
Johnson & JohnsonVerizon
United TechnologiesWal-Mart
Intel
American ExpressAGI
Alcoa
Altria Group
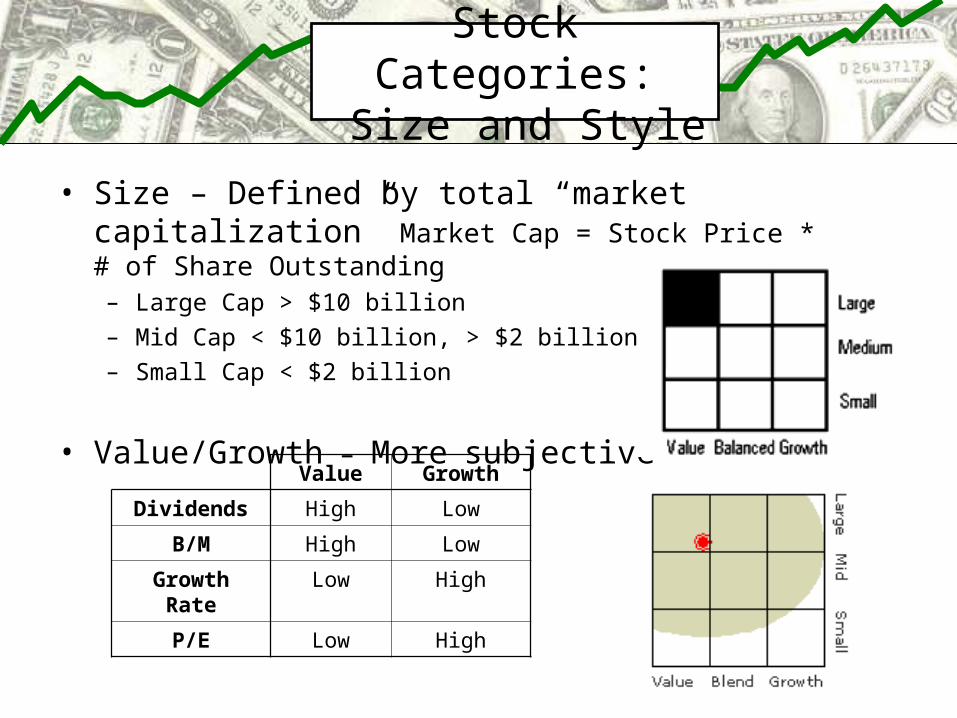
• Size – Defined by total “market capitalization” Market Cap = Stock Price * # of Share Outstanding– Large Cap > $10 billion
– Mid Cap < $10 billion, > $2 billion
– Small Cap < $2 billion
• Value/Growth – More subjective
Stock Categories: Size and Style
Value Growth
Dividends High Low
B/M High Low
Growth Rate Low High
P/E Low High
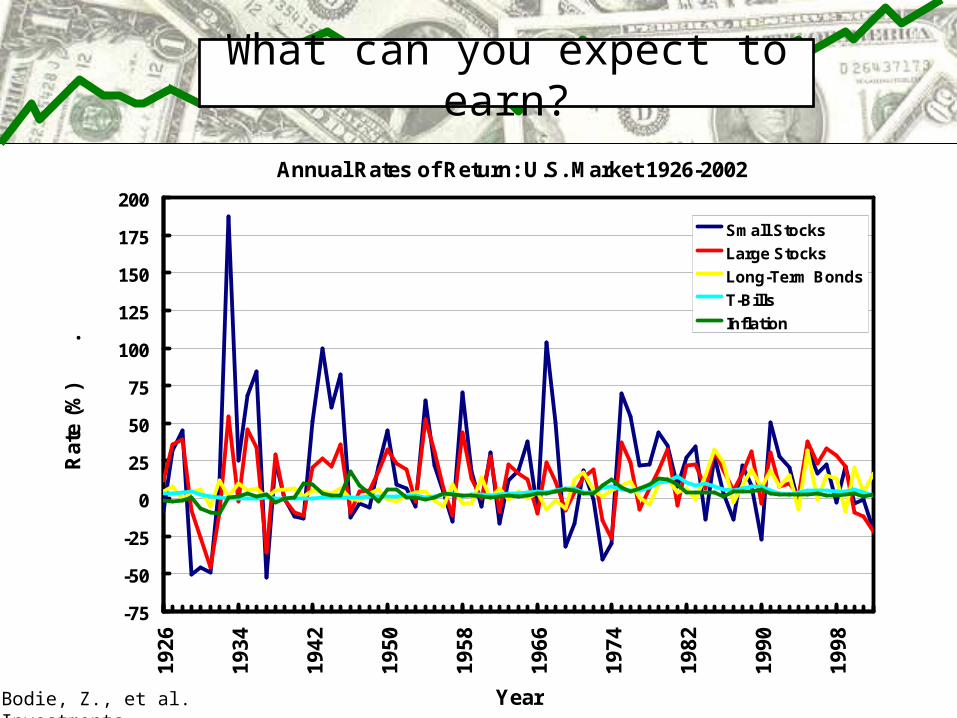
What can you expect to earn?
Annual Rates of Return: U.S. Market 1926-2002
-75
-50
-25
0
25
50
75
100
125
150
175
200
1926
1934
1942
1950
1958
1966
1974
1982
1990
1998
Year
Rat
e (%
)
.
Small Stocks
Large Stocks
Long-Term Bonds
T-Bills
Inflation
Bodie, Z., et al. Investments
SmallStocks
LargeStocks
Long-TermBonds T-Bills Inflation
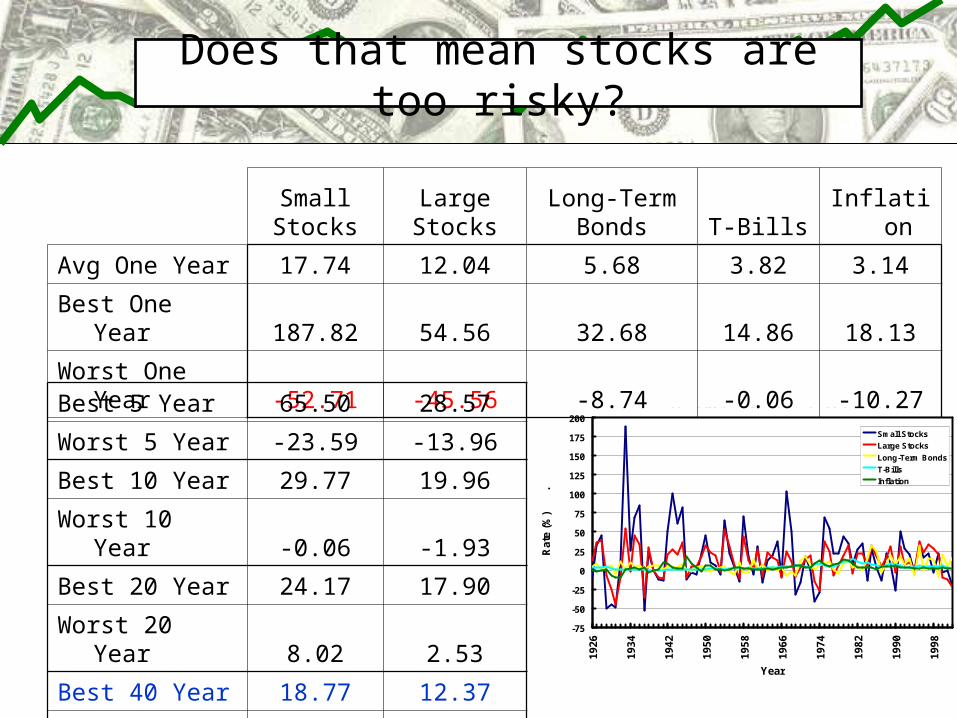
Avg One Year 17.74 12.04 5.68 3.82 3.14
Best One Year 187.82 54.56 32.68 14.86 18.13
Worst One Year -52.71 -45.56 -8.74 -0.06 -10.27
Does that mean stocks are too risky?
Best 5 Year 65.50 28.57
Worst 5 Year -23.59 -13.96
Best 10 Year 29.77 19.96
Worst 10 Year -0.06 -1.93
Best 20 Year 24.17 17.90
Worst 20 Year 8.02 2.53
Best 40 Year 18.77 12.37
Worst 40 Year 11.28 8.53
Annual Rates of Return: U.S. Market 1926-2002
-75
-50
-25
0
25
50
75
100
125
150
175
200
192
6
193
4
194
2
195
0
195
8
196
6
197
4
198
2
199
0
199
8
Year
Rat
e (%
)
.
Small Stocks
Large Stocks
Long-Term Bonds
T-Bills
Inflation
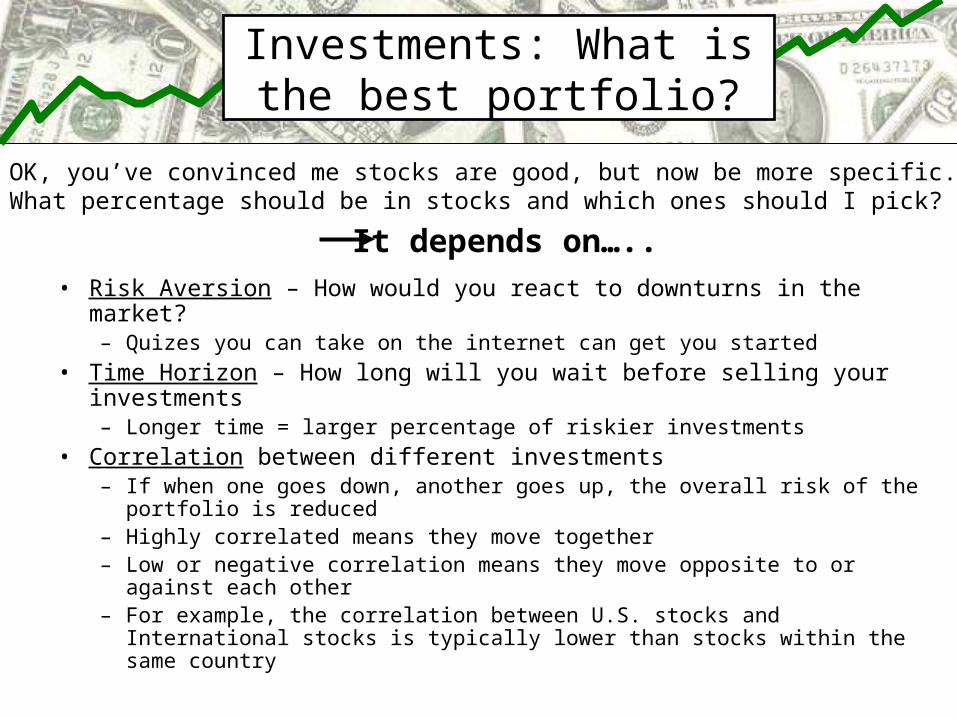
Investments: What is the best portfolio?
OK, you’ve convinced me stocks are good, but now be more specific. What percentage should be in stocks and which ones should I pick?
• Risk Aversion – How would you react to downturns in the market?– Quizes you can take on the internet can get you started
• Time Horizon – How long will you wait before selling your investments– Longer time = larger percentage of riskier investments
• Correlation between different investments – If when one goes down, another goes up, the overall risk of the portfolio is
reduced– Highly correlated means they move together– Low or negative correlation means they move opposite to or against each
other– For example, the correlation between U.S. stocks and International stocks
is typically lower than stocks within the same country
It depends on…..
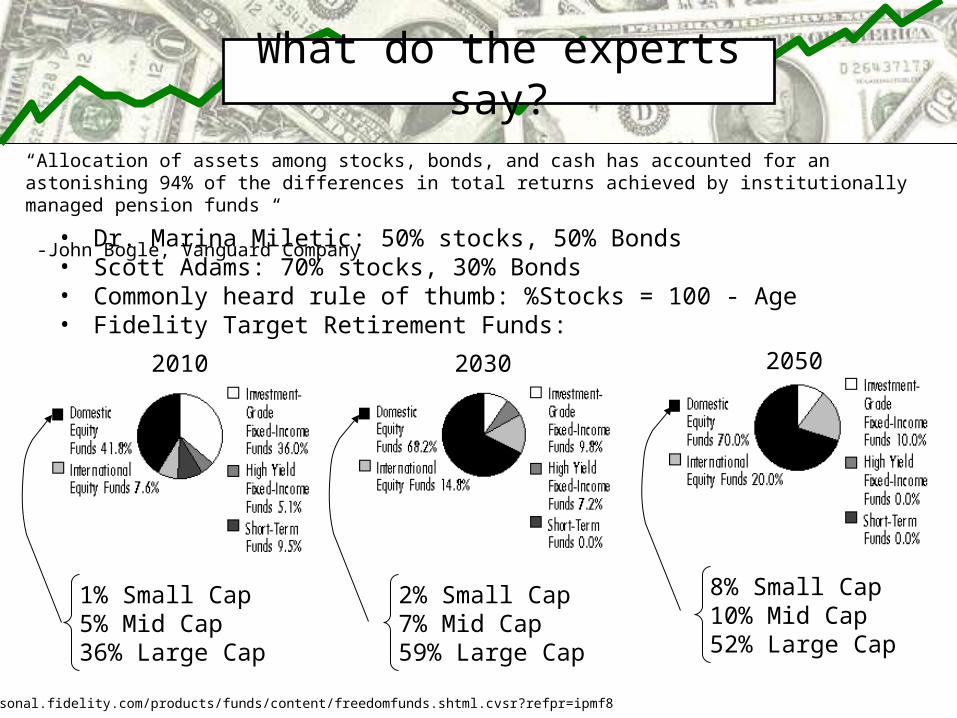
• Dr. Marina Miletic: 50% stocks, 50% Bonds• Scott Adams: 70% stocks, 30% Bonds• Commonly heard rule of thumb: %Stocks = 100 - Age• Fidelity Target Retirement Funds:
What do the experts say?
2010 2030 2050
1% Small Cap5% Mid Cap36% Large Cap
2% Small Cap7% Mid Cap59% Large Cap
8% Small Cap10% Mid Cap52% Large Cap
http://personal.fidelity.com/products/funds/content/freedomfunds.shtml.cvsr?refpr=ipmf8
“Allocation of assets among stocks, bonds, and cash has accounted for an astonishing 94% of the differences in total returns achieved by institutionally managed pension funds “
-John Bogle, Vanguard Company
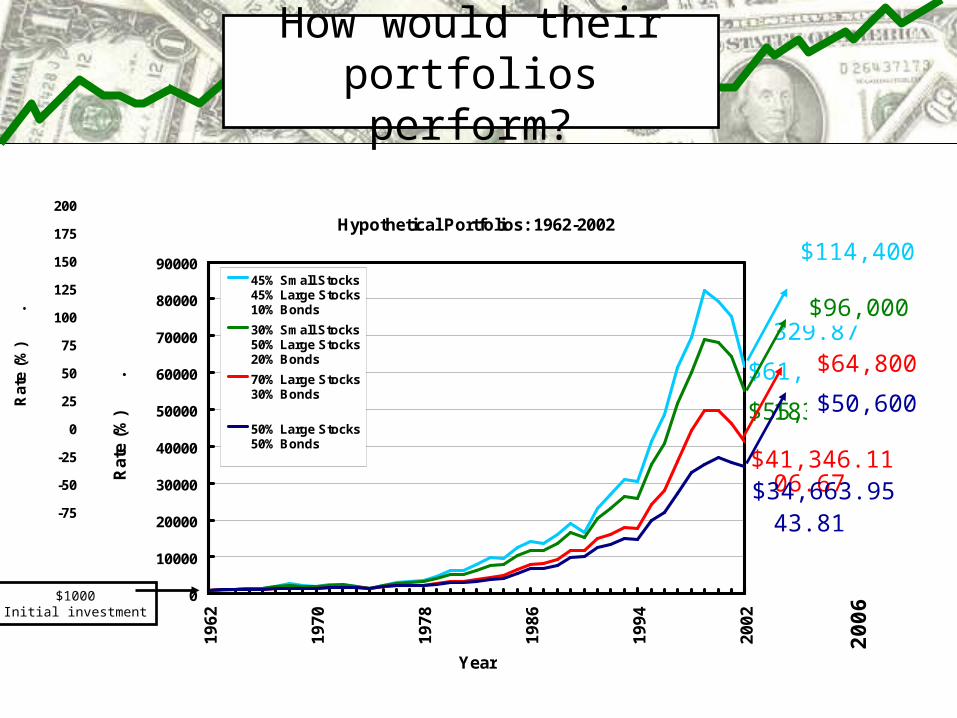
How would their portfolios perform?
$3329.87
$2183.56
$806.67
$443.81
Hypothetical Portfolios: 1926-2002
-75
-50
-25
0
25
50
75
100
125
150
175
200
1926
1934
1942
1950
1958
1966
1974
1982
1990
1998
Year
Rat
e (%
)
.
45% Small Stocks45% Large Stocks10% Bonds30% Small Stocks50% Large Stocks20% Bonds 70% Large Stocks30% Bonds
50% Large Stocks50% Bonds
Hypothetical Portfolios: 1926-2002
0
1000
2000
3000
4000
5000
1926
1934
1942
1950
1958
1966
1974
1982
1990
1998
Year
Rat
e (%
)
.
45% Small Stocks45% Large Stocks10% Bonds
30% Small Stocks50% Large Stocks20% Bonds
70% Large Stocks30% Bonds
50% Large Stocks50% Bonds
Hypothetical Portfolios: 1962-2002
0
10000
20000
30000
40000
50000
60000
70000
80000
90000
1962
1970
1978
1986
1994
2002
Year
Rat
e (%
)
.
45% Small Stocks45% Large Stocks10% Bonds
30% Small Stocks50% Large Stocks20% Bonds
70% Large Stocks30% Bonds
50% Large Stocks50% Bonds
$1000Initial investment
$61,595.18
$55,238.68
$41,346.11$34,663.95
2006
$114,400
$96,000
$64,800
$50,600
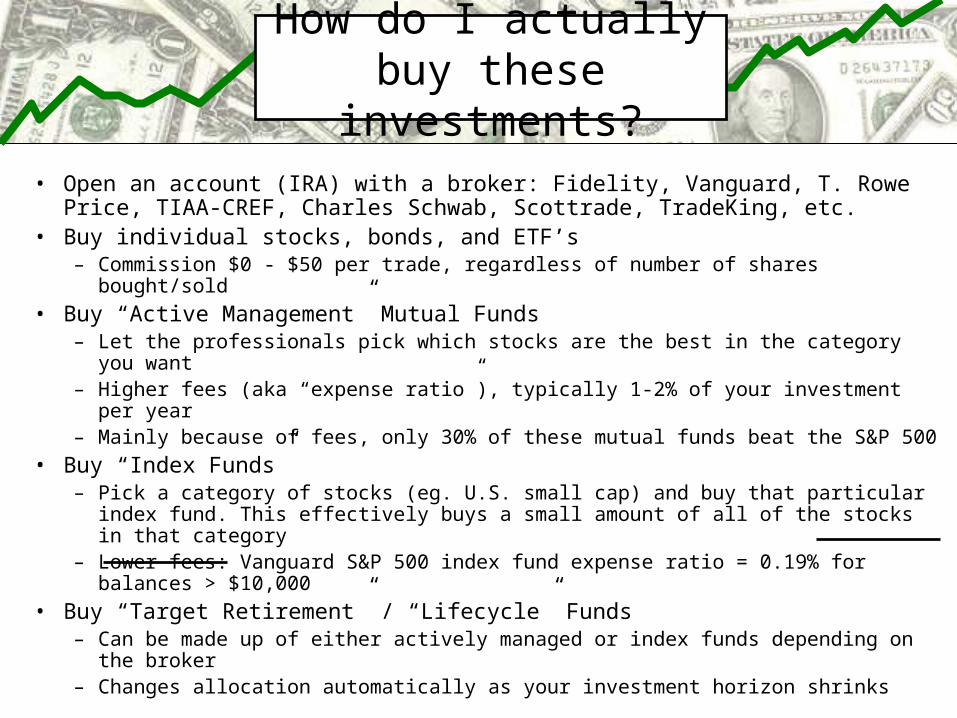
• Open an account (IRA) with a broker: Fidelity, Vanguard, T. Rowe Price, TIAA-CREF, Charles Schwab, Scottrade, TradeKing, etc.
• Buy individual stocks, bonds, and ETF’s– Commission $0 - $50 per trade, regardless of number of shares bought/sold
• Buy “Active Management” Mutual Funds– Let the professionals pick which stocks are the best in the category you want– Higher fees (aka “expense ratio”), typically 1-2% of your investment per year– Mainly because of fees, only 30% of these mutual funds beat the S&P 500
• Buy “Index Funds”– Pick a category of stocks (eg. U.S. small cap) and buy that particular index
fund. This effectively buys a small amount of all of the stocks in that category– Lower fees: Vanguard S&P 500 index fund expense ratio = 0.19% for balances
> $10,000
• Buy “Target Retirement” / “Lifecycle” Funds– Can be made up of either actively managed or index funds depending on the
broker– Changes allocation automatically as your investment horizon shrinks
How do I actually buy these investments?
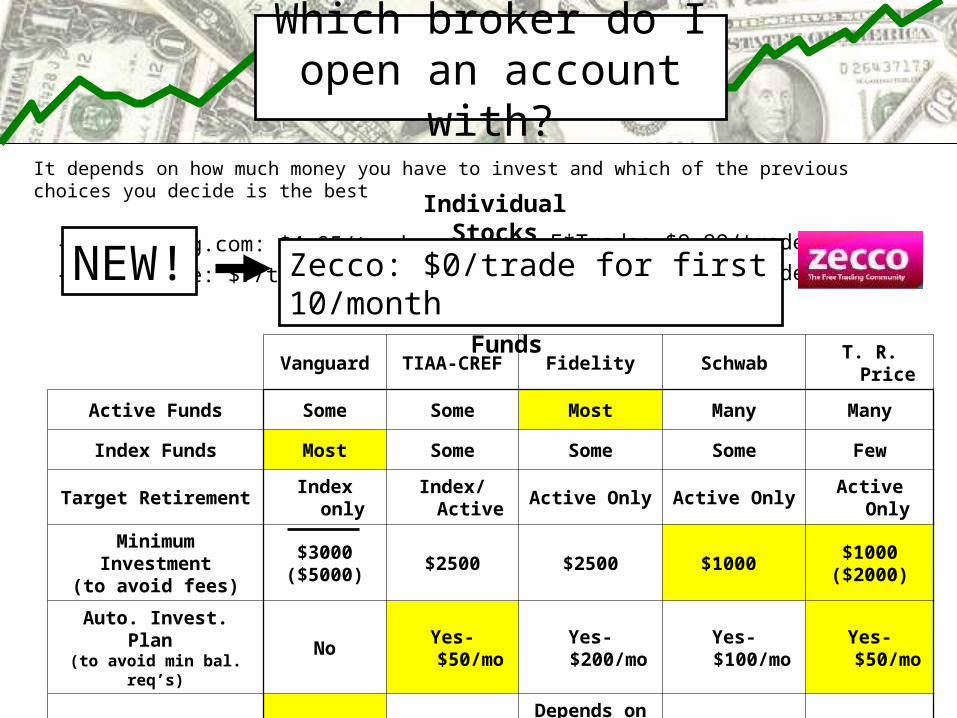
– TradeKing.com: $4.95/trade– Scottrade: $7/trade
Which broker do I open an account with?
It depends on how much money you have to invest and which of the previous choices you decide is the best
– E*Trade: $9.99/trade– Schwab: $12.95/trade
Mutual Funds
Vanguard TIAA-CREF Fidelity Schwab T. R. Price
Active Funds Some Some Most Many Many
Index Funds Most Some Some Some Few
Target Retirement Index only Index/Active Active Only Active Only Active Only
Minimum Investment(to avoid fees)
$3000 ($5000)
$2500 $2500 $1000 $1000
($2000)
Auto. Invest. Plan (to avoid min bal. req’s)
No Yes- $50/mo Yes- $200/mo Yes- $100/moYes- $50/mo
Average Expenses Lowest LowDepends on
Active / IndexHigh High
Individual Stocks
Zecco: $0/trade for first 10/monthNEW!
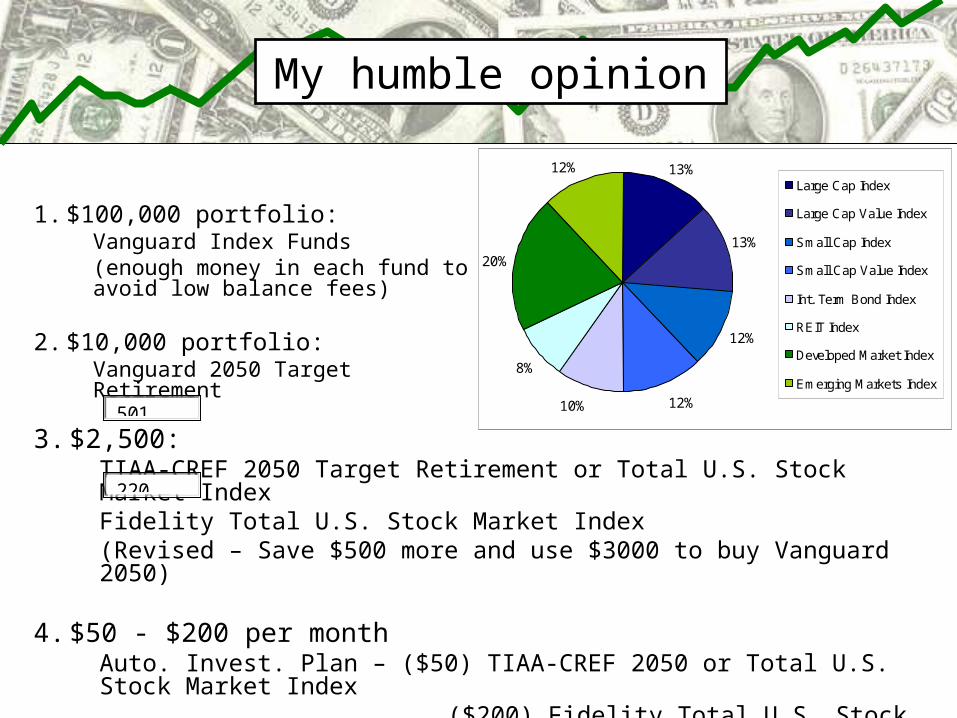
My humble opinion
1. $100,000 portfolio: Vanguard Index Funds(enough money in each fund to avoid low balance fees)
2. $10,000 portfolio:Vanguard 2050 Target Retirement
3. $2,500:TIAA-CREF 2050 Target Retirement or Total U.S. Stock Market IndexFidelity Total U.S. Stock Market Index(Revised – Save $500 more and use $3000 to buy Vanguard 2050)
4. $50 - $200 per monthAuto. Invest. Plan – ($50) TIAA-CREF 2050 or Total U.S. Stock Market Index
($200) Fidelity Total U.S. Stock Market Index
13%
13%
12%
12%10%
8%
20%
12%Large Cap Index
Large Cap Value Index
Small Cap Index
Small Cap Value Index
Int. Term Bond Index
REIT Index
Developed Market Index
Emerging Markets Index
501
220