performance and scaling analysis of a hypocycloid ... abstract the slider-crank mechanism is...
TRANSCRIPT

Performance and Scaling Analysis of a Hypocycloid Wiseman Engine
by
Priyesh Ray
A Thesis Presented in Partial Fulfillment of the Requirements for the Degree Master of Science in Technology
Approved April 2014 by the Graduate Supervisory Committee:
Sangram Redkar, Chair
Abdel Ra'ouf Mayyas Robert Meitz
ARIZONA STATE UNIVERSITY
May 2014
i
ABSTRACT
The slider-crank mechanism is popularly used in internal combustion engines to
convert the reciprocating motion of the piston into a rotary motion. This research
discusses an alternate mechanism proposed by the Wiseman Technology Inc. which
involves replacing the crankshaft with a hypocycloid gear assembly. The unique
hypocycloid gear arrangement allows the piston and the connecting rod to move in a
straight line, creating a perfect sinusoidal motion.
To analyze the performance advantages of the Wiseman mechanism, engine
simulation software was used. The Wiseman engine with the hypocycloid piston motion
was modeled in the software and the engine’s simulated output results were compared to
those with a conventional engine of the same size. The software was also used to analyze
the multi-fuel capabilities of the Wiseman engine using a contra piston. The engine’s
performance was studied while operating on diesel, ethanol and gasoline fuel. Further, a
scaling analysis on the future Wiseman engine prototypes was carried out to understand
how the performance of the engine is affected by increasing the output power and
cylinder displacement.
It was found that the existing Wiseman engine produced about 7% less power at
peak speeds compared to the slider-crank engine of the same size. It also produced lower
torque and was about 6% less fuel efficient than the slider-crank engine. These results
were concurrent with the dynamometer tests performed in the past. The 4 stroke diesel
variant of the same Wiseman engine performed better than the 2 stroke gasoline version
ii
as well as the slider-crank engine in all aspects. The Wiseman engine using contra piston
showed poor fuel efficiency while operating on E85 fuel. But it produced higher torque
and about 1.4% more power than while running on gasoline. While analyzing the effects
of the engine size on the Wiseman prototypes, it was found that the engines performed
better in terms of power, torque, fuel efficiency and cylinder BMEP as their
displacements increased. The 30 horsepower (HP) prototype, while operating on E85,
produced the most optimum results in all aspects and the diesel variant of the same
engine proved to be the most fuel efficient.

iii
DEDICATION
I dedicate this thesis to my parents and my brother, Javanika and Jitendra Ray,
and Radhesh, for their constant support and confidence in me. Their unconditional love
has always been an inspiration and a motivation for me to excel in life.

iv
ACKNOWLEDGMENTS
I would like to express my deepest appreciation to my committee chair, Dr.
Sangram Redkar, who has the essence of a genius. Without his wise words and persistent
guidance, this thesis would not have been possible. His attitude and zest towards teaching
has always encouraged me to work harder.
I would also like to thank my committee members, Dr. Abdel Ra'ouf Mayyas and
Professor Robert Meitz for being a part of this research.
I would like to thank everyone at the Wiseman Inc. including Keith Voigts, Mark
Smith, and Jerry Blankinchip for providing the origin of this thesis: The Wiseman
hypocycloid engine.
I am also grateful for the assistance given by Mr. Nigel Fleming at Lotus
Simulation Software and John Howell.
Finally, I would like to give a special thanks to all my friends for their tireless
effort in encouraging me.

v
TABLE OF CONTENTS
Page
LIST OF FIGURES .......................................................................................................... vii
LIST OF TABLES .............................................................................................................. x
CHAPTER
1 INTRODUCTION ........................................................................................................... 1
Slider-crank Mechanism ........................................................................................... 1
2 BACKGROUND ............................................................................................................. 6
Hypocycloid Concept and Geared Hypocycloid Mechanism ................................... 7
Implementing the Geared Hypocycloid Mechanism in an ICE .............................. 10
Performance Advantages of Hypocycloid Mechanism ........................................... 12
3 SCOPE OF WORK ........................................................................................................ 17
Modeling the 30 cc Wiseman Hypocycloid Engine ............................................... 17
Prior Tests by Wiseman Technologies Inc. ............................................................ 21
4 LOTUS ENGINE SIMULATION ................................................................................. 23
Validating LES Results ........................................................................................... 23
GUNT Engine Dynamometer Testing .................................................................... 25
GUNT LES Modeling ............................................................................................. 27
Wiseman LES (Two Stroke) ................................................................................... 38
Modeling the Hypocycloid Piston Motion .............................................................. 39
Brake Power and Torque Comparison .................................................................... 44
vi
CHAPTER Page
Brake Specific Fuel Consumption (BSFC) Comparison ........................................ 47
5 MULTI-FUEL ANALYSIS OF WISEMAN ENGINE ................................................. 48
30 cc Wiseman Engine Running on Diesel (Four Stroke) ...................................... 49
30 cc Wiseman Engine with Contra Piston............................................................. 52
30 cc Wiseman Engine with Contra Piston Running on Ethanol (Two Stroke) ..... 53
Scalability Analysis on Bigger Wiseman Engine Prototypes ................................. 58
Scaling Laws for Internal Combustion Engines ..................................................... 61
6 CONCLUSION AND RECOMMENDATIONS .......................................................... 78
Recommendations and Future Work ...................................................................... 82
REFERENCES ................................................................................................................. 84
APPENDIX ....................................................................................................................... 87
A COMMON LES SOFTWARE TEST CONDITIONS........................................ 87
B 30 cc LES MODEL INPUT PARAMETERS ..................................................... 89
C 30 cc DIESEL LES MODEL INPUT PARAMETERS ...................................... 94
D GUNT LES MODEL INPUT PARAMETERS .................................................. 98
E 10 HP/ 20 HP/ 30 HP GASOLINE AND ETHANOL MODEL INPUT
PARAMETERS .................................................................................................... 102
F 10 HP/ 20 HP/ 30 HP DIESEL MODEL INPUT PARAMETERS................... 106

vii
LIST OF FIGURES
Figure Page
1. Working principle of a Four Stroke SI Engine (Ganesan, 2012, p. 7) ............................ 2
2. Piston Side Load ............................................................................................................. 4
3. White’s Geared Hypocycloid Engine ............................................................................. 7
4. Franz Reuleaux’s Slider-crank (L) and Cardan Gear (R) Mechanisms (Karhula, 2008,
p. 20) ................................................................................................................................... 7
5. Hypocycloid Concept...................................................................................................... 8
6. Geared Hypocycloid Concept Rotating at 45º Increments (Conner, 2011) .................. 10
7. Schematic of a Single Cylinder G. H. E. (WTI, 2010) ................................................. 11
8. Sketch from Wiseman US Patent # 6,510,831 (Wiseman, 2001) ................................. 12
9. Wiseman (Left) and Stock Engine (Right) ................................................................... 18
10. Wiseman 30CC Prototype Section View (Conner, 2011) .......................................... 19
11. Wiseman Driveline (Conner, 2011) ............................................................................ 20
12. (Left) Back View, Engine at 90º ATDC (Conner, 2011)............................................ 21
13. (Right) Back View, Engine at BDC (Conner, 2011) .................................................. 21
14. Methodology to Validate LES Results ....................................................................... 24
15. GUNT 1B30 Engine ................................................................................................... 25
16. Manufacturer Provided Performance Curves of GUNT Engine ................................. 26
17. LES Concept Tool....................................................................................................... 28
18. Inlet Port Flow Coefficient Curves used by LES........................................................ 31

viii
Figure Page
19. Exhaust Port Flow Coefficient Curves used by LES .................................................. 31
20. LES GUNT Model (Diesel) ........................................................................................ 36
21. Comparison of LES Result of the GUNT engine (diesel) with Dyno Tests ............... 37
22. Wiseman (Hypocycloid) Piston Position Diagram ..................................................... 41
23. Comparison of Time Vs Piston Speed of Slider-crank and Wiseman Engine ............ 43
24. Comparison of Time Vs Displacement Vol. of Slider-crank and Wiseman Engine .. 43
25. 2 Stroke Wiseman LES model .................................................................................... 44
26. LES Results of Wiseman and Slider-crank Engine for Brake Power ......................... 45
27. LES Results of Wiseman and Slider-crank Engine for Torque .................................. 46
28. LES Results of Wiseman and Slider-crank Engine for BSFC .................................... 47
29. Power Comparison of Wiseman Diesel, Gas and a Conventional Gas Engines ......... 50
30. Torque Comparison of Wiseman Diesel, Gas and Conventional Gas Engines .......... 51
31. BSFC Comparison of Wiseman Diesel, Gas and Conventional Gas Engines ............ 51
32. Variable Compression Wiseman UAV Engine (Wiseman Inc.) ................................. 53
33. Power Comparison of Wiseman Engine with Contra Piston (E85 and Gas) .............. 55
34. Torque Comparison of Wiseman Engine with Contra Piston (E85 and Gas)............. 56
35. BSFC Comparison of Wiseman engine with Contra Piston (E85 and Gas) ............... 57
36. Scaled Relationship between Engine Sizes and Bore to Stroke Ratio ........................ 62
37. Scaling of Bore to Stroke Ratio with Engine Displacement (Menon, 2010) .............. 63
38. Scaling of Peak Engine Torque with Engine Displacement (Menon, 2010) .............. 64
39. Scaling Wiseman Engine’s Torque with Engine Size at 2000 RPM .......................... 64
ix
Figure Page
40. Scaling Slider-crank Engine’s Torque with Engine Size at 2000 RPM ..................... 65
41. Comparing the Scaled Torque of Wiseman and Slider-crank Engine ........................ 66
42. Scaling Peak Engine Power Output with Engine Size (Menon, 2010) ....................... 67
43. Scaling Wiseman Engine’s Peak Power with Size at 2000 RPM ............................... 68
44. Scaling Slider-crank Engine’s Peak Power with Size at 2000 RPM .......................... 69
45. Comparing the Scaled Power of Wiseman and Slider-crank Engine ......................... 69
46. Scaling of SFC at Peak Power with Engine Size (Menon, 2010) ............................... 70
47. Scaling Wiseman Engine’s BSFC with Respect to Engine Displacement ................. 71
48. Scaling Slider-crank Engine’s BSFC with Respect to Engine Size ............................ 72
49. Comparing the Scaled BSFC of Wiseman and Slider-crank Engine .......................... 73
50. Scaling of Peak Engine BMEP with Engine Size (Menon, 2010) .............................. 74
51. Scaling Wiseman Engine’s BMEP with Respect to Engine Displacement ................ 75
52. Scaling Slider-crank Engine’s BMEP with Respect to Engine Size........................... 76
53. Comparing the Scaled BMEP of Wiseman and Slider-crank Engine ......................... 76

x
LIST OF TABLES
Table Page
1. Engine Specifications.................................................................................................... 18
2. Summary of Engine Tests Conducted by WTI ............................................................. 22
3. GUNT Engine Specifications ....................................................................................... 25
4. Intake and Exhaust Port Timings for GUNT Engine (Diesel) ...................................... 31
5. Wiseman LES Port Data ............................................................................................... 38
6. Wiseman Dynamometer Test Summary ....................................................................... 45
7. Performance Summary at the Peak Speed of 7000 RPM ............................................. 52
8. Performance Summary of Wiseman with Contra Piston (E85 and Gas) at 7000 RPM 58
9. Calculated Specifications of 10, 20, and 30 HP Gasoline Engines .............................. 60
10. Calculated Specifications of 10, 20, and 30 HP Diesel Engines ................................ 60

1
Chapter 1
INTRODUCTION
A unique characteristic of the present day civilization is industrialization, and that has
been possible due to the extensive progress in mechanical technology or machines. Most
of these machines consume some or the other form of energy and convert them into
another. In the simplest form, a machine that does this energy conversion can said to be
an engine. This also means that there is a constant need to improve the efficiency of these
engines in terms of how they convert the energy from one form to another.
One such engine is the heat engine. A heat engine converts chemical energy
stored in a fuel into a thermal energy. This thermal energy is then used to perform work
in terms of moving parts. There are primarily two types of heat engines, the external type
and internal type. In this study only focuses on the Internal Combustion Engines (ICE).
There are various types of ICE invented over the years and their application has varied
from generators to locomotives.
Slider-crank Mechanism
Over the course of time, the ICE has undergone incredible change in terms of
technical advancements but the fundamental concept behind its mechanism has still
remained unchanged. It still relies on the popular slider-crank or crankshaft based
mechanism. This mechanism consists of three primary parts. The Crank, which is the
rotating flywheel, the piston or the slider that slides inside the tubular cylinder, also
known as the bore, and the connecting rod that connects the sliding piston to the crank.
2
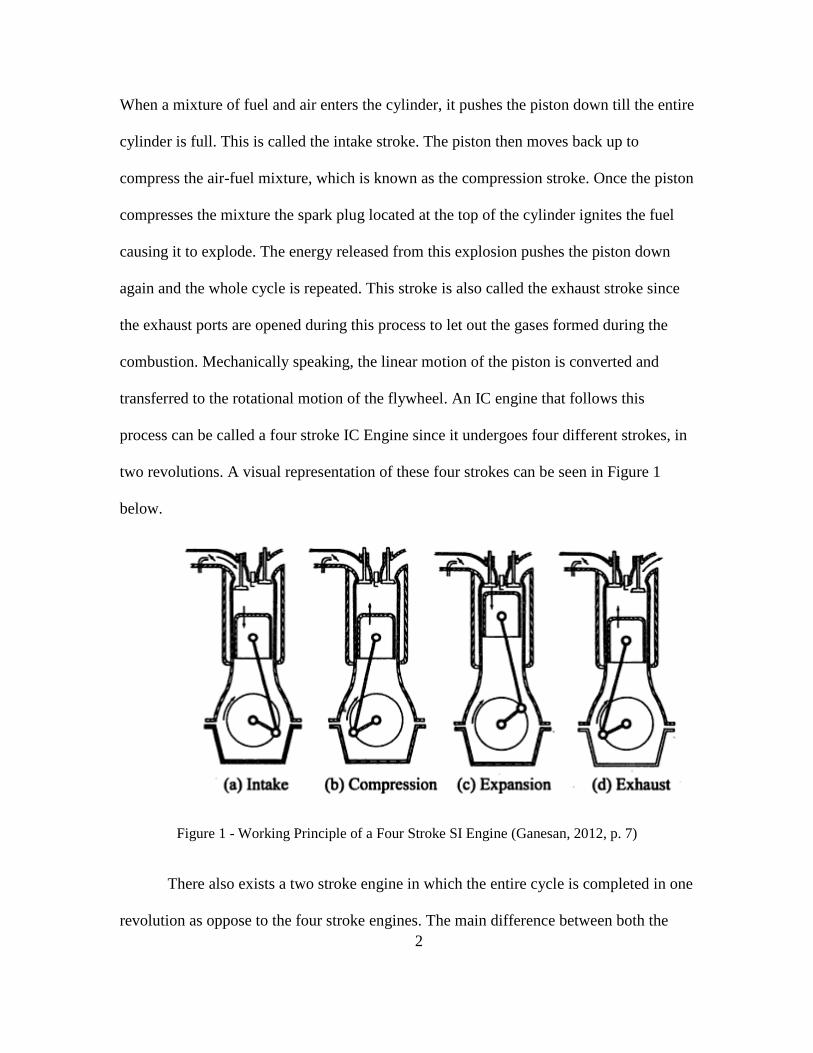
When a mixture of fuel and air enters the cylinder, it pushes the piston down till the entire
cylinder is full. This is called the intake stroke. The piston then moves back up to
compress the air-fuel mixture, which is known as the compression stroke. Once the piston
compresses the mixture the spark plug located at the top of the cylinder ignites the fuel
causing it to explode. The energy released from this explosion pushes the piston down
again and the whole cycle is repeated. This stroke is also called the exhaust stroke since
the exhaust ports are opened during this process to let out the gases formed during the
combustion. Mechanically speaking, the linear motion of the piston is converted and
transferred to the rotational motion of the flywheel. An IC engine that follows this
process can be called a four stroke IC Engine since it undergoes four different strokes, in
two revolutions. A visual representation of these four strokes can be seen in Figure 1
below.
Figure 1 - Working Principle of a Four Stroke SI Engine (Ganesan, 2012, p. 7)
There also exists a two stroke engine in which the entire cycle is completed in one
revolution as oppose to the four stroke engines. The main difference between both the

3
engines is the way the charge is filled and removed from the engine cylinder. In a two
stroke engine, the charge entering the combustion chamber is compressed before it is
induced into the cylinder which causes the exhaust gases to be pushed out through the
exhaust ports. This eliminates the piston strokes required for both these operations.
A diesel engine is slightly different than the spark ignited engine in the sense that,
the combustion in the diesel engine is caused due to compression. Hence diesel engines
have a much higher compression ratio. The reason behind having a high compression
ratio is that the ignition temperature of diesel is lower than gasoline and combustion in
the piston chamber can be caused just by supplying energy to the fuel by compressing it.
There is no need for an external spark to ignite the fuel in the combustion chamber
(Mathur & Sharma, 1997, p. 25).
Despite being the most popular mechanism in the industry, the slider-crank
mechanism still has few design limitations. One such shortcoming is the loss of energy
due to friction between the piston and cylinder walls. The connecting rod and the piston
are joined using a wrist-pin about which the piston is free to rotate. The connecting rod in
the slider-crank mechanism follows a sinusoidal motion which is converted into a linear
motion at the piston end. As seen in Figure 2, due to the inclination of the connecting rod
at various angles, it causes the piston to rub against the inner walls of the cylinder. This
produces a load, known as the side load, which is perpendicular to the axis of the
cylinder. This load results into reduced engine efficiency due to friction and heat.

4
Figure 2 - Piston Side Load
There have been years of research and development to increase engine efficiency and
reduce internal cylinder friction. A lot of these solutions to improve the engine efficiency
in terms of cylinder friction are often complex and uneconomical. One alternative to this
mechanism, especially emphasizing on the reduced cylinder friction, is the Geared
Hypocycloid Engine (GHE). The basic theory behind the working of the GHE
mechanism is that the crankshaft found in the standard ICE is replaced by a gear
assembly. There have been prototypes of the GHE tested in the past and they have proven
to be advantageous than the conventional slider-crank setup in terms of efficiency. In
order to experimentally further investigate the design benefits of a hypocycloid engine
over its slider-crank counterpart, the Wiseman Technologies Inc. (WTI), provided us with

5
a 30 cc two-cycle GHE. This engine from hereafter will be referred to as the Wiseman
engine.
The major tasks required to accomplish this research focus were:
1. Modeling the Wiseman hypocycloid engine.
2. Comparing the Wiseman hypocycloid mechanism to a conventional slider-crank
mechanism and understanding the difference between their mechanical assemblies.
3. Analyzing the Wiseman hypocycloid prototype using engine simulation software.
a. Validating the results generated by simulation software by first comparing it
with a stock engine with known performance output.
b. Simulating the Wiseman engine using the Lotus Engine Simulation (LES)
software to determine various performance parameters.
c. Setting baseline results to which the conventional engine and the Wiseman
engine can be compared with.
4. Performing multi-fuel and scalability analysis on the Wiseman engine to predict its
performance for future designs.
a. Determining how the Wiseman engine performs while operating on different
fuels.
b. Determining how various output parameters of an engine change with respect
to its size.
c. Using the scaling methods to predict the theoretical performance of future
Wiseman hypocycloid engine designs.

6
Chapter 2
BACKGROUND
GHE has been a research-interest for many decades now and various universities and
groups have contributed to the development of the mechanism. One of the first
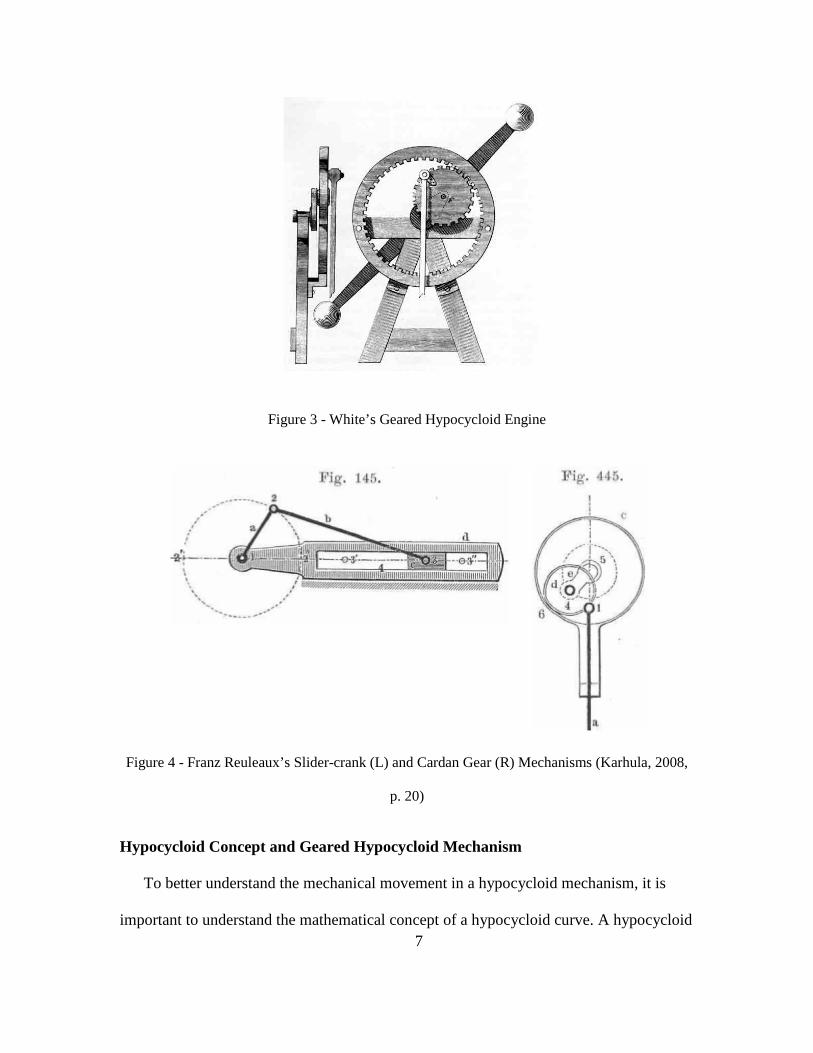
documented mechanism was produced by an English engineer, James White (Dickinson,
1949-51, p. 175-179). White’s engine with its unique gear assembly can be seen in Figure
3. Even though White received a medal from Napoleon Bonaparte in 1801 for his
invention, he was not entirely convinced by the design benefits (White, 1822, p. 30-31).
But a German mechanical engineer, Franz Reuleaux, is considered to be the originator of
the slider-crank as well as the hypocycloid mechanism design. A collection of his various
mechanisms which combine different gear systems with a slider-crank is now displayed
at the Cornell University. Two of those designs can be seen in Figure 4. Various other
steam engines were later produced based on White’s and Reuleaux’s design. One such
engine was developed by Matthew Murray in 1802, which was patented and
manufactured to be used as a water pump in 1805 (Karhula, 2008, p. 19). There have
been many other famous mathematicians and scientists who have proposed their theories
and designs for a modified hypocycloid mechanism or also known as the cardan gear
mechanism.
7
Figure 3 - White’s Geared Hypocycloid Engine
Figure 4 - Franz Reuleaux’s Slider-crank (L) and Cardan Gear (R) Mechanisms (Karhula, 2008,
p. 20)
Hypocycloid Concept and Geared Hypocycloid Mechanism
To better understand the mechanical movement in a hypocycloid mechanism, it is
important to understand the mathematical concept of a hypocycloid curve. A hypocycloid
8
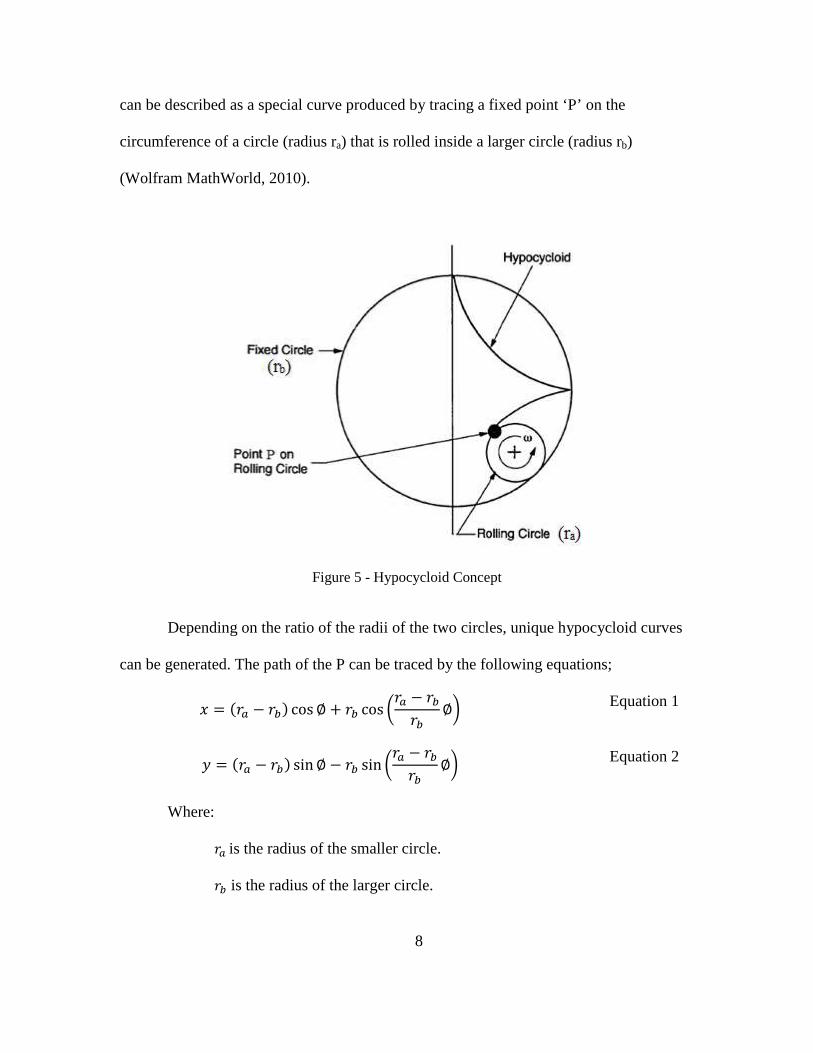
can be described as a special curve produced by tracing a fixed point ‘P’ on the
circumference of a circle (radius ra) that is rolled inside a larger circle (radius rb)
(Wolfram MathWorld, 2010).
Figure 5 - Hypocycloid Concept
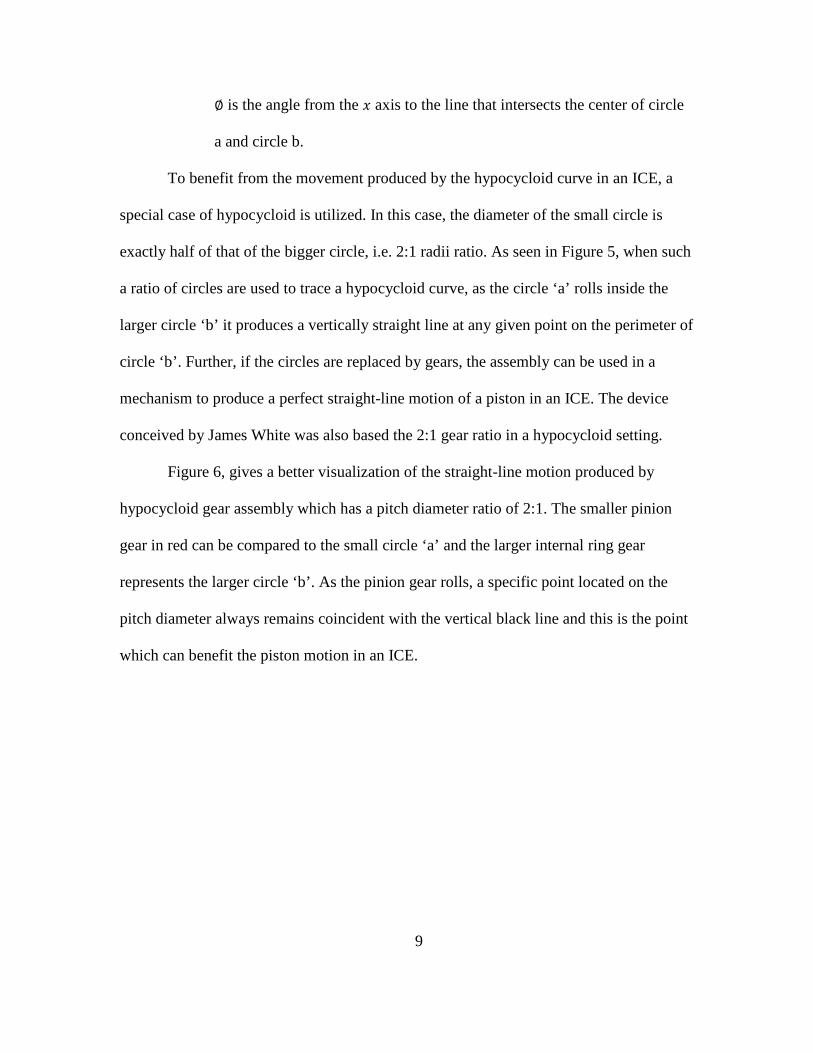
Depending on the ratio of the radii of the two circles, unique hypocycloid curves
can be generated. The path of the P can be traced by the following equations;
� � ��� � ��� cos � �� cos ��� � ���� �� Equation 1
� � ��� � ��� sin � � �� sin ��� � ���� �� Equation 2
Where:
�� is the radius of the smaller circle.
�� is the radius of the larger circle.
9
� is the angle from the � axis to the line that intersects the center of circle
a and circle b.
To benefit from the movement produced by the hypocycloid curve in an ICE, a
special case of hypocycloid is utilized. In this case, the diameter of the small circle is
exactly half of that of the bigger circle, i.e. 2:1 radii ratio. As seen in Figure 5, when such
a ratio of circles are used to trace a hypocycloid curve, as the circle ‘a’ rolls inside the
larger circle ‘b’ it produces a vertically straight line at any given point on the perimeter of
circle ‘b’. Further, if the circles are replaced by gears, the assembly can be used in a
mechanism to produce a perfect straight-line motion of a piston in an ICE. The device
conceived by James White was also based the 2:1 gear ratio in a hypocycloid setting.
Figure 6, gives a better visualization of the straight-line motion produced by
hypocycloid gear assembly which has a pitch diameter ratio of 2:1. The smaller pinion
gear in red can be compared to the small circle ‘a’ and the larger internal ring gear
represents the larger circle ‘b’. As the pinion gear rolls, a specific point located on the
pitch diameter always remains coincident with the vertical black line and this is the point
which can benefit the piston motion in an ICE.

10
Figure 6 - Geared Hypocycloid Concept Rotating at 45º Increments (Conner, 2011)
Implementing the Geared Hypocycloid Mechanism in an ICE
As discussed above, the 2:1 gear ratio allows any point on the pitch circle of the
pinion gear to travel in a perfectly straight line with a perfect sinusoidal motion. But the
angle of the straight line depends on the point chosen on the pitch circle. The ICE could
benefit from this mechanism after modifying this assembly with addition of few more
components. Mr. Randal Wiseman, founder of WTI, filed for a patent in 2001 for an
engine incorporating a hypocycloid mechanism. The hypocycloid engine was modified

11
from a stock 30 cc Homelite engine by adding a link to support the pinion gear where the
rotary motion is transferred to an output shaft, known as the rotating output shaft (L2).
Further, the bottom end of the connecting rod was connected to the point D1 (Figure 7),
and this point represents the previously mentioned point ‘P’ that traces the vertical
straight-line hypocycloidal curve.
Figure 7 - Schematic of a Single Cylinder G. H. E. (WTI, 2010)
Mr. Wiseman’s model proposed in the patent illustrates the link supporting pinion
gear (Item 200), known as the carrier shaft (Item 100) in Figure 8 below. The Wiseman

12
engine also has a provision for the pinion gear teeth (Item 204) to mesh with the fixed
internal ring gear (Item 6) in the form of a cavity (Item 322).
Figure 8 - Sketch from Wiseman US Patent # 6,510,831 (Wiseman, 2001)
Performance Advantages of Hypocycloid Mechanism
Theoretically, the GHE promises various performance and design benefits, with lower
friction, heat, and engine vibration being the most important ones. But since there have
only been prototypes of such engines and most have not been popularly commercialized,
it is important that these theoretical predictions are further explored to gain detailed
knowledge of its performance and make more analytical judgments. The cardan gear
system is rarely seen in any type of machines (Karhula, 2008, p. 22).

13
Kenjiro Ishida and Takashi Matsuda studied the basic principles of a geared
hypocycloid mechanism which they called a rotation-reciprocation mechanism. In his
research attempts, Ishida studied a 63 cc hypocycloid chainsaw engine which he
compared it with a conventional slider-crank engine of equivalent size. He declared that
the internal gear mechanism was highly practical and tends to produce more power at
lesser or equal RPMs as compared to the slider-crank mechanism. After performing
various dynamometer tests, he noted that the hypocycloid engine tends to consume more
fuel, 751.5 (g/hp)*hr as compared to 295 (g/hp)*hr by the slider-crank mechanism. He
reasoned the reduce performance of hypocycloid engine, in terms of brake specific fuel
consumption (BSFC), as a result of larger crankcase volume which resulted in lower
primary compression ratio (PCR).
While comparing different sinusoidal hypocycloid engines, Ishida also observed
that, in terms of design the internal gear assembly in the hypocycloid engines is lucrative
when the size is required to be small. Many similar engines even incorporated external
gearing to achieve a harmonic motion in a linear path. The flexibility to manipulate the
gear size, which determines the overall size of the engine, proves to be beneficial in a
case where the dimensions are a design limitation.
Another excellent study of geared hypocycloid engine was conducted by Mr.
David M. Ruch as a part of his PhD research. Mr. Ruch, in his PhD dissertation titled
“An Experimental and Analytical Investigation of a Single-Cylinder Modified
Hypocycloid Engine Design”, mentions that, one of the major benefits of the hypocycloid
engine when compared to the sinusoidal engine is that the connecting rod (piston-rod)
bending is eliminated. This meant that the force due to gas and inertia exerted on the

14
piston-rod was only along the rod’s axis (Ruch D., 1992). Theoretically, this contributes
in increasing the overall of mechanical efficiency of the engine as compared to the
conventional engines based on slider-crank mechanism, where the bending forces are
produced from the crankpin on the yoke.
One more advantage of the GHE is the reduction in the loads on the crankshaft
caused by the gas force (Fg). This is because the torque transmitted in the GHE is split
into two paths; one through the crankpin and the other through the sun gear. The total
torque then can be expressed as;
T’ = T’ crankpin + T’sun Equation 3
Where,
T’ is total torque exerted on the GHE crankshaft,
T’ crankpin is torque exerted on the GHE crankshaft through the crankpin’
T’ sun is torque exerted on the GHE through the sun gear.
Further the torque in the crankshaft through crankpin can be expressed as;
T’ crankpin = Ft’ (L/4) Equation 4
Where,
Ft’ is tangential load on the modified hypocycloid crankpin from the
piston.
Mr. Ruch also mentions that even though all conventional ICEs eliminate most of
the piston-skirt/cylinder friction by replacing it with linear bearing friction, there is still
approximately 17% energy loss due to the bearing friction. On the other hand, GHE has
almost no energy losses due to the linear bearing friction, since the restraining forces
caused by the linear bearings in the convention engines are replaced by gear tooth loads
15
in a GHE (Ruch D., 1993). On the other hand, the gear mesh friction can be reduced
significantly since the manufacturing of gears can be highly optimized. Contrastingly the
GHE mechanism does result in high gear tooth loads due to the inertia load as a result of
pinion rotation about the crankshaft axis (Menz, 1987). For a constant pinion rotational
speed, the gear tooth load Wt can be calculated by the following equation;
Wt = Fg Sin(θc) Equation 5
Where,
Wt is tangential gear tooth load on the pinion,
Fg is gas force on the piston,
θc is crank angle.
Gas force can be calculated by finding the product of the area of the piston head
and the pressure exerted on it. In the case of the Wiseman engine, the gas force on the
engine piston was known to be 104.4 N. It is also known that this gas force is a function
of angle of the crankshaft; therefore it tends to change according to the crank angle.
Further, the torque on the output shaft is directly related to the tangential gear load. This
relation can be written as;
T = (Wt ) L/2 Equation 6
Where,
L is Stroke of the engine
T is Torque of the output shaft
Using the above equation, a further comparison between the gas force and relative
torque conversion at the output shaft for one full rotation (180º), was also known from
the experiments conducted my Mr. Tom Conner and Wiseman Inc. For this purpose it

16
was assumed that the gas force (Fg) was constant at 1 bar but this is not true in case of a
firing engine. It should also be noted that the Wiseman engine stroke is slightly longer at
28.575 mm than the stock engine at stroke at 28.296 mm.
The bore in both the stock and the Wiseman engine measured Ø36.450 mm in
diameter and the resulting cross-sectional area is 1043 mm2. Now by plugging in the
described values in the equation 3 and 4, the output torque was calculated an increments
of every five degrees of crank rotation. Using this procedure, the stock engine was known
to have a higher peak output torque by 1.9% even though it has a shorter stroke. This
meant that in a case where the stroke of both the engines were same, that is, 28.575 mm,
theoretically the peak output of the stock engine would be about 3% higher than that of
the Wiseman engine. Further, from the same experiment, it was known that the peak
output torque for the stock engine and the Wiseman engine occurred at 75º TDC and 90º
TDC respectively. The stock engine converted gas pressure to torque in a trend that is
more typical of a conventional slider-crank engine. The Wiseman engine produced more
torque than the stock engine after 85º even though the pressure from the combustion is
considerably reduced at this point.
Further the mechanical efficiency of the Wiseman engine was found out to be 0.606
or 60.6%. This was done by examining the results from past dynamometer tests
conducted at MTD Southwest, Inc. During those tests, it was found that at 7000 RPM the
Wiseman engine had a loss of 0.39 HP due to friction. Whereas the engine was designed
to generate 0.99 HP as peak power at 7000 RPM. All this information is crucial in
modeling the Wiseman engine using the LES software as it provides more realistic results
hence making it more accurate.

17
Chapter 3
SCOPE OF WORK
Prior to this research, extensive designing, development, testing and modifications
of the Wiseman engine were completed by the Wiseman Technologies Inc. and Mr.
Thomas Conner. The purpose of this research effort is to further evaluate and tune the
Wiseman engine according to the current industry standards to determine any necessary
modifications required to enhance the performance. The Wiseman engine was designed
on a platform of a 30 cc Homelite brand string trimmer engine. The data for the
unmodified (stock) 30 cc Homelite engine was also made available by WTI to be used as
an established benchmark. This data will be used to evaluate the performance against the
Wiseman engine. The particular Wiseman engine that is discussed in this paper was
previously studied for vibration testing and balancing, so these aspects of the engine
performance will not be focused on. Hence, it was assumed that the engine is perfectly
balanced prior to starting this research.
Modeling the 30 cc Wiseman Hypocycloid Engine
All the required engine parts to assemble a balanced Wiseman prototype were
made available by WTI to perform further testing. Since the Homelite engine acted as the
platform to build the Wiseman prototype, the prototype retains many of the original
Homelite engine’s components and dimensions. This similarity is further evident in the
side-by-side photo of both the engines seen in Figure 9.

18
Figure 9 - Wiseman (Left) and Stock Engine (Right)
Both the engines share the same carburetor, ignition system, flywheel/magneto,
exhaust/muffler, and the cylinder. The following table provides a summary of their
design specifications.
Engine Stroke Bore Ø Displacement
Wiseman Prototype 1.125 in
( 28.6 mm) 1.435 in
(36.5 mm) 1.819 in3 (29.81 cc)
Stock Homelite 1.114 in
(28.3 mm) 1.435 in
(36.5 mm) 1.802 in3 (29.53 cc)
Table 1 - Engine Specifications
The section view of the dynamic CAD model of the Wiseman engine, as seen in
Figure 10, shows the mechanical assembly of Wiseman engine for better visualization.
19
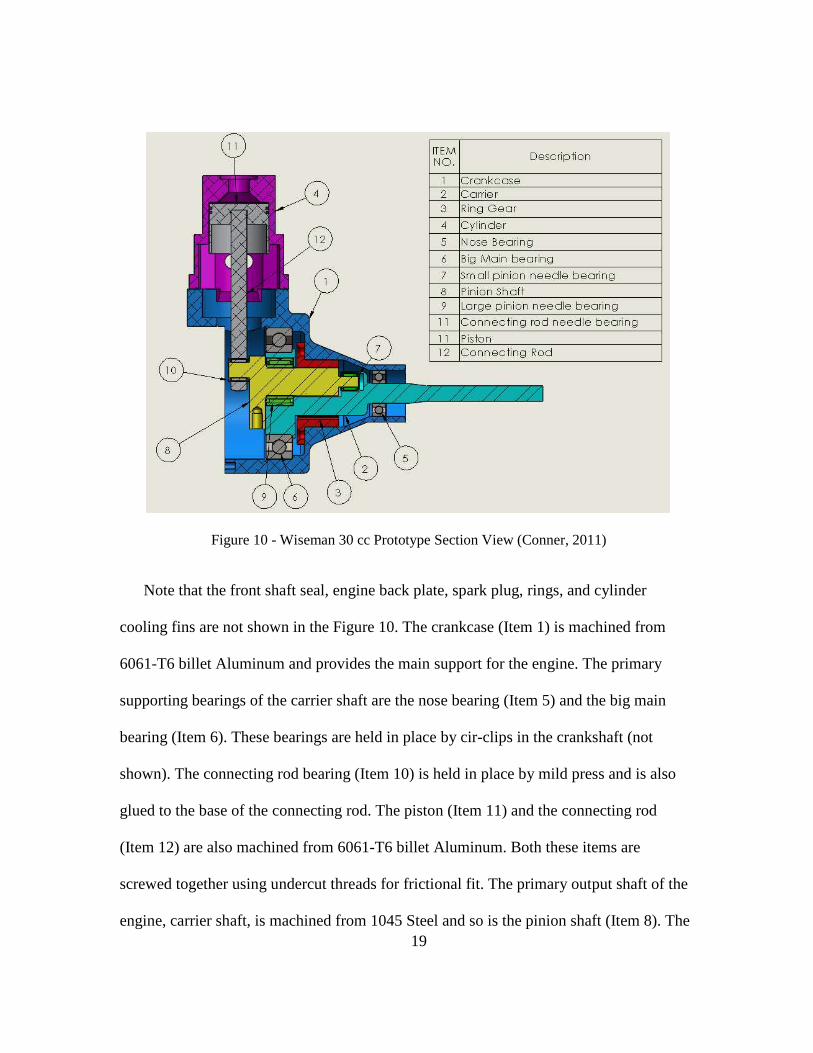
Figure 10 - Wiseman 30 cc Prototype Section View (Conner, 2011)
Note that the front shaft seal, engine back plate, spark plug, rings, and cylinder
cooling fins are not shown in the Figure 10. The crankcase (Item 1) is machined from
6061-T6 billet Aluminum and provides the main support for the engine. The primary
supporting bearings of the carrier shaft are the nose bearing (Item 5) and the big main
bearing (Item 6). These bearings are held in place by cir-clips in the crankshaft (not
shown). The connecting rod bearing (Item 10) is held in place by mild press and is also
glued to the base of the connecting rod. The piston (Item 11) and the connecting rod
(Item 12) are also machined from 6061-T6 billet Aluminum. Both these items are
screwed together using undercut threads for frictional fit. The primary output shaft of the
engine, carrier shaft, is machined from 1045 Steel and so is the pinion shaft (Item 8). The

20
pinion shaft plays multiple roles; it comprises of the external gear teeth, provides bearing
surface for the connecting rod and carrier shaft, and also acts as a counterweight. These
gear teeth mesh with the internal teeth of the ring gear (Item 3). This geared driveline can
be seen in Figure 11. The pitch diameter of the pinion shaft gear is 14.2875 mm (0.5625
in) and that of the ring gear is 28.575 mm (1.125 in). This gives a perfect 2:1 ratio
required for the hypocycloid motion.
The Following Figures provide different views of the Wiseman engine for one full
rotation at 90º increments, to depict the working of this mechanical assembly.
Figure 11 - Wiseman Driveline (Conner, 2011)

21
Figure 12 - (Left) Back View, Engine at 90º ATDC (Conner, 2011)
Figure 13 - (Right) Back View, Engine at BDC (Conner, 2011)
Once again, it can be noticed from Figures 12 and 13 that the connecting rod remains
vertical and the pinion shaft is both rotating and at the same time oscillating vertically.
Another observation that can be made is that the pinion shaft and the carrier shaft rotate
in the opposite direction but at the same speed. This means that the pinion shaft bearings
manage the loads at twice the speeds of the output shaft, and so is a very crucial
component of the engine.
Prior Tests by Wiseman Technologies Inc.
WTI mainly focused on the fuel efficiency as a measure of engine performance on
both, the stock engine and the Wiseman prototype. These tests were conducted on low

22
speeds of about 4000 RPM and at less than wide open throttle. The peak power speeds of
such engines are about 7000 RPM. WTI’s tests showed that the Wiseman engine could
achieve twice the fuel efficiency of the stock engine. Both the engines tested by WTI
were brand new so they had to be broken in. In order to do so, they ran both the engines
at 4000 RPM with 30:1 gas to oil ratio (2-cycle oil) for about 2 hours. They then changed
the fuel and oil to Shell High Test, and AMS synthetic oil with a new ratio of 100:1. For
a more systematic test procedure, they took the climate into consideration, and so both
the engines were tested on the same day under similar temperature and barometric
weather conditions. The test speed for the engines was set to 4050 RPM, and 20” X 6
wooden propeller was used as a load for both the engines. Once they attained stable
speeds the cylinder temperature (using thermocouples) and fuel consumption was
measured. A series of 6 minute long tests were conducted and the following results were
produced (Wiseman Technology, Inc.):
Engine Temperature (cylinder head)
Fuel Consumption Run-time
Stock Engine 310˚F 27.67 grams 6 minutes Wiseman Engine 320˚F 14.00 grams 6 minutes
Table 2 - Summary of Engine Tests Conducted by WTI
They noted that the Wiseman engine, while producing the same output power, ran
for virtually twice as long as the stock engine for the same amount of fuel. Based on this
time test, along with the fuel consumption measurements, WTI claimed that the Wiseman
engine was 50.5% more fuel efficient than the unmodified stock engine. They also noted
that the Wiseman engine ran much cooler than the stock engine.

23
Chapter 4
LOTUS ENGINE SIMULATION
Validating LES Results
LES software has the capability to investigate the performance of an internal
combustion engine and give predictions of engine output under various conditions. These
results can be fuel efficiency, power output, torque, and running temperature of the
engine over a period of time. LES allows the entire system to be built and simulated,
complete from engine intake to exhaust. This proves to be an economical and convenient
method to research and develop internal combustion engines. Since the LES software has
been extensively used for this research to predict the performance of the Wiseman
engine, it was important that the authenticity of the results generated by the software was
confirmed before drawing any conclusions. For the same purpose, a test engine with
known parameters and output was tested. The results from that test were then compared
to the results generated by modeling that engine in LES software. A small stand alone test
engine, manufactured by GUNT Hamburg was provided by the Arizona State University
(ASU) for that test procedure. The engine came connected to a test stand for single
cylinder engines which was also manufactured by GUNT Hamburg. The test stand was
equipped with an eddy current dynamometer which was connected to a computer that
recorded various output parameters of the engine during a running test. The results from
dynamometer test along with the engine specifications provided by the company were
then compared with the LES results. This test engine setup will be referred to as “GUNT
engine” from here on. Figure 14 shows the schematic of the methodology for the coming

24
tests. A speed vs. output torque tests were conducted on the GUNT engine and the results
were recorded. The test results were then compared to the engine output specification
provided by the manufacturer, which in turn were compared with the simulated results of
the engine system modeled in LES. This is to check how close the engine performance
results, generated by LES, are to the actual engine performance and those claimed by the
manufacturer. Once the relationship between the LES results and test results was
confirmed, the LES software was then used to analyze the performance of the Wiseman
engine and also to predict the performance of future Wiseman engine designs.
Figure 14 - Methodology to Validate LES Results

25
GUNT Engine Dynamometer Testing
Figure 15 - GUNT 1B30 Engine
The GUNT engine model 1B30 as seen in Figure 15 was used in conjunction with
the CT 110 test stand (not shown). It is a four stroke, single cylinder, air-cooled engine,
with direct injection that works on both, diesel and biodiesel fuel. The compression ratio
for this engine is 21.5 with a mean piston speed of 6.9 m/s. This is slightly higher than
the ideal compression ratio for small four-stroke compression-ignition engines. The
compression ratio of such engines generally ranges from 16-20. On the contrary, the bore
size of the GUNT engine is smaller than that of a similar sized engine, which is generally
75 to 100 mm (Ganesan, 2012). However, the GUNT engine has a bore diameter of 80
mm.
Some other technical specifications of the GUNT engine are;
Power Stroke Bore Ø Displacement
5.5 Kw @3500 RPM 69 mm 80 mm 347 cc
Table 3 - GUNT Engine Specifications

26
According the manufacturer the idling speed of this engine is around 800-1000
RPM and the peak power is generated between 3000-3500 RPM. Figure 16 shows the
performance curves of the GUNT engine, in terms of power output, torque, and brake
specific fuel consumption (BSFC), as claimed by the manufacturer.
Figure 16 - Manufacturer Provided Performance Curves of GUNT Engine
The GUNT engine is mounted on a base plate on the test stand and is coupled
with an electric motor via an elastic claw coupling. The electric motor provides force
transmission to brake via the elastic claw coupling and is also used to load the engine
during the dynamometer testing. The air cooling is provided by the means of blades that
are attached to the flywheel of the engine. In addition to all this, the engine comes fitted
with various sensors to measure, ignition cut-off, fuel supply, exhaust gas temperature
and speed.

27
Once various components and features of the GUNT engine were understood,
setting up the test equipment was fairly simple. Contrary to the claims by the
manufactures, the engine needed to be cranked at 2500 RPM and at wide open throttle. A
dynamometer test was conducted to get a torque vs. RPM curve. In order to do this, the
engine was kept at a constant throttle (WOT) and along with constant torque. The engine
was then loaded with different RPMs to see how the change was reflected in the torque
output. These points were then recorded to get a curve on a plot. The data collected from
these tests was then compared with that provided by the manufacturer. It was found to be
very similar to the specification sheet. The range of RPM that the engine was tested at
was 1500 to 3500. The engine was then modeled in the LES software to compare the
results from the software with that from the dynamometer test and manufacturer data.
GUNT LES Modeling
Once the GUNT engine was tested on the dynamometer, it was then modeled in the
LES software with all manufacturer specified parameters. Some crucial engine details
were not provided by the manufacturer like, the length of the connecting rod and the
intake and exhaust port diameters and their respective valve timings. These parameters
significantly affect the performance of the engine in terms of output torque and power.
In order to model the GUNT engine with the most accurate length of the connecting
rod, port diameters and valve timings, the lotus ‘concept tool’ was used. As seen in
Figure 17, the ‘concept tool’ requires the user to enter at least the following three
specifications:
• Engine RPM at maximum power

28
• Engine Swept volume (liters)
• And the number (no.) of cylinders.
Figure 17 - LES Concept Tool
Since the bore and stroke of the GUNT engine was known, those dimensions were
also included in the concept tool. The no. of inlet and exhaust valves was selected to be 1,
in accordance with the engine design. Also, since the mean piston speed plays a vital role
in connecting rod design, the RPM at max power was selected to be 3000 instead of 3500
in order to achieve the known mean piston speed of 6.9 m/s, and further aid the concept
tool to make better predictions. Once these parameters are entered, the LES allows the
user to select the intake and exhaust systems for this engine. A common plenum junction
29
intake and exhaust systems were selected to compliment the single cylinder direct
injected design of the engine. It was found that the appropriate connecting rod length for
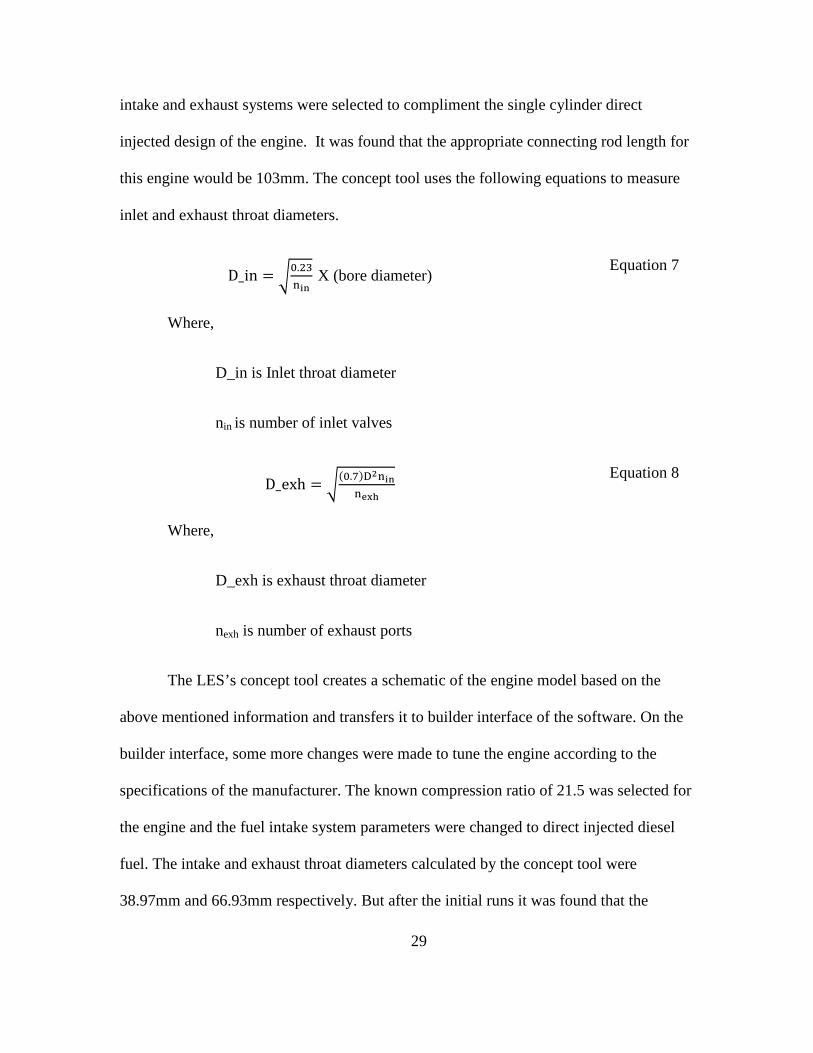
this engine would be 103mm. The concept tool uses the following equations to measure
inlet and exhaust throat diameters.
D_in � ��.����� X (bore diameter)
Equation 7
Where,
D_in is Inlet throat diameter
nin is number of inlet valves
D_exh � ���.!�"#����$%&
Equation 8
Where,
D_exh is exhaust throat diameter
nexh is number of exhaust ports
The LES’s concept tool creates a schematic of the engine model based on the
above mentioned information and transfers it to builder interface of the software. On the
builder interface, some more changes were made to tune the engine according to the
specifications of the manufacturer. The known compression ratio of 21.5 was selected for
the engine and the fuel intake system parameters were changed to direct injected diesel
fuel. The intake and exhaust throat diameters calculated by the concept tool were
38.97mm and 66.93mm respectively. But after the initial runs it was found that the

30
engine provided higher torque than specified by the manufacturer but the volumetric
efficiency of the engine was lower. In order to correct this, the intake and exhaust valve
throat diameters were changed to 19mm and along with the port valve timings. LES
software provides five different valve types as default valve options. The valves in the
GUNT engine are controlled by tappets and pushrods, which is very similar to the poppet
valve option in the software. Further the dwell time and the valve opening and closing
time were tuned to achieve the desired power and torque output. The LES software has
two default polynomial lift curves for a popper valve which is fast or slow lift. According
to Lotus Engineering, each polynomial is designed to have four coefficients (such that
their sum is -1) and their corresponding exponents. A slow lift poppet valve was found to
be the most suiting for the GUNT engine in terms of the output.
The LES software allows the users to choose port flow coefficient curves for inlet
or exhaust port as well. It gives an option of either poor or good port flow coefficients.
These coefficients are a function of valve throat to bore area ratio obtained from the lotus
port flow database. They are a ratio of each valve lift and throat diameter (L/D) and are
summarized in the form of contour maps as shown in Figure 18 and Figure 19. Every
calculated ratio of valve throat to bore area in each simulation is interpolated or
extrapolated to either a good or poor port flow characteristic (Copyright Lotus
Engineering, 2001). The simulation for GUNT was tried with each option along with an
intermediate option of 0.3 L/D and it was noticed that the performance was not affected
significantly.

31
Figure 18 - Inlet Port Flow Coefficient Curves used by LES
Figure 19 - Exhaust Port Flow Coefficient Curves used by LES
NOTE: No separate port flow analysis was carried out but instead default coefficient
calculations from the port flow tool were used.
Intake Exhaust Angle (deg) 10 10
Valve open (deg) 49 76 Valve close (deg) 74 39
MOP (deg) 102.48 -108.52 Table 4 - Intake and Exhaust Port Timings for GUNT Engine (Diesel)
32
Since this was a single cylinder direct injected engine with one intake and exhaust
port, the intake and exhaust plenum volumes were chosen to be the same as the cylinder
displacement volume.
• Combustion model
The program is designed such that, the heat released during the combustion is
assumed to be heating the whole combustion space. This is because the LES software
implements a single zone heat release model. “The main implication of this assumption is
that the bulk gas temperature is generally lower than the core combusted gas temperature
behind the flame front” (Copyright Lotus Engineering, 2001). Further, Lotus claims that
this might have an influence on the detailed in-cylinder heat transfer but, since the
theoretical heat models make gross assumptions for heat transfer coefficients and wall
temperatures, the discrepancies are minimal. The GUNT combustion model was chosen
to be a two part Wiebe function which is more suitable for a direct injected diesel engine.
Another benefit of using this function is that it is based on combustion duration and so by
manipulating the combustion duration of a specific engine, a more realistic heat release
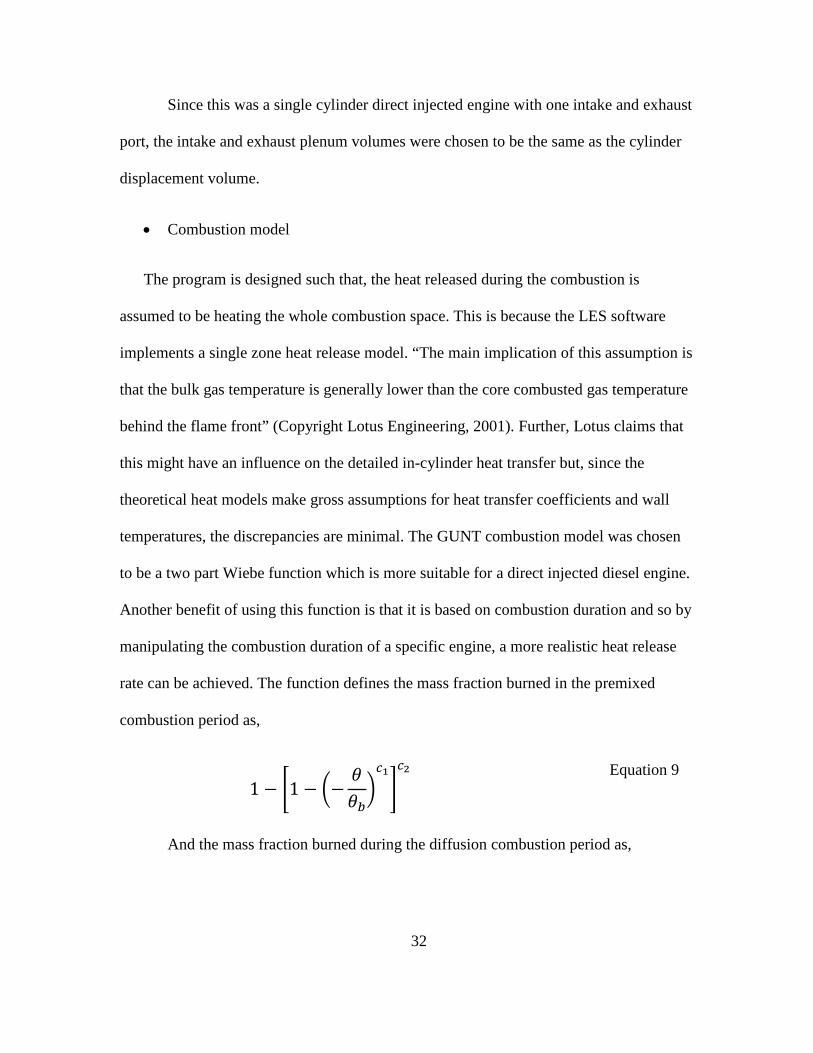
rate can be achieved. The function defines the mass fraction burned in the premixed
combustion period as,
1 � (1 � �� ))��*+,
*#
Equation 9
And the mass fraction burned during the diffusion combustion period as,

33
1 � exp /0� 1/213/2�45+
Equation 10
Therefore, mfrac = 6[pre-mixed] + (1-6)[Diffusion].
Where,
A = A coefficient in Wiebe equation = 6.9
M = M coefficient in the Wiebe equation = 0.4
C1 = “cp1” coefficient in Watson & Pilley equation = 2.0
C2 = “cp2” coefficient in Watson & Pilley equation = 5500
6 = fraction of premixed combustion to total combustion = 0.05
7 = delay angle between premised and diffusion combustion = 0.0
) = actual burn angle (after start of combustion), and
)� = total burn angle (0-100% burn duration) (approx. calculated to be
102.621 degrees).
NOTE: currently there are no defaults available for a two part heat release equations but
the values stated above are typical values for the constants in a turbocharged direct
injection diesel engine.
• Cylinder Heat Transfer

34
The heat exchange in the cylinder gases is calculated at each crank angle bases on the
wall area, its temperature and the surface heat transfer coefficient. The total cylinder wall
area can be calculated using the head and bore dimensions of the engine and the
instantaneous liner area is based on the sum of piston clearance and piston location from
the TDC at every crank angle. For the wall temperatures, the software assumes certain
head flame face thickness (0.13 x Bore) and liner thickness (0.07 x Bore). For the GUNT
engine, the head flame face thickness was calculated to be 10.4mm and the liner
thickness was 5.6 mm. Some other assumptions made by the LES software are:
• Thermal conductivity of Aluminum as 150 (W/m/K)
• Coolant temperature to be 100o C and its connective heat transfer coefficient as
10000 W/m2/K for the cylinder head and 8000 W/m2/K for the liner
• The heat transfer rate of the liner wall temperature is assumed to be 44% of that of
cylinder head for convenience
• The cylinder head temperature is calculated as an average of wall temperature and
valve temperature.
• piston head temperature as an area averaged cylinder head temperature
• For diesel engines, it assumes the valve temperatures based on the air fuel ratio
(AFR)
o -4.1 AFR + 504.2 o C (inlet valve)
o -4.2 AFR + 663.0 o C (exhaust valve)
LES software provides the three options for in-cylinder heat transfer models in both
open and closed period; Annad, Woschni and Eichelberg. All the models generate values

35
for convective heat transfer coefficient in all the cylinders. For the GUNT engine,
Eichelberg heat transfer model was used due to its ease of tuning.
8 � 9 : ;�<=>?@� �.�� �A. B� C
Equation 11
Where,
h=heat transfer coefficient
A = Eichelberg open or close cycle A coefficient (2.43)
B = Eichelberg open or close cycle B coefficient (0.50)
;DPiston = mean piston speed
p = cylinder pressure
T = cylinder temperature.
Once all the proper adjustments and selections were made, the modeled engine was
simulated and the results were tabulated and charted. The finished LES model for the
GUNT engine can be seen in Figure 20.

36
Figure 20 - LES GUNT Model (Diesel)
But before the simulated results can be compared with the dynamometer results
and that performance claims of the manufacturer, it was important that the software
results are adjusted for the mechanical friction in the engine. The actual GUNT engine is
motored by an asynchronous electric motor, manufactured by Alda Antriebstechnik
whose mechanical efficiency was found to be 87%. Therefore, the torque results from the
software simulation were multiplied by 0.87 so a more realistic data is generated which is
adjusted for the motoring losses of the engine. Figure 21 shows the final output results
and their comparison.
37
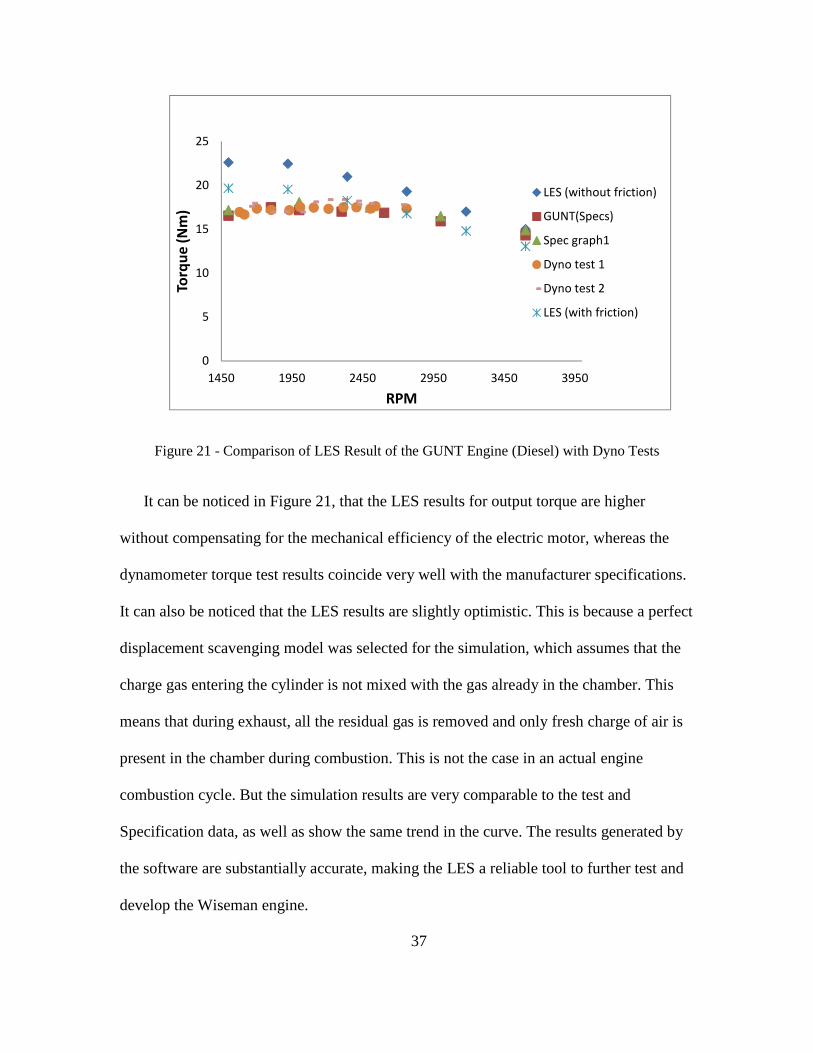
Figure 21 - Comparison of LES Result of the GUNT Engine (Diesel) with Dyno Tests
It can be noticed in Figure 21, that the LES results for output torque are higher
without compensating for the mechanical efficiency of the electric motor, whereas the
dynamometer torque test results coincide very well with the manufacturer specifications.
It can also be noticed that the LES results are slightly optimistic. This is because a perfect
displacement scavenging model was selected for the simulation, which assumes that the
charge gas entering the cylinder is not mixed with the gas already in the chamber. This
means that during exhaust, all the residual gas is removed and only fresh charge of air is
present in the chamber during combustion. This is not the case in an actual engine
combustion cycle. But the simulation results are very comparable to the test and
Specification data, as well as show the same trend in the curve. The results generated by
the software are substantially accurate, making the LES a reliable tool to further test and
develop the Wiseman engine.
0
5
10
15
20
25
1450 1950 2450 2950 3450 3950
Torq
ue
(N
m)
RPM
LES (without friction)
GUNT(Specs)
Spec graph1
Dyno test 1
Dyno test 2
LES (with friction)

38
Wiseman LES (Two Stroke)
Once again a similar process was followed in modeling the two stroke Wiseman
hypocycloid engine in the LES software. The Wiseman prototype is much simpler in
design than the GUNT engine, so modeling it in the LES software was easier. It is a
single cylinder spark ignited configuration and the cylinder dimensions like bore, stroke,
connecting rod length, compression ratio and displacement volume was provided by
WTI. An intake disc valve was used in addition to variable volume inlet plenum.
Wiseman engine has piston ported intake and exhaust valves as the engine intake and
exhaust. The Wiseman engine runs on gasoline and has a spark ignited carbureted fuel
system. The intake and exhaust port on the piston chamber were measured from the
actual piston ports of the engine and were found to be as following;
Intake Exhaust Port width (mm) 40 20.82
Max. Port Height (mm) 2 7.41 Valve Open (deg) 124 108 Table 5 - Wiseman LES Port Data
The intake and exhaust pipe geometry was assumed to be simple tubes with
approximate dimensions of the carburetor nozzle, at wide open position. A single Wiebe
combustion model is used in the modeling of the Wiseman engine since that is more
suitable for such engines. According to Lotus engineering, the single Wiebe function
defines the mass fraction burned as;
1 � exp /0� 113�45+
Equation 12
Where,
39
The Wiebe coefficients A and M for gasoline are 10.0 and 2.0 respectively.
A more simpler, Annad heat transfer model was used for the Wiseman engine which
was given by;
8EF � 9GHC
Equation 13
Where,
h = heat transfer coefficient
A and B = Annand open or close cycle coefficients
K = thermal conductivity of gas in the cylinder
D = cylinder bore diameter
Re = Reynolds number based on the means piston speed and engine bore.
The A and B coefficients for a carbureted or a port injected combustion system is 0.2
and 0.8 respectively.
Modeling the Hypocycloid Piston Motion
A major assumption the LES software makes is that the engine uses the slider-crank
mechanism and so the results calculated are according to the piston motion of a
conventional slider-crank mechanism. For the Wiseman engine, the most important
aspect of the design was the hypocycloidal piston motion as a result of its unique
mechanical assembly. For such special cases, the LES software has a provision to run
user specific subroutines while simulating the piston motions during the tests. To find the
40
equation of the piston motion of the Wiseman engine and the volume above the piston at
every crank angle, the following calculations were carried out.
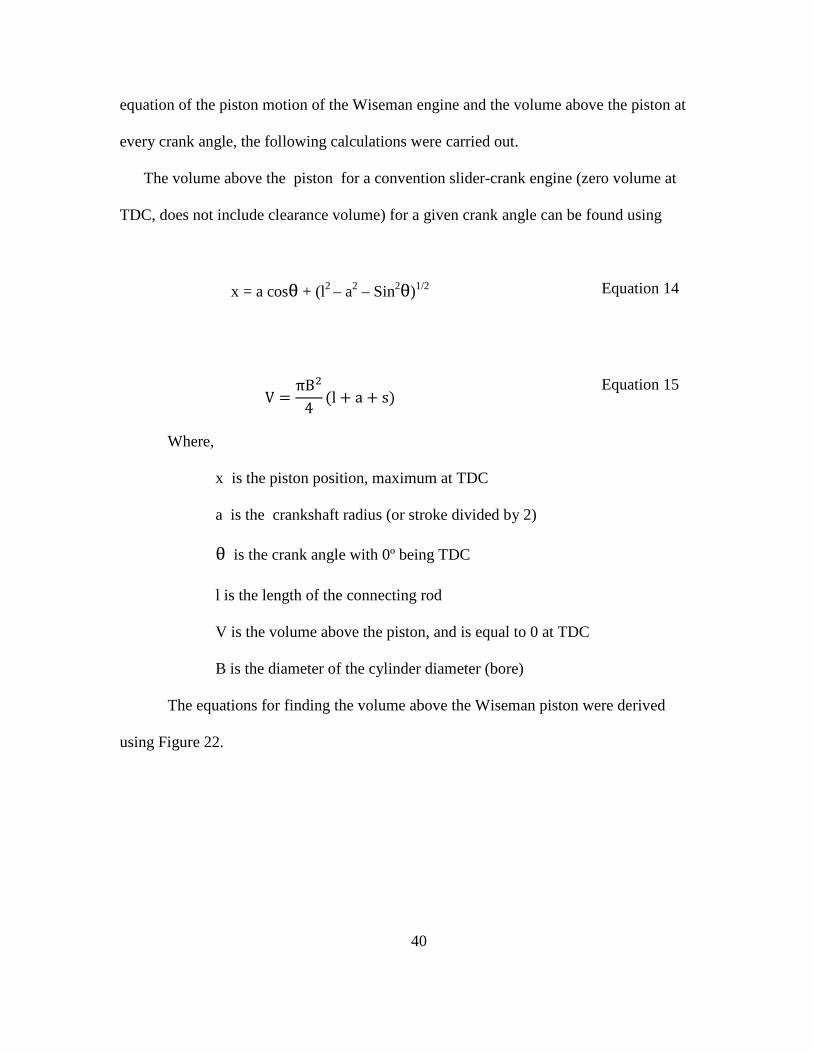
The volume above the piston for a convention slider-crank engine (zero volume at
TDC, does not include clearance volume) for a given crank angle can be found using
x = a cosθ + (l2 – a2 – Sin2θ)1/2 Equation 14
V � πB�4 �l a s�
Equation 15
Where,
x is the piston position, maximum at TDC
a is the crankshaft radius (or stroke divided by 2)
θ is the crank angle with 0º being TDC
l is the length of the connecting rod
V is the volume above the piston, and is equal to 0 at TDC
B is the diameter of the cylinder diameter (bore)
The equations for finding the volume above the Wiseman piston were derived
using Figure 22.

41
Figure 22 - Wiseman (Hypocycloid) Piston Position Diagram
The distance P or the piston position relative to TDC and the volume above the
piston is given by,
P � L2 � �L
2 cos θ� Equation 16
VR � P SπB�4 T
Equation 17
Where,
L is the stroke of the engine.
θ is the crank angle with 0o being TDC.
42
VR is the volume above piston, TDC being 0.
B is the diameter of the cylinder (bore)
P is the position of the piston with the origin being TDC.
From previous research it was known the volume of the Wiseman engine at each
crank angle is lower than that of the stock engine because its piston sits higher than the
stock engine. This provides less combustion volume at each crank angle.
In order to simulate the engine results using the hypocycloid motion, the .DLL file
that the software uses to simulate and compile the results was modified. There were
subroutines coded within the original .DLL using FORTRAN so switching between the
convention slider-crank and the hypocycloid piston motion could be done with ease. The
new equations of the piston motions of both the type of engines were changed according
to the equations mentioned above.
To verify that the modified code accurately simulated the hypocycloid piston motion,
the crank angle, piston speed and position were recorded using virtual sensors attached to
the engine cylinder block in LES software. This data was then plotted with respect to
time and the difference in curves was studied as seen in Figures 23 and Figure 24. The
plots clearly indicate that the modified LES software subroutine simulated engine
performance using the hypocycloid piston motion and not a conventional slider-crank
piston motion.

43
Figure 23 - Comparison of Time Vs Piston Speed of Slider-crank and Wiseman Engine
Figure 24 - Comparison of Time Vs Displacement Vol. of Slider-crank and Wiseman Engine
It can be noticed in Figure 24 that the piston motion for a slider-crank engine does not
trace a perfect cosine-time curve where as the hypocycloid piston motion syncs perfectly
-3.0E-06
-2.0E-06
-1.0E-06
0.0E+00
1.0E-06
2.0E-06
3.0E-06
1
11
2
22
3
33
4
44
5
55
6
66
7
77
8
88
9
10
00
11
11
12
22
13
33
14
44
15
55
16
66
17
77
18
88
19
99
21
10
22
21
23
32
24
43
25
54
26
65
27
76
28
87
Time Vs Piston Velocity
SC Velocity WE Velocity
0.0E+00
5.0E-05
1.0E-04
1.5E-04
2.0E-04
2.5E-04
3.0E-04
3.5E-04
4.0E-04
4.5E-04
5.0E-04
-5.00E-02 0.00E+00 5.00E-02 1.00E-01 1.50E-01 2.00E-01 2.50E-01 3.00E-01
Dis
pla
cem
en
t
Time (S)
Time Vs Displacement
Slider crank
Displacement
Wiseman
Displacement

44
with the cosine curve. There is nonlinearity in the slider-crank mechanism and so the
piston motion is not a harmonic function.
Figure 25 - 2 Stroke Wiseman LES Model
Once the all the required data was entered for each component of the a two stroke
model (Figure 25), a speed test was simulated to generate the output data in terms of
torque, BSFC and power with respect to the engine RPM. The typical RPM range for a
single cylinder spark ignited engine with the size that of Wiseman’s is 4500 to 7500 RPM
(Ganesan, 2012). Therefore, the model was tested for RPMs ranging from 1000 to 8000.
As established earlier, the Wiseman engine has a mechanical efficiency of 0.606 which
was also entered for each test point to make sure the simulation at every RPM takes the
mechanical efficiency into consideration.
Brake Power and Torque Comparison
During previous research, a dynamometer test was conducted on the Wiseman engine
at MTD Southwest Inc. along with a small engine of the same size. The results of that
study are summarized in Table 6 (Conner, 2011).

45
Engine Peak Power BSFC
MTD Engine (31 cc) 0.96 HP @ 7000 RPM 410.08 g/hp*hr
Wiseman Engine 0.60 HP @ 6000 RPM 520.06 g/hp*hr
Table 6 - Wiseman Dynamometer Test Summary
From extrapolating the results of the Wiseman engine, they predicted that the engine
looses 0.39 HP due to friction. This meant that the Wiseman engine has about 5% higher
loss in power than a stock engine of the same size at 7000 RPM.
The software model of the Wiseman engine was simulated using both the piston
motion subroutines mentioned earlier. This data was then compared to the dynamometer
test results to determine how accurate the LES software predictions are, compared to an
actual dynamometer test. The results can be seen on the following plot.
Figure 26 - LES Results of Wiseman and Slider-crank Engine for Brake Power
As seen in Figure 26, the results from the LES software show a very similar trend as
the previous dynamometer tests. According to the software results, the Wiseman engine
0.06
0.14
0.25
0.36
0.47
0.62
0.710.77
0.06
0.15
0.27
0.38
0.5
0.66
0.770.83
0
0.1
0.2
0.3
0.4
0.5
0.6
0.7
0.8
0.9
1000 2000 3000 4000 5000 6000 7000 8000
Po
we
r (K
W)
RPM
Brake Power Comparison
Wiseman
Slider Crank
46
at 6000 RPM produces slightly less power than the slider-crank engine, which was also
the case during the dynamometer test. According to the LES software results, the
Wiseman power output at 6000 RPM is 0.62 KW (0.83 HP) and the slider-crank produces
0.66 KW (0.89 HP). The software generated power output at peak RPM of the Wiseman
engine is much closer to the theoretically claimed performance of 0.99 HP.
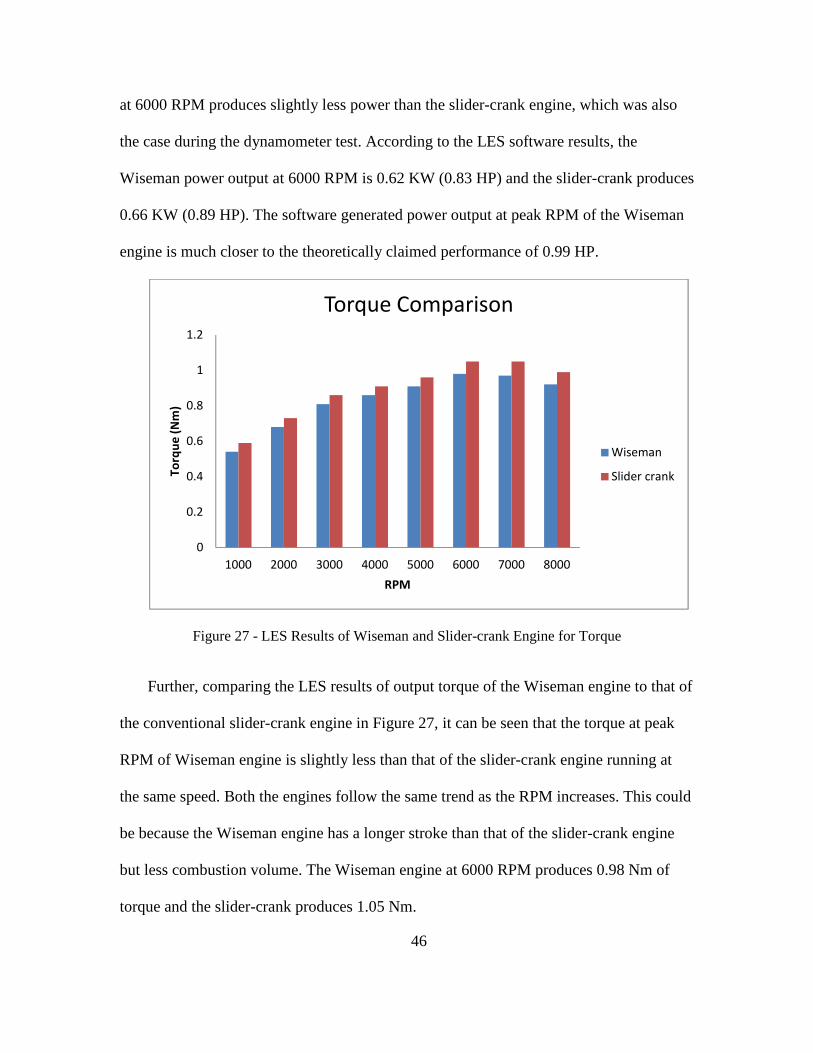
Figure 27 - LES Results of Wiseman and Slider-crank Engine for Torque
Further, comparing the LES results of output torque of the Wiseman engine to that of
the conventional slider-crank engine in Figure 27, it can be seen that the torque at peak
RPM of Wiseman engine is slightly less than that of the slider-crank engine running at
the same speed. Both the engines follow the same trend as the RPM increases. This could
be because the Wiseman engine has a longer stroke than that of the slider-crank engine
but less combustion volume. The Wiseman engine at 6000 RPM produces 0.98 Nm of
torque and the slider-crank produces 1.05 Nm.
0
0.2
0.4
0.6
0.8
1
1.2
1000 2000 3000 4000 5000 6000 7000 8000
To
rqu
e (
Nm
)
RPM
Torque Comparison
Wiseman
Slider crank

47
Brake Specific Fuel Consumption (BSFC) Comparison
According to the dynamometer tests conducted in the past, the Wiseman engine
proved to be 21 % less efficient compared to a slider-crank engine in terms of BSFC at
6000 RPM. As mentioned earlier the Wiseman Inc. claimed that the Wiseman engine
showed results of 140 grams/hp*hr in their fuel consumption tests. From the LES results
shown in Figure 28, it can be noted that the Wiseman engine at 6000 RPM resulted in a
BSFC of 840.42 g/hp*hr and the slider-crank 795.5 g/hp*hr. This shows that the
Wiseman engine is about 6% less fuel efficient than the slider-crank engine. The trend in
the Wiseman engine having a higher BSFC is still agreeing with the results from the
dynamometer tests. BSFC comparison with varying RPM speeds from software results
can be seen in the chart below and the Wiseman engine at almost every RPM has higher
fuel consumption than the slider-crank engine.
Figure 28 - LES Results of Wiseman and Slider-crank Engine for BSFC
600
650
700
750
800
850
900
1000 2000 3000 4000 5000 6000 7000 8000
BS
FC
RPM
BSFC Comparison
Wiseman
Slider crank
48
Chapter 5
MULTI-FUEL ANALYSIS OF WISEMAN ENGINE
Considering the choice of combustible fuels available now, it was thought
worthwhile to explore multi-fuel variants of the Wiseman engine. A multi-fuel engine is a
type of engine that can work on a variety of fuels with insignificant impact on
performance and efficiency. There have been slider-crank engines known to run on diesel
oil, crude oil, gasoline, JP-4, kerosene, ethanol and even lubricating oil. Such engines
have been popular during military operations due to the unpredictable nature of
emergencies where no specific fuel type is guaranteed to be available. Diesel engines,
due to their high compression ratio, are more compatible to run on a variety of heavy
fuels without any major modifications. A properly designed multi-fuel engine has to have
good combustion efficiency at different loads and speeds while operating in sub-zero
temperatures. It is also required to have low noise, low exhaust smoke and low
vibrations, and must not misfire depending on the type of the fuel being used. In order to
meet these requirements, some of the design features that a multi-fuel engine needs to
incorporate are (Mathur & Sharma, 1997, p. 25):
• High compression ratio to ensure complete combustion of any fuel that it runs
on
• Large stroke/bore ratio in order to maintain high temperatures in the
combustion chamber
• A reliable fuel delivery system

49
There are some existing engine types which are suitable as multi-fuel engines but one
such engine concept that is of interest to design a multi-fuel variant of the existing
Wiseman engine is a variable compression ratio (VCR) engine. Since different fuels have
different calorific values, they ignite at different pressures and temperatures. Hence, by
providing a feature to change the compression ratio of the engine at which the fuel
combusts, the range of fuels that can be used in the engine can be increased.
A VCR engine has primarily seen success in the form of a compression ignited diesel
engine rather than a spark ignited engine since the later tends to knock during the
lowering of the compression ratio. The change in compression ratio in such engines can
be achieved by changing the clearance volume and the swept volume or just the clearance
volume alone. A test engine produced by Coordinating Fuel Research Committee, the
CFR engine, provides the facility to change the compression ratio by changing the height
between the crankshaft axis and the cylinder head (changing the clearance volume). This
is done by the means of fine screw-threaded mechanism which allows the cylinder head
to be raised or lowered (Mathur & Sharma, 1997, p. 25). A similar design is proposed by
the Wiseman Inc., using a contra piston, which will be investigated later in this chapter.
30 cc Wiseman Engine Running on Diesel (Four Stroke)
To begin exploring the performance of the Wiseman engine operating on different
fuels, an approach similar to the VCR engine mechanism was undertaken. The existing
30 cc two stroke Wiseman engine was theoretically modified into a 30 cc four stroke
diesel engine. This engine was modeled in the LES software and had identical parameters
of original Wiseman engine like bore and stroke dimensions, swept volume, and

50
connecting rod length. The two major changes were the compression ratio, which was
changed from 8:1 to 17:1, and the fuel delivery system was changed to direct injection
instead of carbureted. This engine was simulated under the same test conditions as the as
original gasoline Wiseman engine so the results can be compared with it as well as the
slider-crank engine. A comparison of power output, torque and BSFC was carried out for
the same RPM range on each engine.
Figure 29 – Power Comparison of Wiseman Diesel, Gas and a Conventional Gas Engines
0
0.1
0.2
0.3
0.4
0.5
0.6
0.7
0.8
1000 2000 3000 4000 5000 6000 7000
Po
we
r (K
W)
Speed (RPM)
Speed vs Power
WE 30cc 4s (Diesel)
WE 30cc 2s (gas)
SC 30cc 2s (gas)

51
Figure 30 – Torque Comparison of Wiseman Diesel, Gas and Conventional Gas Engines
Figure 31 - BSFC Comparison of Wiseman Diesel, Gas and Conventional Gas Engines
From the plotted data, it can be noticed that the Wiseman four stroke diesel
engine performs better than the Wiseman two stroke engine (using gasoline) and the
0
0.2
0.4
0.6
0.8
1
1.2
1000 2000 3000 4000 5000 6000 7000
To
rqu
e (
Nm
)
Speed (RPM)
Speed vs Torque
WE 30 cc 4s (Diesel)
WE 30cc 2s (gas)
SC 30cc 2s (gas)
0
100
200
300
400
500
600
700
800
900
1000 2000 3000 4000 5000 6000 7000
BS
FC
(g
/KW
/hr)
Speed (RPM)
Speed vs BSFC
WE 30cc 4s (Diesel)
WE 30cc 2s (gas)
SC 30cc 2s (gas)

52
convention two stroke slider-crank engine (using gasoline) in terms of power (Figure 29),
torque (Figure 30) and fuel consumption (BSFC) at peak RPMs (Figure 31). The reason
for the four stroke diesel engine to perform better than its two stroke counterparts is
because a two stroke engine tends to have lower volumetric efficiencies and a part of the
fresh air fuel mixture is lost from the exhaust ports. This results in higher fuel
consumption in two stroke engines. The proper utilization of the air in the four stroke
engine also results in the increased power output. The two stroke engines also have a
lower effective compression since some of the piston stroke is lost due to the provision of
ports in the combustion chamber (Ganesan, 2012, p. 638).
Engine Power (KW) Torque (Nm) BSFC (g/KW/hr)
Wiseman 2 stroke (gas) 0.71 0.97 845.08
Wiseman 4 stroke (diesel) 0.76 1.03 319.62
Slider-crank 2 stroke (gas) 0.77 1.05 796.2
Table 7 - Performance Summary at the Peak Speed of 7000 RPM
30 cc Wiseman Engine with Contra Piston
The Wiseman engine is known to have more combustion time at the TDC since it
follows a linear sinusoidal piston motion which results in increased energy transfer. Due
to this, the Wiseman Inc. decided to further enhance the engine platform by announcing a
variable compression Wiseman UAV engine (referred to as the Wiseman UAV engine
from here on). They propose using an adjustable contra piston which is incorporated in
the existing combustion chamber, hence making the bottom face of the contra piston as
the top of the combustion chamber. The proposed design has a modified cylinder head
with a bolt on top (Figure 32 (c)) to control the distance travelled by the contra piston in
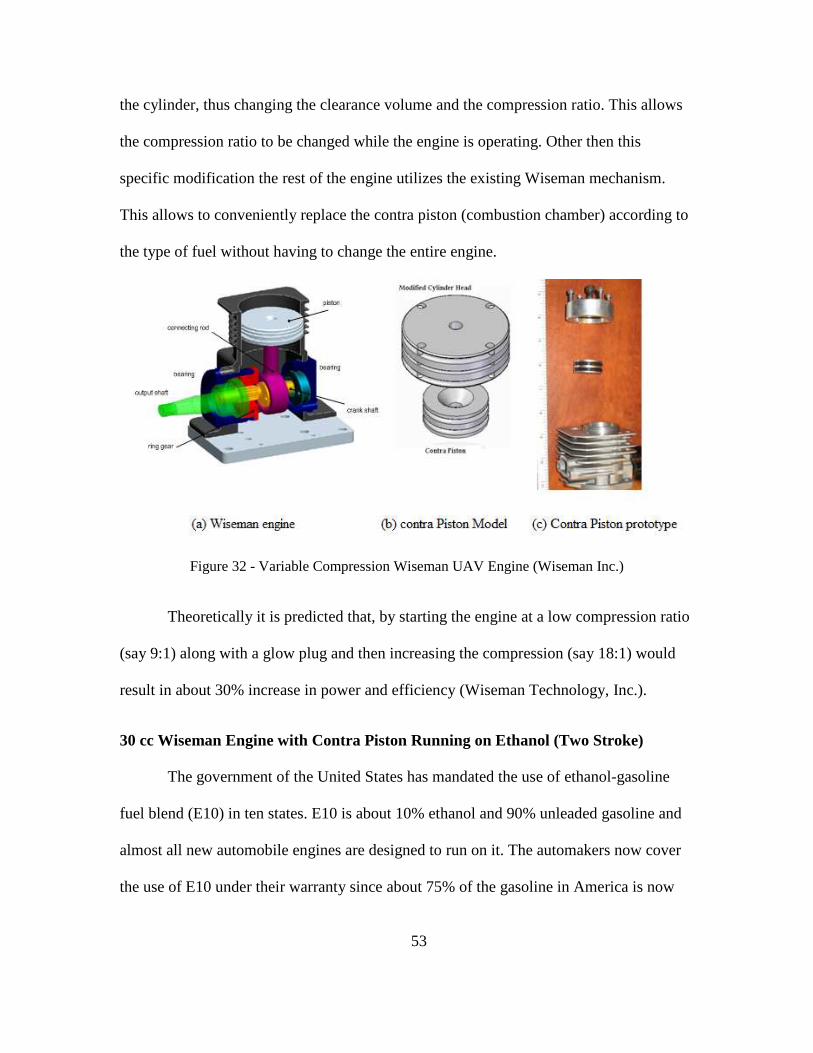
53
the cylinder, thus changing the clearance volume and the compression ratio. This allows
the compression ratio to be changed while the engine is operating. Other then this
specific modification the rest of the engine utilizes the existing Wiseman mechanism.
This allows to conveniently replace the contra piston (combustion chamber) according to
the type of fuel without having to change the entire engine.
Figure 32 - Variable Compression Wiseman UAV Engine (Wiseman Inc.)
Theoretically it is predicted that, by starting the engine at a low compression ratio
(say 9:1) along with a glow plug and then increasing the compression (say 18:1) would
result in about 30% increase in power and efficiency (Wiseman Technology, Inc.).
30 cc Wiseman Engine with Contra Piston Running on Ethanol (Two Stroke)
The government of the United States has mandated the use of ethanol-gasoline
fuel blend (E10) in ten states. E10 is about 10% ethanol and 90% unleaded gasoline and
almost all new automobile engines are designed to run on it. The automakers now cover
the use of E10 under their warranty since about 75% of the gasoline in America is now

54
blended with ethanol. Another popular fuel blend is E85, which consists of 85% ethanol
and 15% gasoline. This blend is also known as flex-fuel and many new engines are now
being designed to operate on E85. It has a higher octane rating than gasoline and is
believed to produce more power. Ethanol when used as a fuel is known to have an anti-
knock performance by allowing the engine to run at a higher compression ratios as
compared to pure gasoline engines. Though, the ethanol engines tend to have a higher
BSFC since it has a lower calorific value than gasoline. This means the engine running on
ethanol consumes more fuel as compared to gasoline, to generate the same amount of
power and torque output (Costa & Sodre, 2010).
To further analyze the performance of the Wiseman UAV engine using a contra
piston, the software model of the current two stroke Wiseman engine was modified
accordingly and simulated. To test the performance of the engine while operating on
ethanol, the properties of E85 were considered. The only changes made to the engine
model were the fuel properties and the compression ratio. Studies show that SI engines
running on ethanol blend tend to perform better at a compression ratio of about 12:1
(Costa & Sodre, 2010). All other engine parameters in the LES software model were kept
the same as the original, to determine how the Wiseman UAV engine with contra piston
would perform in case only the compression ratio was changed with respect to the fuel
type.
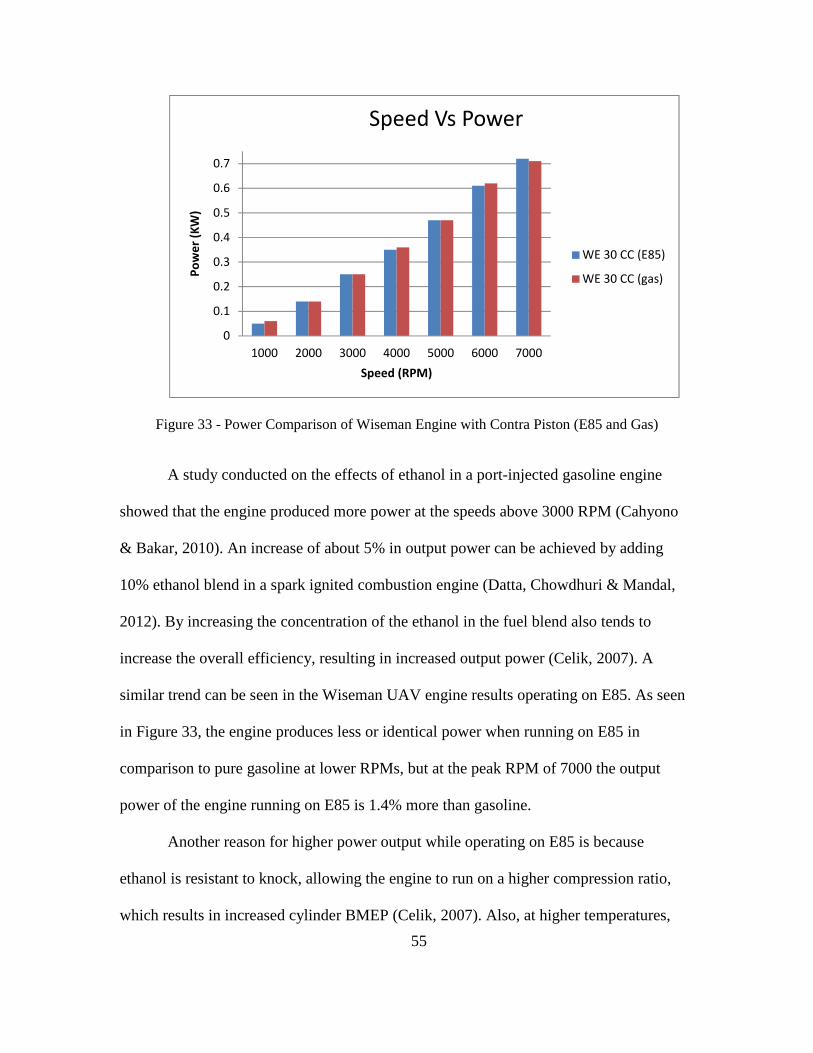
55
Figure 33 - Power Comparison of Wiseman Engine with Contra Piston (E85 and Gas)
A study conducted on the effects of ethanol in a port-injected gasoline engine
showed that the engine produced more power at the speeds above 3000 RPM (Cahyono
& Bakar, 2010). An increase of about 5% in output power can be achieved by adding
10% ethanol blend in a spark ignited combustion engine (Datta, Chowdhuri & Mandal,
2012). By increasing the concentration of the ethanol in the fuel blend also tends to
increase the overall efficiency, resulting in increased output power (Celik, 2007). A
similar trend can be seen in the Wiseman UAV engine results operating on E85. As seen
in Figure 33, the engine produces less or identical power when running on E85 in
comparison to pure gasoline at lower RPMs, but at the peak RPM of 7000 the output
power of the engine running on E85 is 1.4% more than gasoline.
Another reason for higher power output while operating on E85 is because
ethanol is resistant to knock, allowing the engine to run on a higher compression ratio,
which results in increased cylinder BMEP (Celik, 2007). Also, at higher temperatures,
0
0.1
0.2
0.3
0.4
0.5
0.6
0.7
1000 2000 3000 4000 5000 6000 7000
Po
we
r (K
W)
Speed (RPM)
Speed Vs Power
WE 30 CC (E85)
WE 30 CC (gas)

56
ethanol has a better thermal efficiency than gasoline since it has a higher heat of
vaporization. This means that when the compression ratio is increased, it burns a richer
mixture of air-fuel compared to gasoline, resulting in a higher output power (Costa &
Sodre, 2010).
Figure 34 - Torque Comparison of Wiseman Engine with Contra Piston (E85 and Gas)
As seen in Figure 34, the comparison of torque generated by the Wiseman UAV
engine while operating on E85 and gasoline shows that the engine produces slightly more
torque when operating on E85. The reason behind this is that when the engine is running
on E85, it prepares a rich air-fuel mixture increasing the air-fuel equivalence ratio. This
means that the fuel burns closer to stoichiometric causing a better combustion (Topgul,
Yucesu, Cinar & Koca, 2006). Though, from the simulated results it was noticed that the
increase in torque was only achieved at the peak RPM and the difference was not
significant. This is because at lower RPMs, the high calorific value of gasoline results in
0
0.1
0.2
0.3
0.4
0.5
0.6
0.7
0.8
0.9
1
1000 2000 3000 4000 5000 6000 7000
To
rqu
e (
Nm
)
Speed (RPM)
Speed Vs Torque
WE 30 CC (E85)
WE 30 CC (gas)
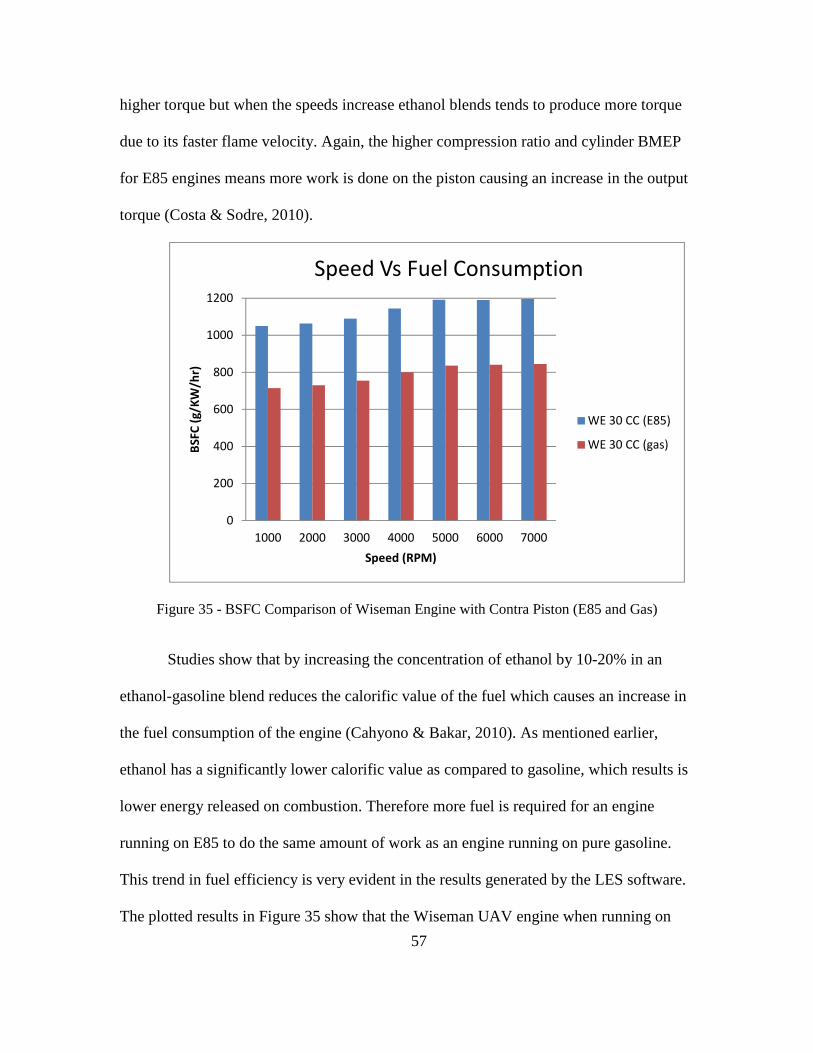
57
higher torque but when the speeds increase ethanol blends tends to produce more torque
due to its faster flame velocity. Again, the higher compression ratio and cylinder BMEP
for E85 engines means more work is done on the piston causing an increase in the output
torque (Costa & Sodre, 2010).
Figure 35 - BSFC Comparison of Wiseman Engine with Contra Piston (E85 and Gas)
Studies show that by increasing the concentration of ethanol by 10-20% in an
ethanol-gasoline blend reduces the calorific value of the fuel which causes an increase in
the fuel consumption of the engine (Cahyono & Bakar, 2010). As mentioned earlier,
ethanol has a significantly lower calorific value as compared to gasoline, which results is
lower energy released on combustion. Therefore more fuel is required for an engine
running on E85 to do the same amount of work as an engine running on pure gasoline.
This trend in fuel efficiency is very evident in the results generated by the LES software.
The plotted results in Figure 35 show that the Wiseman UAV engine when running on
0
200
400
600
800
1000
1200
1000 2000 3000 4000 5000 6000 7000
BS
FC
(g
/KW
/hr)
Speed (RPM)
Speed Vs Fuel Consumption
WE 30 CC (E85)
WE 30 CC (gas)

58
E85 tends to consume more fuel at every speed with an increase of almost 41.5% at the
peak RPM.
Engine Power (KW) Torque (Nm) BSFC (g/KW/hr)
Wiseman UAV (gas) 0.71 0.97 845.08
Wiseman UAV (E85) 0.72 0.98 1196.21
Table 8 - Performance Summary of Wiseman with Contra Piston (E85 and Gas) at 7000 RPM
Scalability Analysis on Bigger Wiseman Engine Prototypes
To further expand the range of applications utilizing the Wiseman engine, a series
of theoretical Wiseman prototypes were designed and their performance was simulated in
the LES software (using the conventional slider-crank piston motion and the Wiseman
hypocycloid piston motion). The current 30 cc Wiseman engine is designed to produce
0.99 Hp. The theoretical prototypes were designed with the engine output power in mind,
and so models for a 10 Hp, 20 Hp and 30 Hp (7.46 KW, 14.91 KW and 22.37 KW
respectively) were considered. Another reason for designing Wiseman engine prototypes
with higher power outputs was so that, a scalability analysis can be conducted to
determine how the engine’s performance varies with respect to its size. These prototypes
were also tested to predict their performance while operating on different fuels (gasoline,
diesel and E85).
The engines were designed to have the following characteristics:
• Single cylinder with a four stroke combustion cycle and a peak performance
speed of 2000 RPM
• Compression ratio of 8:1 was chosen for the gasoline engines, 16:1 for diesel
engines and 13:1 for Ethanol engines
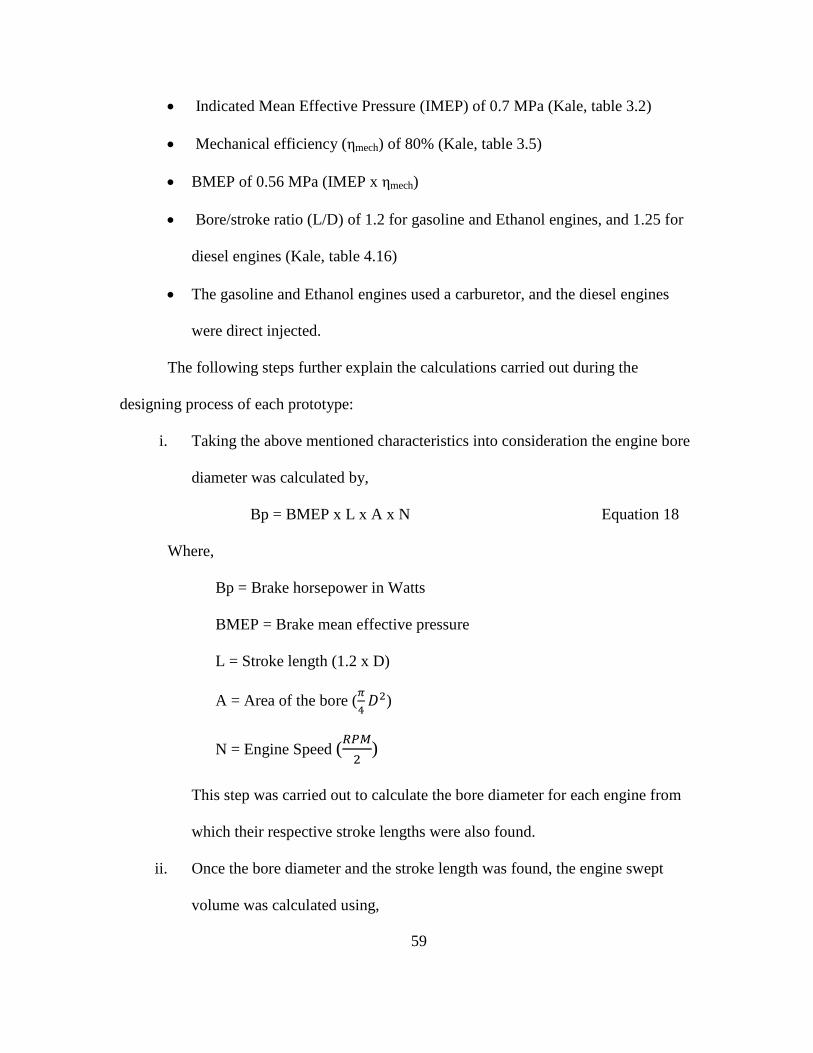
59
• Indicated Mean Effective Pressure (IMEP) of 0.7 MPa (Kale, table 3.2)
• Mechanical efficiency (ηmech) of 80% (Kale, table 3.5)
• BMEP of 0.56 MPa (IMEP x ηmech)
• Bore/stroke ratio (L/D) of 1.2 for gasoline and Ethanol engines, and 1.25 for
diesel engines (Kale, table 4.16)
• The gasoline and Ethanol engines used a carburetor, and the diesel engines
were direct injected.
The following steps further explain the calculations carried out during the
designing process of each prototype:
i. Taking the above mentioned characteristics into consideration the engine bore
diameter was calculated by,
Bp = BMEP x L x A x N Equation 18
Where,
Bp = Brake horsepower in Watts
BMEP = Brake mean effective pressure
L = Stroke length (1.2 x D)
A = Area of the bore (UV E�)
N = Engine Speed (WXY
� )
This step was carried out to calculate the bore diameter for each engine from
which their respective stroke lengths were also found.
ii. Once the bore diameter and the stroke length was found, the engine swept
volume was calculated using,
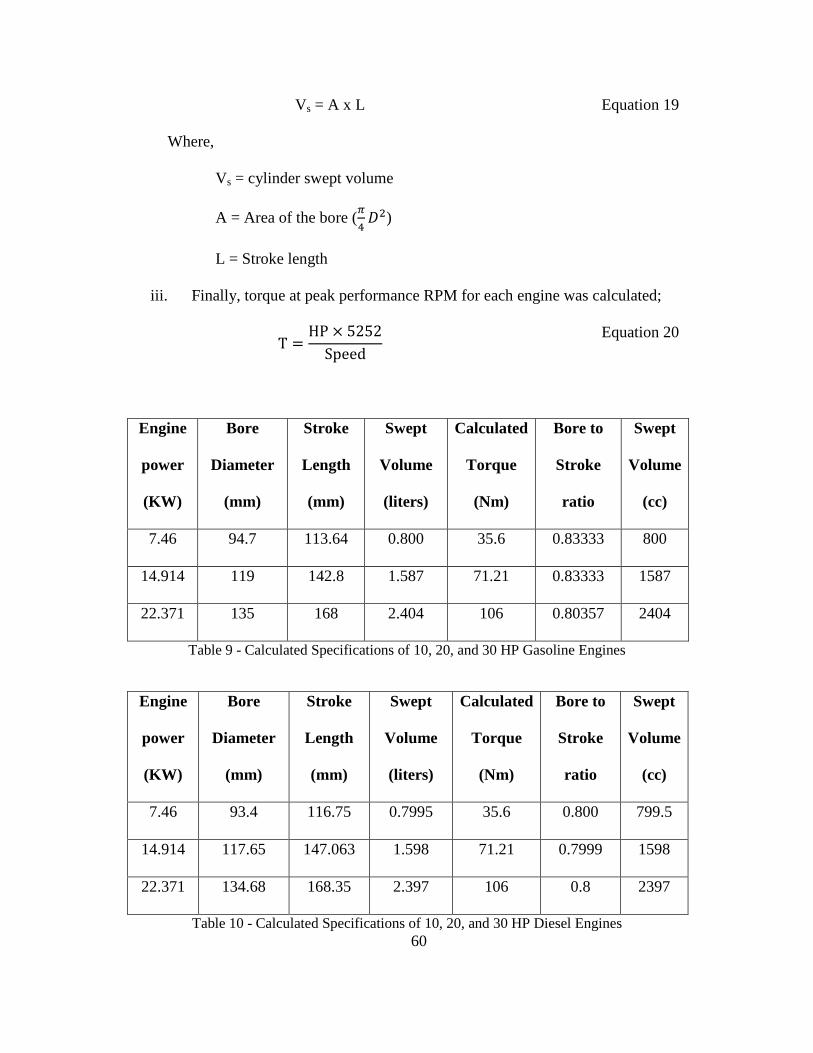
60
Vs = A x L Equation 19
Where,
Vs = cylinder swept volume
A = Area of the bore (UV E�)
L = Stroke length
iii. Finally, torque at peak performance RPM for each engine was calculated;
T � HP \ 5252Speed
Equation 20
Engine
power
(KW)
Bore
Diameter
(mm)
Stroke
Length
(mm)
Swept
Volume
(liters)
Calculated
Torque
(Nm)
Bore to
Stroke
ratio
Swept
Volume
(cc)
7.46 94.7 113.64 0.800 35.6 0.83333 800
14.914 119 142.8 1.587 71.21 0.83333 1587
22.371 135 168 2.404 106 0.80357 2404
Table 9 - Calculated Specifications of 10, 20, and 30 HP Gasoline Engines
Engine
power
(KW)
Bore
Diameter
(mm)
Stroke
Length
(mm)
Swept
Volume
(liters)
Calculated
Torque
(Nm)
Bore to
Stroke
ratio
Swept
Volume
(cc)
7.46 93.4 116.75 0.7995 35.6 0.800 799.5
14.914 117.65 147.063 1.598 71.21 0.7999 1598
22.371 134.68 168.35 2.397 106 0.8 2397
Table 10 - Calculated Specifications of 10, 20, and 30 HP Diesel Engines

61
NOTE: A similar approach as the Wiseman UAV contra piston engine was used to
determine the performance of the gasoline engine running on E85. This meant that the
engine parameters for the ethanol engine remained the same as the gasoline engine but
the compression ratio was changed to 13:1, and the fuel properties were changed to that
of E85.
Scaling Laws for Internal Combustion Engines
Further, to analyze and predict the performance of the Wiseman prototypes with
increasing horsepower, there was a need to establish some performance scaling laws to
determine how the engine performance changes according to the size of the engine. Every
engine’s output vary over its operating range, and so comparing their performance at
randomly selected points would not draw any meaningful conclusions. In order to
compare the output performance metrics across different engines, the engines need to be
compared at constant speed (2000 RPM) and air-fuel ratio. This way the changes in the
performance can be isolated and treated as a result of change in engine size. Mr. Shyam
Kumar Menon has done some extensive work during his master’s and doctorate studies
on scaling the engine’s performance based on the engine size. He studied over 40 engines
ranging from single cylinder to 36 cylinders in size. These engines had applications
ranging from model airplanes, to lawnmowers, to automobiles and aircrafts (Menon,
2006). Based on the plethora of data that he collected from testing and manufacturers, he
established some scaling laws for the engine’s performance parameters based on their
displacement. These established laws are used to analyze the Wiseman prototypes and
determine the effects of scaling them bigger.

62
I. Scaling the Bore and Stroke of the Engine
There was a relationship established between the engine displacement and
the corresponding bore to stroke ratio. It was noticed that the engines with
displacement less than 1000 cc were likely to have a “square” design with a few
exceptions between the ranges of 1000-8000 cc. This meant that the bore to stroke
ratio in those engines was close to 1. Another observation was that, as the engines
got larger, the design changed to slightly “under square” (Menon, 2010).
Figure 36 - Scaled Relationship between Engine Sizes and Bore to Stroke Ratio
From studying the calculated displacements of the 10, 20 and 30 HP
Wiseman prototypes (gasoline, E85 and diesel) and their corresponding bore to
stroke ratios, it seemed that the engines tend to have a bore to stroke ratio closer
to 1 regardless of their displacement. This is especially true for the diesel
prototypes, as seen in Figure 36. Though, the data set used to test the scaling laws
on engine’s physical properties is too small to draw any meaningful conclusion.
0.795
0.8
0.805
0.81
0.815
0.82
0.825
0.83
0.835
0.84
700 1200 1700 2200
Bo
re t
o S
tro
ke
Ra
tio
Displacement (CC)
Scaling Bore to Stroke Ratio
Gas and E85
Prototypes
Diesel
Prototypes

63
Figure 37 - Scaling of Bore to Stroke Ratio with Engine Displacement (Menon, 2010)
But from studying the data presented by Mr. Menon in Figure 37, it can be
noticed that the Kohler diesel engines as well as the Ford automobile engines that
he tested showed a similar trend as the Wiseman diesel prototypes between the
sizes of 700 to 3000 cc (approximately).
II. Scaling the Engine Peak Torque at Peak Power Output
Further, two different power laws were established by Mr. Menon, one for
the small engines he tested and another based on the manufacturer provided data.
But since both the laws had a close correlation (R2 > 0.98), it was concluded that
the output torque as a function of displacement can be described using a power
curve, regardless of the size and type. It was noted that the engine torque tends to
increase with the increase in the engine displacement. A chart projecting the data
collected by Mr. Menon can be seen in Figure 38.

64
Figure 38 - Scaling of Peak Engine Torque with Engine Displacement (Menon, 2010)
The data generated from software simulations of each engine type was
then plotted to see how close the fit was when compared to the above mentioned
relationship.
Figure 39 - Scaling Wiseman Engine’s Torque with Engine Size at 2000 RPM
y = 0.0526x0.9807
R² = 1
y = 0.0577x0.9882
R² = 0.9981
y = 0.0531x0.9805
R² = 0.9988
30
40
50
60
70
80
90
100
110
120
130
700 1200 1700 2200
To
rqu
e (
Nm
)
Displcement (CC)
Scaling of Engine Torque (Wiseman)
WE gas
prototypes
WE E85
prototypes
WE diesel
prototypes
Power (WE gas
prototypes)
Power (WE E85
prototypes)
Power (WE diesel
prototypes)

65
As seen in Figure 39, the Wiseman engines follow a similar trend when
the displacement and the corresponding output torque of the engines are
compared. The correlation of the power curves is R2 >0.99 and the torque seems
to be directly proportional to the displacement. This means that as the Wiseman
engine’s size in terms of cylinder displacement increases, the output toque also
increases. This is true for E85, gasoline and diesel engines.
Figure 40 - Scaling Slider-crank Engine’s Torque with Engine Size at 2000 RPM
Once again, from Figure 40, it can be noticed that the output torque for the
slider-crank engines of the same size as the Wiseman prototypes, while operating
on E85, gasoline and diesel, also show a very similar trend to the scaling law
established by Mr. Menon.
y = 0.0619x0.9583
R² = 0.9999
y = 0.0567x0.9899
R² = 0.9963
y = 0.0485x0.9888
R² = 0.9978
30
50
70
90
110
130
150
700 1200 1700 2200
Ou
tpu
t T
orq
ue
(N
m)
Displacement (CC)
Scaling of Engine Torque (Slider-crank)
SC gas
SC E85
SC diesel
Power (SC gas)
Power (SC E85)
Power (SC diesel)
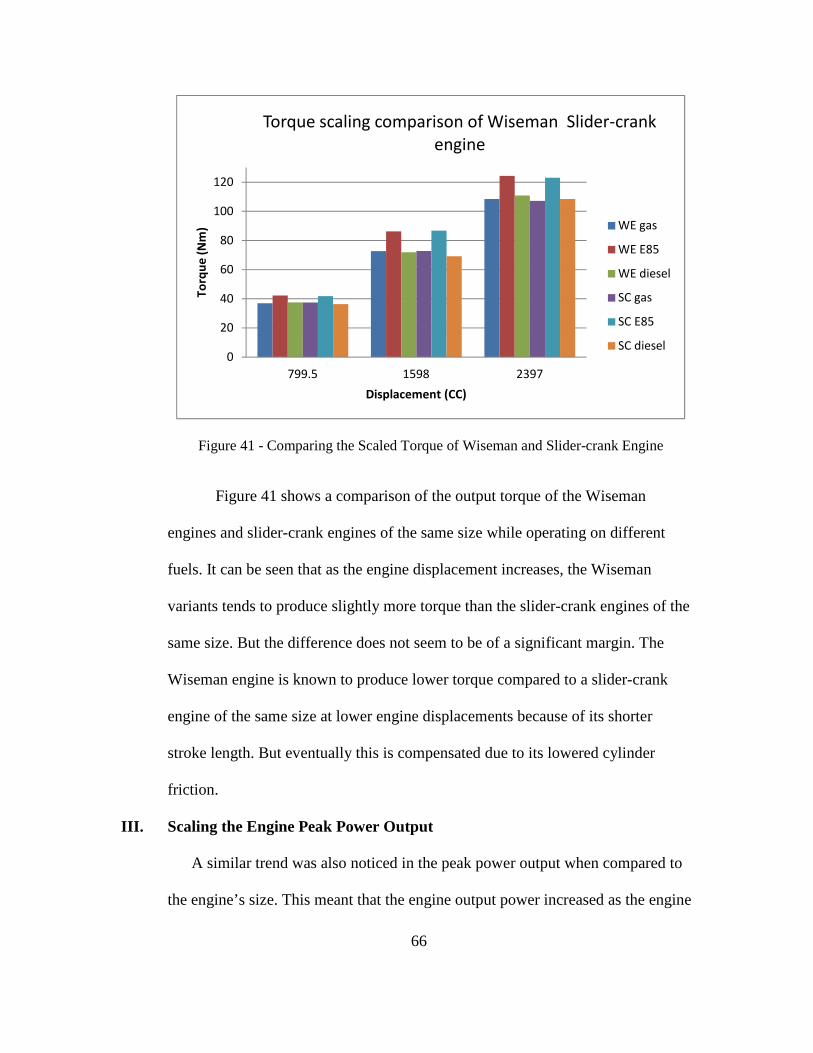
66
Figure 41 - Comparing the Scaled Torque of Wiseman and Slider-crank Engine
Figure 41 shows a comparison of the output torque of the Wiseman
engines and slider-crank engines of the same size while operating on different
fuels. It can be seen that as the engine displacement increases, the Wiseman
variants tends to produce slightly more torque than the slider-crank engines of the
same size. But the difference does not seem to be of a significant margin. The
Wiseman engine is known to produce lower torque compared to a slider-crank
engine of the same size at lower engine displacements because of its shorter
stroke length. But eventually this is compensated due to its lowered cylinder
friction.
III. Scaling the Engine Peak Power Output
A similar trend was also noticed in the peak power output when compared to
the engine’s size. This meant that the engine output power increased as the engine
0
20
40
60
80
100
120
799.5 1598 2397
To
rqu
e (
Nm
)
Displacement (CC)
Torque scaling comparison of Wiseman Slider-crank
engine
WE gas
WE E85
WE diesel
SC gas
SC E85
SC diesel

67
displacement increased. But during his research, Mr. Menon noticed that the
change in the output power for a two stroke engine was more than that for a four
stroke engine of the same displacement (shown in Figure 42). This makes sense
since it is a well known fact that two stroke engines tend to produce more power
per unit displacement (Menon, 2010).
` Figure 42 - Scaling Peak Engine Power Output with Engine Size (Menon, 2010)
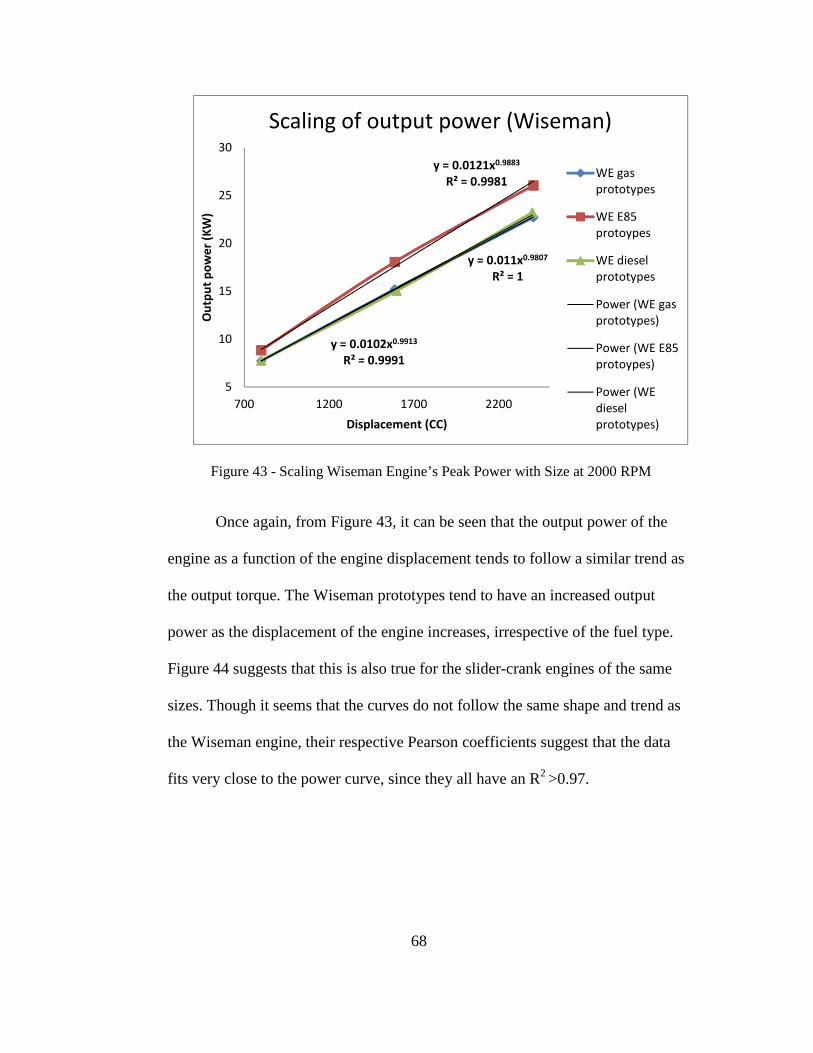
68
Figure 43 - Scaling Wiseman Engine’s Peak Power with Size at 2000 RPM
Once again, from Figure 43, it can be seen that the output power of the
engine as a function of the engine displacement tends to follow a similar trend as
the output torque. The Wiseman prototypes tend to have an increased output
power as the displacement of the engine increases, irrespective of the fuel type.
Figure 44 suggests that this is also true for the slider-crank engines of the same
sizes. Though it seems that the curves do not follow the same shape and trend as
the Wiseman engine, their respective Pearson coefficients suggest that the data
fits very close to the power curve, since they all have an R2 >0.97.
y = 0.011x0.9807
R² = 1
y = 0.0121x0.9883
R² = 0.9981
y = 0.0102x0.9913
R² = 0.9991
5
10
15
20
25
30
700 1200 1700 2200
Ou
tpu
t p
ow
er
(KW
)
Displacement (CC)
Scaling of output power (Wiseman)
WE gas
prototypes
WE E85
protoypes
WE diesel
prototypes
Power (WE gas
prototypes)
Power (WE E85
protoypes)
Power (WE
diesel
prototypes)

69
Figure 44 - Scaling Slider-crank Engine’s Peak Power with Size at 2000 RPM
The trend can further compared between the slider-crank and Wiseman
variants like torque comparison to see how they perform against each other in
terms of output power when operating on different fuels.
Figure 45 - Comparing the Scaled Power of Wiseman and Slider-crank Engine
y = 0.013x0.9584
R² = 0.9999
y = 0.0241x0.8871
R² = 0.9755
y = 0.005x1.0911
R² = 0.9863
5
10
15
20
25
30
700 1200 1700 2200
Ou
tpu
t p
ow
er
(KW
)
Displacement (CC)
Scaling of output power (slider-crank)
SC gas
SC E85
SC diesel
Power (SC gas)
Power (SC E85)
Power (SC diesel)
0
5
10
15
20
25
799.5 1598 2397
Ou
tpu
t P
ow
er
(KW
)
Displacement (CC)
Power scaling comparison of Wiseman Slider-crank
engine
WE gas
WE E85
WE diesel
SC gas
SC E85
SC diesel

70
The comparison in Figure 45 shows that the Wiseman variants tend to
produce more power than its slider-crank counterparts irrespective of the fuel
used. This is true especially true for the 30 HP (2397 cc) variant using E85 fuel.
On the contrary, the 30 HP slider-crank diesel engine produces more power
compared to Wiseman engine of same size. And the difference between the power
produced by the Wiseman and slider-crank versions operating on gas is
insignificant.
IV. Scaling the Engine Fuel Consumption at Peak Power Output
It was noted from Mr. Menon’s findings that when it comes to the fuel
consumption of an engine, miniature engines tend to have a greater drop in fuel
efficiency as the size of the engine decreases compared to the engines of
conventional sizes. The reason stated for this trend is because smaller engines
tend to have higher losses. This means that as the engine size increases, the fuel
efficiency slightly increases as seen in Figure 46.
Figure 46 - Scaling of SFC at Peak Power with Engine Size (Menon, 2010)

71
It can be observed that the engines had a steeper slope for fuel
consumption for sizes until 15 cc but in the region of 15-20 cc this trend in the
slope changes (Menon, 2010). Engines that share the same range of displacement
as the Wiseman prototypes, 800-2500 cc, tend to have a gradual increase in the
fuel efficiency with increase in engine size.
Figure 47 - Scaling Wiseman Engine’s BSFC with Respect to Engine Displacement
As seen in Figure 47, the Wiseman prototypes show a similar trend as the
fuel efficiency law established earlier, but the approach does not seem to be very
effective considering the lower values of R2. This shows that the data does not fit
very well with the implemented power curve. The fuel efficiency of the engines
mostly varies with the change in the displacement but overall there is a slight
improvement with the increase in engine displacement. Similar to the results from
previous multi-fuel tests, the engines operating on E85 tend to consume more fuel
in general than while operating on gas and diesel. This could again be due to the
y = 315.91x0.0072
R² = 0.4309
y = 595.96x-0.045
R² = 0.2974
y = 740.53x-0.132
R² = 0.6851200
250
300
350
400
450
500
700 1200 1700 2200 2700
BS
FC
(g
/KW
/hr)
Displacement (CC)
Scaling Wiseman Fuel EfficiencyWE gas
prototype
WE E85
Prototype
WE diesel
Prototype
Power (WE gas
prototype)
Power (WE E85
Prototype)
Power (WE
diesel
Prototype)

72
lower calorific value of the E85 fuel. Again, the diesel Wiseman engines seem to
be the most promising in terms of fuel efficiency, with the 30 HP variant showing
the best results. It was also noted that the gas variants did not show any significant
change in the fuel efficiency with change in displacement.
Figure 48 - Scaling Slider-crank Engine’s BSFC with Respect to Engine Size
The Slider-crank versions of the Wiseman engines also show exactly same
trend, as seen in Figure 48. They too tend to have slightly lower fuel consumption
as the engine’s displacement increases. Again, the change is very stable in the gas
engines while the diesel engines prove to be most fuel efficient. The E85 variants
again show high fuel consumption. This data was further compared to see how the
engines with Wiseman mechanism perform in terms of fuel efficiency when
compared to the slider-crank versions of the same size.
y = 296.23x0.0148
R² = 0.7217
y = 661.9x-0.059
R² = 0.3534
y = 895.5x-0.153
R² = 0.6589
200
250
300
350
400
450
500
700 1200 1700 2200 2700
BS
FC
(g
/KW
/hr)
Displacement (CC)
Scaling of slider-crank fuel efficiency
SC gas
SC E85
SC diesel
Power (SC
gas)
Power (SC
E85)
Power (SC
diesel)

73
Figure 49 - Comparing the Scaled BSFC of Wiseman and Slider-crank Engine
From the comparison of the BSFC results in Figure 49, it can be seen that
the Wiseman engines of the same size as the slider-crank engines tends to be
slightly less fuel efficient but the difference is almost negligible. Though both the
engines follow a common trend, i.e. increase in fuel efficiency with increase in
engine displacement. The gas and E85 variants of both the engines have almost
identical fuel consumption. The Wiseman diesel engines prove to be a little more
fuel efficient than the slider-crank engines of the same displacement.
V. Scaling the Engine Brake Mean Effective Pressure (BMEP)
Another important engine parameter to gauge the engine’s performance is
the BMEP. The BMEP decides the work done by the piston which in turn
determines the output torque and power. This reflects on the overall quality of the
engine design. From the research findings of Mr. Menon it was stated that the
0
50
100
150
200
250
300
350
400
450
799.5 1598 2397
BS
FC
(g
/KW
/hr)
Displacement (CC)
BSFC scaling comparison of Wiseman eng Slider-crank
engines
WE gas
WE E85
WE diesel
SC gas
SC E85
SC diesel

74
engine BMEP gradually increase with increase in engine displacement (Figure
50). Though it is important to note that his results did not have a very good fit
with R2 ~ 0.5 (Menon, 2010). It should also be noted that the engine BMEP was
not measured at a constant speed but instead the peak BMEP was recorded
(generally at very low speeds).
Figure 50 - Scaling of Peak Engine BMEP with Engine Size (Menon, 2010)
Figure 51 also shows a similar trend in the peak BMEP of the Wiseman
engines with respect to their engine displacements. Though the trend is not clearly
recognizable from the plots, due to the small size of the data set, overall the
BMEP seems to increase with increase in cylinder displacement. The scaling law
seems most evident in the gas variants of the engines, whereas the diesel engines
tend to show the opposite trend. It can also be seen that the engines operating on
E85 fuel produces more BMEP than the gas versions in general. This is especially
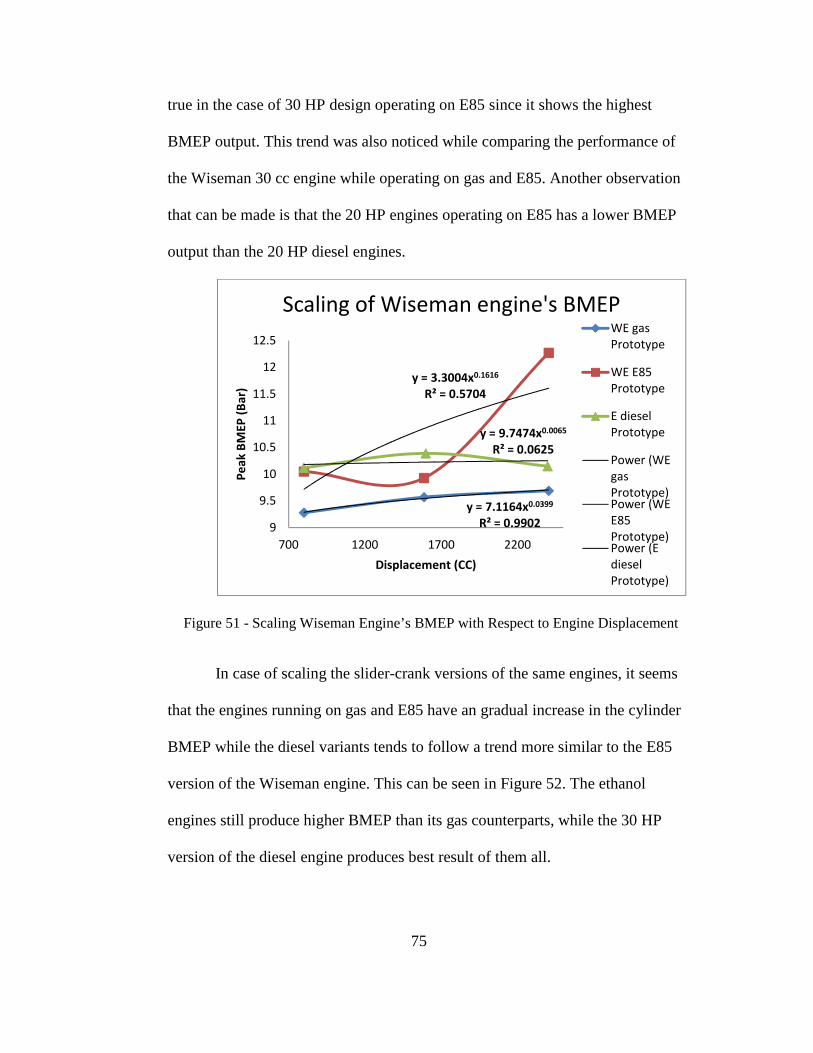
75
true in the case of 30 HP design operating on E85 since it shows the highest
BMEP output. This trend was also noticed while comparing the performance of
the Wiseman 30 cc engine while operating on gas and E85. Another observation
that can be made is that the 20 HP engines operating on E85 has a lower BMEP
output than the 20 HP diesel engines.
Figure 51 - Scaling Wiseman Engine’s BMEP with Respect to Engine Displacement
In case of scaling the slider-crank versions of the same engines, it seems
that the engines running on gas and E85 have an gradual increase in the cylinder
BMEP while the diesel variants tends to follow a trend more similar to the E85
version of the Wiseman engine. This can be seen in Figure 52. The ethanol
engines still produce higher BMEP than its gas counterparts, while the 30 HP
version of the diesel engine produces best result of them all.
y = 7.1164x0.0399
R² = 0.9902
y = 3.3004x0.1616
R² = 0.5704
y = 9.7474x0.0065
R² = 0.0625
9
9.5
10
10.5
11
11.5
12
12.5
700 1200 1700 2200
Pe
ak
BM
EP
(B
ar)
Displacement (CC)
Scaling of Wiseman engine's BMEPWE gas
Prototype
WE E85
Prototype
E diesel
Prototype
Power (WE
gas
Prototype)Power (WE
E85
Prototype)Power (E
diesel
Prototype)

76
Figure 52 - Scaling Slider-crank Engine’s BMEP with Respect to Engine Size
Figure 53 - Comparing the Scaled BMEP of Wiseman and Slider-crank Engine
While comparing the cylinder BMEP of the Wiseman and slider-crank
engines with respect to their cylinder size in Figure 53, it can be observed that the
slider-crank engines have a higher BMEP output than the Wiseman engines in
general. There are two exceptions to this trend and both are for the 30 HP variants
y = 7.9218x0.0299
R² = 0.9942
y = 9.3671x0.0139
R² = 0.5295
y = 3.1688x0.1704
R² = 0.6843
9
9.5
10
10.5
11
11.5
12
12.5
13
700 1200 1700 2200
Pe
ak
BM
EP
(B
ar)
Displacement (CC)
Scaling Slider-crank engine's BMEP
SC gas
SC E85
SC diesel
Power (SC
gas)Power (SC
E85)Power (SC
diesel)
0
2
4
6
8
10
12
799.5 1598 2397
BM
EP
(B
ar)
Displacement (CC)
Scaled BMEP comparison of Wiseman and
Slider-crank engines
WE gas
WE E85
WE diesel
SC gas
SC E85
SC diesel

77
of these engines. The 30 HP slider-crank diesel and 30 HP Wiseman ethanol
variants produce almost identical BMEP. The BMEP of these two engines is also
the highest out of all the engines.

78
Chapter 6
CONCLUSION AND RECOMMENDATIONS
The heat engine comprising of the slider-crank mechanism has been the popular
choice in the market till date. Though there have been other engines but none of them
have seen the level of commercial success as the slider-crank mechanism. Despite being
popularly implemented, the slider-crank mechanism has few design limitations. It tends
to have loss of energy in the form of heat generated by friction. The main source of this
friction is due to the piston rubbing against the cylinder wall during its motion. Most
engine designers focus on how to minimize the loss of energy due to internal friction in
the engine which in turn will increase the overall efficiency of the engine.
An alternative mechanism was proposed by Wiseman Inc., which utilized the
geared hypocycloid concept by replacing the conventional crankshaft in the engine. The
idea of using hypocycloidal gear assembly in a combustion engine is centuries old but it
has never been commercially implemented. The assembly consists of a pinion gear which
rotates inside a ring gear. By making the gear ratios to 2:1, every point on the parameter
of the pinion gear provides a straight line curve, and this benefits the piston motion in
ICE. The connecting rod and the piston when connected to such a point on the pinion
gear, has a straight line motion. This means that the piston has a perfect sinusoidal
motion and there is no friction between it and the cylinder walls. The Wiseman design
takes advantage of this phenomenon in their patented design for a 30 cc engine. Other
than the advantage of reduced friction, a hypocycloid engine also has tends to be
dimensionally smaller and is believed to have higher performance outputs than a

79
conventional slider crank engine of the same size. Theoretically, the reason behind better
performance is that the straight line motion eliminates bending of the connecting rod due
to the gas force which contributes to better utilization of the gas force. This means more
work is done per every stroke, resulting in higher torque and power. Though, it has not
been proved to be more fuel efficient.
Previous studies have proved these claims to be true to an extent but a more
detailed study was necessary. In order to thoroughly analyze the Wiseman engine’s
performance when compared to a conventional slider-crank engine of the same size, it
was thought wise to use the Lotus Engine Simulation software. The authenticity of the
results produced by the LES software was validated by first simulating the performance
of a stock engine with known parameters and comparing the results with the
manufacturer provided specifications. From the output comparison of the results
generated by LES software and that provided by the manufacturer, it was concluded that
the software results were reliable provided all minor details of the engine are taken into
consideration. This approach seems logical since by providing more details, a more
realistic operating situation is created during the simulation. Further, a detailed Wiseman
30 cc engine was modeled in the LES software along with its unique piston motion and
the simulated results were compared with the same engine having a conventional slider-
crank piston motion. It was noticed that the Wiseman engine produced slightly lower
power (0.83 HP) than the slider-crank engine (0.89 HP) at the peak engine speeds (6000
RPM). Though the peak output power of the Wiseman engine was much closer to the
designed peak power of 0.99 HP. This meant that the Wiseman engine produced about
7% less power than the slider crank engine. A similar trend was also observed during
80
previous dynamometer tests conducted on the Wiseman engine. Contradictory to the
theoretical expectations, the Wiseman 30 cc engine had a lower torque output than the
slider-crank engine while being about 6% less fuel efficient. Prior tests by Wiseman Inc.
claimed that the engine was about twice as fuel efficient than its slider-crank variant.
Another study on the Wiseman engine was conducted to observe how the
Wiseman engine would perform if a 4 stroke diesel version was designed. The simulated
results for this variant of the engine proved to be very promising in almost all aspects. It
was seen that a 30 cc four stroke Wiseman diesel engine, produced higher power and
torque than the 2 stroke Wiseman and slider-crank engines running on gas. The reason
behind it is that the 4 stroke fuel injected engine had a higher volumetric efficiency,
which meant it utilized the air and fuel mixture in an optimum manner. This further
reflected in fuel consumption comparisons, where the 4 stroke Wiseman diesel engine
proved to be a lot more fuel efficient than the 2 stroke gas engines.
Further, the Wiseman engine was analyzed to see its multi-fuel capabilities if a
contra piston were incorporated in the design. For the sake of this study, the performance
of the 2 stroke Wiseman engine was tested using different fuels while its compression
ratio was changed. It was noticed that the Wiseman engine while operating on E85 flex-
fuel performed better in terms of power and torque than while running on pure gasoline.
It was noted that the engine produced about 1.4% more power while operating on E85.
The properties of E85 as an engine fuel along with the implementation of higher
compression ratio contributed to this improved performance. However, the fuel efficiency
of the engine plummeted significantly while it operated on E85. The reason behind this is
that, E85 has significantly lower calorific value than gasoline, which means the engine

81
while operating on E85 requires more energy (fuel) to perform the same amount of work
as gasoline engine.
The current 30 cc Wiseman engine produces less than 1 HP and so to expand its
range of applications in future, more powerful engine designs were required. For this
purpose, 4 stroke Wiseman engines with power outputs of 10 HP, 20HP and 30 HP were
designed. Since these engines were only theoretical prototypes, it was necessary to study
how their performance would change with respect to their size. Increase in engine power
also meant an increase in engine displacement, and so a performance scaling analysis was
conducted to predict how the output power, torque and fuel efficiency would change
according to the displacement while operating on different fuels. The analysis involved
using previously established scaling laws for each parameter to study the trend. It was
noticed that as the engine displacement increased, the torque and the power produced by
it also increased. This was true for a slider-crank as well as an engine using Wiseman
mechanism. The engines operating on E85 fuel produced higher torque especially for the
30 HP design. This was true for both, the Wiseman engine and a slider-crank engine of
the same size. In case of power, the 30 HP Wiseman engine produce more power than a
30 HP slider-crank diesel engine. Overall, it was noticed that the Wiseman engines fared
better in terms of power and torque than the slider-crank engines as the size increased. A
similar trend was also noticed when it came to engine fuel consumption with respect to
its size. It was observed that as the engine’s displacement increased, it became more fuel
efficient. A reason for this is that smaller engines tend to have higher motoring losses.
While comparing this trend with slider-crank engines, it was found that the 30 HP
Wiseman engine while operating on diesel had the best fuel efficiency. Further, the

82
change in engine’s BMEP was studied and it was found that as the cylinder displacement
increased, the BMEP also increased. Once again, the 30 HP Wiseman design produced
the highest BMEP as compared all the other engines. Though the difference between that
engine and a conventional 30 HP diesel engine was negligible.
From all the analysis conducted, it can be concluded that the simulated results by
LES software for 30 cc Wiseman engine are comparable to those obtained by previous
dynamometer tests. Though, these results are not favorable when compared to an engine
using the slider-crank mechanism. There needs to be additional tuning done in order to
optimize the performance of the 30 cc Wiseman engine. The scaling and multi-fuel
analysis suggests that the 4 stroke diesel and ethanol variants of the Wiseman engine
seem more promising than the 2 stroke gasoline engine. It would also benefit to explore
and develop the 30 HP diesel and ethanol designs since the simulated results for those
engines are most optimum. These engines also showed a closer relationship to the trend
where the increase in HP increases the displacement which in turn increases the output
torque. It was also found that increasing the HP reduces the fuel consumption for the
amount of power generated.
Recommendations and Future Work
To further develop a multi-fuel Wiseman engine there are some key factors that
need to be taken into consideration. Since, the proposed contra piston design operates on
variety of fuels including ethanol, it should be noted that ethanol like other alcohols is
corrosive in nature and over time it might damage the engine’s components like spark
plugs. It should also be noted that as the concentration of the ethanol in the fuel increases,

83
engine components like fuel filter, fuel pump, ignition system and the exhaust system
need to be modified for trouble free performance. The orifice diameters also need to be
increased for the engines operating on ethanol to allow proper mixing of air and fuel
depending on varying engine speeds. Having high compression ratio for ethanol and
diesel engines also means higher loads on the bearings and the connecting rod, which
might result in component failure. It would also benefit to study Wiseman engines
designs for HP between the intervals of 10, 20 and 30 so a stronger relationship with the
scaling laws can be established.

84
REFERENCES
Ganesan, V. (2012). Internal combustion engines. (4th ed.). New Delhi: Tata McGraw Hill Education Pvt. Ltd.
Bai, D., Solving piston secondary motion of internal combustion engines. Sloan
Automotive Laboratory, Retrieved from http://math.mit.edu/classes/18.086/2008/final_report_dongfang_bai.pdf
Mathur, M. L., & Sharma, R. P. (1997). A course in internal combustion engines. (7th
ed.). New Delhi: Dhanpat Rai Publications Pvt. Ltd. H. W. Dickinson, "James White and His 'New Century of Inventions”, Transactions of
the Newcomen Society, 1949-1951, vol. 27, pp. 175-179. James White, A New Century of Inventions, Manchester, 1822, pp. 30-31, 338. A
hypocycloidal engine used in Stourbridge, England, is in the Henry Ford Museum Karhula, J. (2008). Cardan Gear Mechanism versus Slider Crank Mechanism in Pumps
and Engines. Lappeenranta: Lappeenranta University of Technology.
Wolfram MathWorld. (2010, October). Retrieved from Hypocycloid: http://mathworld.wolfram.com/Hypocycloid.html
Polly Model Engineering Limited. (2010, October). Retrieved from Stationary Engine
Kits: http://www.pollymodelengineering.co.uk/sections/stationary-engines/anthony-mount-models/murrays-Hypocycloidal-Engine.asp
Special plane curves. (2005-2014). Retrieved from
http://www.math10.com/en/geometry/analytic-geometry/geometry5/special-plane-curves.html
Conner, T. (2011). “Critical Evaluation and Optimization of a Hypocycloid Wiseman
Engine”, M.S. Thesis, Arizona State University, 2011. Wiseman Engine Group. (2010). The engine of the future - today! Business Plan.
Wiseman Technologies, Inc. (n.d.). Retrieved from UAV Design:
http://www.wisemanengine.com/AUVSIWisemanPaPer.doc
Wiseman, R. (2001). Patent No. 6,510,831. United States of America.
85
Taylor, C.F., The Internal Combustion Engine in Theory and Practice. Volume 2: Combustion, Fuels, Materials, Design, Revised Edition. The M.I.T. Press, Massachusetts Institute of Technology, Cambridge, Massachussets, 1985
Beachley, N. H., & Lenz, M. A. (1988). A Critical Evaluation of the Geared Hypocycloid
Mechanism for Internal Combustion Engine Application". Scociety of Auotmotive Engineers, Inc
Ishida, K., & Matsuda, T. (1975). Fundamental Researches on a Perfectly Balanced
Rotation-Reciprocation Mechanism. Bulletin of the JSME , 185-192.
Ruch, David M., “An Experimental and Analytical Investigation of a Single-Cylinder Modified Hypocycloid Engine Design,” PhD dissertation, University of Wisconsin at Madison, 1992
Menz, K.C., “Design and Experimentation of a ‘Big Bearing’ Internal Geared
Hypocycloid Air Compressor,” M.S. Thesis, University of Wisconsin-Madison, 1987.
A Combustion Correlation for Diesel Engine Simulation. N.Watson, A.D.Pilley &
M.Marzouk. SAE 800029. Investigation of Internal Combustion Engine Problems. G.Eichelberg “Engineering Oct
1939 Vol 148, 463 & 547” Heat Transfer in the Cylinder of Reciprocating Internal Combustion Engines.
W.J.D.Annand (Proc.I.Mech.E 177.973 (1963)) American coalition for ethanol. (n.d.). Retrieved from
http://ethanol.org/index.php?id=50&parentid=8 U.S. Department of Energy, Energy Efficiency & Renewable Energy. (2013). Handbook
for handling, storing, and dispensing e85 and other ethanol-gasoline blends. Retrieved from U.S. Department of Energy website: http://www.afdc.energy.gov/uploads/publication/ethanol_handbook.pdf
Costa, R. C., & Sodre, J. R. (2010). Hydrous ethanol vs. gasoline-ethanol blend: Engine
performance and emissions. Fuel, 89(2), 287-293. Retrieved from http://www.sciencedirect.com/science/article/pii/S0016236109002981
Costa, R. C., & Sodre, J. R. (2010). Compression ratio effects on an ethanol/gasoline
fuelled engine performance. Applied Thermal Engineering,21(2-3), 278-283. Retrieved from http://ac.els-cdn.com/S1359431110003947/1-s2.0-S1359431110003947-main.pdf?_tid=7912e454-af24-11e3-9135-00000aacb361&acdnat=1395205873_1452066f302a7ab8e1c47b99a6859ba3
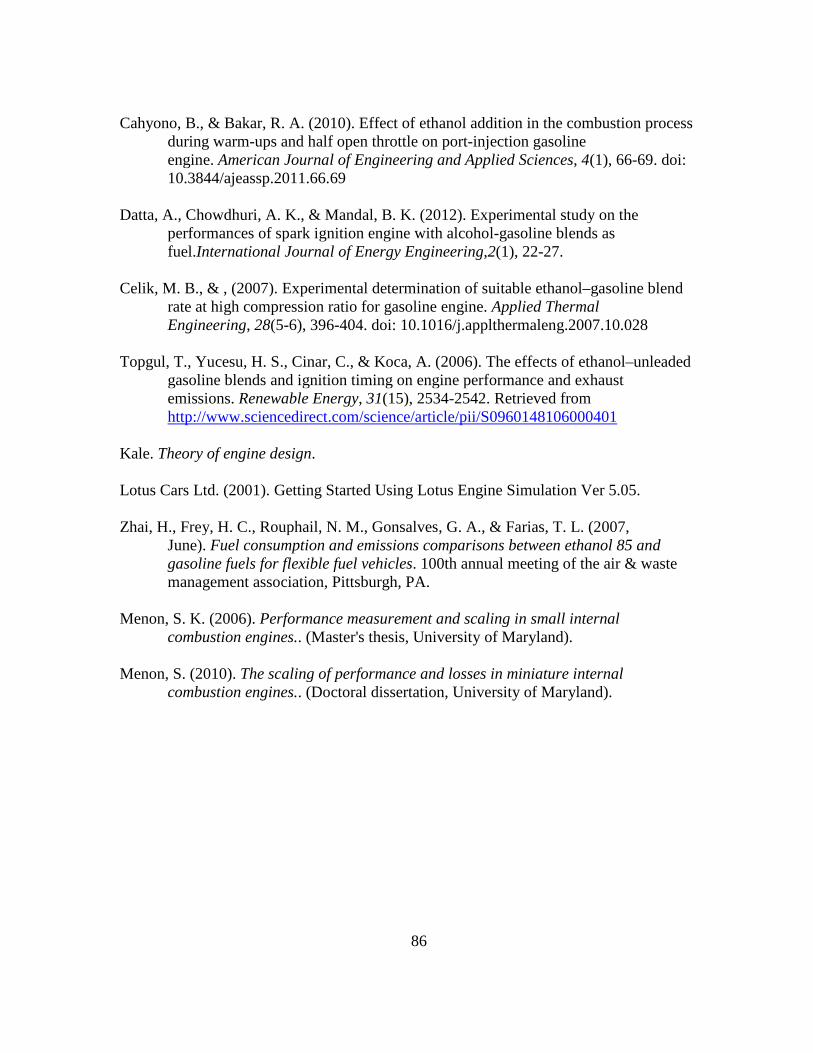
86
Cahyono, B., & Bakar, R. A. (2010). Effect of ethanol addition in the combustion process
during warm-ups and half open throttle on port-injection gasoline engine. American Journal of Engineering and Applied Sciences, 4(1), 66-69. doi: 10.3844/ajeassp.2011.66.69
Datta, A., Chowdhuri, A. K., & Mandal, B. K. (2012). Experimental study on the
performances of spark ignition engine with alcohol-gasoline blends as fuel.International Journal of Energy Engineering,2(1), 22-27.
Celik, M. B., & , (2007). Experimental determination of suitable ethanol–gasoline blend
rate at high compression ratio for gasoline engine. Applied Thermal Engineering, 28(5-6), 396-404. doi: 10.1016/j.applthermaleng.2007.10.028
Topgul, T., Yucesu, H. S., Cinar, C., & Koca, A. (2006). The effects of ethanol–unleaded
gasoline blends and ignition timing on engine performance and exhaust emissions. Renewable Energy, 31(15), 2534-2542. Retrieved from http://www.sciencedirect.com/science/article/pii/S0960148106000401
Kale. Theory of engine design. Lotus Cars Ltd. (2001). Getting Started Using Lotus Engine Simulation Ver 5.05.
Zhai, H., Frey, H. C., Rouphail, N. M., Gonsalves, G. A., & Farias, T. L. (2007,
June). Fuel consumption and emissions comparisons between ethanol 85 and gasoline fuels for flexible fuel vehicles. 100th annual meeting of the air & waste management association, Pittsburgh, PA.
Menon, S. K. (2006). Performance measurement and scaling in small internal
combustion engines.. (Master's thesis, University of Maryland). Menon, S. (2010). The scaling of performance and losses in miniature internal
combustion engines.. (Doctoral dissertation, University of Maryland).

87
APPENDIX A
COMMON LES SOFTWARE TEST CONDITIONS
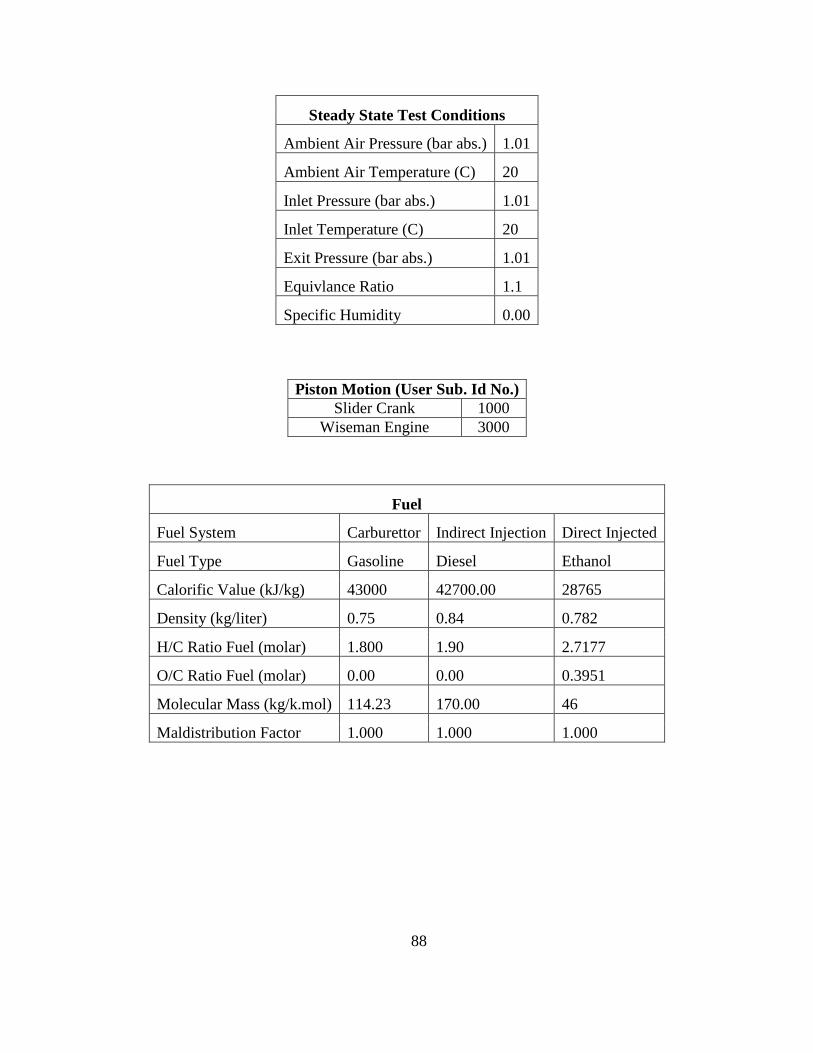
88
Steady State Test Conditions
Ambient Air Pressure (bar abs.) 1.01
Ambient Air Temperature (C) 20
Inlet Pressure (bar abs.) 1.01
Inlet Temperature (C) 20
Exit Pressure (bar abs.) 1.01
Equivlance Ratio 1.1
Specific Humidity 0.00
Fuel
Fuel System Carburettor Indirect Injection Direct Injected
Fuel Type Gasoline Diesel Ethanol
Calorific Value (kJ/kg) 43000 42700.00 28765
Density (kg/liter) 0.75 0.84 0.782
H/C Ratio Fuel (molar) 1.800 1.90 2.7177
O/C Ratio Fuel (molar) 0.00 0.00 0.3951
Molecular Mass (kg/k.mol) 114.23 170.00 46
Maldistribution Factor 1.000 1.000 1.000
Piston Motion (User Sub. Id No.) Slider Crank 1000
Wiseman Engine 3000

89
APPENDIX B
30 cc LES MODEL INPUT PARAMETERS
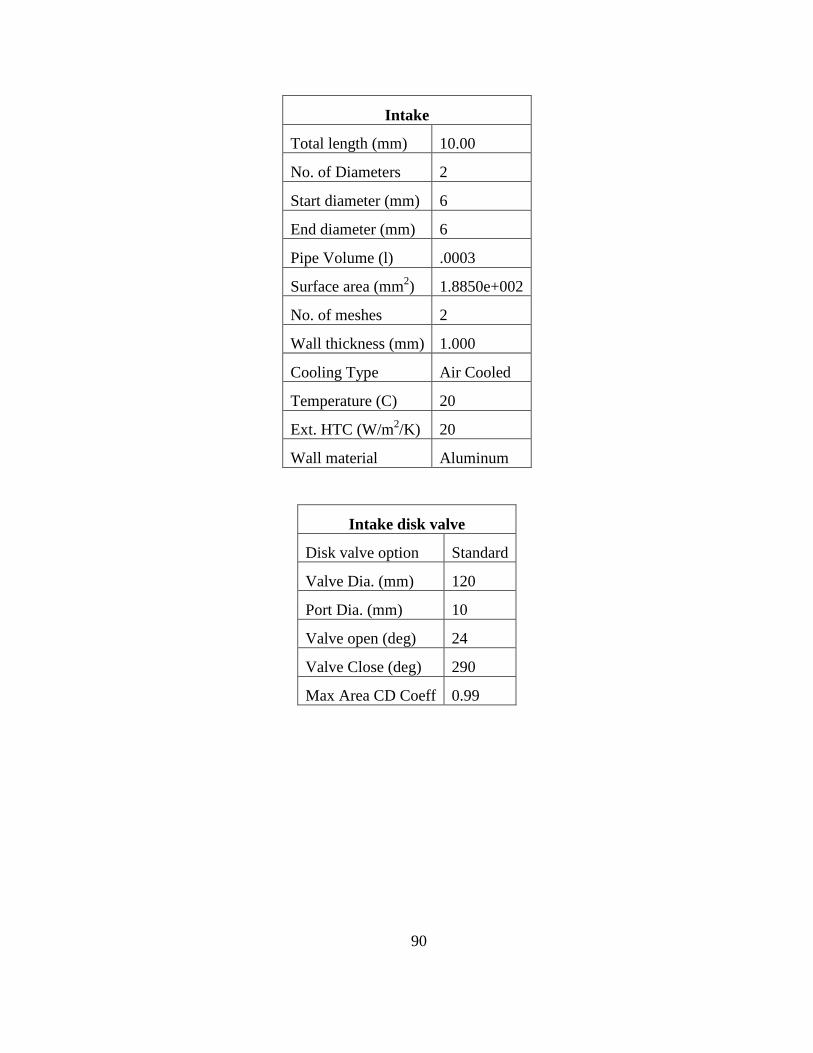
90
Intake
Total length (mm) 10.00
No. of Diameters 2
Start diameter (mm) 6
End diameter (mm) 6
Pipe Volume (l) .0003
Surface area (mm2) 1.8850e+002
No. of meshes 2
Wall thickness (mm) 1.000
Cooling Type Air Cooled
Temperature (C) 20
Ext. HTC (W/m2/K) 20
Wall material Aluminum
Intake disk valve
Disk valve option Standard
Valve Dia. (mm) 120
Port Dia. (mm) 10
Valve open (deg) 24
Valve Close (deg) 290
Max Area CD Coeff 0.99

91
Inlet Variable Volume Plenum
Equiv. Bore (mm) 35.94
Equiv. Stroke (mm) 28.45
Equiv. Rod Length (mm) 56.00
Equiv Compression Ratio (PCR) 1.60
TDC Angle (deg) 180
Wall Temperature (C) 100
Plenum HTC (W/m2/K) 5.00
Speed Ratio 1.000
Piston Ported Intake Valve
Valve Option Standard
Port Width (mm) 40.00
Max. Port Height (mm) 2.00
Stroke (mm) 28.45
Rod Length (mm) 56.00
Valve Open (deg) 124.00
Max Area CD Coeff 0.900

92
Cylinder
Bore (mm) 35.94
Stroke (mm) 28.45
Cyl Swept Volume (l) .02886
Total Swept Volume (l) .02866
Con-rod Length (mm) 56.00
Pin Off-Set (mm) 0
Compression Ratio 8
Clearance Volume (l) .004123
Phase (ATDC) 0.00
Piston Ported Exhaust
Port Width (mm) 20.82
Max. Port Height (mm) 7.41
Stroke (mm) 28.45
Rod Length (mm) 56.00
Valve Open (deg) 108.00
Max Area CD Coeff 0.900

93
Exhaust pipe
Total Length (mm) 30.00
No. of diameters 2
Start diameter (mm) 11.00
End Diameter (mm) 11.00
Pipe Volume (l) .0029
Surface Area (mm2) 1.0367e+003
No. of Meshes 2
Wall Thickness (mm) 1.000
Cooling Type Air Cooled
Temperature (C) 20.00
Ext. HTC (W/m2/K) 20.00
Wall Material Aluminum

94
APPENDIX C
30 cc DIESEL LES MODEL INPUT PARAMETERS

95
Intake area to plenum
Throttle Type Simple Area
Discharge Data Type CF Fixed Value
Discharge Directionality Common
Discharge CF 1.00
Minimum C.S.A (mm2) 28.33
Equivalent Diameter (mm) 3.006
Single intake plenum
Volumt (litres) 0.0289
Surface Area (mm2) 4.5503e+003
Wall Temperature (oC) 20.00
Plenum HTC (W/m2/K) 0.00
Intake port
No. of Valves 1
Valve Throat Dia (mm) 17.236
Port Type User Curve (common)
Intake Valve
Valve Open (deg) 12.00
Valve Close (deg) 58.00
Dwell at Max (deg) 0.0
Max Lift (mm) 5.602
MOP (deg) 113.00
Lift Option User Specified Valve Lift
Data Action Scale

96
Cylinder
Bore (mm) 35.94
Stroke (mm) 28.45
Cyl. Swept Volume (l) 0.02886
Total Swept Volume (l) 0.02886
Con-rod Length (mm) 56
Pin Off-set (mm) 0.00
Compression Ratio 17
Clearance Volume (l) 0.001804
Exhaust Valve
Valve Open (deg) 58.00
Valve Close (deg) 12.00
Dwell at Max (deg) 0.0
Max Lift (mm) 5.602
MOP (deg) -113.00
Lift Option User Specified Valve Lift
Data Action Scale
Exhaust port
No. of Valves 1
Valve Throat Dia (mm) 14.421
Port Type User Curve (common)

97
Single exhaust plenum
Volumt (litres) 0.0115
Surface Area (mm2) 2.4703e+003
Wall Temperature (oC) 500.00
Plenum HTC (W/m2/K) 0.00
Exit area from plenum
Throttle Type Simple Area
Discharge Data Type CF Fixed Value
Discharge Directionality Common
Discharge CF 1.00
Minimum C.S.A (mm2) 26.59
Equivalent Diameter (mm) 5.819

98
APPENDIX D
GUNT LES MODEL INPUT PARAMETERS
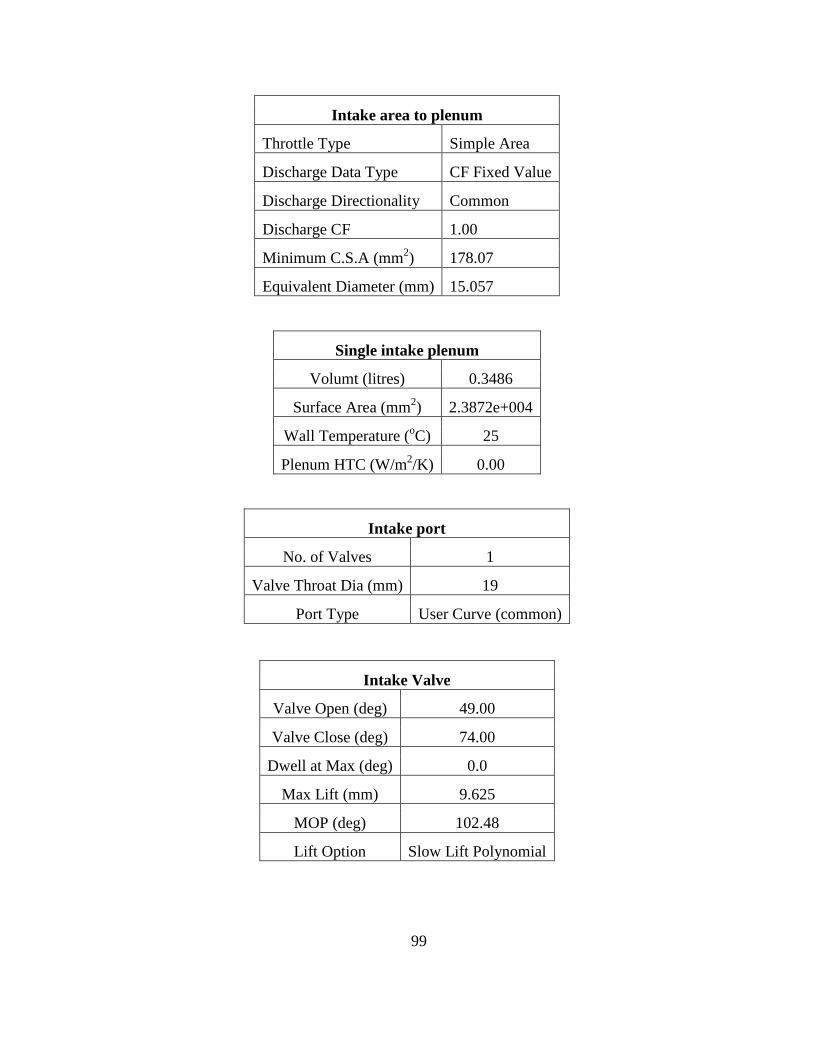
99
Intake area to plenum
Throttle Type Simple Area
Discharge Data Type CF Fixed Value
Discharge Directionality Common
Discharge CF 1.00
Minimum C.S.A (mm2) 178.07
Equivalent Diameter (mm) 15.057
Single intake plenum
Volumt (litres) 0.3486
Surface Area (mm2) 2.3872e+004
Wall Temperature (oC) 25
Plenum HTC (W/m2/K) 0.00
Intake port
No. of Valves 1
Valve Throat Dia (mm) 19
Port Type User Curve (common)
Intake Valve
Valve Open (deg) 49.00
Valve Close (deg) 74.00
Dwell at Max (deg) 0.0
Max Lift (mm) 9.625
MOP (deg) 102.48
Lift Option Slow Lift Polynomial

100
Cylinder
Bore (mm) 80.00
Stroke (mm) 69.00
Cyl. Swept Volume (l) 0.34683
Total Swept Volume (l) 0.34683
Con-rod Length (mm) 103.00
Pin Off-set (mm) 0.00
Compression Ratio 21.50
Clearance Volume (l) 0.016919
Exhaust Valve
Valve Open (deg) 76.00
Valve Close (deg) 39.00
Dwell at Max (deg) 0.0
Max Lift (mm) 9.625
MOP (deg) -108.52
Lift Option Slow Lift Polynomial
Exhaust port
No. of Valves 1
Valve Throat Dia (mm) 19.10
Port Type User Curve (common)
Single exhaust plenum
Volumt (litres) 0.1387
Surface Area (mm2) 1.2960e+004
Wall Temperature (oC) 500.00
Plenum HTC (W/m2/K) 0.00

101
Exit area from plenum
Throttle Type Simple Area
Discharge Data Type CF Fixed Value
Discharge Directionality Common
Discharge CF 1.00
Minimum C.S.A (mm2) 164.34
Equivalent Diameter (mm) 14.465

102
APPENDIX E
10 HP/ 20 HP/ 30 HP GASOLINE AND ETHANOL MODEL INPUT
PARAMETERS

103
Intake area to plenum
Throttle Type Simple Area
Discharge Data Type CF Fixed Value
Discharge Directionality Common
Discharge CF 1.00
Minimum C.S.A (mm2) 224.36/ 448.71/ 673.07
Equivalent Diameter (mm) 16.902/ 23.902/ 29.274
Single intake plenum
Volumt (litres) 0.80/ 1.60/ 2.40
Surface Area (mm2) 4.1675e+004/ 6.6155e+004/ 8.6688e+004
Wall Temperature (oC) 20/ 20/ 20
Plenum HTC (W/m2/K) 0.00
Intake port
No. of Valves 1
Valve Throat Dia (mm) 26/ 40.504/ 53.00
Port Type Default Poor Port
Intake Valve
Valve Open (deg) 12.00/ 12.00/ 12.00
Valve Close (deg) 58.00/ 58.00/ 58.00
Dwell at Max (deg) 0.0
Max Lift (mm) 9.625/ 9.625/ 9.625
MOP (deg) 113.00/ 113.00/ 113.00
Lift Option Fast Lift Polynomial

104
Cylinder
Bore (mm) 94.67/ 119.44/ 134.87
Stroke (mm) 113.64/ 142.80/ 168.00
Cyl. Swept Volume (l) 0.79992/ 1.59999/ 2.40010
Total Swept Volume (l) 0.79992/ 1.59999/ 2.40010
Con-rod Length (mm) 170.46/ 214.20/ 252.00
Pin Off-set (mm) 0.00
Compression Ratio 8 (Gas) & 13 (Ethanol)
Clearance Volume (l) 0.114274/ 0.228570/ 0.342872
Exhaust Valve
Valve Open (deg) 58.00/ 58.00/ 58.00
Valve Close (deg) 12.00/ 12.00/ 12.00
Dwell at Max (deg) 0.0
Max Lift (mm) 9.625/ 9.625/ 9.625
MOP (deg) -113.00/ -113.00/ -113.00
Lift Option Fast Lift Polynomial
Exhaust port
No. of Valves 1
Valve Throat Dia (mm) 22.00/ 33.888/ 42.00
Port Type Default Poor Port
Single exhaust plenum
Volumt (litres) 0.32/ 0.64/ 0.96
Surface Area (mm2) 2.2625e+004/ 3.5915e+004/ 4.7061e+004
Wall Temperature (oC) 500.00/ 500.00/ 500.00
Plenum HTC (W/m2/K) 0.00

105
Exit area from plenum
Throttle Type Simple Area
Discharge Data Type CF Fixed Value
Discharge Directionality Common
Discharge CF 1.00
Minimum C.S.A (mm2) 210.59/ 421.19/ 631.78
Equivalent Diameter (mm) 16.375/ 23.158/ 28.362

106
APPENDIX F
10 HP/ 20 HP/ 30 HP DIESEL MODEL INPUT PARAMETERS

107
Intake area to plenum
Throttle Type Simple Area
Discharge Data Type CF Fixed Value
Discharge Directionality Common
Discharge CF 1.00
Minimum C.S.A (mm2) 224.36/ 448.71/ 673.07
Equivalent Diameter (mm) 16.902/ 23.902/ 29.274
Single intake plenum
Volumt (litres) 0.80/ 1.60/ 2.40
Surface Area (mm2) 4.1675e+004/ 6.6155e+004/ 8.6688e+004
Wall Temperature (oC) 20/ 20/ 20
Plenum HTC (W/m2/K) 0.00
Intake port
No. of Valves 1
Valve Throat Dia (mm) 24/ 34.00/ 41.00
Port Type Default Poor Port
Intake Valve
Valve Open (deg) 12.00/ 12.00/ 12.00
Valve Close (deg) 58.00/ 58.00/ 58.00
Dwell at Max (deg) 0.0
Max Lift (mm) 9.625/ 9.625/ 9.625
MOP (deg) 113.00/ 113.00/ 113.00
Lift Option Fast Lift Polynomial
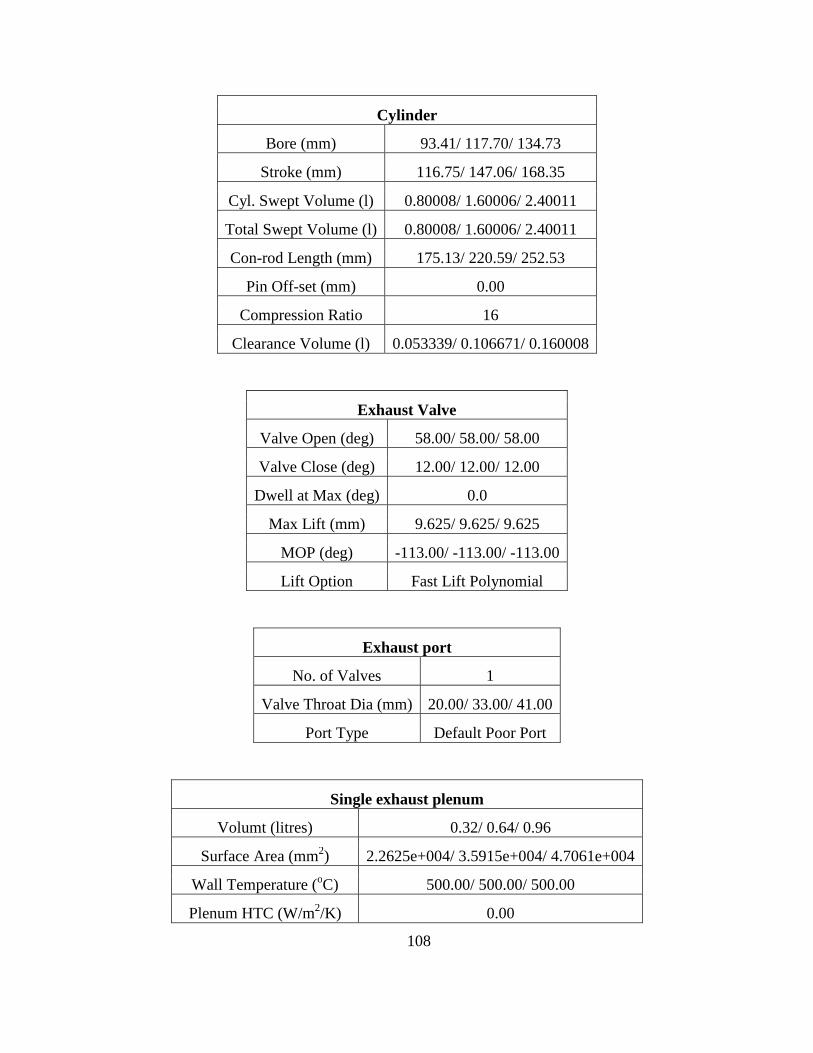
108
Cylinder
Bore (mm) 93.41/ 117.70/ 134.73
Stroke (mm) 116.75/ 147.06/ 168.35
Cyl. Swept Volume (l) 0.80008/ 1.60006/ 2.40011
Total Swept Volume (l) 0.80008/ 1.60006/ 2.40011
Con-rod Length (mm) 175.13/ 220.59/ 252.53
Pin Off-set (mm) 0.00
Compression Ratio 16
Clearance Volume (l) 0.053339/ 0.106671/ 0.160008
Exhaust Valve
Valve Open (deg) 58.00/ 58.00/ 58.00
Valve Close (deg) 12.00/ 12.00/ 12.00
Dwell at Max (deg) 0.0
Max Lift (mm) 9.625/ 9.625/ 9.625
MOP (deg) -113.00/ -113.00/ -113.00
Lift Option Fast Lift Polynomial
Exhaust port
No. of Valves 1
Valve Throat Dia (mm) 20.00/ 33.00/ 41.00
Port Type Default Poor Port
Single exhaust plenum
Volumt (litres) 0.32/ 0.64/ 0.96
Surface Area (mm2) 2.2625e+004/ 3.5915e+004/ 4.7061e+004
Wall Temperature (oC) 500.00/ 500.00/ 500.00
Plenum HTC (W/m2/K) 0.00

109
Exit area from plenum
Throttle Type Simple Area
Discharge Data Type CF Fixed Value
Discharge Directionality Common
Discharge CF 1.00
Minimum C.S.A (mm2) 210.59/ 421.19/ 631.78
Equivalent Diameter (mm) 16.375/ 23.158/ 28.362