peer-to-peer carsharing: short-term effects on travel
TRANSCRIPT
Portland State University Portland State University
PDXScholar PDXScholar
TREC Final Reports Transportation Research and Education Center (TREC)
5-2017
Peer-To-Peer Carsharing: Short-Term Effects on Peer-To-Peer Carsharing: Short-Term Effects on
Travel Behavior in Portland, OR Travel Behavior in Portland, OR
Jennifer Dill Portland State University, [email protected]
Nathan McNeil Portland State University
Steven Howland Portland State University
Follow this and additional works at: https://pdxscholar.library.pdx.edu/trec_reports
Part of the Transportation Commons, Transportation Engineering Commons, Urban Studies
Commons, and the Urban Studies and Planning Commons
Let us know how access to this document benefits you.
Recommended Citation Recommended Citation Dill, Jennifer, Nathan McNeil and Steven Howland. Peer-To-Peer Carsharing: Short-Term Effects on Travel Behavior in Portland, OR. TREC-RR-1144. Portland, OR: Transportation Research and Education Center (TREC), 2017. https://doi.org/10.15760/trec.172
This Report is brought to you for free and open access. It has been accepted for inclusion in TREC Final Reports by an authorized administrator of PDXScholar. Please contact us if we can make this document more accessible: [email protected].
Peer-To-Peer Carsharing: Short-term effects on travel behavior
in Portland, OR
FINAL REPORT
TREC-RR-1144 August 2017TREC is the Transportation Research and Education Center at Portland State University.
PEER-TO-PEER CARSHARING:
SHORT-TERM EFFECTS ON TRAVEL BEHAVIOR IN PORTLAND, OR
Final Report
by
Jennifer Dill, Ph.D. Nathan McNeil Steven Howland
TREC Portland State University
for
Value Pricing Pilot Program Federal Highway Administration
U.S. Department of Transportation
August 2017

Technical Report Documentation Page 1. Report No.
TREC-RR-1144
2. Government Accession No.
3. Recipient’s Catalog No.
4. Title and Subtitle Peer-To-Peer Carsharing: Short-term effects on travel behavior in Portland, OR
5. Report Date August 2017
6. Performing Organization Code
7. Author(s) Jennifer Dill, Ph.D., Nathan McNeil, Steven Howland
8. Performing Organization Report No.
9. Performing Organization Name and Address Jennifer Dill Portland State University, PO Box 751, Portland, OR 97207-0751
10. Work Unit No. (TRAIS)
11. Contract or Grant No. ODOT Subgrant Agreement No. 28382 FHWA Cooperative Agreement No. 28286
12. Sponsoring Agency Name and Address Oregon Department of Transportation 123 NW Flanders St., Portland, OR 97209 Federal Highway Administration, Value Pricing Pilot Program 1200 New Jersey Ave SE, Washington, DC 20590
13. Type of Report and Period Covered Final report 4/2/2012-12/12/2015
14. Sponsoring Agency Code
15. Supplementary Notes
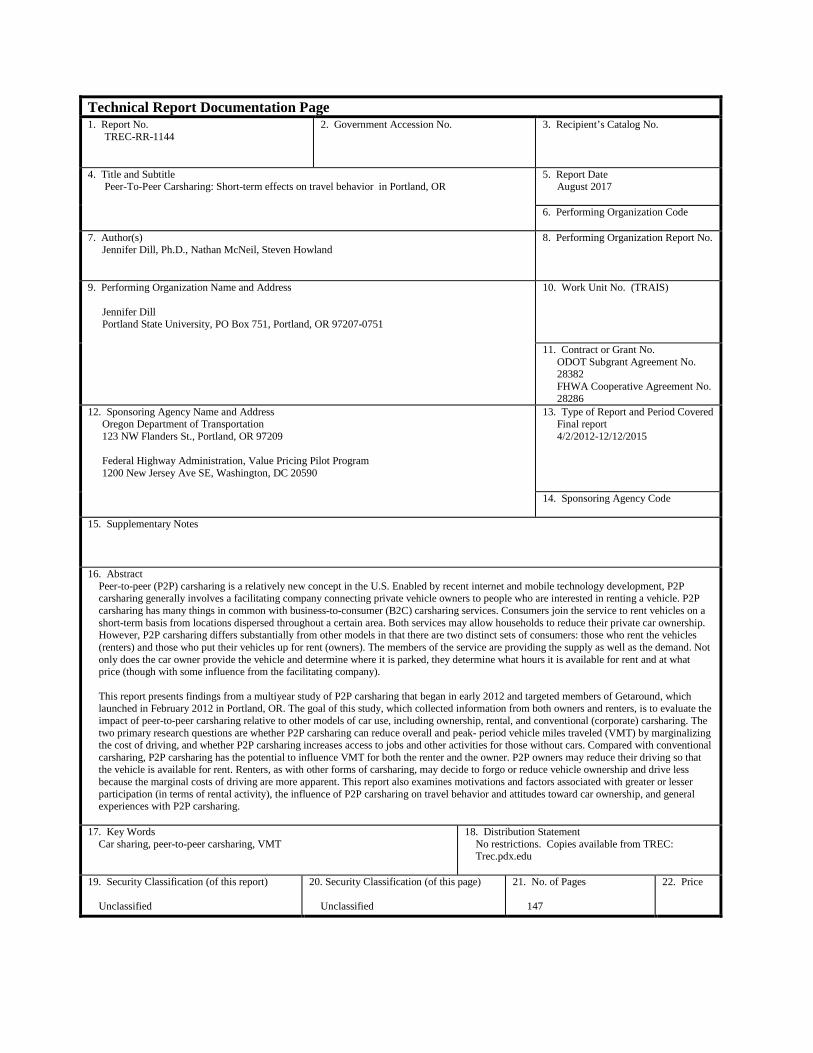
16. Abstract Peer-to-peer (P2P) carsharing is a relatively new concept in the U.S. Enabled by recent internet and mobile technology development, P2P carsharing generally involves a facilitating company connecting private vehicle owners to people who are interested in renting a vehicle. P2P carsharing has many things in common with business-to-consumer (B2C) carsharing services. Consumers join the service to rent vehicles on a short-term basis from locations dispersed throughout a certain area. Both services may allow households to reduce their private car ownership. However, P2P carsharing differs substantially from other models in that there are two distinct sets of consumers: those who rent the vehicles (renters) and those who put their vehicles up for rent (owners). The members of the service are providing the supply as well as the demand. Not only does the car owner provide the vehicle and determine where it is parked, they determine what hours it is available for rent and at what price (though with some influence from the facilitating company). This report presents findings from a multiyear study of P2P carsharing that began in early 2012 and targeted members of Getaround, which launched in February 2012 in Portland, OR. The goal of this study, which collected information from both owners and renters, is to evaluate the impact of peer-to-peer carsharing relative to other models of car use, including ownership, rental, and conventional (corporate) carsharing. The two primary research questions are whether P2P carsharing can reduce overall and peak- period vehicle miles traveled (VMT) by marginalizing the cost of driving, and whether P2P carsharing increases access to jobs and other activities for those without cars. Compared with conventional carsharing, P2P carsharing has the potential to influence VMT for both the renter and the owner. P2P owners may reduce their driving so that the vehicle is available for rent. Renters, as with other forms of carsharing, may decide to forgo or reduce vehicle ownership and drive less because the marginal costs of driving are more apparent. This report also examines motivations and factors associated with greater or lesser participation (in terms of rental activity), the influence of P2P carsharing on travel behavior and attitudes toward car ownership, and general experiences with P2P carsharing.
17. Key Words Car sharing, peer-to-peer carsharing, VMT
18. Distribution Statement No restrictions. Copies available from TREC: Trec.pdx.edu
19. Security Classification (of this report) Unclassified
20. Security Classification (of this page) Unclassified
21. No. of Pages 147
22. Price
Acknowledgements
This study was funded with a grant from the Federal Highway Administration (FHWA) Value Pricing Pilot Program (VPPP). The Oregon Department of Transportation (ODOT) administered the grant. The City of Portland Bureau of Transportation (PBOT) and Getaround served as key partners in the project, providing in-kind administrative, operational and promotional support. Portland State University students contributing to the project included Jennifer Koch, Anaïs Mathez, Chris Brooks, William Roberts, and Joseph Broach.
Disclaimer
The contents of this report reflect the views of the authors, who are solely responsible for the facts and the accuracy of the material and information presented herein.
Recommended Citation
Dill, Jennifer, Nathan McNeil and Steven Howland. Peer-To-Peer Carsharing: Short-term effects on travel behavior in Portland, OR. TREC-RR-1144. Portland, OR: Transportation Research and Education Center (TREC), 2017.
Peer-to-Peer Carsharing: Short-term effects on travel behavior Page i
TABLE OF CONTENTS Table of Contents ........................................................................................................................................... i
List of Tables ............................................................................................................................................... iii
List of Figures .............................................................................................................................................. vi
Executive Summary .................................................................................................................................... vii
Executive Summary - Background ......................................................................................................... vii
Executive Summary - Study Methodology ............................................................................................. vii
Executive Summary - Owner Key Findings .......................................................................................... viii
Executive Summary - Renter Key Findings ............................................................................................ ix
Executive Summary - Research Challenges ............................................................................................ xi
1 Background ........................................................................................................................................... 1
1.1 Peer-to-Peer Carsharing in Portland ............................................................................................. 1
1.2 Research Questions ....................................................................................................................... 3
2 Existing Research .................................................................................................................................. 5
2.1 Traditional Carsharing .................................................................................................................. 5
2.2 Peer-to-Peer Carsharing ................................................................................................................ 6
2.3 Sharing Economy More Broadly .................................................................................................. 8
3 Methodology ......................................................................................................................................... 9
3.1 Overview ....................................................................................................................................... 9
3.2 Survey Design ............................................................................................................................. 10
3.3 Participant Recruitment and Participation .................................................................................. 16
3.4 Data from Getaround .................................................................................................................. 23
3.5 Vehicle Carkit Data Analysis ...................................................................................................... 26
4 Owner Baseline Information ............................................................................................................... 28
4.1 Owner Completion of Study Milestones ..................................................................................... 28
4.2 Owner Demographic Information ............................................................................................... 28
4.3 Owner Household Car information ............................................................................................. 32
4.4 Owner Baseline Study Vehicle Data – Self-Report .................................................................... 32
4.5 Owner Six-Week Baseline Vehicle Usage .................................................................................. 34
4.6 Owner Baseline Vehicle Usage Data – Self Report .................................................................... 38
4.7 Owner Attitudes .......................................................................................................................... 40
4.8 Reason for Joining and Anticipated Uses of Peer-to-Peer Carsharing ........................................ 43
5 Renter Baseline Information ............................................................................................................... 46
5.1 Completion of Study Milestones................................................................................................. 46
Peer-to-Peer Carsharing: Short-term effects on travel behavior Page ii
5.2 Demographic Information ........................................................................................................... 46
5.3 Household Car information ......................................................................................................... 50
5.4 Renter Baseline Attitudes............................................................................................................ 51
5.5 Anticipated Uses of Peer-to-Peer Carsharing ............................................................................. 54
6 Findings: Owners ................................................................................................................................ 56
6.1 How Often Were the Owners’ Vehicles Rented? ....................................................................... 56
6.2 How Did Vehicle Use Change According to Recorded Data? ................................................... 58
6.3 How Did Vehicle Use Change According to Owner Surveys? ................................................... 72
6.4 Findings from Owner Interviews ................................................................................................ 82
6.5 What Was the Owner Experience with P2P Carsharing? ........................................................... 89
6.6 Owner Sharing Experience More Broadly .................................................................................. 97
6.7 Study Exiters ............................................................................................................................... 98
7 Findings: Renters .............................................................................................................................. 103
7.1 How Renter Participants Used Getaround ................................................................................ 103
7.2 Experience With the Peer-to-Peer Carsharing Model ............................................................... 107
7.3 Impact on Car Ownership ......................................................................................................... 115
7.4 Sharing Experience More Broadly ............................................................................................ 118
8 Findings: Peak-Period Freeway Use ................................................................................................. 121
8.1 Overall Peak-Period Freeway Use ............................................................................................ 121
8.2 Change in Peak-Period Freeway Use ........................................................................................ 122
9 Findings: Economic Opportunity ...................................................................................................... 124
10 Conclusions ................................................................................................................................... 133
10.1 Owner Key findings .................................................................................................................. 133
10.2 Renter Key Findings ................................................................................................................. 134
10.3 Research Challenges ................................................................................................................. 135
11 References and Relevant Resources ............................................................................................. 137
12 Appendix ....................................................................................................................................... 141
12.1 Review of Owner Incentive Structures in P2P Study Outcomes .............................................. 141
12.2 “Instant” Model ......................................................................................................................... 144
Peer-to-Peer Carsharing: Short-term effects on travel behavior Page iii
LIST OF TABLES Table 1 Renter Interim Survey Questions ................................................................................................... 15 Table 2 Owner Participant Incentive Schemes ........................................................................................... 20 Table 3 Owner Interview Recruitment ........................................................................................................ 21 Table 4 Renter Interim Survey Rounds ....................................................................................................... 22 Table 5 Owner Participant Age Group ....................................................................................................... 29 Table 6 Owner Participant Gender.............................................................................................................. 29 Table 7 Owner Participant Income Category .............................................................................................. 30 Table 8 Owner Participant Education Level ............................................................................................... 30 Table 9 Owner Participant Race and Ethnicity ........................................................................................... 31 Table 10 Owner Participants – Number of People in Household ............................................................... 32 Table 11 Number of Motor Vehicles in Study Participant Households ...................................................... 32 Table 12 Baseline Study Vehicle Use Terms .............................................................................................. 35 Table 13 Baseline Vehicle Use ................................................................................................................... 36 Table 14 Baseline Vehicle Use by Number of Children in the Household ................................................. 36 Table 15 Baseline Vehicle Use by Number of Vehicles in Household ...................................................... 37 Table 16 Baseline Vehicle Use by Income ................................................................................................. 38 Table 17 Study Vehicle Self-Reported Usage ............................................................................................ 39 Table 18 Correlations between Actual Vehicle Use and Stated Vehicle Importance by Travel Type ....... 40 Table 19 Baseline Owner Attitudes Toward Transportation Modes........................................................... 41 Table 20 Baseline Owner Attitudes on Transportation ............................................................................... 42 Table 21 Owner – Reasons for Joining Getaround ..................................................................................... 44 Table 22 Owners – Self-Reported Anticipated Behavior Change .............................................................. 45 Table 23 Age by Participation Status – Renters.......................................................................................... 47 Table 24 Gender by Participation Status – Renters .................................................................................... 48 Table 25 Income by Participation Status – Renters .................................................................................... 48 Table 26 Education by Participation Status – Renters ................................................................................ 48 Table 27 Race and Ethnicity by Participation Status – Renters .................................................................. 49 Table 28 Household Composition by Participation Status – Renters ......................................................... 50 Table 29 Renter Households – Number of Motor Vehicles ........................................................................ 50 Table 30 Renters with Cars in HH – Vehicle Self-Reported Usage ........................................................... 51 Table 31 Renters with Cars in HH – Self-Reported Importance of Primary Vehicle ................................. 51 Table 32 Baseline Attitudes Toward Travel Modes – Renters ................................................................... 52 Table 33 Baseline Attitudes on Transportation Behavior – Renters ........................................................... 53 Table 34 Renter Motivations for Joining P2P Carsharing .......................................................................... 54 Table 35 Renter Anticipated Trip Purposes ................................................................................................ 55 Table 36 Rentals by Owner Vehicle ........................................................................................................... 57 Table 37 Rental Income by Owner ............................................................................................................. 58 Table 38 Vehicle Use Terms New to this Section ...................................................................................... 59 Table 39 Share of Total Trips and Minutes Over Time – Overall and Owner-Only .................................. 60 Table 40 Vehicle Use over Time – Overall and Owner-Only..................................................................... 61 Table 41 Vehicle Use over Time – Owners with Rentals – Overall ........................................................... 64 Table 42 Vehicle Use over Time – Owners with and without Rentals, Owner Travel Only ...................... 65 Table 43 Peak-Period Travel Time/Day Changes between Baseline and Post-Periods – Total ................. 67 Table 44 Peak-Period Travel Time/Day Changes between Baseline and Post-Periods – Owner Travel Only ............................................................................................................................................................ 68
Peer-to-Peer Carsharing: Short-term effects on travel behavior Page iv
Table 45 Demographic Comparisons for Changes in Peak-Period Travel at Post-90 Days and Post One-Year ............................................................................................................................................................. 71 Table 46 Owner Self-Reported Change in Trip Planning ........................................................................... 72 Table 47 Owner Self-Reported Change in Travel Behavior and Modes .................................................... 73 Table 48 Changes in Peak-Period Driving – Stated vs. Observed .............................................................. 74 Table 49 Anticipated Changes Compared to Stated Actual Changes ......................................................... 75 Table 50 Owner – Change in Travel Behavior due to Getaround Listing – Coded Open Ended ............... 76 Table 51 Change in Frequency of Self-Reported Commute Mode, by Rental Frequency ......................... 77 Table 52 Change in Total Car Ownership – Owner Participants ................................................................ 78 Table 53 Car Ownership Transactions – Owner Participants ..................................................................... 78 Table 54 Change in Owner Attitudes toward Transportation Modes ......................................................... 79 Table 55 Change in Owner Attitudes on Transportation ............................................................................ 80 Table 56 Change in Opinions on Owning a Car ......................................................................................... 82 Table 57 Owner – Best Thing about Peer-to-peer Carsharing .................................................................... 90 Table 58 Owner – Worst Thing about Peer-to-peer Carsharing – Coded Open-Ended Question .............. 91 Table 59 Owner Statements about Participating in P2P Carsharing – Agreement ..................................... 92 Table 60 Share of Vehicle Expenses Covered by Rentals .......................................................................... 93 Table 61 Owner – Rental Pickup Locations Used ...................................................................................... 93 Table 62 Owners – Stated Reasons for Not Accepting Rentals .................................................................. 94 Table 63 Owner – Instant Model Participation ........................................................................................... 94 Table 64 How to Improve Peer-to-peer Carsharing – Coded Open-Ended Question ................................. 95 Table 65 Owner Experience with Vehicle Damage .................................................................................... 96 Table 66 Owner – Sharing Economy Participation..................................................................................... 97 Table 67 Owner – Sharing Economy Questions ......................................................................................... 98 Table 68 Reason for Removing Listing from Getaround Website – Coded Open Ended .......................... 99 Table 69 Reason for Having Carkit Removed from Vehicle – Coded Open Ended ................................. 100 Table 70 Self-Reported Change in Travel Behavior – Exiters vs. Non-Exiters ....................................... 101 Table 71 Change in Various Travel Activities – Exiters vs Non-Exiters ................................................. 101 Table 72 Agreement with Statements about Getaround Experience – Exiters vs Non-Exiters ................ 102 Table 73 Renter Trip Purpose – Individually Surveyed Rentals ............................................................... 104 Table 74 Renter Trip Purpose – Final Survey ........................................................................................... 105 Table 75 Without Getaround, How Would You Have Made This Trip Previously? ................................ 105 Table 76 Trip Alternatives by Trip Type .................................................................................................. 106 Table 77 Consider the Usefulness of Getaround to You Over the Past Year ........................................... 107 Table 78 How Important are the Following Factors to You in Deciding Which Vehicle to Request? ..... 108 Table 79 Getaround Rentals – Reason for Selecting Specific Vehicle ..................................................... 108 Table 80 Consider the People From Whom You Have Rented a Car. ...................................................... 109 Table 81 Getaround Rentals – Satisfaction with Vehicle and Process ..................................................... 109 Table 82 Since Participating as a Renter Through Getaround .................................................................. 110 Table 83 Experience with Instant Rental .................................................................................................. 111 Table 84 Coding of Renter Open Ended Best Thing about P2P ............................................................... 112 Table 85 Coding of Renter Open Ended Worst Thing about P2P ............................................................ 113 Table 86 Coding of Renter Overall Experiences ...................................................................................... 114 Table 87 Coding of Renter Open-Ended Question – How to Improve P2P ............................................. 115 Table 88 Renter – About Overall Influence of Carsharing Options ......................................................... 116 Table 89 Renters Who Do Not Own Cars – Opinions about Car Ownership ........................................... 117 Table 90 Renters Who Own Cars – Attitudes about Car Ownership ........................................................ 118
Peer-to-Peer Carsharing: Short-term effects on travel behavior Page v
Table 91 Sharing Participation – Renters ................................................................................................. 119 Table 92 Statements about Sharing – Renters .......................................................................................... 120 Table 93 Peak-Period Trips and Mileage Overall and on Freeways as a Share of All Trips .................... 121 Table 94 Peak-Period Freeway Use over Time: Total and Owner-Only Travel ....................................... 123 Table 95 Peak-Period Freeway Mileage per Day by Rental Activity for High-Use Freeway Participants .................................................................................................................................................................. 123
Peer-to-Peer Carsharing: Short-term effects on travel behavior Page vi
LIST OF FIGURES Figure 1 Commute Mode Share for Portland, OR ........................................................................................ 2 Figure 2 Participant Timeline ..................................................................................................................... 17 Figure 3 Email Sent to People Already Signed Up for Getaround at the Launch Date .............................. 18 Figure 4 Getaround Study Recruitment Webpage ...................................................................................... 19 Figure 5 Highway Volume and Speed per Day .......................................................................................... 26 Figure 6 Owner Study Milestones .............................................................................................................. 28 Figure 7 Study Vehicle Make (n=332) ....................................................................................................... 33 Figure 8 Study Vehicle Style and Ownership (n=332) ............................................................................... 33 Figure 9 Participant Listings by Vehicle Year ............................................................................................ 34 Figure 10 Mean Baseline Vehicle Importance Rating, Study Vehicle ....................................................... 39 Figure 11 Selected Owner Attitude Agreement – Percent Agreeing by Category ...................................... 43 Figure 12 Renter Milestone Completion ..................................................................................................... 46 Figure 13 Renter Participants by Rental Activity with Transit ................................................................... 47 Figure 14 P2P Study Vehicles by Rental Status with Transit ..................................................................... 57 Figure 15 Trip Time per Day – Overall and Owner-Only .......................................................................... 62 Figure 16 Trips per Day – Overall and Owner-Only .................................................................................. 63 Figure 17 Owner Travel Time per Day by Travel Category and Season Owner Started Study ................. 66 Figure 18 Gasoline Prices over the Study Period with the Number of Active Participants per Month ...... 67 Figure 19 Changes in Owner Rental Activity – High-Rental Owners ........................................................ 69 Figure 20 Distribution of Vehicles over Time by Owner Changes in Travel Minutes/Day ....................... 69 Figure 21 Distribution of the Percentage of Peak-Period Trips that Used the Freeway ........................... 122 Figure 22 Primary Rental Purpose by Renter Demographic Groups ........................................................ 127 Figure 23 Without Getaround, How Would You Have Made This Trip Previously? – By Rental Demographic Groups ................................................................................................................................ 129 Figure 24 P2P Study Vehicles by Rental Status with Other Carshare Services ....................................... 130 Figure 25 Renter Participants by Rental Activity with Other Carshare Services ..................................... 131 Figure 26 Low-Income, Non-Millennial Renters by Renter Activity with Other Carshare and Transit .. 132
Peer-to-Peer Carsharing: Short-term effects on travel behavior Page vii
EXECUTIVE SUMMARY
Executive Summary - Background
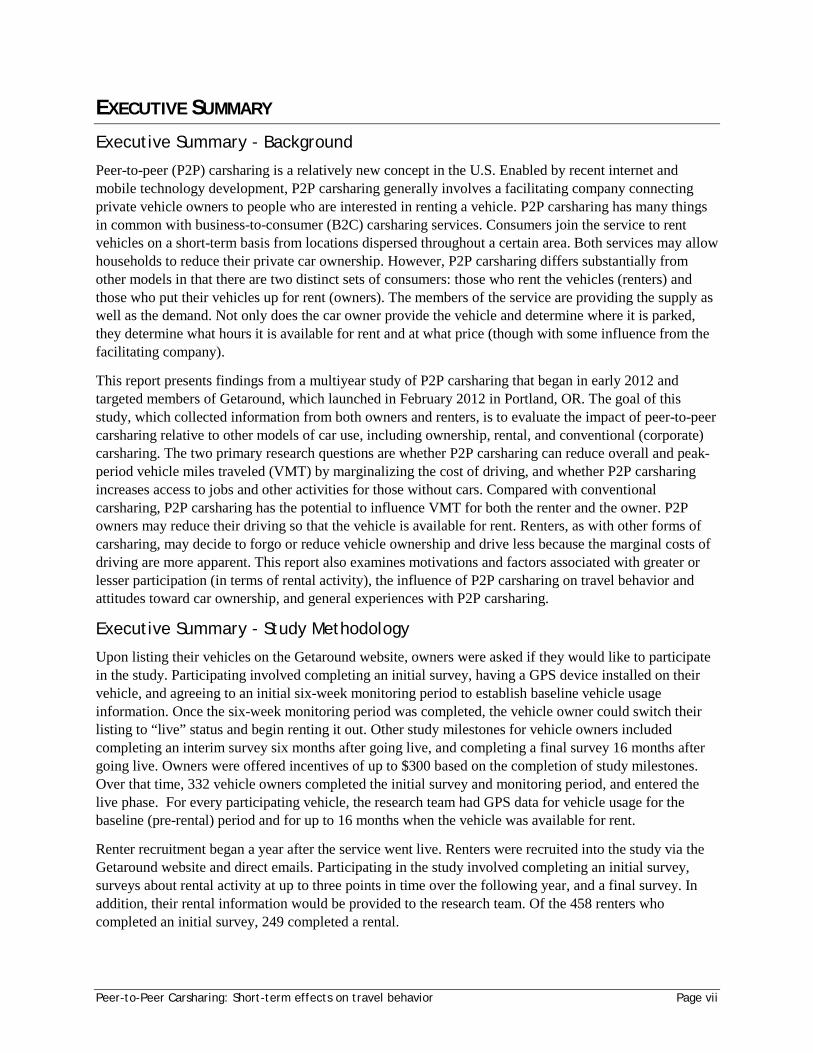
Peer-to-peer (P2P) carsharing is a relatively new concept in the U.S. Enabled by recent internet and mobile technology development, P2P carsharing generally involves a facilitating company connecting private vehicle owners to people who are interested in renting a vehicle. P2P carsharing has many things in common with business-to-consumer (B2C) carsharing services. Consumers join the service to rent vehicles on a short-term basis from locations dispersed throughout a certain area. Both services may allow households to reduce their private car ownership. However, P2P carsharing differs substantially from other models in that there are two distinct sets of consumers: those who rent the vehicles (renters) and those who put their vehicles up for rent (owners). The members of the service are providing the supply as well as the demand. Not only does the car owner provide the vehicle and determine where it is parked, they determine what hours it is available for rent and at what price (though with some influence from the facilitating company).
This report presents findings from a multiyear study of P2P carsharing that began in early 2012 and targeted members of Getaround, which launched in February 2012 in Portland, OR. The goal of this study, which collected information from both owners and renters, is to evaluate the impact of peer-to-peer carsharing relative to other models of car use, including ownership, rental, and conventional (corporate) carsharing. The two primary research questions are whether P2P carsharing can reduce overall and peak- period vehicle miles traveled (VMT) by marginalizing the cost of driving, and whether P2P carsharing increases access to jobs and other activities for those without cars. Compared with conventional carsharing, P2P carsharing has the potential to influence VMT for both the renter and the owner. P2P owners may reduce their driving so that the vehicle is available for rent. Renters, as with other forms of carsharing, may decide to forgo or reduce vehicle ownership and drive less because the marginal costs of driving are more apparent. This report also examines motivations and factors associated with greater or lesser participation (in terms of rental activity), the influence of P2P carsharing on travel behavior and attitudes toward car ownership, and general experiences with P2P carsharing.
Executive Summary - Study Methodology
Upon listing their vehicles on the Getaround website, owners were asked if they would like to participate in the study. Participating involved completing an initial survey, having a GPS device installed on their vehicle, and agreeing to an initial six-week monitoring period to establish baseline vehicle usage information. Once the six-week monitoring period was completed, the vehicle owner could switch their listing to “live” status and begin renting it out. Other study milestones for vehicle owners included completing an interim survey six months after going live, and completing a final survey 16 months after going live. Owners were offered incentives of up to $300 based on the completion of study milestones. Over that time, 332 vehicle owners completed the initial survey and monitoring period, and entered the live phase. For every participating vehicle, the research team had GPS data for vehicle usage for the baseline (pre-rental) period and for up to 16 months when the vehicle was available for rent.
Renter recruitment began a year after the service went live. Renters were recruited into the study via the Getaround website and direct emails. Participating in the study involved completing an initial survey, surveys about rental activity at up to three points in time over the following year, and a final survey. In addition, their rental information would be provided to the research team. Of the 458 renters who completed an initial survey, 249 completed a rental.
Peer-to-Peer Carsharing: Short-term effects on travel behavior Page viii
For both the renter and owner participants, the initial survey was designed to understand current travel behavior, motor-vehicle ownership, attitudes, demographic information, motivations for joining P2P carsharing, and how they intended to use the service. Interim and final surveys asked about changes related to travel behavior, vehicle ownership, transportation-related attitudes, and how the participant used the P2P service (and if they adapted their behavior).
In addition to the survey, rental activity, and GPS data collected from both owner and renter participants, we conducted in-depth interviews with 36 owners to better understand their experiences.
Executive Summary - Owner Key Findings
Overall owner driving changed little Overall, vehicle owners made very few changes to their driving behavior according to the GPS data. Including the rental activity, average use of the P2P vehicles was about eight minutes per day higher one year after the baseline, with most of that increase attributed to rental activity. The largest increases occurred during the weekend, when average daily use went from about 52 minutes to about 60 minutes a year later. Self-reported changes based on survey data confirm that many did not change their travel behavior much, either because they didn’t drive the vehicle much before the program or because they just didn’t change how they drove it. This is consistent with findings that a considerable portion of owner participants never rented out their vehicles (27%), or rented infrequently; 28% rented their vehicles out fewer than five times.
While overall owners did not reduce their peak-period driving, a subset (37%) did decrease their driving during weekday peak periods by 10% or more one year after the baseline. The level of rental activity likely influences changes in owner behavior. Overall, the vehicles in our study were not rented very often. Over one-quarter (27%) were not rented at all during the study period of over one year, while another 28% were rented less than five times. Only 22% of the vehicles were rented once a month or more. With this low volume of rental activity, it is not surprising that owners did not change their driving behavior significantly. However, there was some indication that owners with a higher number of rentals were slightly more likely to decrease their peak-period driving.
Peak-period freeway impacts Overall, we detected only very marginal changes in peak-period freeway driving. However, our results were limited by the fact that our sample of vehicle owners lived in the city of Portland, and most work in Portland as well. Our data showed only 2.3% of all owner trips occurred in the peak period and on a freeway. In contrast, people living in the suburban areas surrounding Portland might be more inclined to use freeways. Renters had a very marginal effect by increasing the share of peak-period trips that occurred on a freeway by one percentage point and the share of peak-period mileage on the freeways by less than two percentage points. The influence renters had on miles of freeway travel per day in the peak period was only about three miles more of peak-period freeway travel per 90-day period.
Some owners used P2P as a catalyst to change travel behavior Quite a few participants (28-32%) reported increased use of modes such as walking, bicycling and public transit. Interviews with owner participants, and survey responses, indicate that participation in P2P carsharing helped those who already wanted to make certain changes, such as driving less and taking other modes of transportation, to actually make those changes. Interviews confirmed that, among those who rented out their car often, a primary motivator was the desire to use that car less frequently in favor of other options.
Peer-to-Peer Carsharing: Short-term effects on travel behavior Page ix
Owner attitudes and vehicle rental activity Interviews with owner participants revealed that those who rented their vehicles out frequently were inclined to plan their schedules out in advance to either make their car available or to not depend on their car when a rental was requested. Further, they were not that concerned with things happening to their cars, or at least didn’t let it bother them that much. They also generally indicated positive customer service experiences when there were issues or damage to their vehicles. In contrast, owners who did not rent out their car often were more likely to deny rental requests, either because they were too busy, needed the car during the requested time, or wanted to keep open the option of using the car at all times (regardless of need). Many were also too concerned about potential damage to the vehicle and not knowing who was renting their car to go through with rentals.
Overall owner experiences with P2P carsharing Asked about what the best part of P2P carsharing was, owner participants most commonly cited the appeal of earning money. Other themes included being more efficient with existing resources, reducing the number of cars on the roads, and helping the environment. On a more local level, many people cited the positive aspect of helping other people in the community, meeting like-minded people and creating community, and supporting the local economy. On the negative side, participants cited the risk of having damage inflicted on their vehicle, and concerns about renters disrespecting the vehicle or the owner’s rules. Some respondents cited problems with the P2P technology or the system not functioning properly. Another common area of concern was the extra attention needed to keep the car ready for rentals, including keeping it fueled up and clean.
Questions about owner experiences with P2P carsharing revealed that most people agreed that the process works well enough, but are split on whether renting out their car is worthwhile based on the hassle incurred. This may be due in part to the sense that they do not get enough rental requests or that people want to rent their car when they want to use it themselves.
Executive Summary - Renter Key Findings
P2P rental trip purposes Of the 894 trips for which we received survey responses, 24% were primarily for out-of-town recreation, 21% were work-related, and 14% were for shopping or errands. The high percentage of rentals that were for work-related purposes was surprising; on the initial survey, renters had indicated that work-related trips would be one of the least likely purposes for their rentals. Many respondents used the vehicles for trip chaining; 47% of all trips had one or more secondary purposes listed. Shopping and/or errands were the most common secondary purpose, followed by transporting family, transporting friends, and in-town recreation.
How trips would have been taken without P2P Participants were also asked how they would have made the trip without the P2P service. According to the responses, about one-third of the trips would not have been taken otherwise, while about 20% would have been on public transportation, 19% via another carshare or rental service, and 22% would have borrowed a car or asked for a ride. Trips of choice or leisure, such as visiting friends or recreation-oriented trips, were the most likely to have not been made absent the service. Work-related trips, shopping and errands, and appointments were more likely to be made via public transportation absent the service.
Peer-to-Peer Carsharing: Short-term effects on travel behavior Page x
Overall renter experience with P2P carsharing In general, participants expressed positive views toward the impact of the P2P service. Nearly 90% agreed (strongly or somewhat) that the service allowed for increased flexibility in planning trips and was useful for running errands and transporting things. Around 85% agreed that it helped them to save money by not having to pay for a car (with 42% strongly agreeing), while 62% agreed that it helped them assess whether they could manage without a car.
In general, renters have been very satisfied with their rentals; 79-80% stated they were very satisfied with the vehicle and with the rental process, with most of the rest being somewhat satisfied with both. In addition, nearly 3 out of 4 stated that the rental was a great value, and 97% stated that it was at least worth what they paid.
All renter participants were asked to describe, in their own words, what they believed were the best and worst things about peer-to-peer carsharing. The most commonly referenced “best” part was the sense among participants that they were supporting the local, or sharing, economy (26%). Many referred to keeping dollars in the local economy and with local people, rather than with outside companies. The next two most common answers dealt with personal benefits relating to convenience (interpreted as a close spatial distance to rental cars, ease, or flexibility in service) and cost, compared to other car rental services. People also liked that P2P reduced the overall number of cars on the road, created an opportunity to meet others in the community, and provided access to a car without owning one. The most commonly referenced negative elements of carsharing were the lack of owner accountability to responding to or honoring reservations/requests from renters (33%), and the lack of general availability and/or an unclear scheduling process (24%).
Carsharing did allow renters to reduce car ownership or maintain low ownership. Respondents indicated that carsharing allowed them to live without a car (51% strongly agree, 90% agree overall); that carsharing is cheaper than owning a car (56% strongly agree, 85% agree overall); and that the multiple services allow them to access a car when they want or need one (62% strongly agree, 93% agree overall). The final survey asked renters whether they agree or disagree with the statement that “if it were not for carsharing, I would likely buy a car.” Thirteen percent strongly agreed, suggesting that for these people carsharing may be keeping them from needing to buy a car. Another 31% agreed somewhat.
Improving access to jobs and other activities for those without cars One of the questions regarding P2P carsharing is how this particular type of carsharing can aid low-income populations in reaching new economic opportunities. Because P2P carsharing may be available where traditional carsharing is not, and because it is often less expensive, it has the potential to serve lower-income households better. Our analysis of the geographic distribution of carsharing vehicles indicates that P2P services have the potential to reach a greater number of lower-income households, though this is dependent on frequently shifting services. In addition, the older (over 35 years), lower-income renters were more likely to use the service for trips of greater utilitarian value, particularly work-related trips. Unlike many of the renters, they were not using the service for many recreational trips that otherwise might not have been made. These findings, however, are based on a limited sample and a service in its early stages of operation. The potential to serve lower-income households will depend on whether vehicles are located near where lower-income people live, which will depend, in part on how the P2P providers price and market the service.
Peer-to-Peer Carsharing: Short-term effects on travel behavior Page xi
Executive Summary - Research Challenges
We encountered several challenges in implementing this study. First, because P2P carsharing is a new model, the system worked through a number of early changes and included dramatic updates to the model by the conclusion of the study – namely, the switch from the request style system to the instant system. Further, participants were likely to be drawn largely from the “early-adopter” subset of residents, a group that may differ from the broader population. Perhaps most importantly, demand for rentals was low, particularly in areas outside of the inner Portland neighborhoods. Low demand, in turn, made studying the effects of participation in P2P schemes challenging. Low enrollment in target areas of East Portland made the study’s initial goal of understanding the impact of P2P carsharing in lower-income areas and areas less served by other forms of transit and carsharing all but impossible.
The data collection efforts through the Carkits led to limitations in the data we had available to analyze. Carkits were programmed to record a GPS point once every two minutes as well as a point for every time the vehicle was turned on and off. This presented limitations in how accurate any mileage calculations could be, as two minutes of travel covers considerable distance and makes it difficult to determine possible routes used. As such, we opted to present most the analysis for the Carkit data in terms of trips and minutes of travel. To complicate calculations, there were numerous errors with the data. Although the numerous errors presented problems with using the data, the data cleaning methods employed for this study resulted in data high enough in quality for analysis with a tolerable level of error.
Peer-to-Peer Carsharing: Short-term effects on travel behavior Page 1
1 BACKGROUND Carsharing allows individuals who want access to a car to borrow (rent) one rather than having to deal with the cost, hassle or commitment of ownership. Carsharing companies or organizations generally provide a fleet of vehicles located near residential or employment concentrations that members or customers can rent for an hour or two (or longer). Starting in the mid-1990s and accelerating in the 2000s, there were several carsharing operations – 50 in North America by 2009 according to one tabulation (Shaheen et al., 2009), with roughly two-thirds of those still in existence. As is evidenced by the high number of defunct carsharing companies, the industry has been undergoing considerable consolidation as companies seek to capture market share, optimize fleet occupancy and dispersion, improve technology and customer experience, and seek profitability. The fate of Carsharing Portland illustrates the tumultuous nature of this nascent industry – they started as an independent company in 1998 and had 110 active members sharing nine vehicles (Katsev, 1999). The company merged with FlexCar in 2001, which merged with ZipCar in 2007 (Shaheen et al., 2009). In early 2013, Zipcar was purchased by car rental company Avis (Martin, 2013).
Peer-to-peer (P2P) carsharing is an idea that has arisen primarily in response to two efficiency-related problems with traditional carsharing. First, in traditional carsharing, the operating company can only locate vehicles in areas with concentrations of customers high enough to rent out vehicles often enough (occupancy), and with a high enough rate that income covers infrastructure and operating costs and eventually yields a profit. If a location cannot produce enough income, the company must decide to either operate the vehicle at a loss, or not operate a vehicle at that location. Second, there are already many private vehicles sitting unused for most the day, usually at either their owner’s homes or in parking lots/garages at work locations. In P2P carsharing, a facilitating company connects individual car owners to car renters. Because of this arrangement, the company does not need to pay the up-front cost for new cars or cover ongoing maintenance. For their part, car owners may not need to cover all vehicle expenses to make lending their vehicle worthwhile, and may be happy to receive some lesser amount.
1.1 Peer-to-Peer Carsharing in Portland
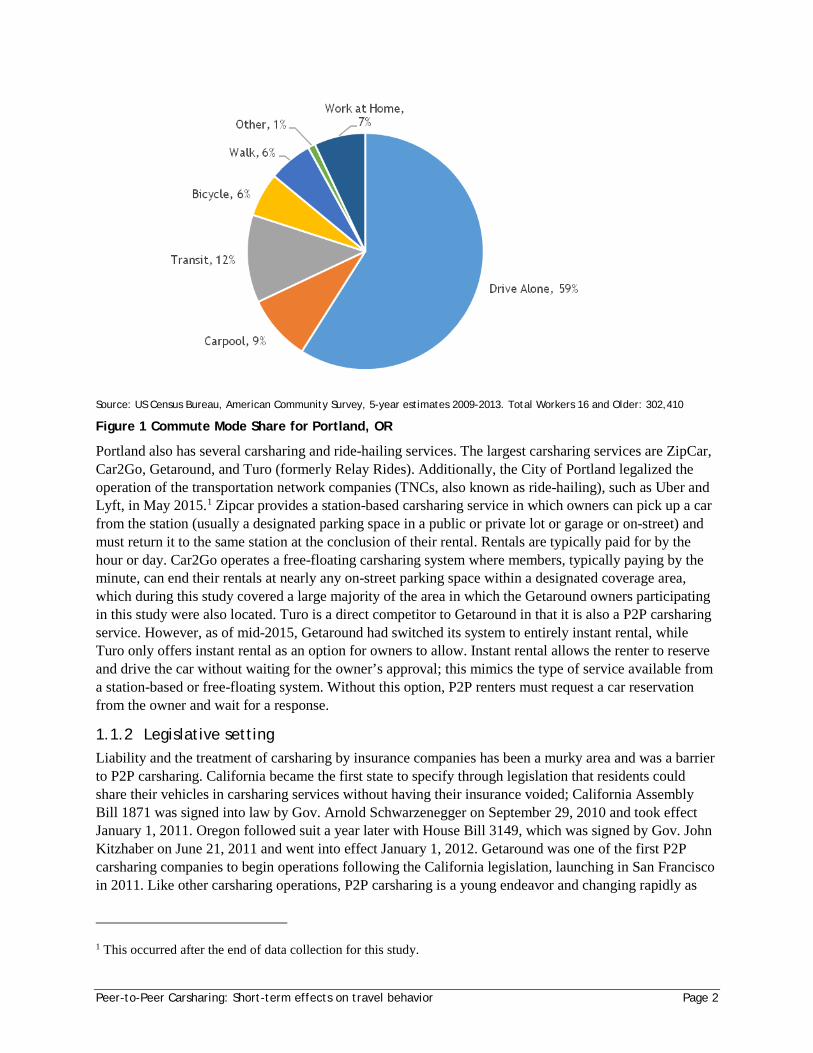
1.1.1 Portland transportation setting Portland, OR, offers numerous transportation options. The light rail system (MAX) includes five lines spanning 60 miles of track (Rose, 2014) connecting Portland to the suburban cities of Beaverton, Gresham, Hillsboro, and Milwaukie. A streetcar system spans 16 miles covering mostly downtown and central Portland. In 2010, about 11% of Portland residents lived within a quarter mile of a bus stop and nearly 24% lived within half a mile (EPA Smart Location Database). Altogether, about 12% of Portland’s workers commute to work by transit, as seen in Figure 1. Many areas of Portland have paved sidewalks but 63% of major streets in Southwest Portland, an area of Portland with the steepest terrains, lack sidewalks, as do 43% of major streets in East Portland, an area of the city increasingly home to low-income and minority populations (City of Portland, 2015). Additionally, East Portland has seen the bulk of the pedestrian deaths in Portland (City of Portland, 2015b), in part a result of its substandard pedestrian environment including the lack of crosswalks. Bicycle facilities provide access to a large majority of the city and Portland has a 6% bike commute mode share, the highest in the U.S. among large cities. Driving in Portland remains relatively easy as there are few restrictions to parking outside of downtown. While highway congestion is present, drive times on area highways are still relatively short. Nearly 60% of Portland workers commute to work by driving alone.
Peer-to-Peer Carsharing: Short-term effects on travel behavior Page 2
Source: US Census Bureau, American Community Survey, 5-year estimates 2009-2013. Total Workers 16 and Older: 302,410
Figure 1 Commute Mode Share for Portland, OR
Portland also has several carsharing and ride-hailing services. The largest carsharing services are ZipCar, Car2Go, Getaround, and Turo (formerly Relay Rides). Additionally, the City of Portland legalized the operation of the transportation network companies (TNCs, also known as ride-hailing), such as Uber and Lyft, in May 2015.1 Zipcar provides a station-based carsharing service in which owners can pick up a car from the station (usually a designated parking space in a public or private lot or garage or on-street) and must return it to the same station at the conclusion of their rental. Rentals are typically paid for by the hour or day. Car2Go operates a free-floating carsharing system where members, typically paying by the minute, can end their rentals at nearly any on-street parking space within a designated coverage area, which during this study covered a large majority of the area in which the Getaround owners participating in this study were also located. Turo is a direct competitor to Getaround in that it is also a P2P carsharing service. However, as of mid-2015, Getaround had switched its system to entirely instant rental, while Turo only offers instant rental as an option for owners to allow. Instant rental allows the renter to reserve and drive the car without waiting for the owner’s approval; this mimics the type of service available from a station-based or free-floating system. Without this option, P2P renters must request a car reservation from the owner and wait for a response.
1.1.2 Legislative setting Liability and the treatment of carsharing by insurance companies has been a murky area and was a barrier to P2P carsharing. California became the first state to specify through legislation that residents could share their vehicles in carsharing services without having their insurance voided; California Assembly Bill 1871 was signed into law by Gov. Arnold Schwarzenegger on September 29, 2010 and took effect January 1, 2011. Oregon followed suit a year later with House Bill 3149, which was signed by Gov. John Kitzhaber on June 21, 2011 and went into effect January 1, 2012. Getaround was one of the first P2P carsharing companies to begin operations following the California legislation, launching in San Francisco in 2011. Like other carsharing operations, P2P carsharing is a young endeavor and changing rapidly as
1 This occurred after the end of data collection for this study.
Peer-to-Peer Carsharing: Short-term effects on travel behavior Page 3
companies compete, learn more about the markets for the service, and navigate the developing legal landscape.
1.1.3 Getaround launch and operations Getaround officially launched operations in Portland with an event at city hall on February 22, 2012 that included U.S. Congressman Earl Blumenauer, Portland Mayor Sam Adams, and Getaround President Sam Zaid. The event was intended both to promote Getaround and to promote this study (coverage on this event can be found at the following websites: http://www.bizjournals.com/portland/blog/sbo/2012/02/getaround-revs-up-portland-launch.html and http://blog.oregonlive.com/commuting/2012/02/car-sharing_roundup_getaround.html). To promote the service and this study, owners were offered up to a $300 incentive to list a vehicle.
To participate in Getaround, a user must log in to the website using a Facebook account. Once in the system, the user can list a vehicle or search for available vehicles for rent. When listing a vehicle, the owner first names the vehicle, sets up a home location for it, and provides basic information about it to populate the listing, such as make, model, year and other features such as transmission and whether the vehicle is pet-friendly. The owner also sets a price for the vehicle, from which the 40% Getaround commission covering insurance, driver screening and payment processing is subtracted.
Renters must also log in using a Facebook account, at which point they can search for cars by entering an address and the desired rental period. Additional filters for transmission or vehicle type may be selected. Throughout most of the study period, rentals were made using the request system. Renters could request vehicles for their desired rental period (and could request multiple vehicles at a time). Once the request was submitted via the Getaround website or app, the owner would be notified of the request and could choose to accept, deny or not respond to the request. Once an owner had accepted a request, the renter was notified and could choose to confirm. Owners of other requested vehicles would then have the request retracted.
Beginning in early 2015, Getaround transitioned the Portland system to an “instant” system, in which the owner agreed to make the vehicle available during select times (of the owner’s choosing). Renters could then browse knowing that times listed as available could be secured without the added step of requesting and having to have the owner approve.
1.2 Research Questions
The goal of this study is to evaluate the impact of peer-to-peer carsharing relative to other models of car use, including ownership, rental and conventional (corporate) carsharing. The two primary research questions are as follows:
1. Can peer-to-peer carsharing reduce overall and peak-period vehicle miles traveled (VMT) by marginalizing the cost of driving?
2. Can peer-to-peer carsharing increase access to jobs and other activities for those without cars?
Regarding the first question, VMT may be reduced in two ways. The first is unique to P2P carsharing. With the opportunity to earn income on their car while not in use, car owners will now face an opportunity cost of driving. This could lead to reduced VMT (drivers use other modes, leaving their car to possibly be rented) and/or changes in the time of driving (e.g., drivers shift trips to other days or times). If owners leave their car at home (or another location) to be rented, and it gets driven less by renters than the owner would have driven it, there would be a net decrease in VMT. If this happens during the peak periods, it could have an effect on congestion.
Peer-to-Peer Carsharing: Short-term effects on travel behavior Page 4
Secondly, carsharing can reduce VMT of renters by marginalizing the cost of driving and reducing car ownership. The traditional model of car ownership consists of large fixed costs (insurance and car payments). The perceived cost of each trip is usually based on a few variable or marginal costs (gasoline, parking). Carsharing transforms ownership to a largely marginal cost (some organizations charge modest annual membership fees). For most people, this increases the perceived cost of any single trip. As the research reviewed in the next section shows, traditional carsharing services are associated with lower auto ownership and VMT among renters.
Regarding the second research question, there is some evidence (reviewed in the next section) that traditional commercial carsharing services are disproportionately used by higher-income people. Three factors contribute to this. First, as noted above, commercial carsharing companies locate vehicles in places where it makes economic sense. This may not be in neighborhoods where lower-income households live. Second, traditional carsharing may be more expensive than other options, particularly transit, walking and bicycling. Third, lower-income people may face higher barriers to access to carsharing, such as credit card and internet access. P2P carsharing has the potential to overcome the first and second factors. Cars may be located anywhere there is a willing owner. The investment in purchasing and owning the car has already been made by the owner, and he/she is not necessarily aiming to cover those fixed costs. The price of renting through a P2P service is likely to be lower than traditional carsharing. The peer-to-peer model of carsharing could also expand the geographic coverage of carsharing. This could increase opportunities for economic activity (e.g., job access, shopping, etc.) for a wider range of households, while also averting the cost and impacts associated with purchasing a car directly.
Peer-to-Peer Carsharing: Short-term effects on travel behavior Page 5
2 EXISTING RESEARCH
2.1 Traditional Carsharing
Several studies over the past 10-15 years have examined the impacts of station-based carsharing on members/consumers (renters). Some studies have documented particular cities’ experiences with carsharing (e.g., PhillyCarShare (Lane, 2005); CarSharing Portland (Katsev, 1999); Arlington Carshare Program (Price et al., 2006); Toronto’s AutoShare (Costain et al., 2012); and San Francisco’s City Carshare (Cervero et al., 2007), while others have looked at aggregate impacts of carsharing across cities.
2.1.1 Who uses carshare? Past profiles indicate that carsharing members are skewed towards young adults. They are well-educated, work in professional fields, and although they fall in the middle-to-upper income bracket, they are still cost-sensitive (Martin and Shaheen, 2011; Shaheen et al., 2012; Burkhardt and Millard-Ball, 2006; Shaheen and Cohen, 2012). Studies by both Burkhardt and Millard-Ball and Martin and Shaheen found similar trends: Over 80% held a bachelor’s degree, 20% reported incomes over $100,000 a year, females outnumbered males (55% to 45%), and the size of households was smaller than average (around 2.0, compared to an average of 2.6 in the U.S.). In addition, most carsharing members surveyed (72%) lived in households without a car (Burkhardt and Millard-Ball, 2006). These profiles are useful for guiding the formulation of typologies that can be used to explore the characteristics of carsharing participants.
Literature also points to shared attitudes among participants: They are generally concerned about environmental and social issues, sensitive to transportation costs, more interested in the pragmatic uses of cars, and are more willing to try new things (Millard-Ball et al., 2011; Burkhardt and Millard-Ball, 2006; Shaheen and Rodier, 2005; Efthymiou et al., 2013). Motivations for participating in carsharing often stem from cost savings and the convenience of not owning a car (or an additional one). Lower-income members are more likely to cite affordability and personal freedom as reasons for joining carsharing, while higher-income members were more likely to cite convenience (Lane, 2005). In addition, evidence suggests that participation in carsharing can be prompted by personal life changes. Events such as childbirth, residential relocation or the breakdown of a household car can trigger the decision to participate in carsharing to test a new routine or have extra options (Burkhardt and Millard-Ball, 2006; Oakil et al., 2013).
2.1.2 Carsharing’s effect on ownership and travel behavior Changes in Vehicle Ownership: Several studies have documented a reduction in vehicle ownership due to carsharing. A 2008 survey of 6,281 carsharing members in North America indicates that car ownership dropped nearly 50% among those participating in carsharing, either through selling a vehicle or postponing a vehicle purchase (Martin et al., 2010). Lane (2005) found that each PhillyCarShare vehicle removed 22.8 vehicles from the road (10.8 by members giving up a car and 12 from members opting not to buy a car). Their survey found that about 25% of respondents had gotten rid of a car, and 29% had decided not to acquire one. Millard-Ball et al. (2005) estimated that 14.9 privately owned vehicles are removed for every carsharing vehicle in North America. Frost and Sullivan (2010) found that, on average, each shared vehicle under the traditional model replaced 15 personally owned vehicles in 2009. A 2007 study of City CarShare in San Francisco found that 29% of carshare members had gotten rid of one or more cars (Cervero et al., 2007).
Changes in Vehicle Miles Travelled (VMT): The question of VMT reduction presents an interesting complication; namely, that while overall VMT may be reduced, individual results can move in opposite
Peer-to-Peer Carsharing: Short-term effects on travel behavior Page 6
directions. Most studies have found that carshare members generally tend to show a decrease in VMT (e.g., Cervero et al., 2007; Cervero and Tsai, 2004; Lane, 2005; Price, 2006; Cooper et al., 2000). However, formerly car-free members naturally exhibit increases in VMT, while those who already had access to a car (or gave up access to a car) tended to see decreases (as was the case in Cooper et al. and Lane Millard-Ball et al. found that while individual VMT can vary, net VMT decreased by 37% for carshare members (renters). Research from Frost and Sullivan found that traditional carsharing members drove 31% less than when they owned a personal vehicle.
Use of Other Modes: Some studies have found that carshare members have switched to walking more and bicycling more, while there have been some mixed findings on transit use. Those finding increased walking and bicycling include Martin and Shaheen (2010); Cervero, Golub and Nee (2007); Lane (2005); and Cooper et al. (2000). A 2005 study by Millard-Ball showed that “nearly 40% of [carsharing] members state that they use transit more often as a result of their involvement in carsharing.” Cooper et al. and Lane also found increases in transit use; however, Martin and Shaheen actually found a statistically significant decrease in transit use.
Environmental Benefits: Studies have found that carsharing vehicles were, on average, more fuel efficient than the local private vehicle fleet average (Martin et al., 2010), and that overall greenhouse gas emissions are reduced with carsharing programs (Martin and Shaheen, 2011).
2.2 Peer-to-Peer Carsharing
Peer-to-peer carsharing is relatively new in the U.S., and limited research exists on how it might affect travel behavior. Using expert interviews, Shaheen et al. (2012) provided an assessment of the viability of personal vehicle sharing. They concluded that P2P carsharing has the potential to expand the geography of carsharing, further increasing alternatives to vehicle ownership. However, they noted structural challenges with insurance, liability and technology, as well as user-related challenges of vehicle availability, maintenance and trust.
2.2.1 Potential benefits of peer-to-peer carsharing Fleet Efficiency: Since personal automobiles tend to remain idle an average of 95% of the time, carsharing – specifically P2P – reduces the inefficiency of personal vehicles and distributes the cost of ownership over many users (Ballús-Armet et al., 2014; Barter, 2014).
Lower Cost than Traditional Carsharing: The P2P model can accrue greater cost savings from both a company and individual perspective than traditional carsharing because a facilitating company eliminates the up-front costs of new vehicles and ongoing maintenance, renters can shop around for price, and car owners have an opportunity to cover some portion of their vehicle expenses.
Greater Access for Lower-income Households: Kodransky and Lewenstein released a report in 2014 exploring the opportunities and barriers of low-income people using shared mobility, including carshare. They found that while potential benefits include lower costs and greater transportation choice and flexibility, usage by low-income people has been low. Some evidence indicates that traditional carsharing is limited geographically (Shaheen et al., 2012) and may not serve lower-income communities well. Little empirical research exists that demonstrates whether carsharing, and particularly P2P carsharing, does increase mobility access for lower-income households. In most U.S. metropolitan areas, the availability of a reliable car allows individuals to travel greater distances in shorter time periods, and access employment and other opportunities that are not constrained by the extent of the public transit network (Raphael et al., 2001). Accessibility may be increased at a reasonable cost with P2P carsharing, particularly among low-income members who are more sensitive to price (Cervero et al., 2007; Costain et al., 2012).
Peer-to-Peer Carsharing: Short-term effects on travel behavior Page 7
Potential to Overcome Cultural and Language Barriers: It is suggested that the informal nature of P2P carsharing can reduce institutional barriers and lessen the language and cultural barriers that may be more common in corporate carsharing models (Shellooe, 2013).
2.2.2 Peer-to-peer carsharing market for renters Early P2P studies have focused on potential markets for these services. An early analysis suggested that from the renter perspective, markets for P2P carsharing are very similar to traditional carsharing services, but with a cost structure that may make it more feasible in lower-density neighborhoods (Hampshire and Gaites, 2011). A study in the San Francisco Bay Area found that Oakland residents who were not primary drivers of a car (e.g., do not own or are not the primary driver of a car they own) were much more likely to be willing to rent a P2P vehicle (73% to 43%) (Ballús-Armet et al., 2014). No difference was observed among San Francisco residents, but the authors suggest this may be due to the availability and feasibility of other transportation modes (e.g., transit and walking) in San Francisco. The survey also found that residents of both cities were less likely to consider P2P carsharing if they drive a personal vehicle daily. Daily transit riders in Oakland were more likely to consider P2P carsharing. A 2012 survey of British P2P carsharing participants found that P2P members were less likely to be from urban areas (75% compared to 84%) than standard carsharing participants (Clark et al., 2014). The British survey also found that P2P members were much more likely to partake in non-car transportation modes than the general population; somewhat more likely to be motivated by using the service as an alternative to purchasing a car (a motivation cited by 24% of P2P members, compared to 13% for traditional carsharing members); and less likely to be motivated by environmental concerns (19% compared to 31%).
Some journalistic accounts help to fill in some pieces of the P2P market drivers. For example, the convenience (Graham, 2012) and affordability (Stross, 2012) of renting from individuals in their neighborhood is attractive to many prospective renters.
2.2.3 Peer-to-peer carsharing market for owners There is limited research on who would be interested in sharing/renting out their private vehicle, and what impact that decision will have on their own travel behavior, including vehicle ownership decisions, VMT, mode choice, and what days and times they choose to travel. Hampshire and Gaites (2011) outline a method of studying the feasibility of P2P carsharing, and point out that a P2P system is much like a traditional carsharing system from the renter’s perspective, but it’s dramatically different from the owner’s perspective. A key conclusion was that P2P systems may succeed in less dense areas with fewer customers/members because P2P owners do not necessarily need to turn a profit, but may reasonably define success by covering some portion of their vehicle operating costs.
Lewis and Simmons’ master’s thesis “P2P Carsharing Service Design: Informing User Experience Development” (2012), provides helpful details on the history of carsharing and the P2P experience; however, their survey of users is limited due to small sample sizes (e.g., only around 14 North American P2P car owners were included in their sample).
The survey of San Francisco Bay Area residents found that about 25% of respondents would be willing to rent out their vehicles to others (Ballús-Armet et al., 2014). The same study found that about half of surveyed car owners had liability and trust concerns.
Sources in the non-academic literature have noted that the ability to defray costs (Bear, 2012) or put to use a vehicle that might otherwise be underutilized (Ravindranath, 2013) have swayed some people to make their cars available. Early news reports suggested that overcoming vehicle owners’ fear of damage
Peer-to-Peer Carsharing: Short-term effects on travel behavior Page 8
or liability has been a challenge for P2P companies (Graham, 2012). Other notable barriers included pricing and revenue, technology and public policy.
2.3 Sharing Economy More Broadly
Trends in consumer attitudes and preferences have shaped the concept of the “sharing economy.” Instead of owning goods, this economic model capitalizes on social interaction through online networking to enable access to shared goods (Belk, 2014). Also known as “collaborative consumption,” the concept of optimizing the use of existing assets and reducing costs has gained traction as a method for improving the sustainability of the current economic system (Ballús-Armet et al., 2014). In the field of transportation, the sharing economy has revealed a host of solutions aimed at reducing congestion, easing demand on overburdened systems and infrastructure, and supporting multimodal travel (Birdsall, 2014). Services such as ridesharing, bike sharing, carsharing, and on-demand ride services (aka ridehailing or transportation network companies) have gained considerable popularity amongst the millennial generation, suggesting a cultural shift away from the importance of cars as a status symbol (Birdsall, 2014). Increasing public acceptance of sharing assets, particularly high-value goods such as cars, has also driven city leaders to explore the sharing economy to harness its multiple benefits and support more multimodal communities (Birdsall, 2014; Shaheen et al., 2012).
Research on the who, what, when and where of those participating in the sharing economy (broadly defined) is a new but growing field. A recent survey using a nationally representative sample of adults found that while only about one-third (32%) were interested in sharing more items, a large majority (76%) agreed that sharing saves money; 72% agreed that is builds friendships and relationships; and 64% agreed that it lowers environmental impacts (TCFANAD, 2014). Potential barriers included not knowing people to share with (33%) and inconvenience (36%). Research on a sample (n=168) of members of Sharetribe, an international service based in Finland that connects people in communities to facilitate sharing all types of assets, found that the intrinsic enjoyment gained from sharing and the extrinsic reward of saving money were the strongest predictors of intentions to share; the intrinsic motivation of perceived sustainability had a smaller effect on the intention to share (Hamari et al., 2013). Anticipated gains in social reputation had no effect. Half of the participants surveyed were 25 years or younger, and only 13% were over 40 years. Most (58%) were male. Research exploring the role of perceptions (e.g., sense of community, environmentalism, etc.) on preferences for ownership versus access using hypothetical situations concluded that it will depend on the good in question; perceptions of sharing cars differed significantly from sharing bicycles, books or handbags (Baumeister and Wangenheim, 2014).
Peer-to-Peer Carsharing: Short-term effects on travel behavior Page 9
3 METHODOLOGY
3.1 Overview
This evaluation uses data from a P2P carsharing service (Getaround) that began operations in Portland, OR, in February 2012. Study participants were either people who were making their personal vehicles available to be rented through Getaround (“owners”) and those who were using Getaround to rent other people’s vehicles (“renters”). This section provides an overview of the data collection approaches, which vary for each group. The following sections go into more detail regarding survey design, study participant recruitment, and vehicle data.
Owner Participation Requirements: For owners, participation in the study required a series of actions, including completing an initial survey about household and personal transportation needs, behaviors and attitudes; listing a vehicle for rental through Getaround and having a GPS monitoring device (“Carkit”) installed in the rental vehicle; agreeing to a six-week baseline monitoring period prior to activating the vehicle for rentals (after which the vehicle is considered “live” for rental); and completing subsequent interim and final surveys about their experience.
Owner Compensation: As compensation for participation, an incentive scheme was offered. A $300 incentive scheme was initially offered to all prospective participants, and was comprised of a first payment of $100 upon completing an initial survey and competing a Carkit installation; a second payment of up to $150 for completing one to three rentals, each with a different renter, within the first two months of being able to rent ($50 per rental); and a third payment of $50 for completing five rentals within six months and completing the interim survey. For participants having Carkits installed after January 1, 2013, the total incentive scheme was reduced to $200 with a similar structure, but with the second payment maxing out at $50 for completing at least one rental within two months of being able to rent. The incentive was reduced to extend the number of participants who could be enrolled and to assess the impact of the different incentive level. An additional $25 gift card was offered as compensation for completion of the final survey for all owner participants.
Owner Data: Owner-revealed behavior data was collected through GPS and cellular communication enabled devices (“Carkits”) installed in the rental vehicles. The Carkits also enable semiautomated vehicle rentals to occur (owner and renter do not need to meet face to face). Owner-stated behaviors and preferences were collected through surveys administered at the beginning of the study, at midpoint and upon completion. In addition, at the end of the study we conducted in-depth interviews with 36 owners to collect more qualitative data to better understand their behavior and experiences.
Renter Participation: For renters, participation in the study involved completing an initial survey about household and personal transportation needs, behaviors and attitudes; completing one or more rentals through Getaround; completing up to three interim surveys about rentals made during their study participation; and completing a final survey about their experience.
Renter Compensation: As compensation for their participation, renters were offered a $15 gift card for completing the initial survey; between $5-10 for completing each of up to three short interim surveys (the incentive was increased midway through the study to encourage completion of the surveys); and $20 for completing the final survey.
Renter Data: Renter-revealed behavior data was collected through Getaround reservation data. Renter-stated behavior and preference data, and information about each rental made, was collected via the surveys.
Peer-to-Peer Carsharing: Short-term effects on travel behavior Page 10
3.2 Survey Design
For both the renter and owner participants, the initial survey was designed to understand current travel behavior, motor-vehicle ownership, attitudes, demographic information, motivations for joining P2P carsharing, and how they intended to use the service. Interim and final surveys asked about changes related to travel behavior, vehicle ownership, transportation-related attitudes, and how the participant used the P2P service (and if they adapted their behavior).
3.2.1 Owner surveys Over the course of the study, owner participants were asked to take three surveys. The goal of the surveys was to understand how the participant travels, what their motor-vehicle ownership situation and attitudes were, and to understand their household composition as it relates to travel needs and decision-making. To be considered a participant, the initial survey had to be completed (therefore, 100% of participants completed this initial survey). The interim survey, administered six months after the participants began renting out their vehicle, was geared toward understanding their early impressions of Getaround and initial behavior or attitude changes. Everyone who was actively participating at the six-month “live” mark was invited to take this survey; study participants who cancelled their participation in Getaround and de-listed their vehicle were not sent the interim survey. The final survey was sent to all study participants 16 months after they began renting out their vehicle, and it asked detailed questions about their experience using Getaround and whether it changed their travel behavior, attitudes and thinking about car ownership. This survey went to both those who were still renting out their vehicles at the 16-month mark and those who had removed their listing prior to that point.
Each of the owner surveys were conducted online using Qualtrics survey software; participants received a link to a unique survey via email.
The initial owner survey contained an introduction and six main sections:
• The introduction explained the steps involved in participating in the study and asked the participant to confirm that they met eligibility requirements. These requirements included confirming that the vehicle being made available to rent met Getaround’s general vehicle requirements for the duration of the study, including having no more than 125,000 miles and was manufactured in or after 1996. Requirements specific to the study included that the participant reside in Portland, the vehicle’s home location was in Portland (a geographic requirement of the study), and that the vehicle had power door locks (a requirement for the Carkit to work). Before beginning the survey, the prospective participant was shown informed consent information, including details about what they had to do to participate, what compensation they would receive, and who to contact with questions about the study. They were asked to indicate that they agreed to participate by checking a box.
• The first section of the survey asked the participant to provide details on any motor vehicles in the household, including vehicle make/model/year; intent to list on Getaround; weekly number of days and miles driven in the past week and in an average week; and the vehicle’s importance for various transportation needs. This section allows us to obtain an understanding of the number and types of vehicles available for use in the household, and of the current actual usage of the vehicles.
• The second section asked the participant to respond to a series of statements about general opinions on transportation by indicating if they agree or disagree with the statements. This section allows us to identify and categorize attitudes about transportation; for example, to understand if
Peer-to-Peer Carsharing: Short-term effects on travel behavior Page 11
the participant responses suggest they are generally pro-car, pro-transit, motivated by environment or efficiency factors, pro-bike, time-sensitive, etc.
• The third section asked participants to respond to a series of statements specifically about the benefits and/or disadvantages of car ownership. If they indicated that they planned to buy or sell a car in the next year, they were asked about the reasons they planned to do so.
• The fourth section pertained to the participants’ reasons for joining Getaround, why they chose to make their car available to be rented, and how they thought their travel behavior might change.
• The fifth section asked about the participants’ daily transportation needs and schedule, including travel modes used in the past week; hours worked outside the home; common destinations; commute times and provisions of parking at work; and travel modes used by other household members.
• The final section asked about household demographics, and closed by explaining the next steps in the study process.
The interim owner survey contained an introduction and four main sections, and was designed to follow up on questions from the first survey in order to track changes in household circumstances, travel behavior and perceptions of carsharing.
• The introduction followed the same format as in the initial survey: it explained the steps involved in participating in the study and displayed informed consent information. This included details about what they had to do to participate, what compensation they would receive, and who to contact with questions about the study. They were asked to indicate that they agreed to participate by checking a box.
• The first section asked if there have been any changes in the past six months to the household’s vehicles, and asked for an update on information about those cars. This included an odometer reading, how far and often the car was driven, and how the car had typically been used over the past six months. In addition, the participant was asked if they purchased a new vehicle or sold an existing one, and/or if there were any plans to do so in the next month, six months, or one to two years.
o If the respondent stated that they did plan to sell a vehicle in the next year, a subsection asked the participant to rate the importance of possible factors that may be part of their decision to sell, such as costs for maintenance/fuel/parking/etc., unreliability and change in needs.
o If the respondent stated that they planned to buy a vehicle in the next year, this section asked them to rate the importance of possible factors that may be part of their decision to buy. These include issues of safety and reliability, as well as changes in family, commutes and/or activities.
• The second section was geared towards understanding if and how the participant’s use of the vehicle and their travel behavior had changed as a result of making the car available for rental. It began by asking the participant about their activity with Getaround in the past six months, such as how they have responded to requests (accept or deny, and why?), and the number of rentals completed. If the participant indicated that they were driving their vehicle less than before, they were asked how they had substituted those trips. Participants were also asked about their overall experience with Getaround by ranking a series of opinion statements by importance. This allows us to identify and categorize perception and experience with P2P carsharing. Statements included satisfaction with renters, if and how the extra money from rentals helps to cover fixed costs, whether they believe there is enough demand, or if the process is a hassle, etc.
Peer-to-Peer Carsharing: Short-term effects on travel behavior Page 12
• The third section was similar to the fifth section of the initial survey, and asked about the participant’s daily transportation needs and schedule, including travel modes used in the past week. In addition, the participant could note any changes in employment, subsequent variation in hours worked outside the home, common destinations, commute times, and provisions of parking at work.
• The final section asked if there had been any changes in household composition or home location over the past six months, and then closed by explaining the next steps in the study process.
The final owner survey combined the themes from the first and interim surveys, and asked in more detail about the Getaround experience and how participation impacted travel decisions and attitudes towards other sharing economy practices.
• Similar to the first and interim surveys, the introduction explained the steps in participant involvement and displayed informed consent, compensation and contact information.
• The first section followed up with the participant on information about the current household vehicles. This included an odometer reading, how far and often the car was driven, and how the car has been typically used over the past six months. In addition, the participant was asked if they had purchased a new vehicle or sold an existing one, and/or if there were any plans to do so in the next month, six months, or one to two years.
• The second section aimed to understand the participant’s attitude towards car ownership. A series of opinion statements about how owning/leasing a car might impact their household is displayed, and the participant was asked to indicate their level of agreement with each. This included the importance of a car for getting to work, carrying out errands or recreational activities; whether the participant felt that they generally drive too much; if they were happy to pay for the mobility; or if expenses limit their ability to pay for leisure or necessities. After this, if the respondent stated that they planned to buy or sell a vehicle in the next year, these two subsections similar to the interim survey followed:
o If the respondent stated that they planned to buy a vehicle, this section asked them to rate the importance of possible factors that may be part of their decision to buy. These include issues of safety and reliability, as well as changes in family, commutes and/or activities.
o If the respondent stated that they planned to sell a vehicle, this subsection asked them to rate the importance of possible factors that may be part of their decision to sell, such as costs for maintenance/fuel/parking/etc., unreliability, and change in needs.
• The third section aimed to understand, in more detail, how the participant’s travel behavior may have changed since making their vehicle available for rent, and if or how their participation in peer-to-peer carsharing influenced their attitude toward other sharing economy practices. The section began with a series of agree/disagree statements about their travel behavior, and then a series of questions about mobility patterns that have either increased, decreased or remain unchanged. Participants were then asked about their rental requests, if and or why they may have denied any requests, who they were primarily renting out to, and whether or not they have ever had any damage done to their vehicle during a rental. This was followed by a series of agree/disagree statements about their overall experience with Getaround, and then they were asked about other forms of community borrowing or sharing services that participants have either considered or joined. They were also asked whether their experience with Getaround made them more or less likely to pursue these other types of community borrowing or sharing services, such as ZipCar, Airbnb, tool sharing, bike sharing, etc. The section wrapped up with a question about monthly Getaround income, if their involvement in the study was influenced by OTREC’s
Peer-to-Peer Carsharing: Short-term effects on travel behavior Page 13
monetary incentives, and whether they planned on continuing to rent through Getaround. Participants were also given a few open text questions about the best and worst of carsharing, and what they would do to improve the Getaround process.
• The fourth section was similar to the second section of the first survey. The participant was asked to respond to a series of statements about general opinions on transportation by indicating if they agree or disagree with the statements. When compared to responses from the first survey, this section allows us to identify and categorize any change in attitudes about transportation (i.e., if they have become more or less pro-car or pro-transit, if environment or efficiency factors have played a smaller or greater role in their decision-making, etc.
• The fifth section followed up on the participant’s daily transportation needs and schedule, including travel modes used in the past week. Any changes in employment and subsequent variation in hours worked outside the home, common destinations, commute times, etc. are noted here as well.
• The final section asked if there had been any changes in household composition or home location over the past six months, and then closes by thanking the participant and having them choose their final gift card incentive.
3.2.2 Renter surveys Over the course of the study, renter participants were asked to take an initial survey, up to three brief interim surveys with questions pertaining to specific rentals, and a final survey about their experience. The initial survey and final survey were designed to take about 15 minutes to complete, and were electronic surveys created and implemented through Qualtrics survey software.
The initial renter survey was very similar to the initial owner survey. However, a short section pertaining to NOT owning a car was added. This section was triggered if people indicated that their household did not own or lease a motor vehicle (a situation not possible on the owner side). The basic outline of the initial renter survey included:
• The introduction explained the steps involved in participating in the study and asked the participants to confirm that they met eligibility requirements. Before beginning the survey, the prospective participant was shown informed consent information, including details about what they had to do to participate, what compensation they would receive, and who to contact with questions about the study. They were asked to indicate that they agreed to participate by checking a box.
• The first section of the survey asked the participant to provide details on any motor vehicles in the household (if any), including vehicle make/model/year; intent to list on Getaround; number of days and miles driven in the past week and in an average week; and importance of the vehicle for various transportation needs. This section allows us to obtain an understanding of the number and types of vehicles available for use in the household, and of the current actual usage of the vehicle(s).
• The second section asked the participant to respond to a series of statements about general opinions on transportation by indicating if they agree or disagree with the statements. This section allows us to identify and categorize attitudes about transportation; for example, to understand if the participant responses suggest they are generally pro-car, pro-transit, motivated by environment or efficiency factors, pro-bike, time-sensitive, etc.
• The third section asked participants to respond to a series of statements specifically about the benefits and/or disadvantages of car ownership. If they indicated that they planned to buy or sell a
Peer-to-Peer Carsharing: Short-term effects on travel behavior Page 14
car in the next year, they were asked about the reasons they planned to do so. An added section with questions pertaining to attitudes and reasons for NOT owning a car were included here.
• The fourth section pertained to the participants’ reasons for joining Getaround, what types of trips they planned to use Getaround for, how frequently they intended to make rentals, and their attitudes about various pricing schemes.
• The fifth section asked about the participants’ daily transportation needs and schedule, including travel modes used in the past week; hours worked outside the home; common destinations; commute times and provisions of parking at work; and travel modes used by other household members.
• The final section asked about household demographics, and closes by explaining the next steps in the study process.
The interim renter surveys asked questions pertaining to specific rental trips that the participants had taken. First renters were asked to confirm that they made the rental trip on the day, time and starting location listed (Table 1). Subsequent questions sought to understand the trip purpose; reasons for selecting that vehicle; how/if they would have made the trip otherwise; and their level of satisfaction with the rental vehicle, rental process, and their sense of the value received. Several questions were also asked to understand if the study fulfillment or Getaround promotional credit were impacting the participants’ choices.
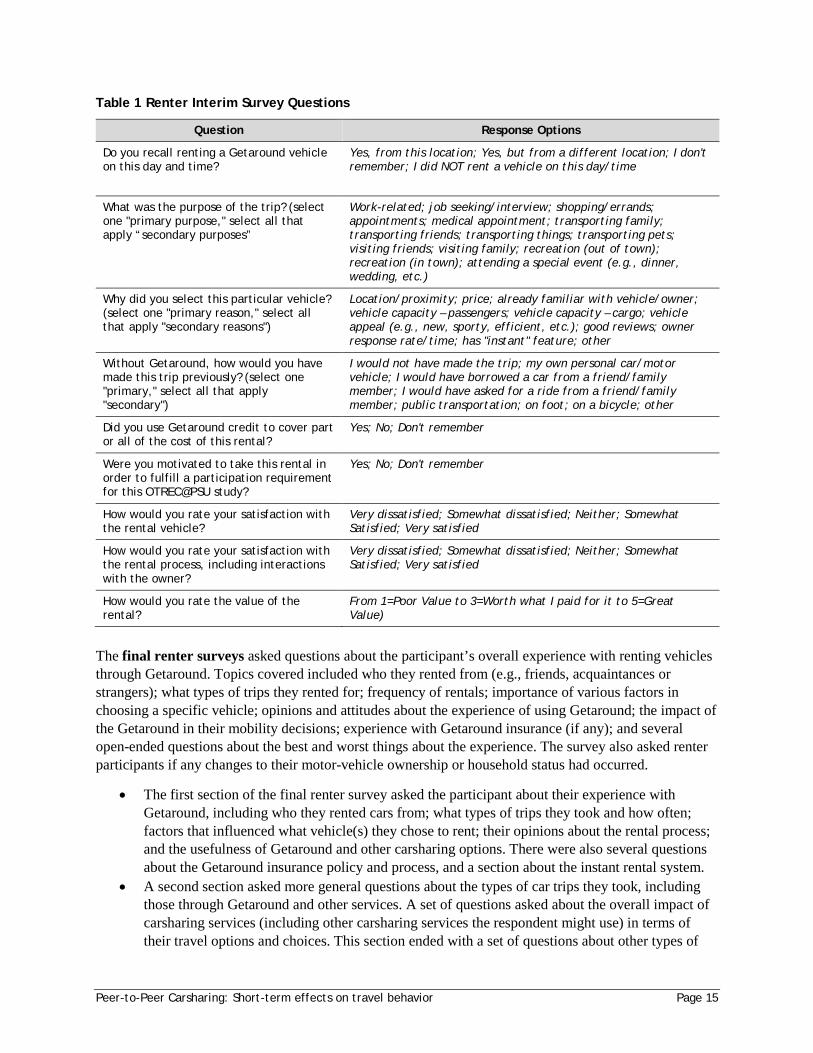
Peer-to-Peer Carsharing: Short-term effects on travel behavior Page 15
Table 1 Renter Interim Survey Questions
Question Response Options
Do you recall renting a Getaround vehicle on this day and time?
Yes, from this location; Yes, but from a different location; I don't remember; I did NOT rent a vehicle on this day/time
What was the purpose of the trip? (select one "primary purpose," select all that apply “secondary purposes”
Work-related; job seeking/interview; shopping/errands; appointments; medical appointment; transporting family; transporting friends; transporting things; transporting pets; visiting friends; visiting family; recreation (out of town); recreation (in town); attending a special event (e.g., dinner, wedding, etc.)
Why did you select this particular vehicle? (select one "primary reason," select all that apply "secondary reasons")
Location/proximity; price; already familiar with vehicle/owner; vehicle capacity – passengers; vehicle capacity – cargo; vehicle appeal (e.g., new, sporty, efficient, etc.); good reviews; owner response rate/time; has "instant" feature; other
Without Getaround, how would you have made this trip previously? (select one "primary," select all that apply "secondary")
I would not have made the trip; my own personal car/motor vehicle; I would have borrowed a car from a friend/family member; I would have asked for a ride from a friend/family member; public transportation; on foot; on a bicycle; other
Did you use Getaround credit to cover part or all of the cost of this rental?
Yes; No; Don't remember
Were you motivated to take this rental in order to fulfill a participation requirement for this OTREC@PSU study?
Yes; No; Don't remember
How would you rate your satisfaction with the rental vehicle?
Very dissatisfied; Somewhat dissatisfied; Neither; Somewhat Satisfied; Very satisfied
How would you rate your satisfaction with the rental process, including interactions with the owner?
Very dissatisfied; Somewhat dissatisfied; Neither; Somewhat Satisfied; Very satisfied
How would you rate the value of the rental?
From 1=Poor Value to 3=Worth what I paid for it to 5=Great Value)
The final renter surveys asked questions about the participant’s overall experience with renting vehicles through Getaround. Topics covered included who they rented from (e.g., friends, acquaintances or strangers); what types of trips they rented for; frequency of rentals; importance of various factors in choosing a specific vehicle; opinions and attitudes about the experience of using Getaround; the impact of the Getaround in their mobility decisions; experience with Getaround insurance (if any); and several open-ended questions about the best and worst things about the experience. The survey also asked renter participants if any changes to their motor-vehicle ownership or household status had occurred.
• The first section of the final renter survey asked the participant about their experience with Getaround, including who they rented cars from; what types of trips they took and how often; factors that influenced what vehicle(s) they chose to rent; their opinions about the rental process; and the usefulness of Getaround and other carsharing options. There were also several questions about the Getaround insurance policy and process, and a section about the instant rental system.
• A second section asked more general questions about the types of car trips they took, including those through Getaround and other services. A set of questions asked about the overall impact of carsharing services (including other carsharing services the respondent might use) in terms of their travel options and choices. This section ended with a set of questions about other types of
Peer-to-Peer Carsharing: Short-term effects on travel behavior Page 16
sharing services, such as bike sharing, tool sharing, etc., in order to assess how related attitudes and behaviors around carsharing are to sharing in general.
• A third section asked about any motor vehicles in the household, including any new purchases or vehicle sales since the initial survey, and the use of existing vehicles. This section also had a set of questions assessing attitudes toward car ownership and reasons for owning or not owning a car (depending on their circumstance).
• A final set of questions asked about their recent travel behavior, including what modes of travel they took, and if there had been any notable household changes since the initial survey.
3.2.3 Survey data cleaning Owners: Owner initial, interim and final surveys were conducted online using Qualtrics software and downloaded into SPSS files. Files were cleaned, labeled and merged into a combined file. Open-ended questions were coded based on content and themes in a separate file. No participant-identifying information was included in the analysis file.
Renters: Renter initial and final surveys were handled similarly to the owner files – conducted online using Qualtrics software, downloaded into SPSS files, and then cleaned, labeled and merged into a combined file. Renter interim survey data were kept in a separate file for analysis. No participant identifying information was included in the analysis file.
3.3 Participant Recruitment and Participation
Recruitment into this multiyear study began in early 2012 and targeted members of Getaround living within the city of Portland, OR. Getaround launched operations in the Portland region in February 2012. All study protocols and instruments were approved through the Human Subjects Research Review Committee at Portland State University (PSU). A timeline of involvement and data collection for both owner and renter participants is shown in Figure 2. For both owners and renters, the recruitment period was longer than originally planned, lengthening the overall data collection time.
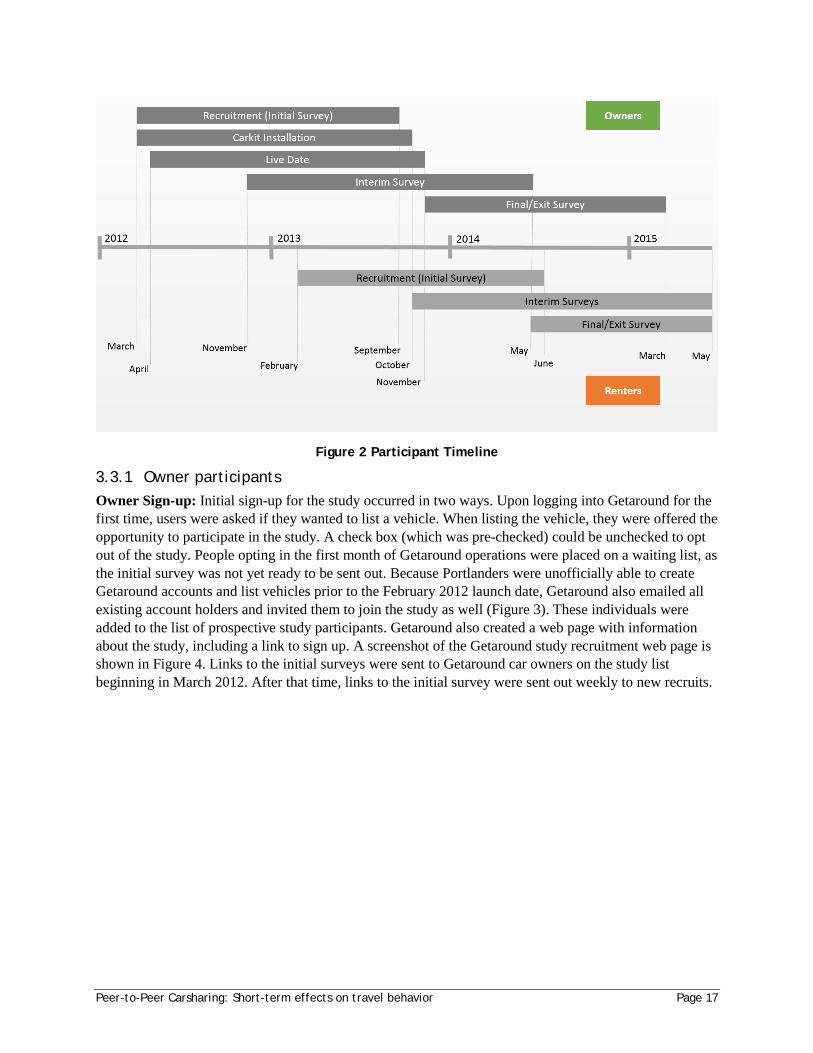
Peer-to-Peer Carsharing: Short-term effects on travel behavior Page 17
Figure 2 Participant Timeline
3.3.1 Owner participants Owner Sign-up: Initial sign-up for the study occurred in two ways. Upon logging into Getaround for the first time, users were asked if they wanted to list a vehicle. When listing the vehicle, they were offered the opportunity to participate in the study. A check box (which was pre-checked) could be unchecked to opt out of the study. People opting in the first month of Getaround operations were placed on a waiting list, as the initial survey was not yet ready to be sent out. Because Portlanders were unofficially able to create Getaround accounts and list vehicles prior to the February 2012 launch date, Getaround also emailed all existing account holders and invited them to join the study as well (Figure 3). These individuals were added to the list of prospective study participants. Getaround also created a web page with information about the study, including a link to sign up. A screenshot of the Getaround study recruitment web page is shown in Figure 4. Links to the initial surveys were sent to Getaround car owners on the study list beginning in March 2012. After that time, links to the initial survey were sent out weekly to new recruits.
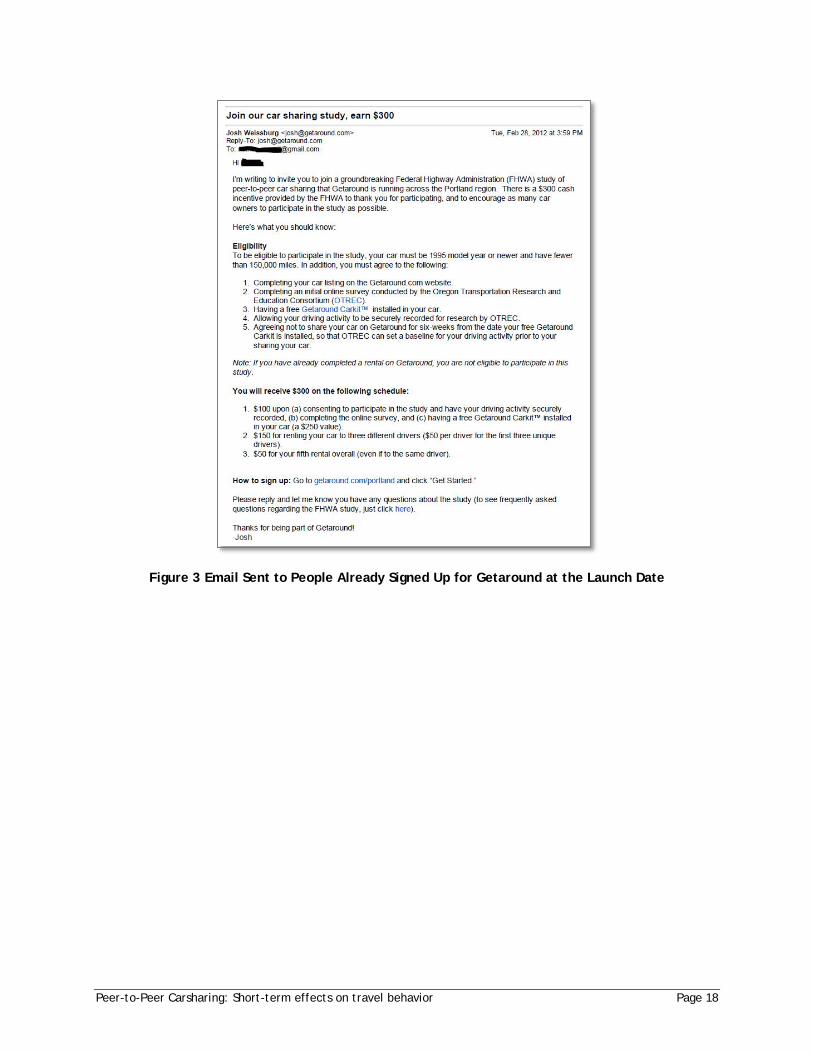
Peer-to-Peer Carsharing: Short-term effects on travel behavior Page 18
Figure 3 Email Sent to People Already Signed Up for Getaround at the Launch Date
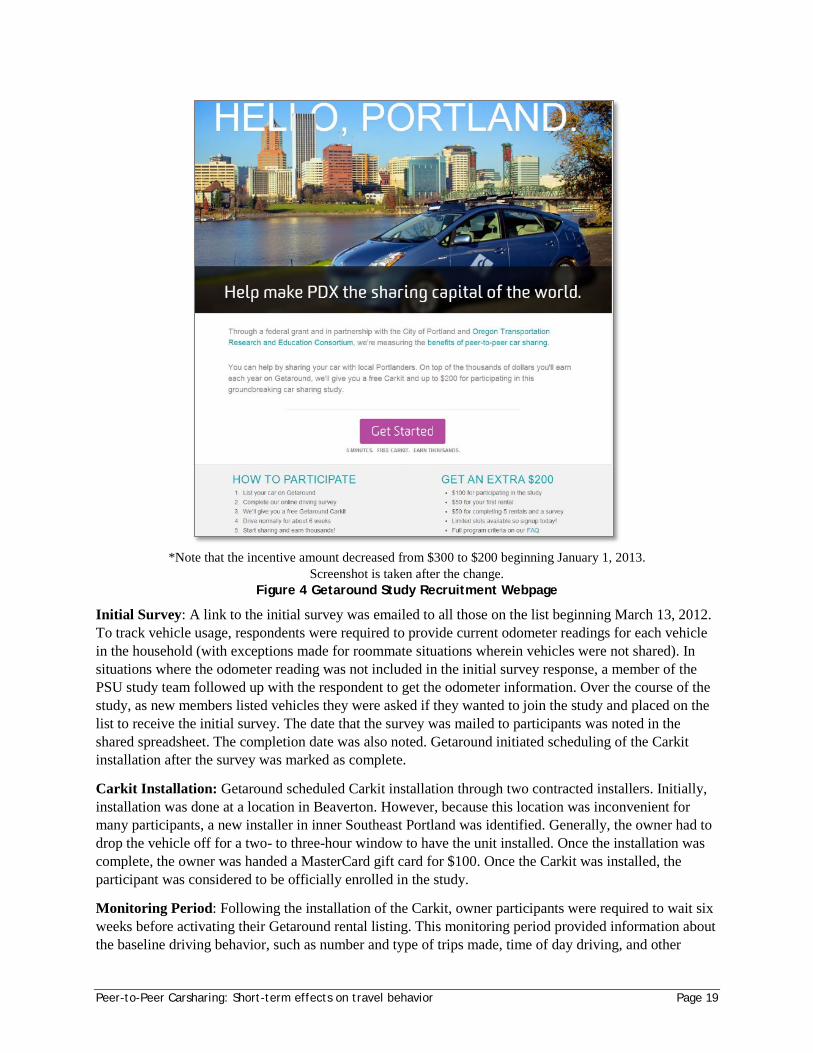
Peer-to-Peer Carsharing: Short-term effects on travel behavior Page 19
*Note that the incentive amount decreased from $300 to $200 beginning January 1, 2013.
Screenshot is taken after the change. Figure 4 Getaround Study Recruitment Webpage
Initial Survey: A link to the initial survey was emailed to all those on the list beginning March 13, 2012. To track vehicle usage, respondents were required to provide current odometer readings for each vehicle in the household (with exceptions made for roommate situations wherein vehicles were not shared). In situations where the odometer reading was not included in the initial survey response, a member of the PSU study team followed up with the respondent to get the odometer information. Over the course of the study, as new members listed vehicles they were asked if they wanted to join the study and placed on the list to receive the initial survey. The date that the survey was mailed to participants was noted in the shared spreadsheet. The completion date was also noted. Getaround initiated scheduling of the Carkit installation after the survey was marked as complete.
Carkit Installation: Getaround scheduled Carkit installation through two contracted installers. Initially, installation was done at a location in Beaverton. However, because this location was inconvenient for many participants, a new installer in inner Southeast Portland was identified. Generally, the owner had to drop the vehicle off for a two- to three-hour window to have the unit installed. Once the installation was complete, the owner was handed a MasterCard gift card for $100. Once the Carkit was installed, the participant was considered to be officially enrolled in the study.
Monitoring Period: Following the installation of the Carkit, owner participants were required to wait six weeks before activating their Getaround rental listing. This monitoring period provided information about the baseline driving behavior, such as number and type of trips made, time of day driving, and other
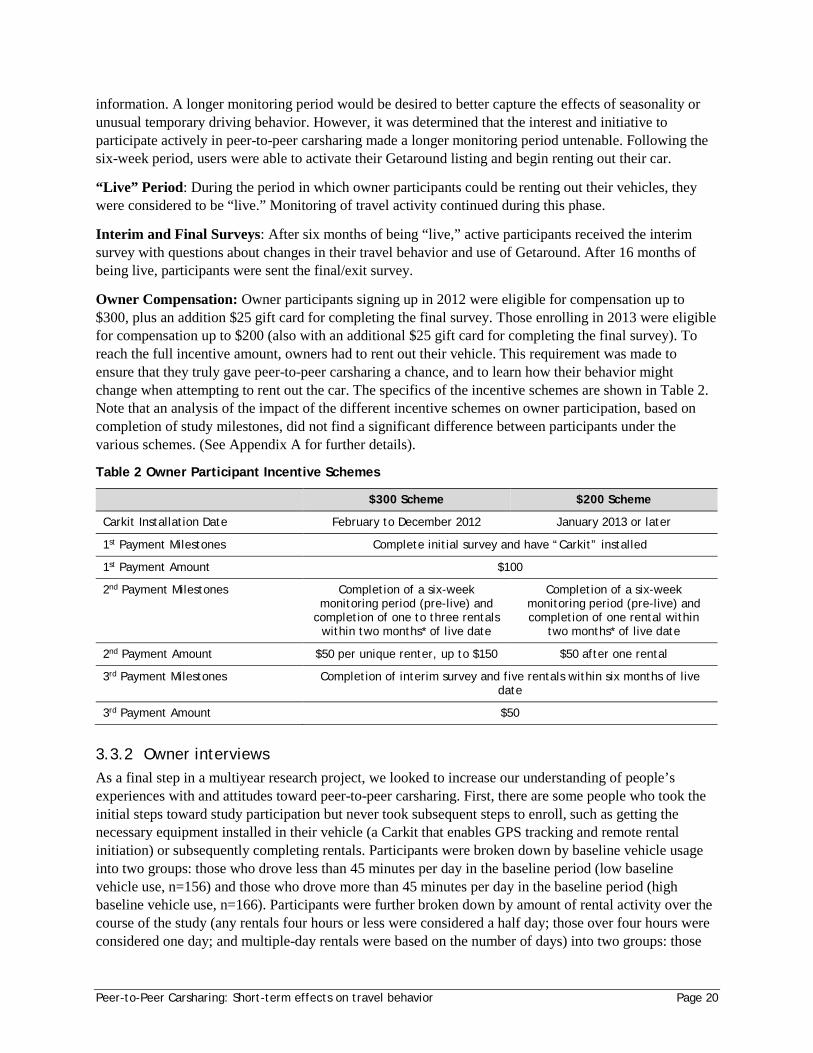
Peer-to-Peer Carsharing: Short-term effects on travel behavior Page 20
information. A longer monitoring period would be desired to better capture the effects of seasonality or unusual temporary driving behavior. However, it was determined that the interest and initiative to participate actively in peer-to-peer carsharing made a longer monitoring period untenable. Following the six-week period, users were able to activate their Getaround listing and begin renting out their car.
“Live” Period: During the period in which owner participants could be renting out their vehicles, they were considered to be “live.” Monitoring of travel activity continued during this phase.
Interim and Final Surveys: After six months of being “live,” active participants received the interim survey with questions about changes in their travel behavior and use of Getaround. After 16 months of being live, participants were sent the final/exit survey.
Owner Compensation: Owner participants signing up in 2012 were eligible for compensation up to $300, plus an addition $25 gift card for completing the final survey. Those enrolling in 2013 were eligible for compensation up to $200 (also with an additional $25 gift card for completing the final survey). To reach the full incentive amount, owners had to rent out their vehicle. This requirement was made to ensure that they truly gave peer-to-peer carsharing a chance, and to learn how their behavior might change when attempting to rent out the car. The specifics of the incentive schemes are shown in Table 2. Note that an analysis of the impact of the different incentive schemes on owner participation, based on completion of study milestones, did not find a significant difference between participants under the various schemes. (See Appendix A for further details).
Table 2 Owner Participant Incentive Schemes
$300 Scheme $200 Scheme
Carkit Installation Date February to December 2012 January 2013 or later
1st Payment Milestones Complete initial survey and have “Carkit” installed
1st Payment Amount $100
2nd Payment Milestones Completion of a six-week monitoring period (pre-live) and
completion of one to three rentals within two months* of live date
Completion of a six-week monitoring period (pre-live) and completion of one rental within
two months* of live date
2nd Payment Amount $50 per unique renter, up to $150 $50 after one rental
3rd Payment Milestones Completion of interim survey and five rentals within six months of live date
3rd Payment Amount $50
3.3.2 Owner interviews As a final step in a multiyear research project, we looked to increase our understanding of people’s experiences with and attitudes toward peer-to-peer carsharing. First, there are some people who took the initial steps toward study participation but never took subsequent steps to enroll, such as getting the necessary equipment installed in their vehicle (a Carkit that enables GPS tracking and remote rental initiation) or subsequently completing rentals. Participants were broken down by baseline vehicle usage into two groups: those who drove less than 45 minutes per day in the baseline period (low baseline vehicle use, n=156) and those who drove more than 45 minutes per day in the baseline period (high baseline vehicle use, n=166). Participants were further broken down by amount of rental activity over the course of the study (any rentals four hours or less were considered a half day; those over four hours were considered one day; and multiple-day rentals were based on the number of days) into two groups: those
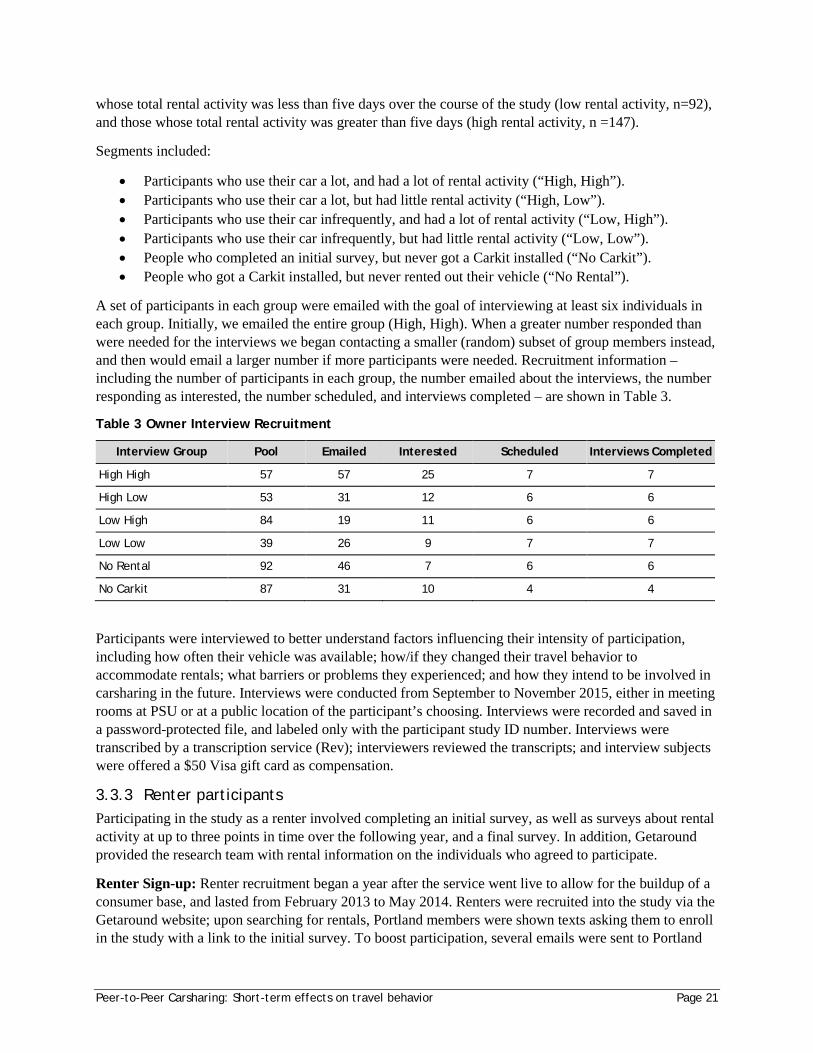
Peer-to-Peer Carsharing: Short-term effects on travel behavior Page 21
whose total rental activity was less than five days over the course of the study (low rental activity, n=92), and those whose total rental activity was greater than five days (high rental activity, n =147).
Segments included:
• Participants who use their car a lot, and had a lot of rental activity (“High, High”). • Participants who use their car a lot, but had little rental activity (“High, Low”). • Participants who use their car infrequently, and had a lot of rental activity (“Low, High”). • Participants who use their car infrequently, but had little rental activity (“Low, Low”). • People who completed an initial survey, but never got a Carkit installed (“No Carkit”). • People who got a Carkit installed, but never rented out their vehicle (“No Rental”).
A set of participants in each group were emailed with the goal of interviewing at least six individuals in each group. Initially, we emailed the entire group (High, High). When a greater number responded than were needed for the interviews we began contacting a smaller (random) subset of group members instead, and then would email a larger number if more participants were needed. Recruitment information – including the number of participants in each group, the number emailed about the interviews, the number responding as interested, the number scheduled, and interviews completed – are shown in Table 3.
Table 3 Owner Interview Recruitment
Interview Group Pool Emailed Interested Scheduled Interviews Completed
High High 57 57 25 7 7
High Low 53 31 12 6 6
Low High 84 19 11 6 6
Low Low 39 26 9 7 7
No Rental 92 46 7 6 6
No Carkit 87 31 10 4 4
Participants were interviewed to better understand factors influencing their intensity of participation, including how often their vehicle was available; how/if they changed their travel behavior to accommodate rentals; what barriers or problems they experienced; and how they intend to be involved in carsharing in the future. Interviews were conducted from September to November 2015, either in meeting rooms at PSU or at a public location of the participant’s choosing. Interviews were recorded and saved in a password-protected file, and labeled only with the participant study ID number. Interviews were transcribed by a transcription service (Rev); interviewers reviewed the transcripts; and interview subjects were offered a $50 Visa gift card as compensation.
3.3.3 Renter participants Participating in the study as a renter involved completing an initial survey, as well as surveys about rental activity at up to three points in time over the following year, and a final survey. In addition, Getaround provided the research team with rental information on the individuals who agreed to participate.
Renter Sign-up: Renter recruitment began a year after the service went live to allow for the buildup of a consumer base, and lasted from February 2013 to May 2014. Renters were recruited into the study via the Getaround website; upon searching for rentals, Portland members were shown texts asking them to enroll in the study with a link to the initial survey. To boost participation, several emails were sent to Portland
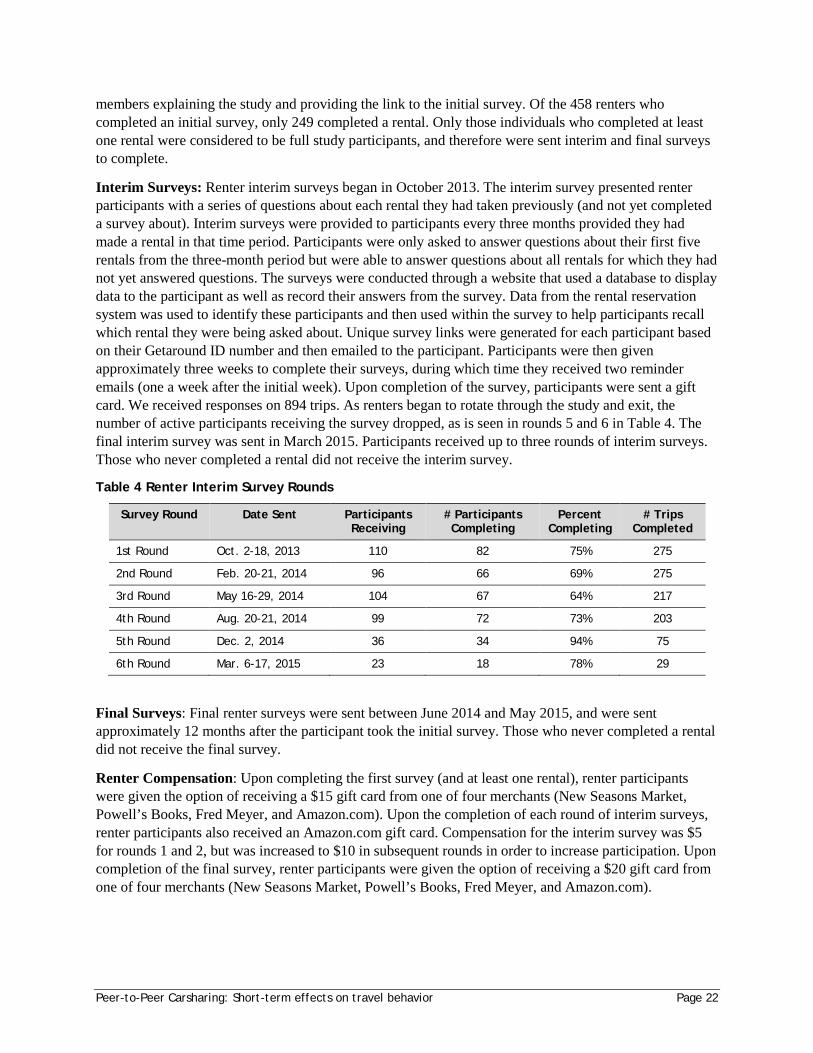
Peer-to-Peer Carsharing: Short-term effects on travel behavior Page 22
members explaining the study and providing the link to the initial survey. Of the 458 renters who completed an initial survey, only 249 completed a rental. Only those individuals who completed at least one rental were considered to be full study participants, and therefore were sent interim and final surveys to complete.
Interim Surveys: Renter interim surveys began in October 2013. The interim survey presented renter participants with a series of questions about each rental they had taken previously (and not yet completed a survey about). Interim surveys were provided to participants every three months provided they had made a rental in that time period. Participants were only asked to answer questions about their first five rentals from the three-month period but were able to answer questions about all rentals for which they had not yet answered questions. The surveys were conducted through a website that used a database to display data to the participant as well as record their answers from the survey. Data from the rental reservation system was used to identify these participants and then used within the survey to help participants recall which rental they were being asked about. Unique survey links were generated for each participant based on their Getaround ID number and then emailed to the participant. Participants were then given approximately three weeks to complete their surveys, during which time they received two reminder emails (one a week after the initial week). Upon completion of the survey, participants were sent a gift card. We received responses on 894 trips. As renters began to rotate through the study and exit, the number of active participants receiving the survey dropped, as is seen in rounds 5 and 6 in Table 4. The final interim survey was sent in March 2015. Participants received up to three rounds of interim surveys. Those who never completed a rental did not receive the interim survey.
Table 4 Renter Interim Survey Rounds
Survey Round Date Sent Participants Receiving
# Participants Completing
Percent Completing
# Trips Completed
1st Round Oct. 2-18, 2013 110 82 75% 275
2nd Round Feb. 20-21, 2014 96 66 69% 275
3rd Round May 16-29, 2014 104 67 64% 217
4th Round Aug. 20-21, 2014 99 72 73% 203
5th Round Dec. 2, 2014 36 34 94% 75
6th Round Mar. 6-17, 2015 23 18 78% 29
Final Surveys: Final renter surveys were sent between June 2014 and May 2015, and were sent approximately 12 months after the participant took the initial survey. Those who never completed a rental did not receive the final survey.
Renter Compensation: Upon completing the first survey (and at least one rental), renter participants were given the option of receiving a $15 gift card from one of four merchants (New Seasons Market, Powell’s Books, Fred Meyer, and Amazon.com). Upon the completion of each round of interim surveys, renter participants also received an Amazon.com gift card. Compensation for the interim survey was $5 for rounds 1 and 2, but was increased to $10 in subsequent rounds in order to increase participation. Upon completion of the final survey, renter participants were given the option of receiving a $20 gift card from one of four merchants (New Seasons Market, Powell’s Books, Fred Meyer, and Amazon.com).
Peer-to-Peer Carsharing: Short-term effects on travel behavior Page 23
3.4 Data from Getaround
3.4.1 Vehicle use data “Carkits” are proprietary Getaround electronic devices installed to remotely allow renters to access a Getaround rental vehicle. The devices are equipped with GPS receiver and cellular communication capability. The devices record point location data, along with a few other pieces of information, at the following times/intervals:
• When the vehicle is turned off, the device collects and transmits location data every 30 minutes. • The device collects/transmits location data every two minutes while the vehicle is in use. • The device collects/transmits data on vehicle ignition on/off times and locations.
The data are transmitted via cellular networks to Getaround and stored on their servers. Over the course of the data collection period, Getaround periodically transmitted data to PSU electronically.
Owner participants were required to have a Carkit installed on their vehicle upon completion of an initial survey to be officially enrolled in the study (and to receive study incentives). The study phases, in terms of the Carkit monitoring, include:
• A six-week monitoring period commencing at Carkit installation, during which time Getaround rentals were not allowed to take place. The goal of this monitoring period was to provide baseline information on the vehicles usage patterns. Because the rental listing was not live during this six-week period, it was considered the “pre-live” phase of participation.
• A 16-month active participation period during which time Getaround rentals were permitted. During this period, the participant’s rental listing was enabled and was therefore considered the “live” period. However, participants were able to take their listings offline during this period.
Upon completion of the 16-month active participation period, the owner was asked to complete a final survey about their participation in Getaround. Once the completed survey was received, PSU notified Getaround that the owner’s participation in the study was complete. At that time the owner had the option of removing the Carkit, or continuing its use for Getaround rental purposes exclusively (i.e., not for study purposes), pursuant to Getaround’s approval.
3.4.2 Rental data Vehicle availability and rental data was collected by Getaround from user interactions with the Getaround rental system. Rental listing changes, including changes to the vehicle pricing, home location and availability, are recorded when owners interact with the system through the web or iPhone app interface. Renter requests to use a vehicle, including rental start time, end time and pricing, are recorded as well. These data were transmitted to PSU electronically on a periodic basis; this was generally done on a quarterly basis in preparation for the quarterly renter interim surveys.
3.4.3 Processing and cleanup Getaround collected the Carkit data into two separate data tables every two weeks, one for the ignition on/off data and the second for GPS data while the vehicle was inactive or in motion. The Carkits were set to record a GPS point every 30 minutes when the vehicle was inactive and every two minutes when the vehicle was active. Each table contained the previous three months of Carkit data. Getaround would then transfer the tables to the PSU study team electronically. The data in GPS tables included a unique GPS point identifier, the vehicle name, date, time, latitude, longitude, location, and in-rental status. Ignition
Peer-to-Peer Carsharing: Short-term effects on travel behavior Page 24
on/off tables included the same information with an additional column indicating whether the point was for the ignition being turned on or off.
Throughout the data collection process, a number of difficulties arose in working with the Carkit data. The most significant problems were in the ignition on/off data, which is discussed in more detail later. The second most frequent difficulty in working with the data arose when Carkits were transferred between vehicles. On numerous occasions, vehicles in the study had to have their Carkit changed out due to technical problems and those Carkits were often replaced by ones removed from other vehicles. Similarly, new vehicles entering the system would often have a Carkit installed that was recently removed from another vehicle. This was evident by retrieving the same data that showed up under two vehicle names. To correct the problem, we had to use the data to first identify which data belonged to which vehicle and then track when the switch occurred. The data were then updated with the correct vehicle names or deleted if we did not need that vehicle’s data. On rare instances, the two vehicles’ data became indecipherable from one another during the Carkit transfer, and we were unable to disentangle their data from one another for a period of time ranging from a couple weeks to two months. In those instances, the data we were unable to disentangle were deleted, resulting in a shorter data-collection time period.
Similar to the prior problem, the rental status of the vehicle recorded by the Carkit provided additional difficulties. The Carkit data included a flag on the GPS points for whether the vehicle was being used in a rental at the time or not. However, the rental reservation system and the Carkit systems were on different time systems, one being UTC and the other Pacific time zone. To complicate matters in merging data between each two-week collection period, newer tables had backdated updates (the reason for the three-month window of data in each two-week data dump) which required old tables to be updated with the new data before they could be merged. To clear up both issues, all Carkit data sent to PSU had the rental flag changed to “False” before data were merged. We then used the rental data we were sent, changed it from UTC to Pacific time zone, and then updated the Carkit data.
While the ignition table recorded on/off points for the vehicles, upon examination the recorded points for when the vehicle was started and turned off had many errors. Based on the cleaning system PSU developed, explained later, the Carkits correctly identified the start and end of a trip 17% to 86% of the time, as some cars had worse error rates than others. The average error rate was estimated around 27%, but a true error rate was not able to be calculated as none of the data collected prior to July 2012 had ignition on/off points. Additionally, the process of developing the cleaning system led to many errors being cleaned manually before the cleaning system was developed. Therefore, the estimated error rate of Getaround’s data was underestimated.
Other errors in the system were also addressed with the PSU cleaning process. In several instances, ignition points were recorded repeatedly over a span of several seconds. Ignition points were often recorded at points long before the trip actually started when other points in the data were clearly better matched as a plausible ignition on point. Another error found, which we termed a time-gap error, occurred when an ignition on point was recorded, movement of the car was apparent, but the time between the ignition on and movement points did not match up with the distance traveled; or it did, but there were missing GPS points. Such errors also occurred in the middle and end of trips as well. Similarly, several data gaps spanning anywhere from hours to months occurred for various reasons. Getaround was unable to recover the missing data. Given the inconsistency in where the gaps occurred, how long they lasted and the frequency per car, we largely ignored the data gaps, but we addressed possible data analysis problems by using metrics per day.
Peer-to-Peer Carsharing: Short-term effects on travel behavior Page 25
Due to the high rate of error in the ignition on/off points, we developed a system that assigned new ignition on/off points to the whole dataset. This system combined the ignition on/off data and GPS data, and ordered them by vehicle, date and time to provide a full set of points from which new ignition on/off points could be assigned. The whole cleaning process involved three steps. In the first step, the first round of trip ends was assigned. Data from individual vehicles were queried from the full dataset and dropped into Excel, where we had set up a series of if/then statements to assign new on/off points. The Excel functions first identified whether vehicle movement occurred between any two points based on their latitude and longitude (lat-long). Given GPS data have a natural bounce, a threshold value had to be assigned for determining whether a vehicle was indeed sitting idle or moving. By testing a series of point combinations from the data in Google Maps, we determined an absolute value of the difference between any two lat-longs of less than 0.001, or approximately one block, meant the vehicle was stationary.
The second step of cleaning took the newly assigned points and looked at the time distance and lat-long distance between the start point and the first GPS point in the trip, which sometimes was the end point. In this process the system looked for time gaps between the trip start and the first GPS point that exceeded 10 minutes. The system then determined whether the time-distance and lat-long distance produced a feasible match using a lat-long-to-time corollary developed by testing the average time it would take to drive a lat-long distance in 10 minutes as tested through Google Maps. In cases where it was determined the distance traveled was plausible in the given time, the trip start was left as-is. In many cases, the distance traveled was minimal but the time difference was large. For those cases, the trip start was changed to the first GPS point so long as there was not also a large time gap between the first and second GPS points. In the case that there was a large time gap between the first and second GPS point, the error was flagged for manual inspection. Where the first GPS point in the trip was the end of the trip, and the system determined the start should be moved to the first GPS point, the trip was determined to not be a trip. In cases where the distance traveled appeared to not be plausible in the time gap, the error was flagged for manual inspection.
The third step of cleaning looked at errors within and at the end of the trip. This step fixed errors that may have led to single trips being recorded when actually two or more trips occurred while also addressing time-gap errors between the last GPS point and the identified trip end from the first round of cleaning. A similar process as occurred in step two occurred in step three to identify whether the trip end was actually the correct trip end to use. To identify whether the time gap between two GPS points in the middle of the trip required splitting the trip into multiple trips, the lat-long-to-time corollary was used again. If the time gap was large (greater than 45 minutes) relative to the distance, the trip was divided. While a smaller time threshold could have been applied, testing showed the 45-minute threshold had the greatest success in correctly identifying when a trip was plausibly multiple trips. All other mid-trip time gaps were flagged for manual inspection. Manual inspection looked at the lat-longs in Google Maps to determine if the distance covered was plausible in the given time, and our best judgment was used based on the time of day and the location of the error to either leave the points as-is or to divide the trip.
Despite this cleaning process, the data inevitably still include some errors as certain traffic events, driving behaviors and the judgment by PSU staff for manual corrections were not able to be controlled. Additionally, the thresholds developed for the automated cleaning system were conservative, most likely leading to short distance trips being counted as trips even though they may not be trips. However, the remaining error rate is considerably smaller than prior to cleaning. We estimate the remaining error rate to be less than 1% based on random inspection of the data. All other errors identified in the data were ignored as they did not impact the trip identification process or the length of trips. We did not anticipate that the data cleaning process would be this extensive, resulting in delays in data analysis.
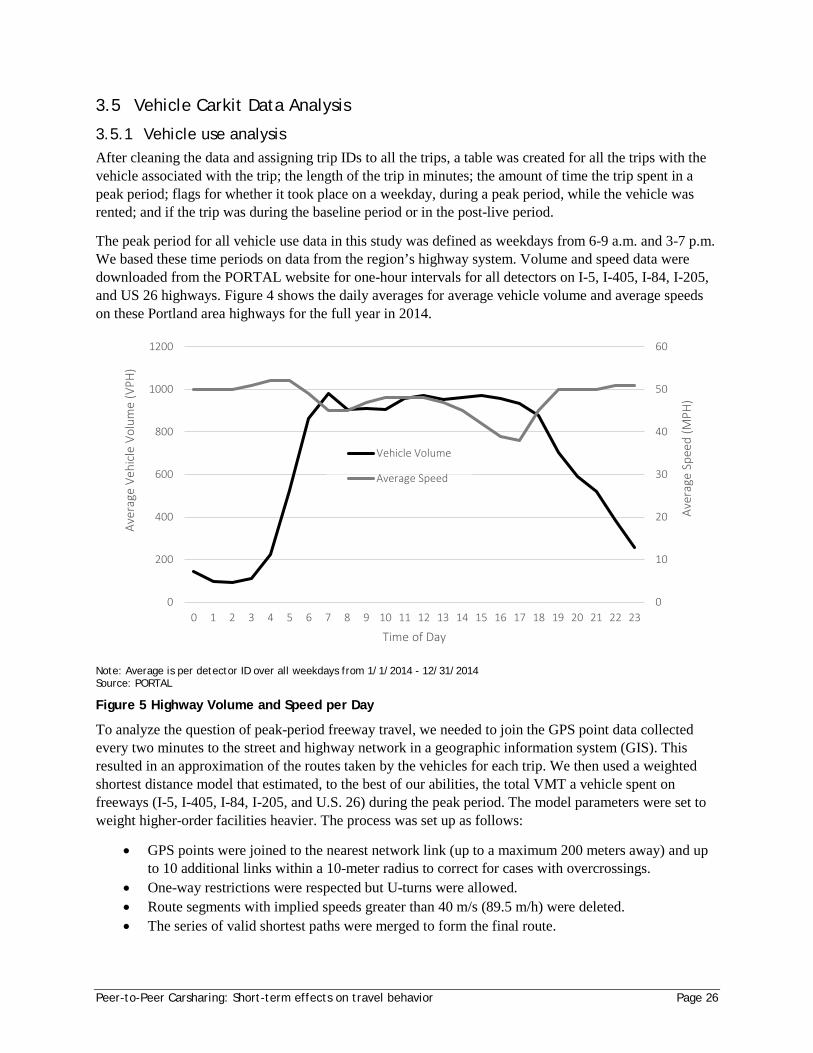
Peer-to-Peer Carsharing: Short-term effects on travel behavior Page 26
3.5 Vehicle Carkit Data Analysis
3.5.1 Vehicle use analysis After cleaning the data and assigning trip IDs to all the trips, a table was created for all the trips with the vehicle associated with the trip; the length of the trip in minutes; the amount of time the trip spent in a peak period; flags for whether it took place on a weekday, during a peak period, while the vehicle was rented; and if the trip was during the baseline period or in the post-live period.
The peak period for all vehicle use data in this study was defined as weekdays from 6-9 a.m. and 3-7 p.m. We based these time periods on data from the region’s highway system. Volume and speed data were downloaded from the PORTAL website for one-hour intervals for all detectors on I-5, I-405, I-84, I-205, and US 26 highways. Figure 4 shows the daily averages for average vehicle volume and average speeds on these Portland area highways for the full year in 2014.
Note: Average is per detector ID over all weekdays from 1/1/2014 - 12/31/2014 Source: PORTAL
Figure 5 Highway Volume and Speed per Day
To analyze the question of peak-period freeway travel, we needed to join the GPS point data collected every two minutes to the street and highway network in a geographic information system (GIS). This resulted in an approximation of the routes taken by the vehicles for each trip. We then used a weighted shortest distance model that estimated, to the best of our abilities, the total VMT a vehicle spent on freeways (I-5, I-405, I-84, I-205, and U.S. 26) during the peak period. The model parameters were set to weight higher-order facilities heavier. The process was set up as follows:
• GPS points were joined to the nearest network link (up to a maximum 200 meters away) and up to 10 additional links within a 10-meter radius to correct for cases with overcrossings.
• One-way restrictions were respected but U-turns were allowed. • Route segments with implied speeds greater than 40 m/s (89.5 m/h) were deleted. • The series of valid shortest paths were merged to form the final route.
0
10
20
30
40
50
60
0
200
400
600
800
1000
1200
0 1 2 3 4 5 6 7 8 9 10 11 12 13 14 15 16 17 18 19 20 21 22 23
Aver
age
Spee
d (M
PH)
Aver
age
Vehi
cle
Volu
me
(VPH
)
Time of Day
Vehicle Volume
Average Speed
Peer-to-Peer Carsharing: Short-term effects on travel behavior Page 27
Given the GPS points were two minutes apart and more accurate map-matching is typically done with 10 seconds or less resolution, the calculations were rough estimates. We visually checked a small sample of the routes and determined the model was producing plausible routes. However, without higher-resolution data, we cannot be entirely sure which route was actually used, thus margins of error also cannot be produced.
3.5.2 Rental use analysis In the same table created with all the unique trips, the in-rental flag was used to identify which trips took place during a rental. This let us know how many rental trips occurred, how long they were, and when they took place. A trip was flagged during a rental if any point of it occurred within the rental window. Since there was some difficulty in determining when a renter picked up and dropped off a vehicle, we were unable to eliminate the possibility of an owner driving the vehicle during the rental timeframe or renters driving the vehicle outside the rental timeframe. As such, some rental trips could be trips by the vehicle owner while some non-rental trips could be made by renters.
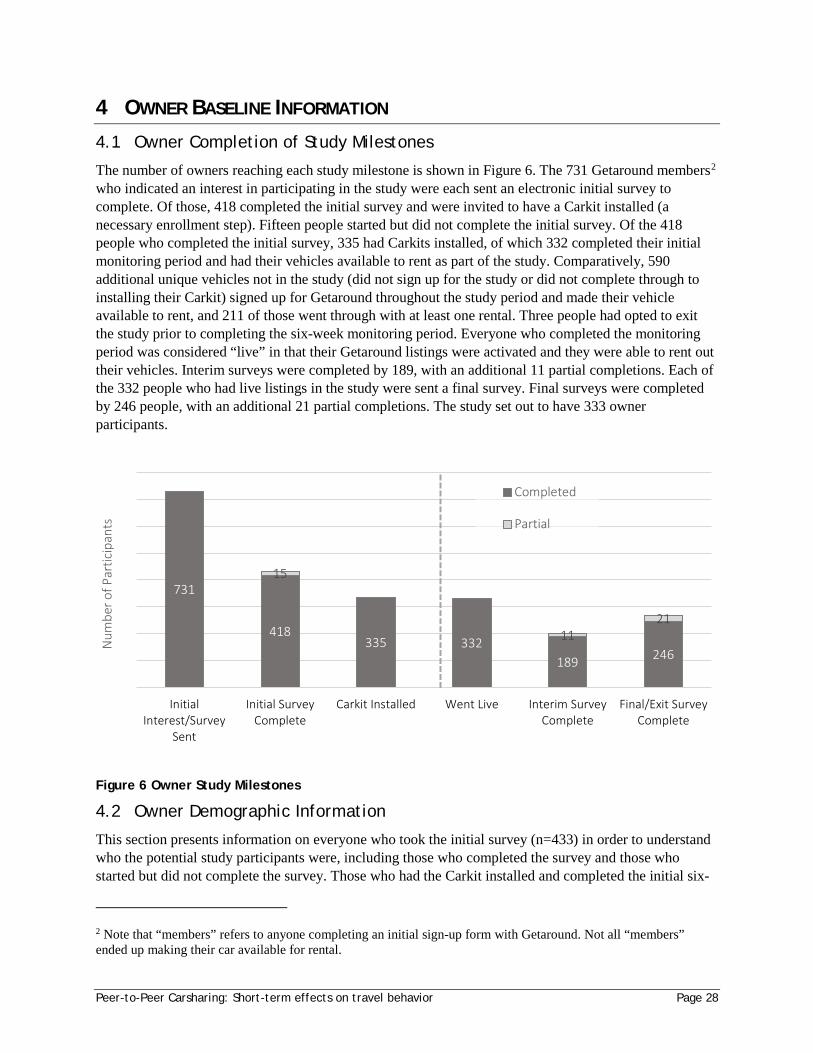
Peer-to-Peer Carsharing: Short-term effects on travel behavior Page 28
4 OWNER BASELINE INFORMATION
4.1 Owner Completion of Study Milestones
The number of owners reaching each study milestone is shown in Figure 6. The 731 Getaround members2 who indicated an interest in participating in the study were each sent an electronic initial survey to complete. Of those, 418 completed the initial survey and were invited to have a Carkit installed (a necessary enrollment step). Fifteen people started but did not complete the initial survey. Of the 418 people who completed the initial survey, 335 had Carkits installed, of which 332 completed their initial monitoring period and had their vehicles available to rent as part of the study. Comparatively, 590 additional unique vehicles not in the study (did not sign up for the study or did not complete through to installing their Carkit) signed up for Getaround throughout the study period and made their vehicle available to rent, and 211 of those went through with at least one rental. Three people had opted to exit the study prior to completing the six-week monitoring period. Everyone who completed the monitoring period was considered “live” in that their Getaround listings were activated and they were able to rent out their vehicles. Interim surveys were completed by 189, with an additional 11 partial completions. Each of the 332 people who had live listings in the study were sent a final survey. Final surveys were completed by 246 people, with an additional 21 partial completions. The study set out to have 333 owner participants.
Figure 6 Owner Study Milestones
4.2 Owner Demographic Information
This section presents information on everyone who took the initial survey (n=433) in order to understand who the potential study participants were, including those who completed the survey and those who started but did not complete the survey. Those who had the Carkit installed and completed the initial six-
2 Note that “members” refers to anyone completing an initial sign-up form with Getaround. Not all “members” ended up making their car available for rental.
731
418335 332
189 246
15
1121
InitialInterest/Survey
Sent
Initial SurveyComplete
Carkit Installed Went Live Interim SurveyComplete
Final/Exit SurveyComplete
Num
ber o
f Par
ticip
ants
Completed
Partial

Peer-to-Peer Carsharing: Short-term effects on travel behavior Page 29
week monitoring period (n=332) are shown separately from those who took the initial survey, but opted not to continue with the study (n=101).
Table 5 though Table 10 present demographic information on the study participants, with comparison data for the city of Portland where available. It should be noted that the study sample consists of early adopters and, possibly, those interested in participating in the research study. We did not intend for the sample to be representative of Portland. Rather, we hope it is representative of people who participate in a P2P carsharing service, at least as early adopters. The comparison to Portland demographics is to show how P2P participants may differ from the broader population.
Study participants were much more likely to be in the 25-34 age group than the city of Portland (Table 5). Those who proceeded with the study and had a Carkit installed were even more likely to be in the 25-44 age groups, and even less likely to be in the younger or older groups. The gender split of owner participants (Table 6) was nearly even.
Table 5 Owner Participant Age Group
Survey only Carkit Installed Total Portland
Residents (18+)*
18-24 9% 5% 6% 11%
25-34 45% 53% 51% 24%
35-44 24% 27% 27% 21%
45-54 14% 8% 9% 16%
55 and older 8% 6% 6% 28%
Total 100% 100% 100%
n 87 331 418 490,880 Source: Owner Initial Survey except *American Community Survey (ACS) 3-year data, 2011-2013
Table 6 Owner Participant Gender
Survey only Carkit Installed Total Portland Residents (18+)*
Female 49% 48% 49% 51%
Male 51% 51% 51% 49%
Provided Other response 0% 1% 0% n/a
Total 100% 100% 100% 100%
n 87 331 418 490,880 Source: Owner Initial Survey except *American Community Survey (ACS) 3-year data, 2011-2013
The income distribution of owner participants (Table 7) was also close to the distribution for the city of Portland, though the higher-income bracket of $100,000+ and the lowest-income bracket of $25,000 or less were each slightly underrepresented in our sample. However, people who took the initial survey and those who proceeded with the study both had much higher average education levels than the city of Portland (see Table 8). Over 75% of study participants had at least a four-year college degree, while that number stands at 44% for Portland.
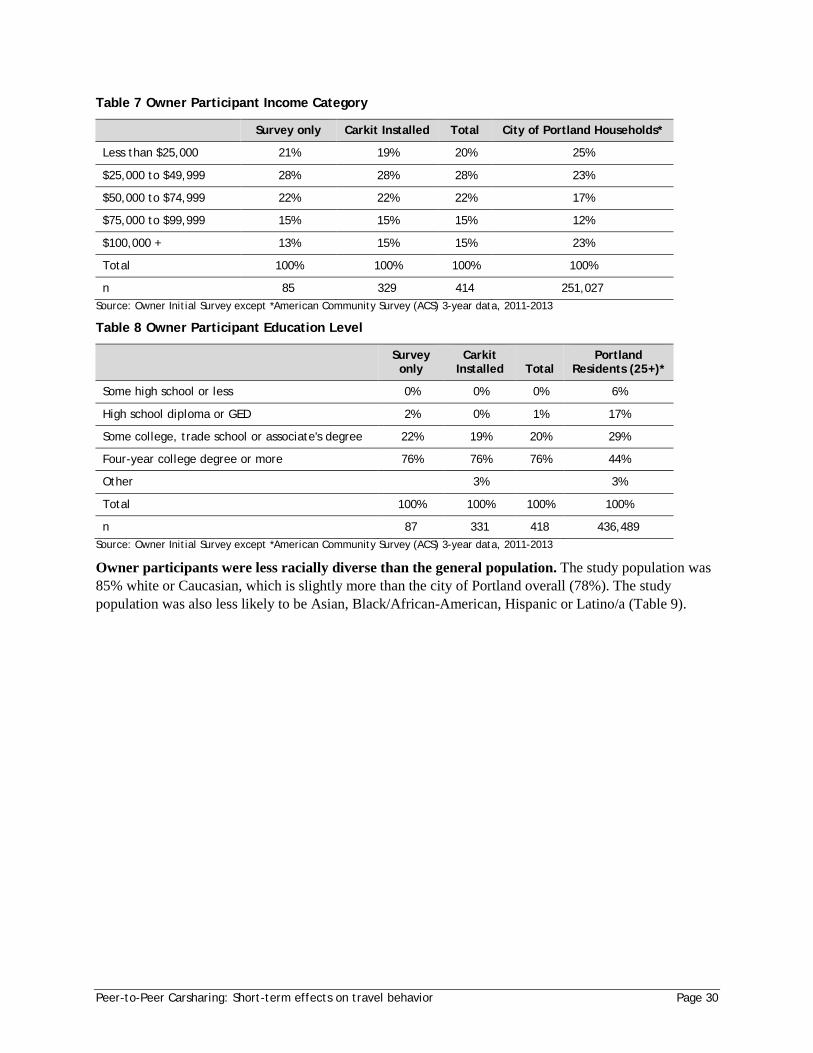
Peer-to-Peer Carsharing: Short-term effects on travel behavior Page 30
Table 7 Owner Participant Income Category
Survey only Carkit Installed Total City of Portland Households*
Less than $25,000 21% 19% 20% 25%
$25,000 to $49,999 28% 28% 28% 23%
$50,000 to $74,999 22% 22% 22% 17%
$75,000 to $99,999 15% 15% 15% 12%
$100,000 + 13% 15% 15% 23%
Total 100% 100% 100% 100%
n 85 329 414 251,027 Source: Owner Initial Survey except *American Community Survey (ACS) 3-year data, 2011-2013
Table 8 Owner Participant Education Level
Survey only
Carkit Installed Total
Portland Residents (25+)*
Some high school or less 0% 0% 0% 6%
High school diploma or GED 2% 0% 1% 17%
Some college, trade school or associate's degree 22% 19% 20% 29%
Four-year college degree or more 76% 76% 76% 44%
Other 3% 3%
Total 100% 100% 100% 100%
n 87 331 418 436,489 Source: Owner Initial Survey except *American Community Survey (ACS) 3-year data, 2011-2013
Owner participants were less racially diverse than the general population. The study population was 85% white or Caucasian, which is slightly more than the city of Portland overall (78%). The study population was also less likely to be Asian, Black/African-American, Hispanic or Latino/a (Table 9).
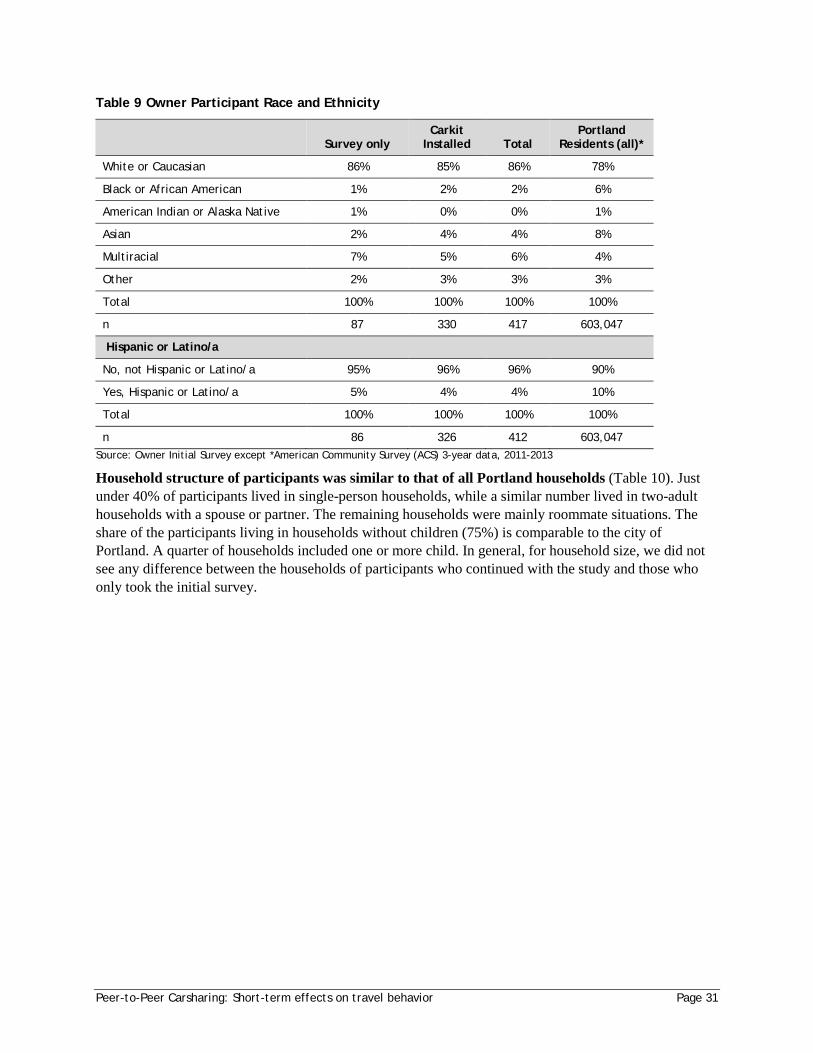
Peer-to-Peer Carsharing: Short-term effects on travel behavior Page 31
Table 9 Owner Participant Race and Ethnicity
Survey only
Carkit Installed Total
Portland Residents (all)*
White or Caucasian 86% 85% 86% 78%
Black or African American 1% 2% 2% 6%
American Indian or Alaska Native 1% 0% 0% 1%
Asian 2% 4% 4% 8%
Multiracial 7% 5% 6% 4%
Other 2% 3% 3% 3%
Total 100% 100% 100% 100%
n 87 330 417 603,047
Hispanic or Latino/a
No, not Hispanic or Latino/a 95% 96% 96% 90%
Yes, Hispanic or Latino/a 5% 4% 4% 10%
Total 100% 100% 100% 100%
n 86 326 412 603,047 Source: Owner Initial Survey except *American Community Survey (ACS) 3-year data, 2011-2013
Household structure of participants was similar to that of all Portland households (Table 10). Just under 40% of participants lived in single-person households, while a similar number lived in two-adult households with a spouse or partner. The remaining households were mainly roommate situations. The share of the participants living in households without children (75%) is comparable to the city of Portland. A quarter of households included one or more child. In general, for household size, we did not see any difference between the households of participants who continued with the study and those who only took the initial survey.
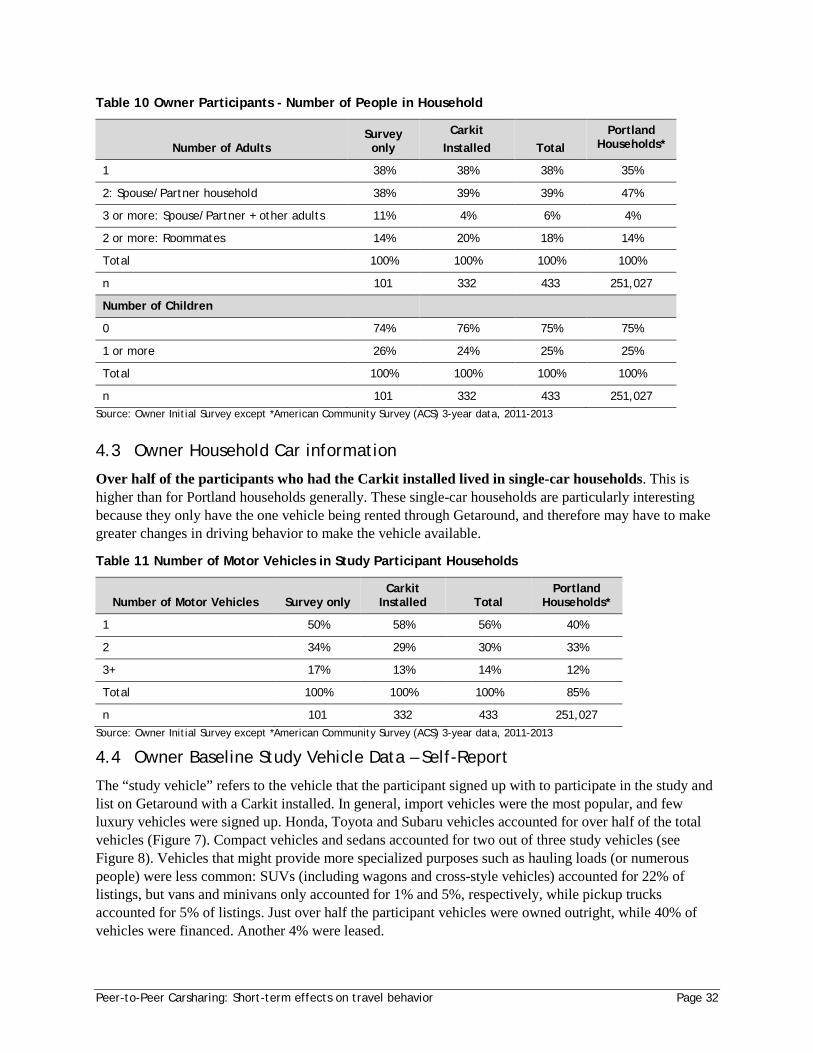
Peer-to-Peer Carsharing: Short-term effects on travel behavior Page 32
Table 10 Owner Participants - Number of People in Household
Number of Adults Survey only
Carkit Installed Total
Portland Households*
1 38% 38% 38% 35%
2: Spouse/Partner household 38% 39% 39% 47%
3 or more: Spouse/Partner + other adults 11% 4% 6% 4%
2 or more: Roommates 14% 20% 18% 14%
Total 100% 100% 100% 100%
n 101 332 433 251,027
Number of Children
0 74% 76% 75% 75%
1 or more 26% 24% 25% 25%
Total 100% 100% 100% 100%
n 101 332 433 251,027 Source: Owner Initial Survey except *American Community Survey (ACS) 3-year data, 2011-2013
4.3 Owner Household Car information
Over half of the participants who had the Carkit installed lived in single-car households. This is higher than for Portland households generally. These single-car households are particularly interesting because they only have the one vehicle being rented through Getaround, and therefore may have to make greater changes in driving behavior to make the vehicle available.
Table 11 Number of Motor Vehicles in Study Participant Households
Number of Motor Vehicles Survey only Carkit
Installed Total Portland
Households*
1 50% 58% 56% 40%
2 34% 29% 30% 33%
3+ 17% 13% 14% 12%
Total 100% 100% 100% 85%
n 101 332 433 251,027 Source: Owner Initial Survey except *American Community Survey (ACS) 3-year data, 2011-2013
4.4 Owner Baseline Study Vehicle Data – Self-Report
The “study vehicle” refers to the vehicle that the participant signed up with to participate in the study and list on Getaround with a Carkit installed. In general, import vehicles were the most popular, and few luxury vehicles were signed up. Honda, Toyota and Subaru vehicles accounted for over half of the total vehicles (Figure 7). Compact vehicles and sedans accounted for two out of three study vehicles (see Figure 8). Vehicles that might provide more specialized purposes such as hauling loads (or numerous people) were less common: SUVs (including wagons and cross-style vehicles) accounted for 22% of listings, but vans and minivans only accounted for 1% and 5%, respectively, while pickup trucks accounted for 5% of listings. Just over half the participant vehicles were owned outright, while 40% of vehicles were financed. Another 4% were leased.
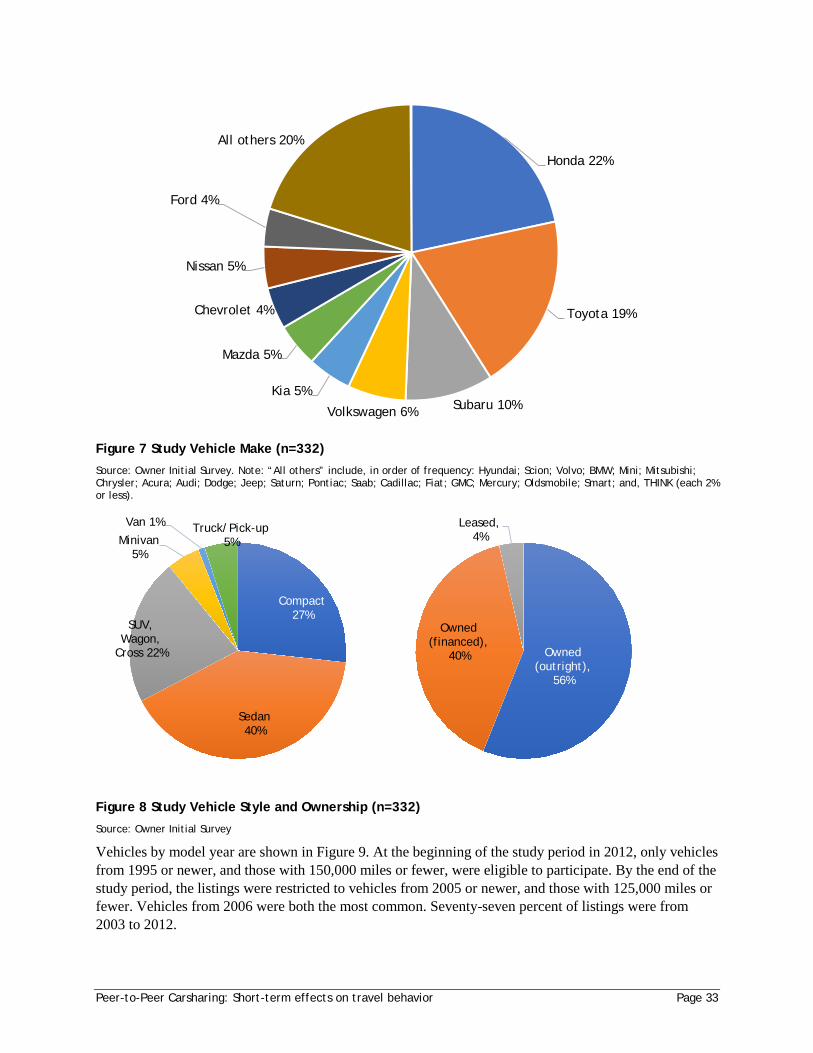
Peer-to-Peer Carsharing: Short-term effects on travel behavior Page 33
Figure 7 Study Vehicle Make (n=332)
Source: Owner Initial Survey. Note: “All others” include, in order of frequency: Hyundai; Scion; Volvo; BMW; Mini; Mitsubishi; Chrysler; Acura; Audi; Dodge; Jeep; Saturn; Pontiac; Saab; Cadillac; Fiat; GMC; Mercury; Oldsmobile; Smart; and, THINK (each 2% or less).
Figure 8 Study Vehicle Style and Ownership (n=332)
Source: Owner Initial Survey
Vehicles by model year are shown in Figure 9. At the beginning of the study period in 2012, only vehicles from 1995 or newer, and those with 150,000 miles or fewer, were eligible to participate. By the end of the study period, the listings were restricted to vehicles from 2005 or newer, and those with 125,000 miles or fewer. Vehicles from 2006 were both the most common. Seventy-seven percent of listings were from 2003 to 2012.
Honda 22%
Toyota 19%
Subaru 10%Volkswagen 6%
Kia 5%
Mazda 5%
Chevrolet 4%
Nissan 5%
Ford 4%
All others 20%
Compact27%
Sedan40%
SUV, Wagon,
Cross 22%
Minivan5%
Van 1% Truck/Pick-up5%
Owned (outright),
56%
Owned (financed),
40%
Leased, 4%
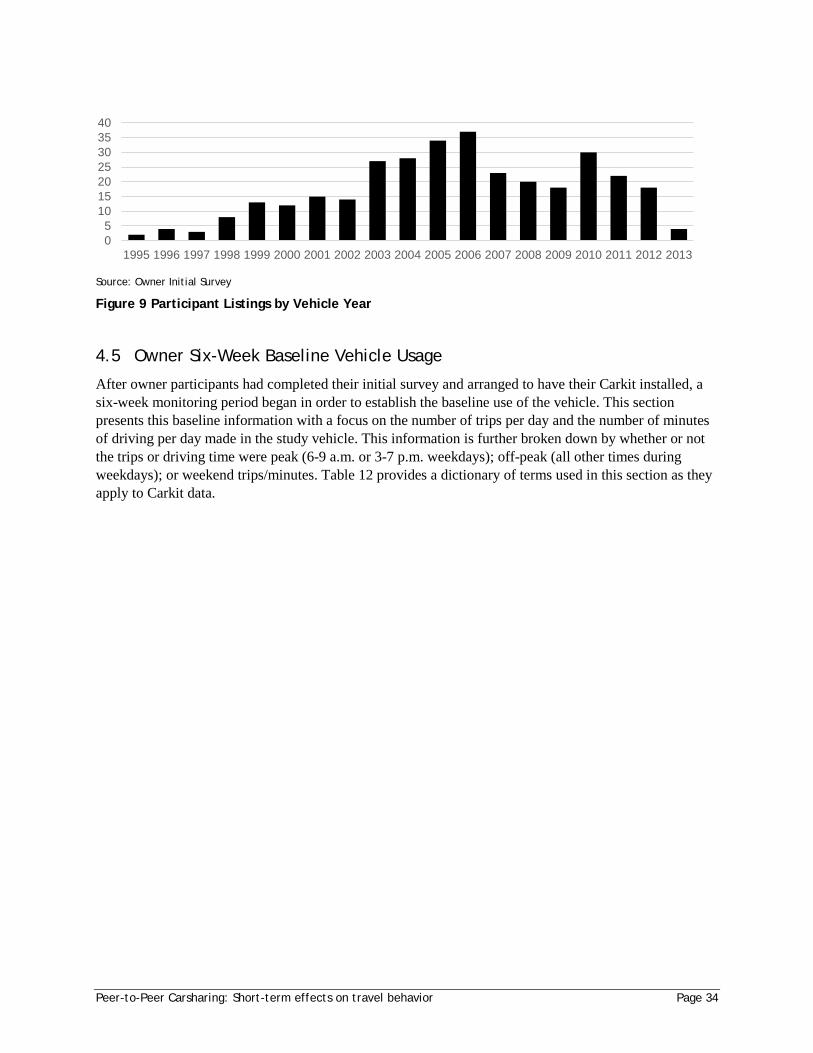
Peer-to-Peer Carsharing: Short-term effects on travel behavior Page 34
Source: Owner Initial Survey
Figure 9 Participant Listings by Vehicle Year
4.5 Owner Six-Week Baseline Vehicle Usage
After owner participants had completed their initial survey and arranged to have their Carkit installed, a six-week monitoring period began in order to establish the baseline use of the vehicle. This section presents this baseline information with a focus on the number of trips per day and the number of minutes of driving per day made in the study vehicle. This information is further broken down by whether or not the trips or driving time were peak (6-9 a.m. or 3-7 p.m. weekdays); off-peak (all other times during weekdays); or weekend trips/minutes. Table 12 provides a dictionary of terms used in this section as they apply to Carkit data.
05
10152025303540
1995 1996 1997 1998 1999 2000 2001 2002 2003 2004 2005 2006 2007 2008 2009 2010 2011 2012 2013
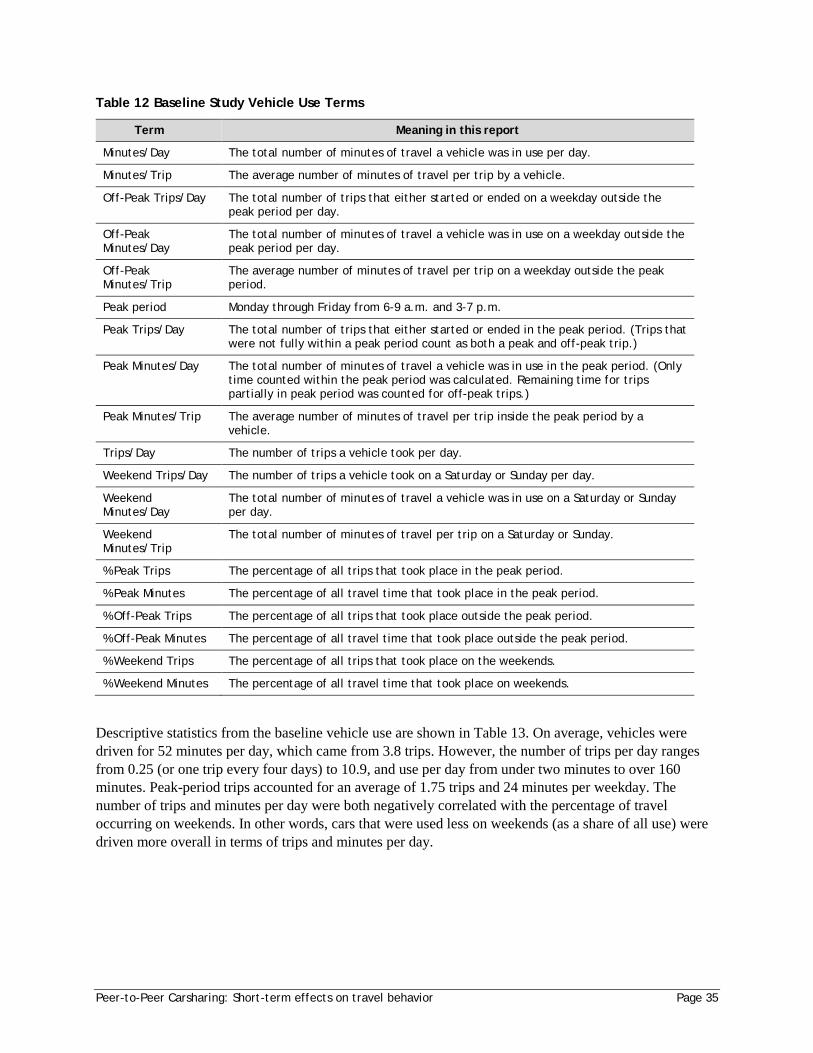
Peer-to-Peer Carsharing: Short-term effects on travel behavior Page 35
Table 12 Baseline Study Vehicle Use Terms
Term Meaning in this report
Minutes/Day The total number of minutes of travel a vehicle was in use per day.
Minutes/Trip The average number of minutes of travel per trip by a vehicle.
Off-Peak Trips/Day The total number of trips that either started or ended on a weekday outside the peak period per day.
Off-Peak Minutes/Day
The total number of minutes of travel a vehicle was in use on a weekday outside the peak period per day.
Off-Peak Minutes/Trip
The average number of minutes of travel per trip on a weekday outside the peak period.
Peak period Monday through Friday from 6-9 a.m. and 3-7 p.m.
Peak Trips/Day The total number of trips that either started or ended in the peak period. (Trips that were not fully within a peak period count as both a peak and off-peak trip.)
Peak Minutes/Day The total number of minutes of travel a vehicle was in use in the peak period. (Only time counted within the peak period was calculated. Remaining time for trips partially in peak period was counted for off-peak trips.)
Peak Minutes/Trip The average number of minutes of travel per trip inside the peak period by a vehicle.
Trips/Day The number of trips a vehicle took per day.
Weekend Trips/Day The number of trips a vehicle took on a Saturday or Sunday per day.
Weekend Minutes/Day
The total number of minutes of travel a vehicle was in use on a Saturday or Sunday per day.
Weekend Minutes/Trip
The total number of minutes of travel per trip on a Saturday or Sunday.
% Peak Trips The percentage of all trips that took place in the peak period.
% Peak Minutes The percentage of all travel time that took place in the peak period.
% Off-Peak Trips The percentage of all trips that took place outside the peak period.
% Off-Peak Minutes The percentage of all travel time that took place outside the peak period.
% Weekend Trips The percentage of all trips that took place on the weekends.
% Weekend Minutes The percentage of all travel time that took place on weekends.
Descriptive statistics from the baseline vehicle use are shown in Table 13. On average, vehicles were driven for 52 minutes per day, which came from 3.8 trips. However, the number of trips per day ranges from 0.25 (or one trip every four days) to 10.9, and use per day from under two minutes to over 160 minutes. Peak-period trips accounted for an average of 1.75 trips and 24 minutes per weekday. The number of trips and minutes per day were both negatively correlated with the percentage of travel occurring on weekends. In other words, cars that were used less on weekends (as a share of all use) were driven more overall in terms of trips and minutes per day.
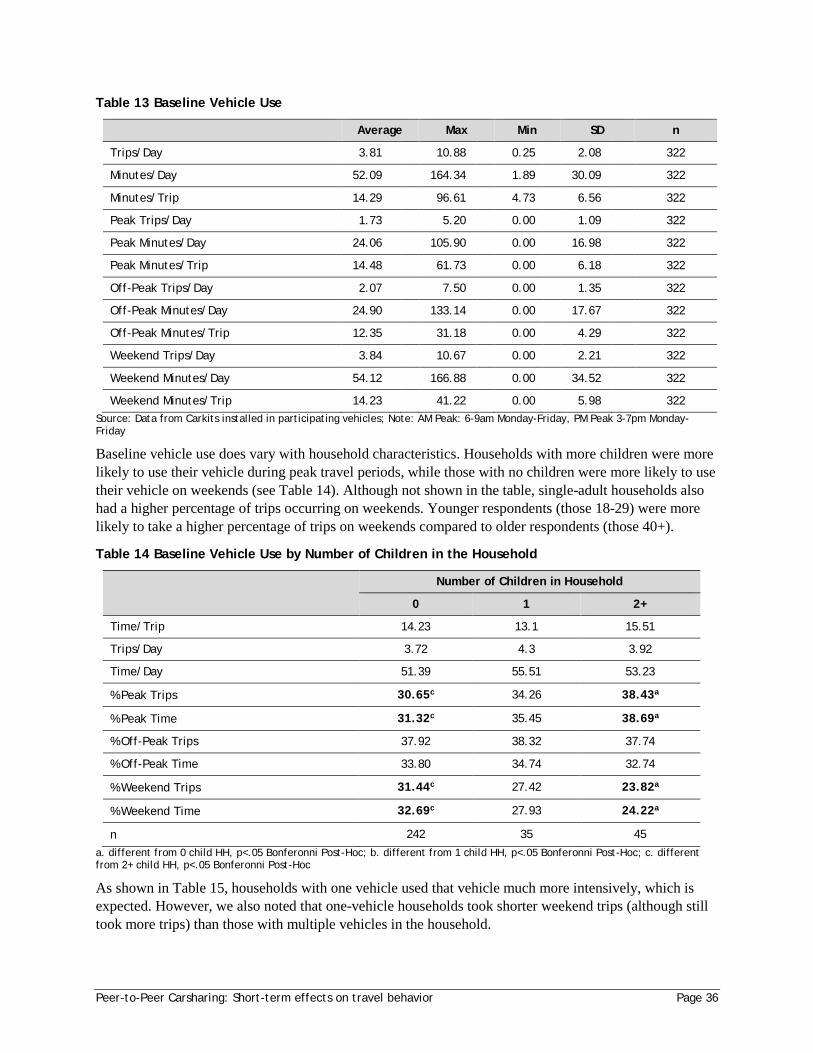
Peer-to-Peer Carsharing: Short-term effects on travel behavior Page 36
Table 13 Baseline Vehicle Use
Average Max Min SD n
Trips/Day 3.81
10.88
0.25
2.08
322
Minutes/Day 52.09
164.34
1.89
30.09
322
Minutes/Trip 14.29
96.61
4.73
6.56
322
Peak Trips/Day 1.73
5.20
0.00
1.09
322
Peak Minutes/Day 24.06
105.90
0.00
16.98
322
Peak Minutes/Trip 14.48
61.73
0.00
6.18
322
Off-Peak Trips/Day 2.07
7.50
0.00
1.35
322
Off-Peak Minutes/Day 24.90
133.14
0.00
17.67
322
Off-Peak Minutes/Trip 12.35
31.18
0.00
4.29
322
Weekend Trips/Day 3.84
10.67
0.00
2.21
322
Weekend Minutes/Day 54.12
166.88
0.00
34.52
322
Weekend Minutes/Trip 14.23
41.22
0.00
5.98
322 Source: Data from Carkits installed in participating vehicles; Note: AM Peak: 6-9am Monday-Friday, PM Peak 3-7pm Monday-Friday
Baseline vehicle use does vary with household characteristics. Households with more children were more likely to use their vehicle during peak travel periods, while those with no children were more likely to use their vehicle on weekends (see Table 14). Although not shown in the table, single-adult households also had a higher percentage of trips occurring on weekends. Younger respondents (those 18-29) were more likely to take a higher percentage of trips on weekends compared to older respondents (those 40+).
Table 14 Baseline Vehicle Use by Number of Children in the Household
Number of Children in Household
0 1 2+
Time/Trip 14.23 13.1 15.51
Trips/Day 3.72 4.3 3.92
Time/Day 51.39 55.51 53.23
% Peak Trips 30.65c 34.26 38.43a
% Peak Time 31.32c 35.45 38.69a
% Off-Peak Trips 37.92 38.32 37.74
% Off-Peak Time 33.80 34.74 32.74
% Weekend Trips 31.44c 27.42 23.82a
% Weekend Time 32.69c 27.93 24.22a
n 242 35 45
a. different from 0 child HH, p<.05 Bonferonni Post-Hoc; b. different from 1 child HH, p<.05 Bonferonni Post-Hoc; c. different from 2+ child HH, p<.05 Bonferonni Post-Hoc
As shown in Table 15, households with one vehicle used that vehicle much more intensively, which is expected. However, we also noted that one-vehicle households took shorter weekend trips (although still took more trips) than those with multiple vehicles in the household.
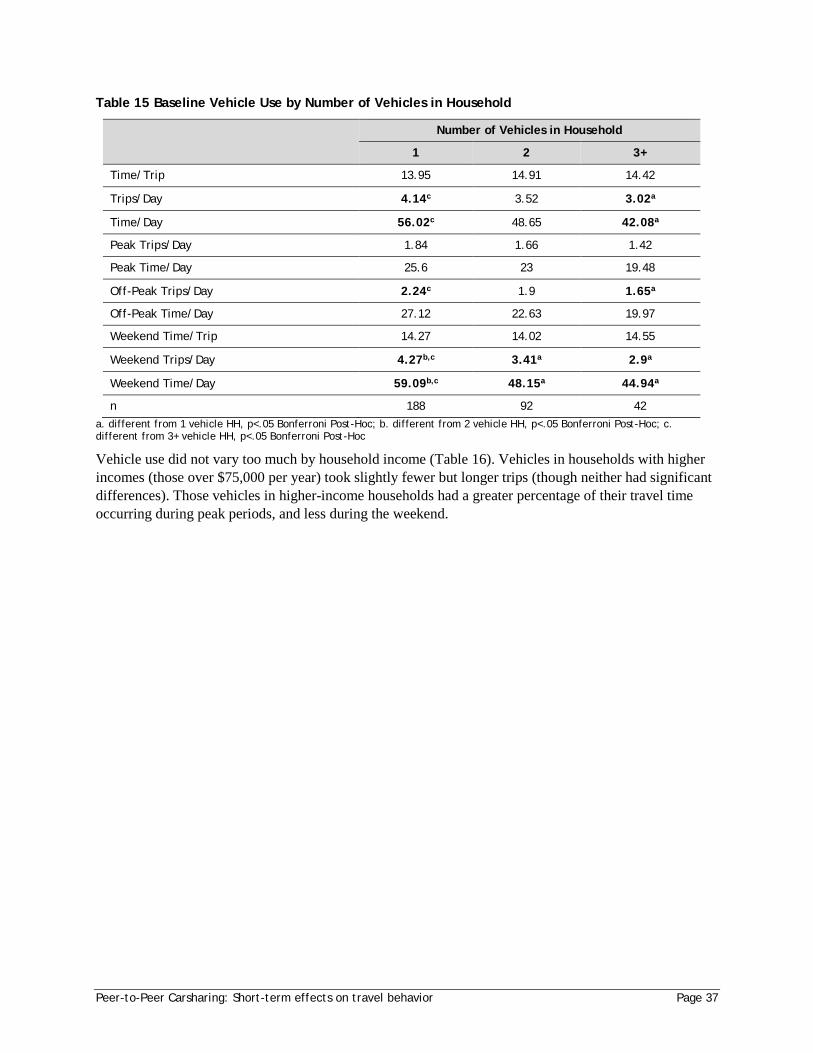
Peer-to-Peer Carsharing: Short-term effects on travel behavior Page 37
Table 15 Baseline Vehicle Use by Number of Vehicles in Household
Number of Vehicles in Household
1 2 3+
Time/Trip 13.95 14.91 14.42
Trips/Day 4.14c 3.52 3.02a
Time/Day 56.02c 48.65 42.08a
Peak Trips/Day 1.84 1.66 1.42
Peak Time/Day 25.6 23 19.48
Off-Peak Trips/Day 2.24c 1.9 1.65a
Off-Peak Time/Day 27.12 22.63 19.97
Weekend Time/Trip 14.27 14.02 14.55
Weekend Trips/Day 4.27b,c 3.41a 2.9a
Weekend Time/Day 59.09b,c 48.15a 44.94a
n 188 92 42 a. different from 1 vehicle HH, p<.05 Bonferroni Post-Hoc; b. different from 2 vehicle HH, p<.05 Bonferroni Post-Hoc; c. different from 3+ vehicle HH, p<.05 Bonferroni Post-Hoc
Vehicle use did not vary too much by household income (Table 16). Vehicles in households with higher incomes (those over $75,000 per year) took slightly fewer but longer trips (though neither had significant differences). Those vehicles in higher-income households had a greater percentage of their travel time occurring during peak periods, and less during the weekend.
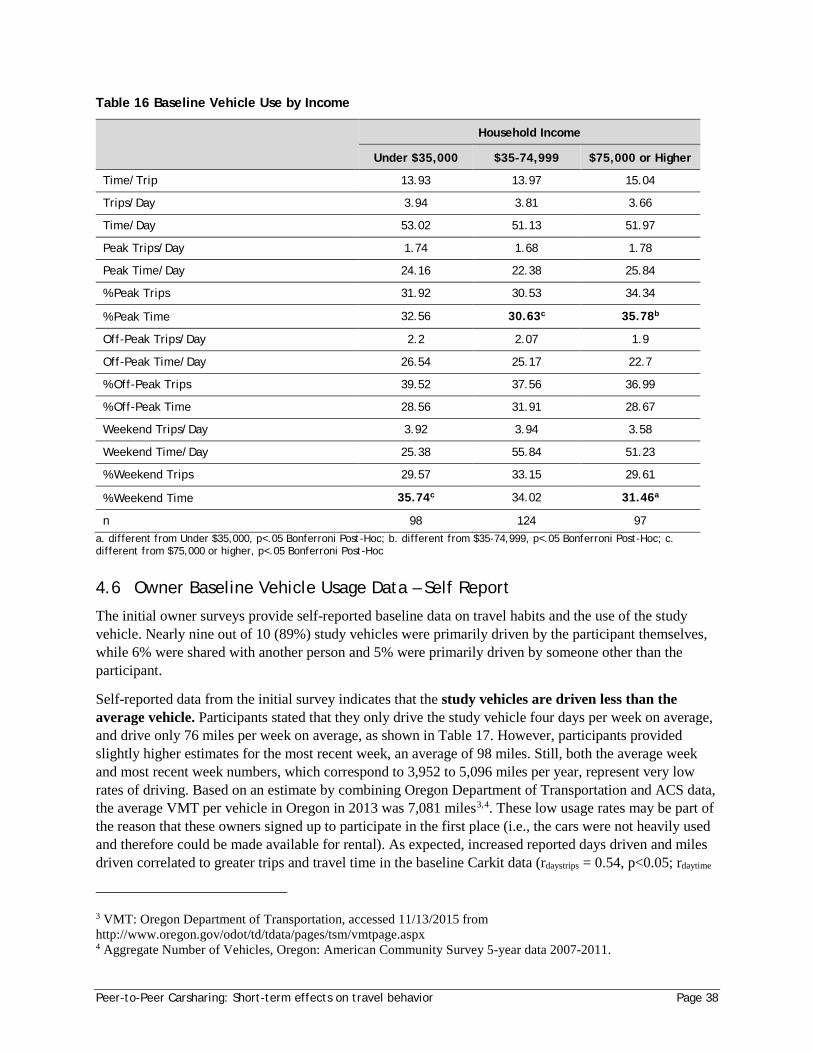
Peer-to-Peer Carsharing: Short-term effects on travel behavior Page 38
Table 16 Baseline Vehicle Use by Income
Household Income
Under $35,000 $35-74,999 $75,000 or Higher
Time/Trip 13.93 13.97 15.04
Trips/Day 3.94 3.81 3.66
Time/Day 53.02 51.13 51.97
Peak Trips/Day 1.74 1.68 1.78
Peak Time/Day 24.16 22.38 25.84
% Peak Trips 31.92 30.53 34.34
% Peak Time 32.56 30.63c 35.78b
Off-Peak Trips/Day 2.2 2.07 1.9
Off-Peak Time/Day 26.54 25.17 22.7
% Off-Peak Trips 39.52 37.56 36.99
% Off-Peak Time 28.56 31.91 28.67
Weekend Trips/Day 3.92 3.94 3.58
Weekend Time/Day 25.38 55.84 51.23
% Weekend Trips 29.57 33.15 29.61
% Weekend Time 35.74c 34.02 31.46a
n 98 124 97 a. different from Under $35,000, p<.05 Bonferroni Post-Hoc; b. different from $35-74,999, p<.05 Bonferroni Post-Hoc; c. different from $75,000 or higher, p<.05 Bonferroni Post-Hoc
4.6 Owner Baseline Vehicle Usage Data – Self Report
The initial owner surveys provide self-reported baseline data on travel habits and the use of the study vehicle. Nearly nine out of 10 (89%) study vehicles were primarily driven by the participant themselves, while 6% were shared with another person and 5% were primarily driven by someone other than the participant.
Self-reported data from the initial survey indicates that the study vehicles are driven less than the average vehicle. Participants stated that they only drive the study vehicle four days per week on average, and drive only 76 miles per week on average, as shown in Table 17. However, participants provided slightly higher estimates for the most recent week, an average of 98 miles. Still, both the average week and most recent week numbers, which correspond to 3,952 to 5,096 miles per year, represent very low rates of driving. Based on an estimate by combining Oregon Department of Transportation and ACS data, the average VMT per vehicle in Oregon in 2013 was 7,081 miles3,4. These low usage rates may be part of the reason that these owners signed up to participate in the first place (i.e., the cars were not heavily used and therefore could be made available for rental). As expected, increased reported days driven and miles driven correlated to greater trips and travel time in the baseline Carkit data (rdaystrips = 0.54, p<0.05; rdaytime
3 VMT: Oregon Department of Transportation, accessed 11/13/2015 from http://www.oregon.gov/odot/td/tdata/pages/tsm/vmtpage.aspx 4 Aggregate Number of Vehicles, Oregon: American Community Survey 5-year data 2007-2011.
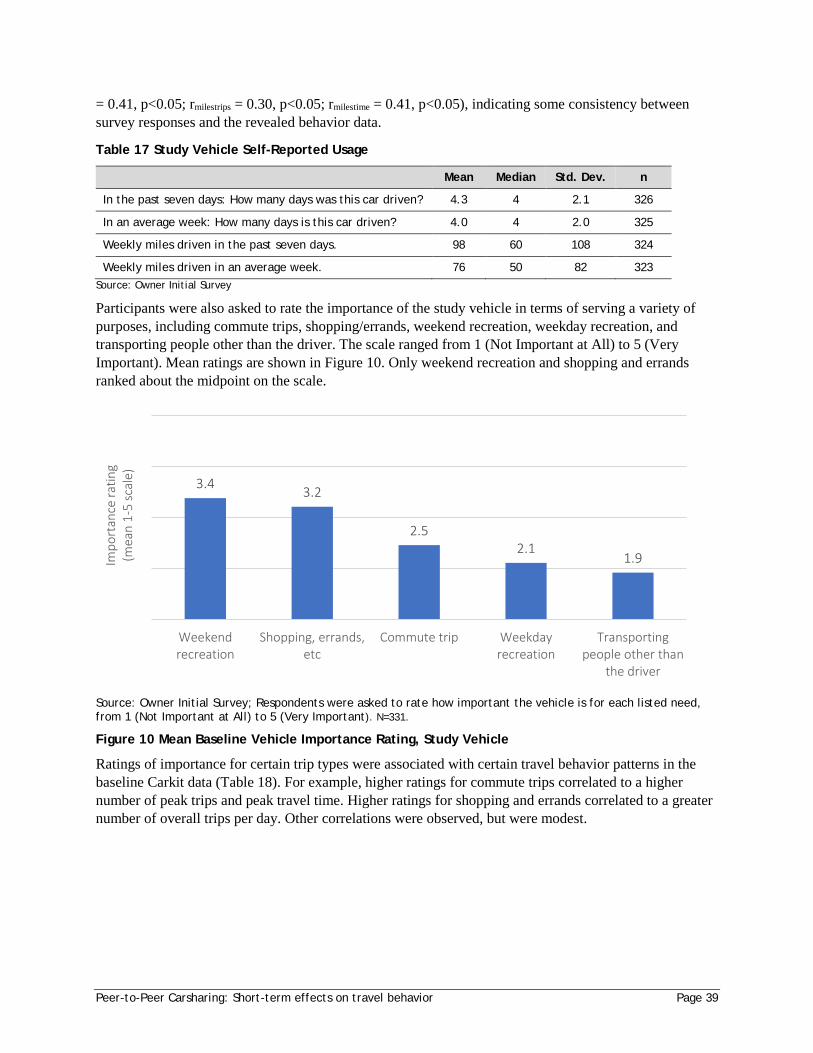
Peer-to-Peer Carsharing: Short-term effects on travel behavior Page 39
= 0.41, p<0.05; rmilestrips = 0.30, p<0.05; rmilestime = 0.41, p<0.05), indicating some consistency between survey responses and the revealed behavior data.
Table 17 Study Vehicle Self-Reported Usage
Mean Median Std. Dev. n
In the past seven days: How many days was this car driven? 4.3 4 2.1 326
In an average week: How many days is this car driven? 4.0 4 2.0 325
Weekly miles driven in the past seven days. 98 60 108 324
Weekly miles driven in an average week. 76 50 82 323 Source: Owner Initial Survey
Participants were also asked to rate the importance of the study vehicle in terms of serving a variety of purposes, including commute trips, shopping/errands, weekend recreation, weekday recreation, and transporting people other than the driver. The scale ranged from 1 (Not Important at All) to 5 (Very Important). Mean ratings are shown in Figure 10. Only weekend recreation and shopping and errands ranked about the midpoint on the scale.
Source: Owner Initial Survey; Respondents were asked to rate how important the vehicle is for each listed need, from 1 (Not Important at All) to 5 (Very Important). N=331.
Figure 10 Mean Baseline Vehicle Importance Rating, Study Vehicle
Ratings of importance for certain trip types were associated with certain travel behavior patterns in the baseline Carkit data (Table 18). For example, higher ratings for commute trips correlated to a higher number of peak trips and peak travel time. Higher ratings for shopping and errands correlated to a greater number of overall trips per day. Other correlations were observed, but were modest.
3.4 3.2
2.52.1
1.9
Weekendrecreation
Shopping, errands,etc
Commute trip Weekdayrecreation
Transportingpeople other than
the driver
Impo
rtan
ce ra
ting
(mea
n 1-
5 sc
ale)
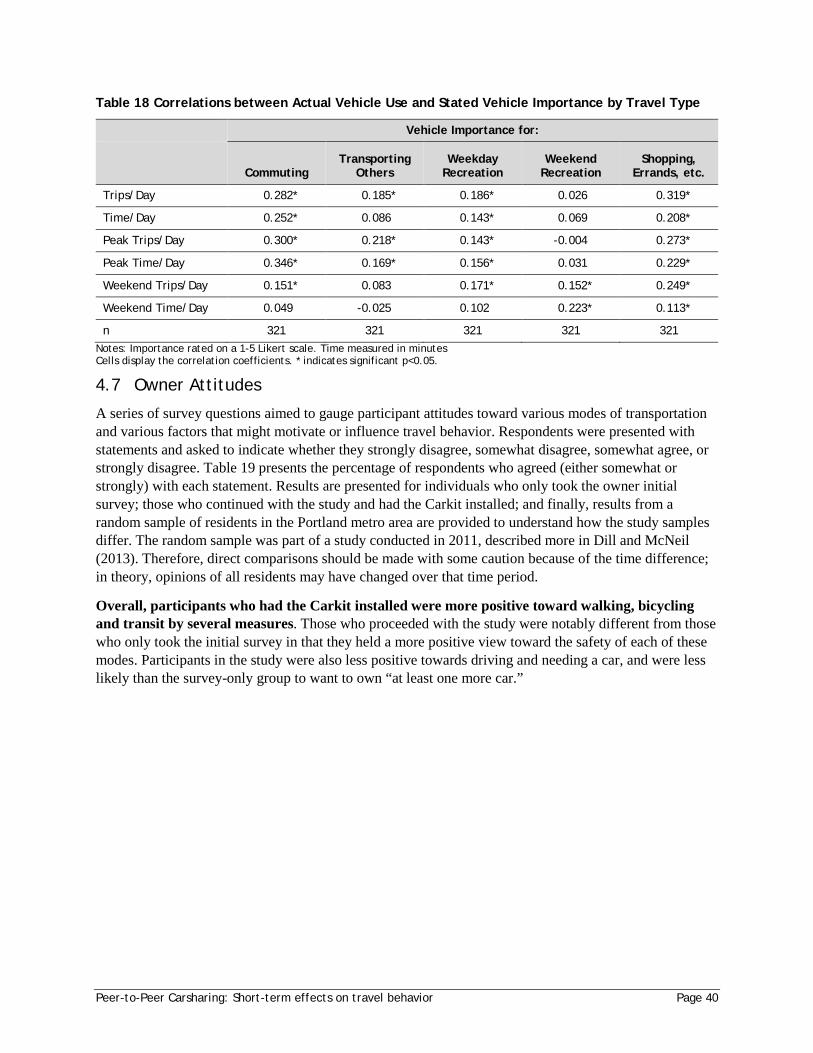
Peer-to-Peer Carsharing: Short-term effects on travel behavior Page 40
Table 18 Correlations between Actual Vehicle Use and Stated Vehicle Importance by Travel Type
Vehicle Importance for:
Commuting Transporting
Others Weekday
Recreation Weekend
Recreation Shopping,
Errands, etc.
Trips/Day 0.282* 0.185* 0.186* 0.026 0.319*
Time/Day 0.252* 0.086 0.143* 0.069 0.208*
Peak Trips/Day 0.300* 0.218* 0.143* -0.004 0.273*
Peak Time/Day 0.346* 0.169* 0.156* 0.031 0.229*
Weekend Trips/Day 0.151* 0.083 0.171* 0.152* 0.249*
Weekend Time/Day 0.049 -0.025 0.102 0.223* 0.113*
n 321 321 321 321 321 Notes: Importance rated on a 1-5 Likert scale. Time measured in minutes Cells display the correlation coefficients. * indicates significant p<0.05.
4.7 Owner Attitudes
A series of survey questions aimed to gauge participant attitudes toward various modes of transportation and various factors that might motivate or influence travel behavior. Respondents were presented with statements and asked to indicate whether they strongly disagree, somewhat disagree, somewhat agree, or strongly disagree. Table 19 presents the percentage of respondents who agreed (either somewhat or strongly) with each statement. Results are presented for individuals who only took the owner initial survey; those who continued with the study and had the Carkit installed; and finally, results from a random sample of residents in the Portland metro area are provided to understand how the study samples differ. The random sample was part of a study conducted in 2011, described more in Dill and McNeil (2013). Therefore, direct comparisons should be made with some caution because of the time difference; in theory, opinions of all residents may have changed over that time period.
Overall, participants who had the Carkit installed were more positive toward walking, bicycling and transit by several measures. Those who proceeded with the study were notably different from those who only took the initial survey in that they held a more positive view toward the safety of each of these modes. Participants in the study were also less positive towards driving and needing a car, and were less likely than the survey-only group to want to own “at least one more car.”
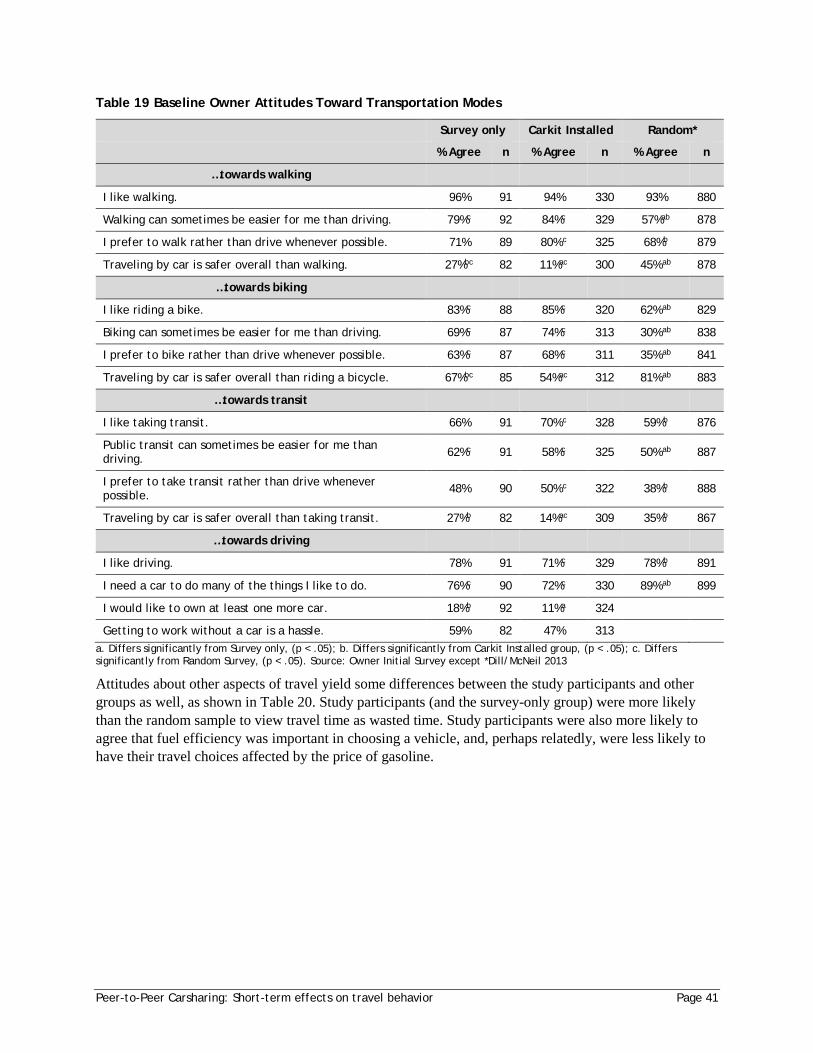
Peer-to-Peer Carsharing: Short-term effects on travel behavior Page 41
Table 19 Baseline Owner Attitudes Toward Transportation Modes
Survey only Carkit Installed Random*
% Agree n % Agree n % Agree n
…towards walking
I like walking. 96% 91 94% 330 93% 880
Walking can sometimes be easier for me than driving. 79%c 92 84%c 329 57%ab 878
I prefer to walk rather than drive whenever possible. 71% 89 80% c 325 68%b 879
Traveling by car is safer overall than walking. 27%bc 82 11%ac 300 45% ab 878
…towards biking
I like riding a bike. 83%c 88 85%c 320 62% ab 829
Biking can sometimes be easier for me than driving. 69%c 87 74%c 313 30% ab 838
I prefer to bike rather than drive whenever possible. 63%c 87 68%c 311 35% ab 841
Traveling by car is safer overall than riding a bicycle. 67%bc 85 54%ac 312 81% ab 883
…towards transit
I like taking transit. 66% 91 70% c 328 59%b 876
Public transit can sometimes be easier for me than driving. 62%c 91 58%c 325 50% ab 887
I prefer to take transit rather than drive whenever possible. 48% 90 50% c 322 38%b 888
Traveling by car is safer overall than taking transit. 27%b 82 14%ac 309 35%b 867
…towards driving
I like driving. 78% 91 71%c 329 78%b 891
I need a car to do many of the things I like to do. 76%c 90 72%c 330 89% ab 899
I would like to own at least one more car. 18%b 92 11%a 324
Getting to work without a car is a hassle. 59% 82 47% 313
a. Differs significantly from Survey only, (p < .05); b. Differs significantly from Carkit Installed group, (p < .05); c. Differs significantly from Random Survey, (p < .05). Source: Owner Initial Survey except *Dill/McNeil 2013
Attitudes about other aspects of travel yield some differences between the study participants and other groups as well, as shown in Table 20. Study participants (and the survey-only group) were more likely than the random sample to view travel time as wasted time. Study participants were also more likely to agree that fuel efficiency was important in choosing a vehicle, and, perhaps relatedly, were less likely to have their travel choices affected by the price of gasoline.
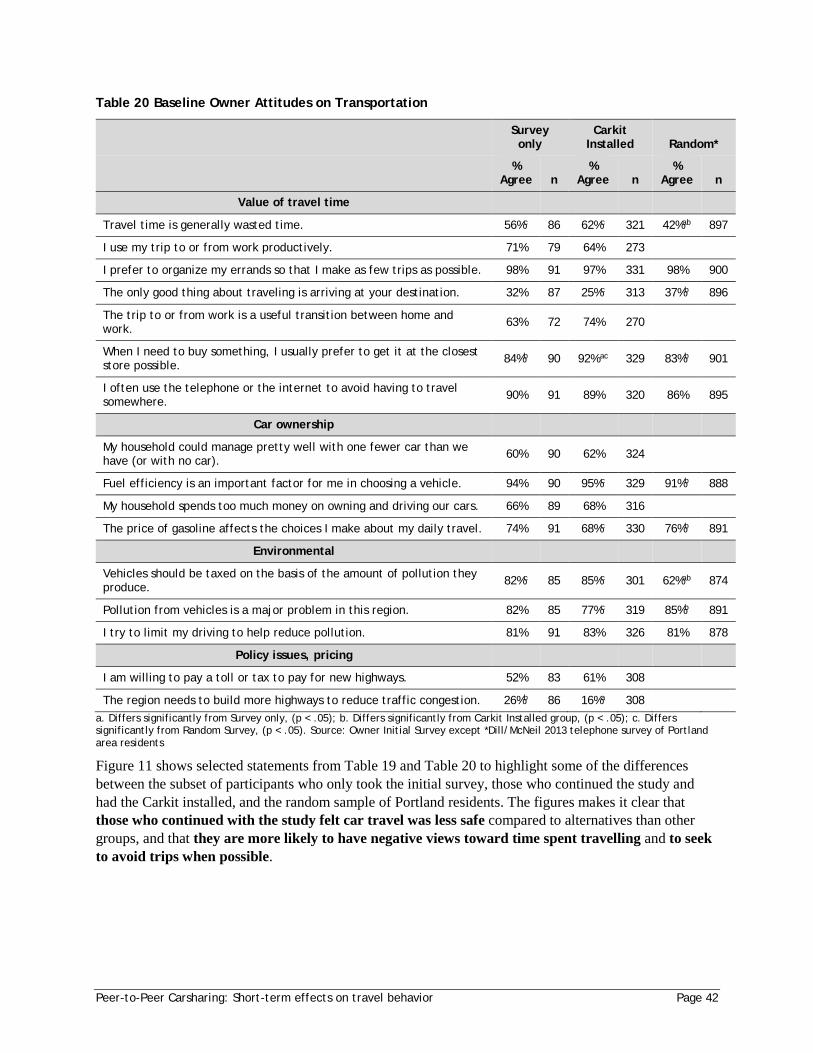
Peer-to-Peer Carsharing: Short-term effects on travel behavior Page 42
Table 20 Baseline Owner Attitudes on Transportation
Survey only
Carkit Installed Random*
% Agree n
% Agree n
% Agree n
Value of travel time
Travel time is generally wasted time. 56%c 86 62%c 321 42%ab 897
I use my trip to or from work productively. 71% 79 64% 273
I prefer to organize my errands so that I make as few trips as possible. 98% 91 97% 331 98% 900
The only good thing about traveling is arriving at your destination. 32% 87 25%c 313 37%b 896
The trip to or from work is a useful transition between home and work. 63% 72 74% 270
When I need to buy something, I usually prefer to get it at the closest store possible. 84%b 90 92% ac 329 83%b 901
I often use the telephone or the internet to avoid having to travel somewhere. 90% 91 89% 320 86% 895
Car ownership
My household could manage pretty well with one fewer car than we have (or with no car). 60% 90 62% 324
Fuel efficiency is an important factor for me in choosing a vehicle. 94% 90 95%c 329 91%b 888
My household spends too much money on owning and driving our cars. 66% 89 68% 316
The price of gasoline affects the choices I make about my daily travel. 74% 91 68%c 330 76%b 891
Environmental
Vehicles should be taxed on the basis of the amount of pollution they produce. 82%c 85 85%c 301 62%ab 874
Pollution from vehicles is a major problem in this region. 82% 85 77%c 319 85%b 891
I try to limit my driving to help reduce pollution. 81% 91 83% 326 81% 878
Policy issues, pricing
I am willing to pay a toll or tax to pay for new highways. 52% 83 61% 308
The region needs to build more highways to reduce traffic congestion. 26%b 86 16%a 308
a. Differs significantly from Survey only, (p < .05); b. Differs significantly from Carkit Installed group, (p < .05); c. Differs significantly from Random Survey, (p < .05). Source: Owner Initial Survey except *Dill/McNeil 2013 telephone survey of Portland area residents
Figure 11 shows selected statements from Table 19 and Table 20 to highlight some of the differences between the subset of participants who only took the initial survey, those who continued the study and had the Carkit installed, and the random sample of Portland residents. The figures makes it clear that those who continued with the study felt car travel was less safe compared to alternatives than other groups, and that they are more likely to have negative views toward time spent travelling and to seek to avoid trips when possible.
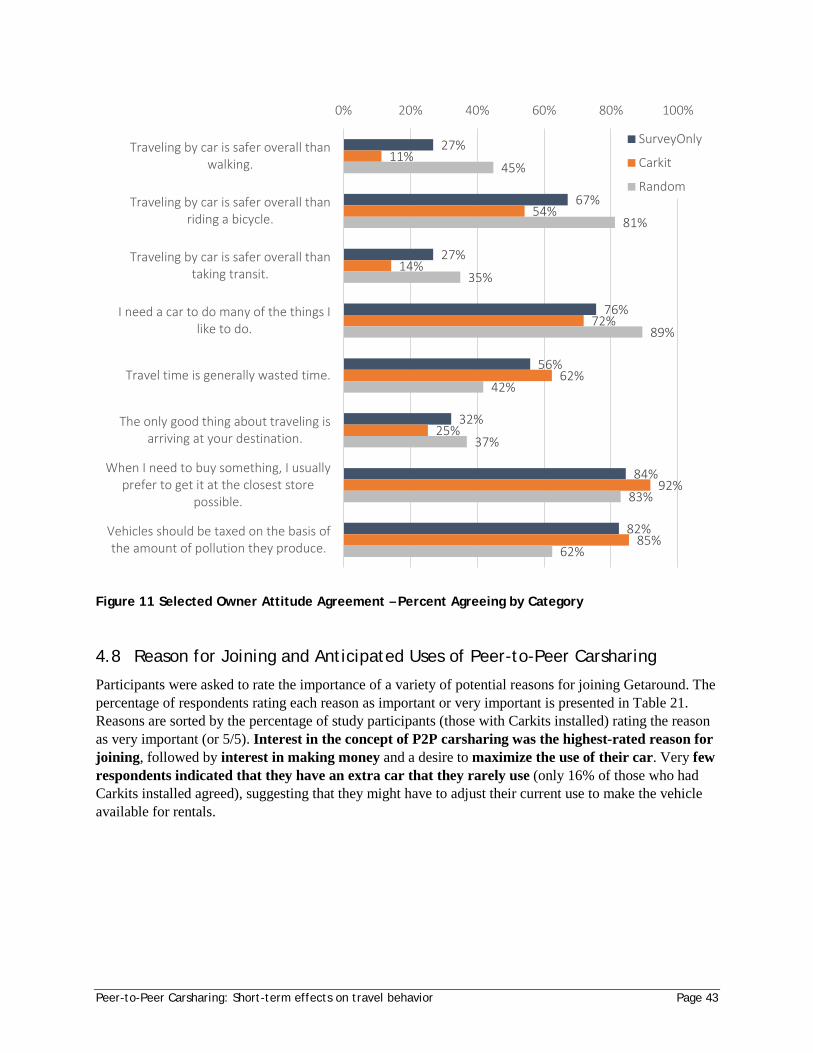
Peer-to-Peer Carsharing: Short-term effects on travel behavior Page 43
Figure 11 Selected Owner Attitude Agreement – Percent Agreeing by Category
4.8 Reason for Joining and Anticipated Uses of Peer-to-Peer Carsharing
Participants were asked to rate the importance of a variety of potential reasons for joining Getaround. The percentage of respondents rating each reason as important or very important is presented in Table 21. Reasons are sorted by the percentage of study participants (those with Carkits installed) rating the reason as very important (or 5/5). Interest in the concept of P2P carsharing was the highest-rated reason for joining, followed by interest in making money and a desire to maximize the use of their car. Very few respondents indicated that they have an extra car that they rarely use (only 16% of those who had Carkits installed agreed), suggesting that they might have to adjust their current use to make the vehicle available for rentals.
27%
67%
27%
76%
56%
32%
84%
82%
11%
54%
14%
72%
62%
25%
92%
85%
45%
81%
35%
89%
42%
37%
83%
62%
0% 20% 40% 60% 80% 100%
Traveling by car is safer overall thanwalking.
Traveling by car is safer overall thanriding a bicycle.
Traveling by car is safer overall thantaking transit.
I need a car to do many of the things Ilike to do.
Travel time is generally wasted time.
The only good thing about traveling isarriving at your destination.
When I need to buy something, I usuallyprefer to get it at the closest store
possible.
Vehicles should be taxed on the basis ofthe amount of pollution they produce.
SurveyOnly
Carkit
Random
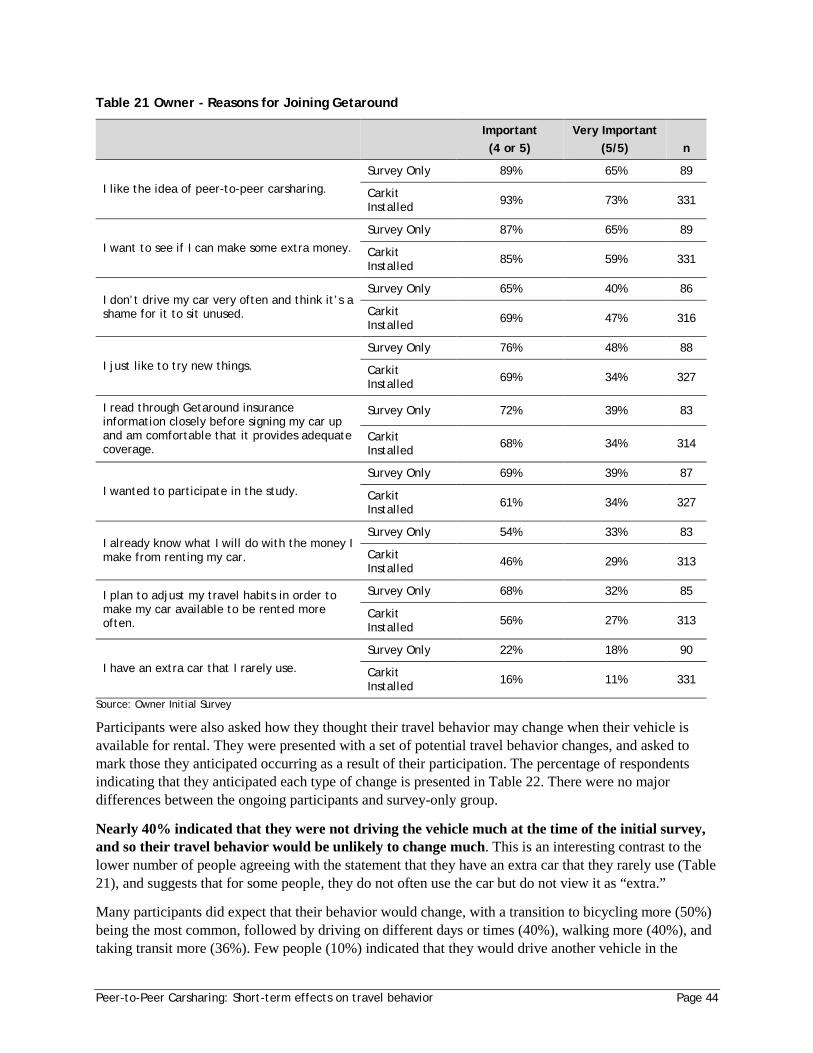
Peer-to-Peer Carsharing: Short-term effects on travel behavior Page 44
Table 21 Owner - Reasons for Joining Getaround
Important (4 or 5)
Very Important (5/5) n
I like the idea of peer-to-peer carsharing.
Survey Only 89% 65% 89
Carkit Installed 93% 73% 331
I want to see if I can make some extra money.
Survey Only 87% 65% 89
Carkit Installed 85% 59% 331
I don’t drive my car very often and think it’s a shame for it to sit unused.
Survey Only 65% 40% 86
Carkit Installed 69% 47% 316
I just like to try new things.
Survey Only 76% 48% 88
Carkit Installed 69% 34% 327
I read through Getaround insurance information closely before signing my car up and am comfortable that it provides adequate coverage.
Survey Only 72% 39% 83
Carkit Installed 68% 34% 314
I wanted to participate in the study.
Survey Only 69% 39% 87
Carkit Installed 61% 34% 327
I already know what I will do with the money I make from renting my car.
Survey Only 54% 33% 83
Carkit Installed 46% 29% 313
I plan to adjust my travel habits in order to make my car available to be rented more often.
Survey Only 68% 32% 85
Carkit Installed 56% 27% 313
I have an extra car that I rarely use.
Survey Only 22% 18% 90
Carkit Installed 16% 11% 331
Source: Owner Initial Survey
Participants were also asked how they thought their travel behavior may change when their vehicle is available for rental. They were presented with a set of potential travel behavior changes, and asked to mark those they anticipated occurring as a result of their participation. The percentage of respondents indicating that they anticipated each type of change is presented in Table 22. There were no major differences between the ongoing participants and survey-only group.
Nearly 40% indicated that they were not driving the vehicle much at the time of the initial survey, and so their travel behavior would be unlikely to change much. This is an interesting contrast to the lower number of people agreeing with the statement that they have an extra car that they rarely use (Table 21), and suggests that for some people, they do not often use the car but do not view it as “extra.”
Many participants did expect that their behavior would change, with a transition to bicycling more (50%) being the most common, followed by driving on different days or times (40%), walking more (40%), and taking transit more (36%). Few people (10%) indicated that they would drive another vehicle in the
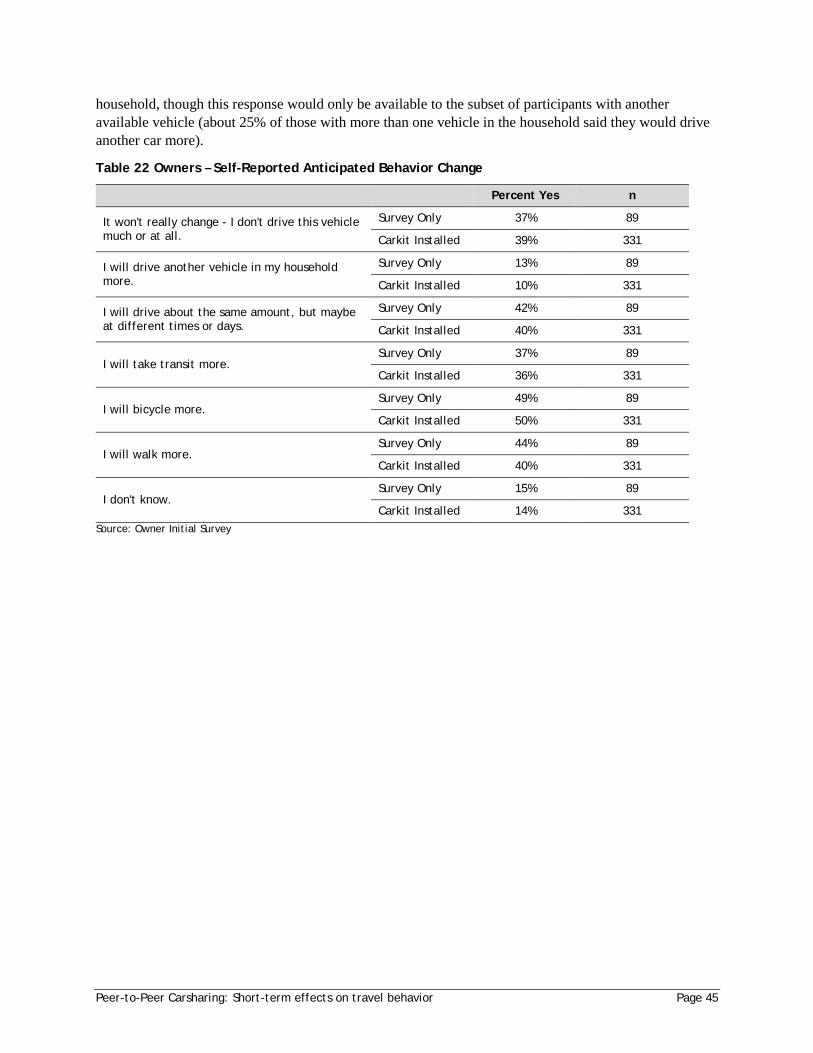
Peer-to-Peer Carsharing: Short-term effects on travel behavior Page 45
household, though this response would only be available to the subset of participants with another available vehicle (about 25% of those with more than one vehicle in the household said they would drive another car more).
Table 22 Owners – Self-Reported Anticipated Behavior Change
Percent Yes n
It won't really change - I don't drive this vehicle much or at all.
Survey Only 37% 89
Carkit Installed 39% 331
I will drive another vehicle in my household more.
Survey Only 13% 89
Carkit Installed 10% 331
I will drive about the same amount, but maybe at different times or days.
Survey Only 42% 89
Carkit Installed 40% 331
I will take transit more. Survey Only 37% 89
Carkit Installed 36% 331
I will bicycle more. Survey Only 49% 89
Carkit Installed 50% 331
I will walk more. Survey Only 44% 89
Carkit Installed 40% 331
I don't know. Survey Only 15% 89
Carkit Installed 14% 331 Source: Owner Initial Survey
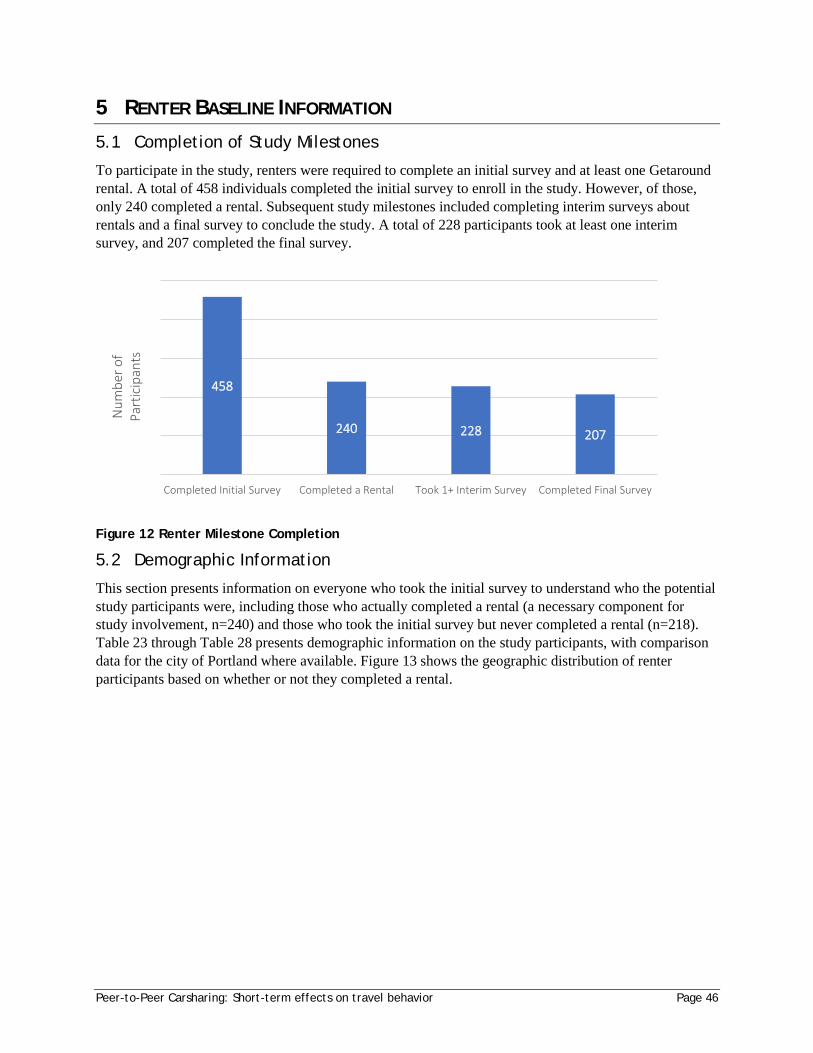
Peer-to-Peer Carsharing: Short-term effects on travel behavior Page 46
5 RENTER BASELINE INFORMATION
5.1 Completion of Study Milestones
To participate in the study, renters were required to complete an initial survey and at least one Getaround rental. A total of 458 individuals completed the initial survey to enroll in the study. However, of those, only 240 completed a rental. Subsequent study milestones included completing interim surveys about rentals and a final survey to conclude the study. A total of 228 participants took at least one interim survey, and 207 completed the final survey.
Figure 12 Renter Milestone Completion
5.2 Demographic Information
This section presents information on everyone who took the initial survey to understand who the potential study participants were, including those who actually completed a rental (a necessary component for study involvement, n=240) and those who took the initial survey but never completed a rental (n=218). Table 23 through Table 28 presents demographic information on the study participants, with comparison data for the city of Portland where available. Figure 13 shows the geographic distribution of renter participants based on whether or not they completed a rental.
458
240 228 207
Completed Initial Survey Completed a Rental Took 1+ Interim Survey Completed Final Survey
Num
ber o
f Pa
rtic
ipan
ts
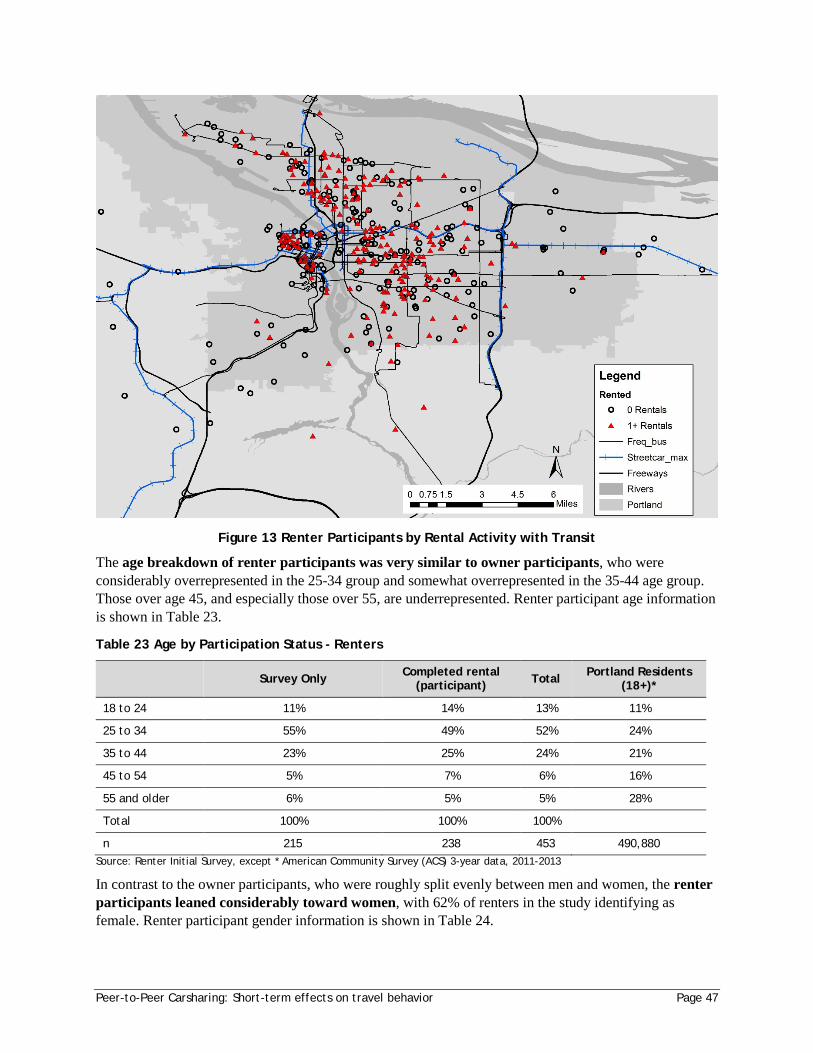
Peer-to-Peer Carsharing: Short-term effects on travel behavior Page 47
Figure 13 Renter Participants by Rental Activity with Transit
The age breakdown of renter participants was very similar to owner participants, who were considerably overrepresented in the 25-34 group and somewhat overrepresented in the 35-44 age group. Those over age 45, and especially those over 55, are underrepresented. Renter participant age information is shown in Table 23.
Table 23 Age by Participation Status - Renters
Survey Only Completed rental (participant) Total Portland Residents
(18+)*
18 to 24 11% 14% 13% 11%
25 to 34 55% 49% 52% 24%
35 to 44 23% 25% 24% 21%
45 to 54 5% 7% 6% 16%
55 and older 6% 5% 5% 28%
Total 100% 100% 100%
n 215 238 453 490,880 Source: Renter Initial Survey, except * American Community Survey (ACS) 3-year data, 2011-2013
In contrast to the owner participants, who were roughly split evenly between men and women, the renter participants leaned considerably toward women, with 62% of renters in the study identifying as female. Renter participant gender information is shown in Table 24.
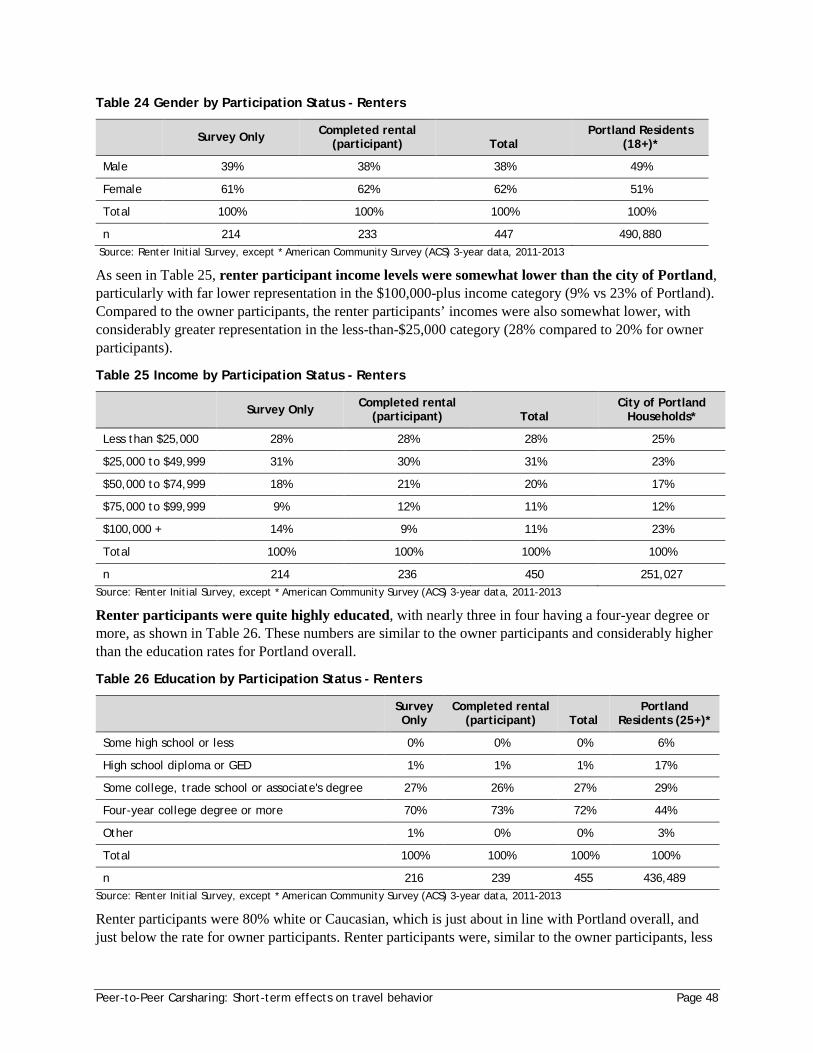
Peer-to-Peer Carsharing: Short-term effects on travel behavior Page 48
Table 24 Gender by Participation Status - Renters
Survey Only Completed rental (participant) Total
Portland Residents (18+)*
Male 39% 38% 38% 49%
Female 61% 62% 62% 51%
Total 100% 100% 100% 100%
n 214 233 447 490,880 Source: Renter Initial Survey, except * American Community Survey (ACS) 3-year data, 2011-2013
As seen in Table 25, renter participant income levels were somewhat lower than the city of Portland, particularly with far lower representation in the $100,000-plus income category (9% vs 23% of Portland). Compared to the owner participants, the renter participants’ incomes were also somewhat lower, with considerably greater representation in the less-than-$25,000 category (28% compared to 20% for owner participants).
Table 25 Income by Participation Status - Renters
Survey Only Completed rental (participant) Total
City of Portland Households*
Less than $25,000 28% 28% 28% 25%
$25,000 to $49,999 31% 30% 31% 23%
$50,000 to $74,999 18% 21% 20% 17%
$75,000 to $99,999 9% 12% 11% 12%
$100,000 + 14% 9% 11% 23%
Total 100% 100% 100% 100%
n 214 236 450 251,027 Source: Renter Initial Survey, except * American Community Survey (ACS) 3-year data, 2011-2013
Renter participants were quite highly educated, with nearly three in four having a four-year degree or more, as shown in Table 26. These numbers are similar to the owner participants and considerably higher than the education rates for Portland overall.
Table 26 Education by Participation Status - Renters
Survey Only
Completed rental (participant) Total
Portland Residents (25+)*
Some high school or less 0% 0% 0% 6%
High school diploma or GED 1% 1% 1% 17%
Some college, trade school or associate's degree 27% 26% 27% 29%
Four-year college degree or more 70% 73% 72% 44%
Other 1% 0% 0% 3%
Total 100% 100% 100% 100%
n 216 239 455 436,489 Source: Renter Initial Survey, except * American Community Survey (ACS) 3-year data, 2011-2013
Renter participants were 80% white or Caucasian, which is just about in line with Portland overall, and just below the rate for owner participants. Renter participants were, similar to the owner participants, less
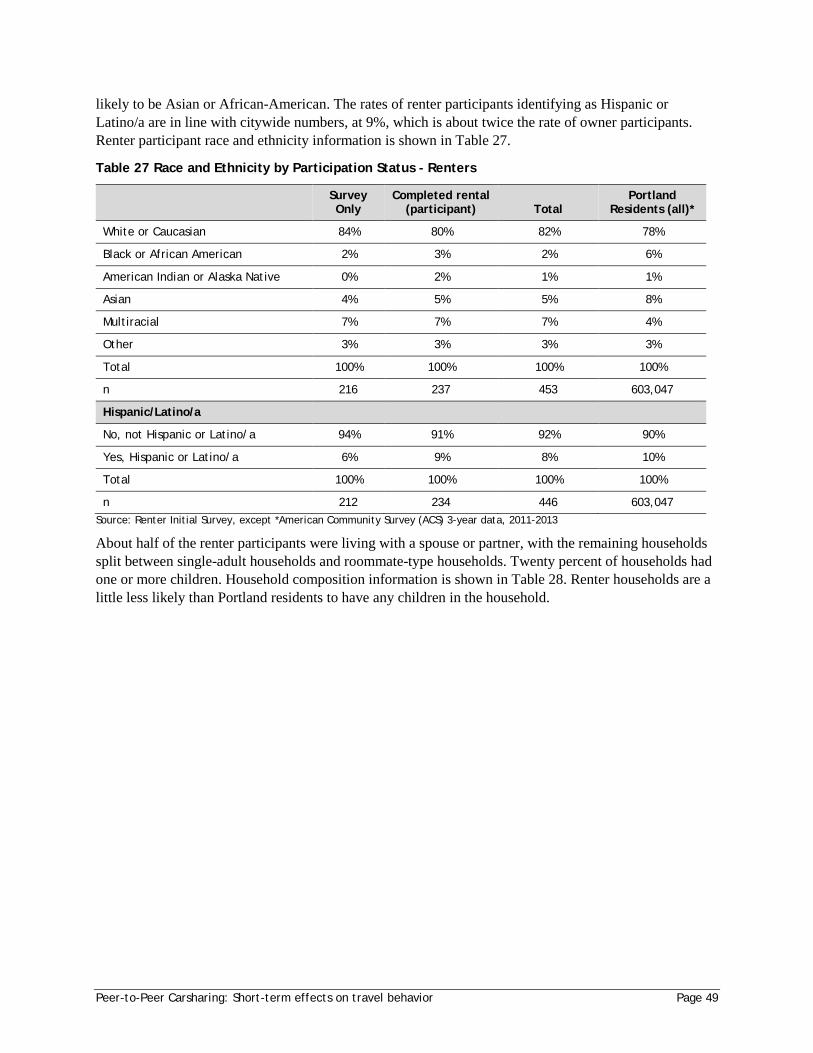
Peer-to-Peer Carsharing: Short-term effects on travel behavior Page 49
likely to be Asian or African-American. The rates of renter participants identifying as Hispanic or Latino/a are in line with citywide numbers, at 9%, which is about twice the rate of owner participants. Renter participant race and ethnicity information is shown in Table 27.
Table 27 Race and Ethnicity by Participation Status - Renters
Survey Only
Completed rental (participant) Total
Portland Residents (all)*
White or Caucasian 84% 80% 82% 78%
Black or African American 2% 3% 2% 6%
American Indian or Alaska Native 0% 2% 1% 1%
Asian 4% 5% 5% 8%
Multiracial 7% 7% 7% 4%
Other 3% 3% 3% 3%
Total 100% 100% 100% 100%
n 216 237 453 603,047
Hispanic/Latino/a
No, not Hispanic or Latino/a 94% 91% 92% 90%
Yes, Hispanic or Latino/a 6% 9% 8% 10%
Total 100% 100% 100% 100%
n 212 234 446 603,047 Source: Renter Initial Survey, except *American Community Survey (ACS) 3-year data, 2011-2013
About half of the renter participants were living with a spouse or partner, with the remaining households split between single-adult households and roommate-type households. Twenty percent of households had one or more children. Household composition information is shown in Table 28. Renter households are a little less likely than Portland residents to have any children in the household.
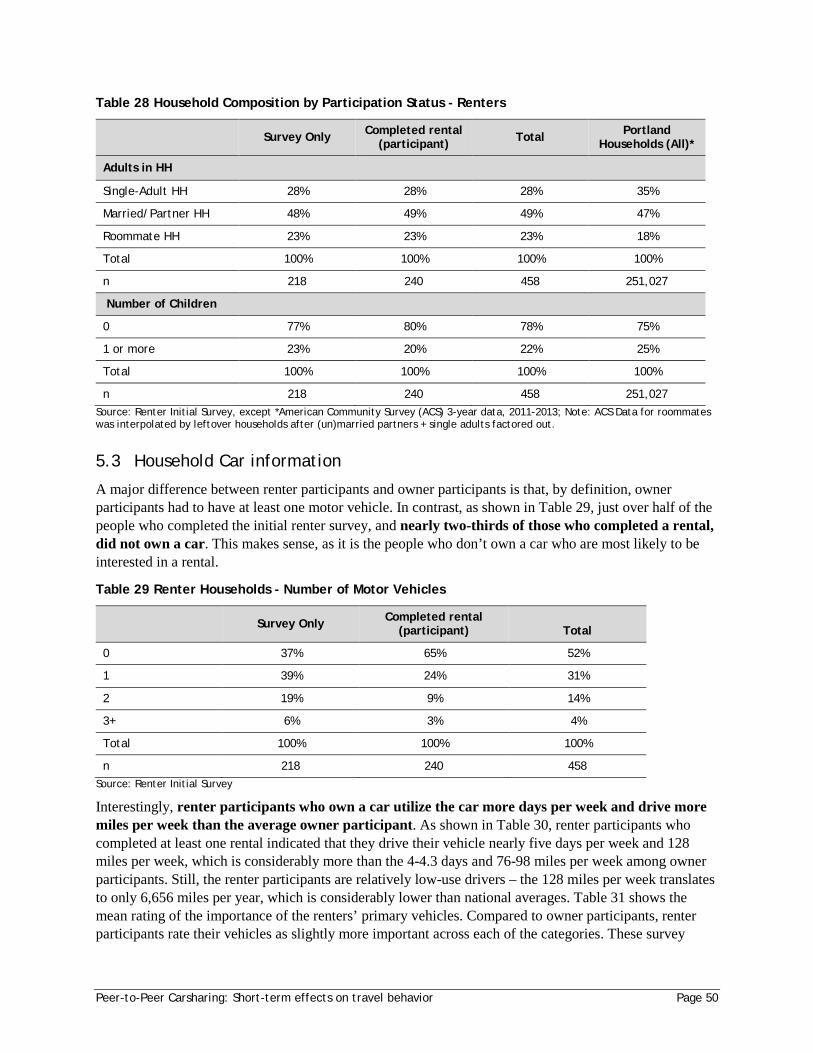
Peer-to-Peer Carsharing: Short-term effects on travel behavior Page 50
Table 28 Household Composition by Participation Status - Renters
Survey Only Completed rental (participant) Total Portland
Households (All)*
Adults in HH
Single-Adult HH 28% 28% 28% 35%
Married/Partner HH 48% 49% 49% 47%
Roommate HH 23% 23% 23% 18%
Total 100% 100% 100% 100%
n 218 240 458 251,027
Number of Children
0 77% 80% 78% 75%
1 or more 23% 20% 22% 25%
Total 100% 100% 100% 100%
n 218 240 458 251,027 Source: Renter Initial Survey, except *American Community Survey (ACS) 3-year data, 2011-2013; Note: ACS Data for roommates was interpolated by leftover households after (un)married partners + single adults factored out.
5.3 Household Car information
A major difference between renter participants and owner participants is that, by definition, owner participants had to have at least one motor vehicle. In contrast, as shown in Table 29, just over half of the people who completed the initial renter survey, and nearly two-thirds of those who completed a rental, did not own a car. This makes sense, as it is the people who don’t own a car who are most likely to be interested in a rental.
Table 29 Renter Households - Number of Motor Vehicles
Survey Only Completed rental (participant) Total
0 37% 65% 52%
1 39% 24% 31%
2 19% 9% 14%
3+ 6% 3% 4%
Total 100% 100% 100%
n 218 240 458 Source: Renter Initial Survey
Interestingly, renter participants who own a car utilize the car more days per week and drive more miles per week than the average owner participant. As shown in Table 30, renter participants who completed at least one rental indicated that they drive their vehicle nearly five days per week and 128 miles per week, which is considerably more than the 4-4.3 days and 76-98 miles per week among owner participants. Still, the renter participants are relatively low-use drivers – the 128 miles per week translates to only 6,656 miles per year, which is considerably lower than national averages. Table 31 shows the mean rating of the importance of the renters’ primary vehicles. Compared to owner participants, renter participants rate their vehicles as slightly more important across each of the categories. These survey
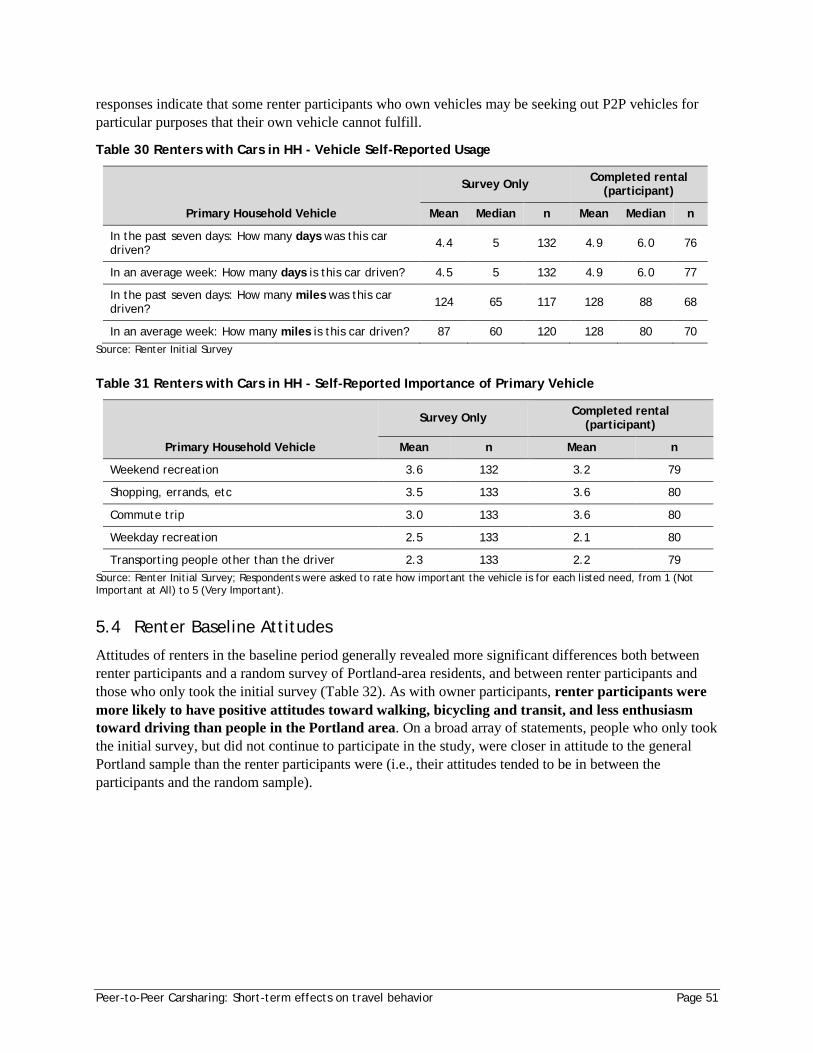
Peer-to-Peer Carsharing: Short-term effects on travel behavior Page 51
responses indicate that some renter participants who own vehicles may be seeking out P2P vehicles for particular purposes that their own vehicle cannot fulfill.
Table 30 Renters with Cars in HH - Vehicle Self-Reported Usage
Primary Household Vehicle
Survey Only Completed rental (participant)
Mean Median n Mean Median n
In the past seven days: How many days was this car driven? 4.4 5 132 4.9 6.0 76
In an average week: How many days is this car driven? 4.5 5 132 4.9 6.0 77
In the past seven days: How many miles was this car driven? 124 65 117 128 88 68
In an average week: How many miles is this car driven? 87 60 120 128 80 70 Source: Renter Initial Survey
Table 31 Renters with Cars in HH - Self-Reported Importance of Primary Vehicle
Primary Household Vehicle
Survey Only Completed rental (participant)
Mean n Mean n
Weekend recreation 3.6 132 3.2 79
Shopping, errands, etc 3.5 133 3.6 80
Commute trip 3.0 133 3.6 80
Weekday recreation 2.5 133 2.1 80
Transporting people other than the driver 2.3 133 2.2 79 Source: Renter Initial Survey; Respondents were asked to rate how important the vehicle is for each listed need, from 1 (Not Important at All) to 5 (Very Important).
5.4 Renter Baseline Attitudes
Attitudes of renters in the baseline period generally revealed more significant differences both between renter participants and a random survey of Portland-area residents, and between renter participants and those who only took the initial survey (Table 32). As with owner participants, renter participants were more likely to have positive attitudes toward walking, bicycling and transit, and less enthusiasm toward driving than people in the Portland area. On a broad array of statements, people who only took the initial survey, but did not continue to participate in the study, were closer in attitude to the general Portland sample than the renter participants were (i.e., their attitudes tended to be in between the participants and the random sample).
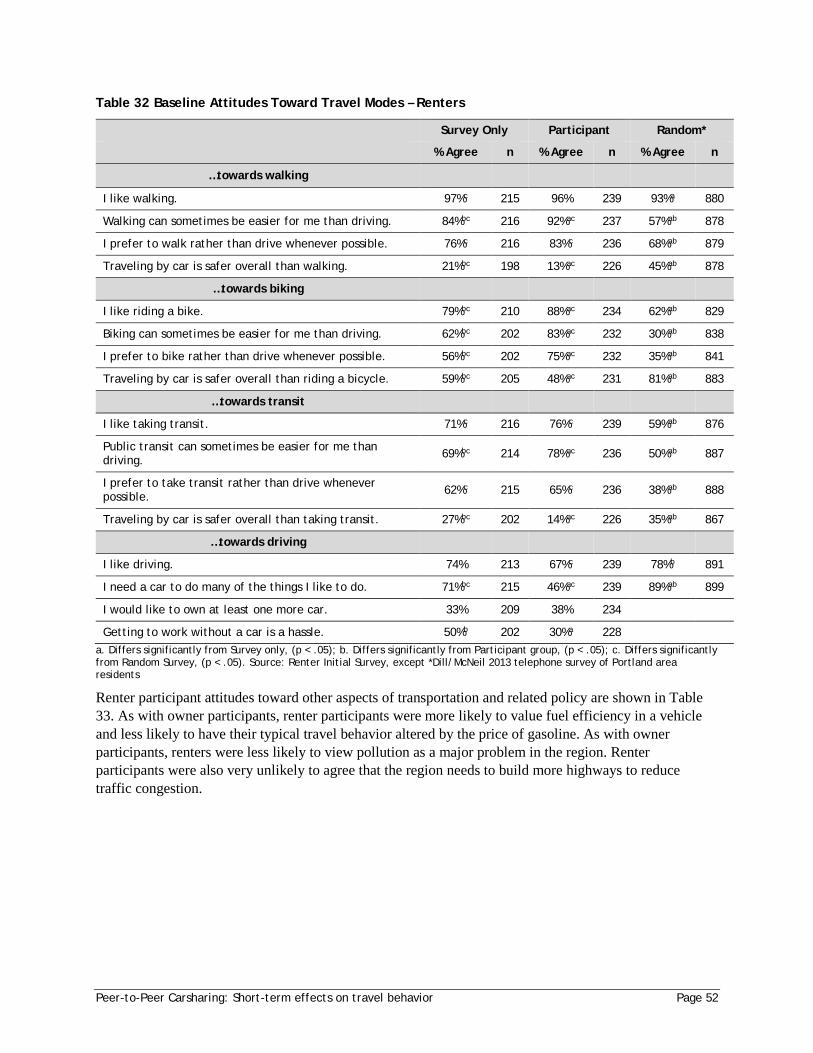
Peer-to-Peer Carsharing: Short-term effects on travel behavior Page 52
Table 32 Baseline Attitudes Toward Travel Modes – Renters
Survey Only Participant Random*
% Agree n % Agree n % Agree n
…towards walking
I like walking. 97%c 215 96% 239 93%a 880
Walking can sometimes be easier for me than driving. 84%bc 216 92%ac 237 57%ab 878
I prefer to walk rather than drive whenever possible. 76%c 216 83%c 236 68%ab 879
Traveling by car is safer overall than walking. 21%bc 198 13%ac 226 45%ab 878
…towards biking
I like riding a bike. 79%bc 210 88%ac 234 62%ab 829
Biking can sometimes be easier for me than driving. 62%bc 202 83%ac 232 30%ab 838
I prefer to bike rather than drive whenever possible. 56%bc 202 75%ac 232 35%ab 841
Traveling by car is safer overall than riding a bicycle. 59%bc 205 48%ac 231 81%ab 883
…towards transit
I like taking transit. 71%c 216 76%c 239 59%ab 876
Public transit can sometimes be easier for me than driving. 69%bc 214 78%ac 236 50%ab 887
I prefer to take transit rather than drive whenever possible. 62%c 215 65%c 236 38%ab 888
Traveling by car is safer overall than taking transit. 27%bc 202 14%ac 226 35%ab 867
…towards driving
I like driving. 74% 213 67%c 239 78%b 891
I need a car to do many of the things I like to do. 71%bc 215 46%ac 239 89%ab 899
I would like to own at least one more car. 33% 209 38% 234
Getting to work without a car is a hassle. 50%b 202 30%a 228
a. Differs significantly from Survey only, (p < .05); b. Differs significantly from Participant group, (p < .05); c. Differs significantly from Random Survey, (p < .05). Source: Renter Initial Survey, except *Dill/McNeil 2013 telephone survey of Portland area residents
Renter participant attitudes toward other aspects of transportation and related policy are shown in Table 33. As with owner participants, renter participants were more likely to value fuel efficiency in a vehicle and less likely to have their typical travel behavior altered by the price of gasoline. As with owner participants, renters were less likely to view pollution as a major problem in the region. Renter participants were also very unlikely to agree that the region needs to build more highways to reduce traffic congestion.
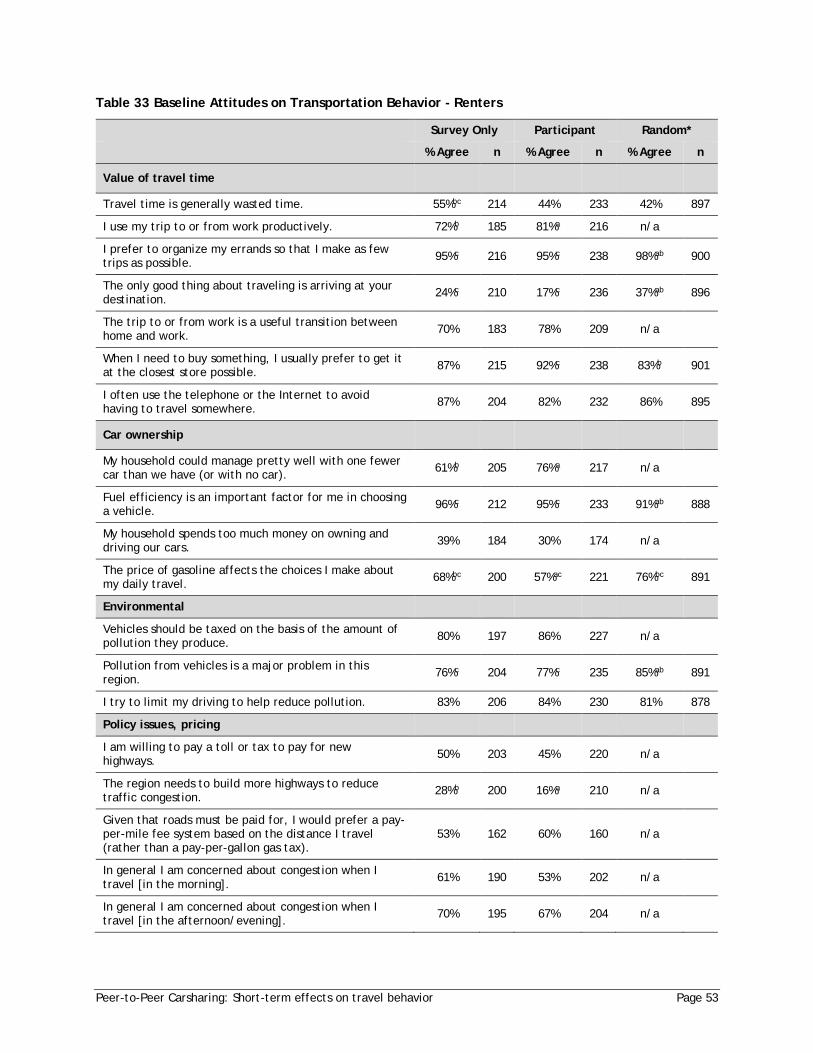
Peer-to-Peer Carsharing: Short-term effects on travel behavior Page 53
Table 33 Baseline Attitudes on Transportation Behavior - Renters
Survey Only Participant Random*
% Agree n % Agree n % Agree n
Value of travel time
Travel time is generally wasted time. 55%bc 214 44% 233 42% 897
I use my trip to or from work productively. 72%b 185 81%a 216 n/a
I prefer to organize my errands so that I make as few trips as possible. 95%c 216 95%c 238 98%ab 900
The only good thing about traveling is arriving at your destination. 24%c 210 17%c 236 37%ab 896
The trip to or from work is a useful transition between home and work. 70% 183 78% 209 n/a
When I need to buy something, I usually prefer to get it at the closest store possible. 87% 215 92%c 238 83%b 901
I often use the telephone or the Internet to avoid having to travel somewhere. 87% 204 82% 232 86% 895
Car ownership
My household could manage pretty well with one fewer car than we have (or with no car). 61%b 205 76%a 217 n/a
Fuel efficiency is an important factor for me in choosing a vehicle. 96%c 212 95%c 233 91%ab 888
My household spends too much money on owning and driving our cars. 39% 184 30% 174 n/a
The price of gasoline affects the choices I make about my daily travel. 68%bc 200 57%ac 221 76%bc 891
Environmental
Vehicles should be taxed on the basis of the amount of pollution they produce. 80% 197 86% 227 n/a
Pollution from vehicles is a major problem in this region. 76%c 204 77%c 235 85%ab 891
I try to limit my driving to help reduce pollution. 83% 206 84% 230 81% 878
Policy issues, pricing
I am willing to pay a toll or tax to pay for new highways. 50% 203 45% 220 n/a
The region needs to build more highways to reduce traffic congestion. 28%b 200 16%a 210 n/a
Given that roads must be paid for, I would prefer a pay-per-mile fee system based on the distance I travel (rather than a pay-per-gallon gas tax).
53% 162 60% 160 n/a
In general I am concerned about congestion when I travel [in the morning]. 61% 190 53% 202 n/a
In general I am concerned about congestion when I travel [in the afternoon/evening]. 70% 195 67% 204 n/a
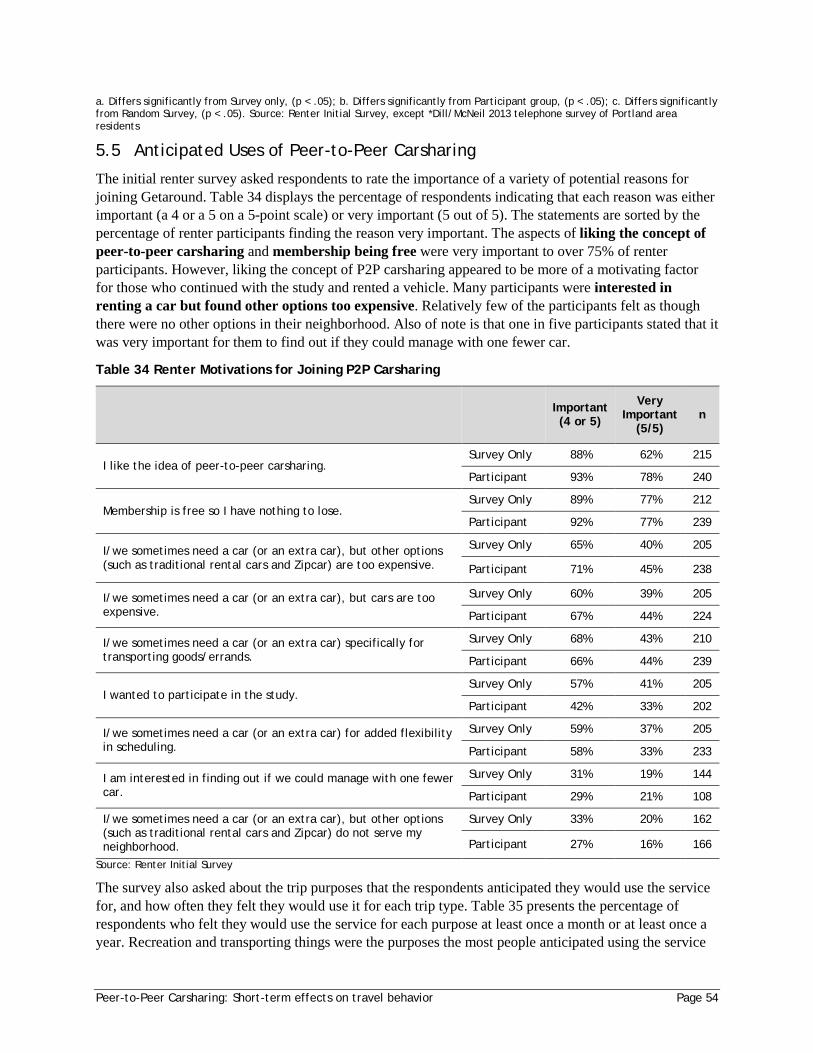
Peer-to-Peer Carsharing: Short-term effects on travel behavior Page 54
a. Differs significantly from Survey only, (p < .05); b. Differs significantly from Participant group, (p < .05); c. Differs significantly from Random Survey, (p < .05). Source: Renter Initial Survey, except *Dill/McNeil 2013 telephone survey of Portland area residents
5.5 Anticipated Uses of Peer-to-Peer Carsharing
The initial renter survey asked respondents to rate the importance of a variety of potential reasons for joining Getaround. Table 34 displays the percentage of respondents indicating that each reason was either important (a 4 or a 5 on a 5-point scale) or very important (5 out of 5). The statements are sorted by the percentage of renter participants finding the reason very important. The aspects of liking the concept of peer-to-peer carsharing and membership being free were very important to over 75% of renter participants. However, liking the concept of P2P carsharing appeared to be more of a motivating factor for those who continued with the study and rented a vehicle. Many participants were interested in renting a car but found other options too expensive. Relatively few of the participants felt as though there were no other options in their neighborhood. Also of note is that one in five participants stated that it was very important for them to find out if they could manage with one fewer car.
Table 34 Renter Motivations for Joining P2P Carsharing
Important (4 or 5)
Very Important
(5/5) n
I like the idea of peer-to-peer carsharing. Survey Only 88% 62% 215
Participant 93% 78% 240
Membership is free so I have nothing to lose. Survey Only 89% 77% 212
Participant 92% 77% 239
I/we sometimes need a car (or an extra car), but other options (such as traditional rental cars and Zipcar) are too expensive.
Survey Only 65% 40% 205
Participant 71% 45% 238
I/we sometimes need a car (or an extra car), but cars are too expensive.
Survey Only 60% 39% 205
Participant 67% 44% 224
I/we sometimes need a car (or an extra car) specifically for transporting goods/errands.
Survey Only 68% 43% 210
Participant 66% 44% 239
I wanted to participate in the study. Survey Only 57% 41% 205
Participant 42% 33% 202
I/we sometimes need a car (or an extra car) for added flexibility in scheduling.
Survey Only 59% 37% 205
Participant 58% 33% 233
I am interested in finding out if we could manage with one fewer car.
Survey Only 31% 19% 144
Participant 29% 21% 108
I/we sometimes need a car (or an extra car), but other options (such as traditional rental cars and Zipcar) do not serve my neighborhood.
Survey Only 33% 20% 162
Participant 27% 16% 166
Source: Renter Initial Survey
The survey also asked about the trip purposes that the respondents anticipated they would use the service for, and how often they felt they would use it for each trip type. Table 35 presents the percentage of respondents who felt they would use the service for each purpose at least once a month or at least once a year. Recreation and transporting things were the purposes the most people anticipated using the service
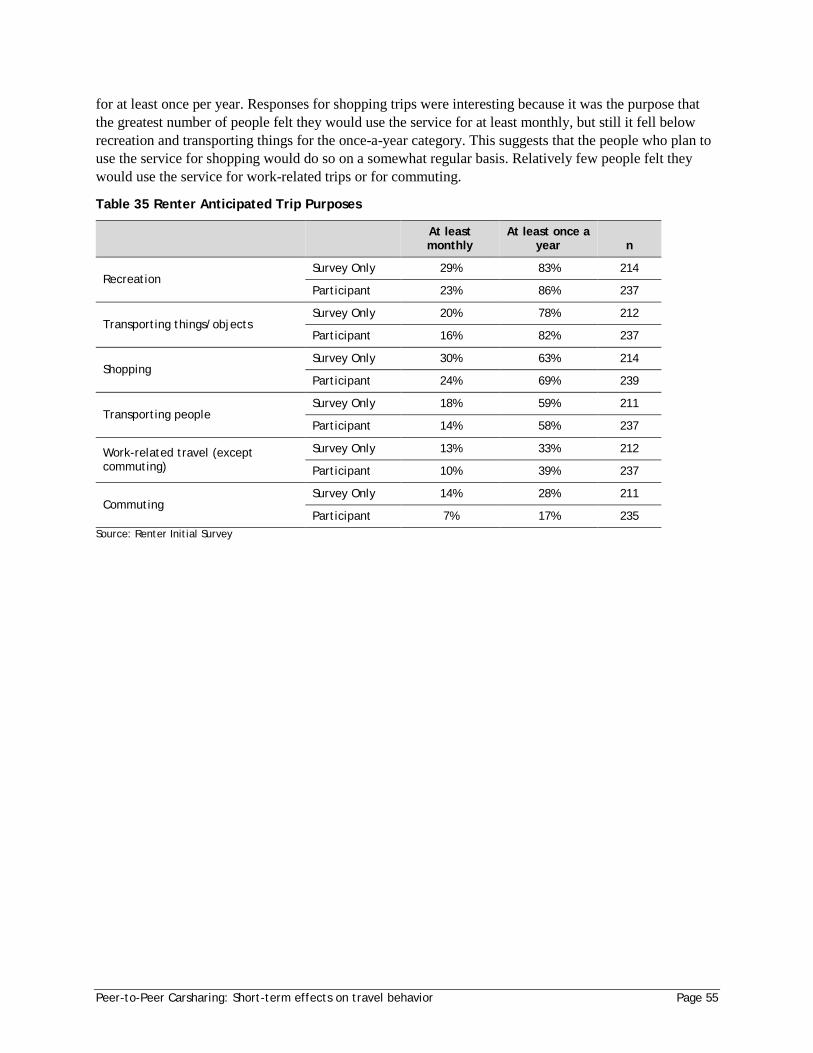
Peer-to-Peer Carsharing: Short-term effects on travel behavior Page 55
for at least once per year. Responses for shopping trips were interesting because it was the purpose that the greatest number of people felt they would use the service for at least monthly, but still it fell below recreation and transporting things for the once-a-year category. This suggests that the people who plan to use the service for shopping would do so on a somewhat regular basis. Relatively few people felt they would use the service for work-related trips or for commuting.
Table 35 Renter Anticipated Trip Purposes
At least monthly
At least once a year n
Recreation Survey Only 29% 83% 214
Participant 23% 86% 237
Transporting things/objects Survey Only 20% 78% 212
Participant 16% 82% 237
Shopping Survey Only 30% 63% 214
Participant 24% 69% 239
Transporting people Survey Only 18% 59% 211
Participant 14% 58% 237
Work-related travel (except commuting)
Survey Only 13% 33% 212
Participant 10% 39% 237
Commuting Survey Only 14% 28% 211
Participant 7% 17% 235 Source: Renter Initial Survey
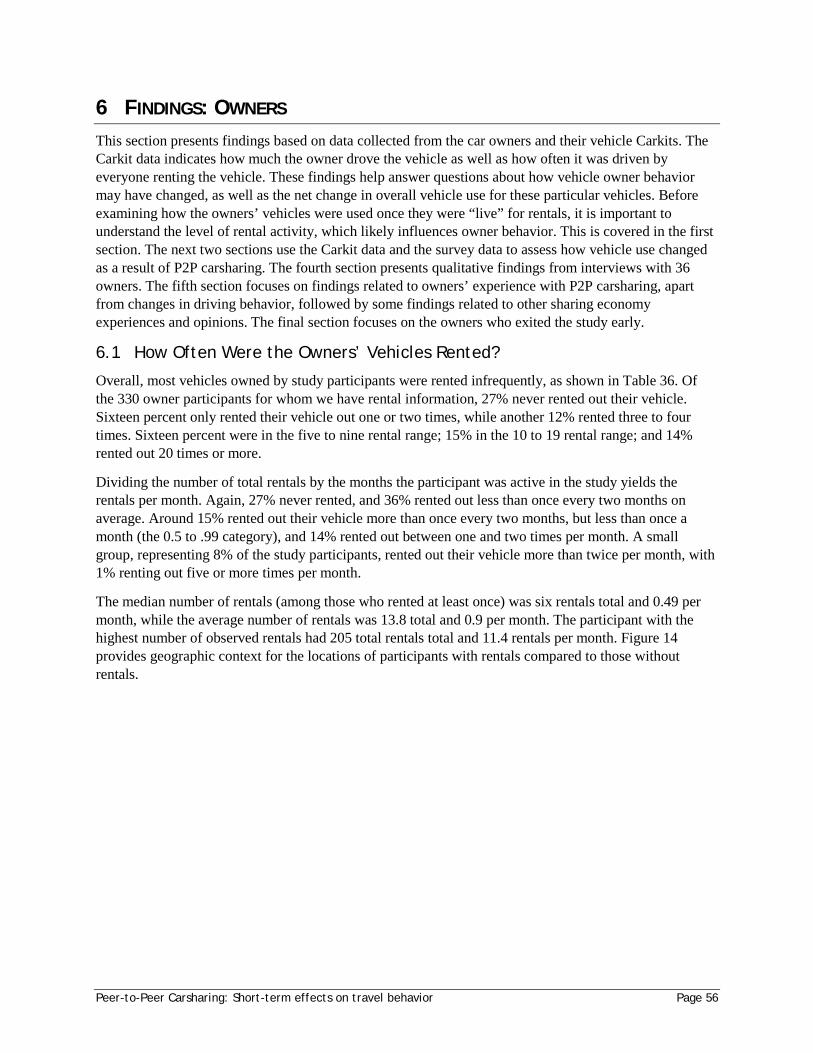
Peer-to-Peer Carsharing: Short-term effects on travel behavior Page 56
6 FINDINGS: OWNERS This section presents findings based on data collected from the car owners and their vehicle Carkits. The Carkit data indicates how much the owner drove the vehicle as well as how often it was driven by everyone renting the vehicle. These findings help answer questions about how vehicle owner behavior may have changed, as well as the net change in overall vehicle use for these particular vehicles. Before examining how the owners’ vehicles were used once they were “live” for rentals, it is important to understand the level of rental activity, which likely influences owner behavior. This is covered in the first section. The next two sections use the Carkit data and the survey data to assess how vehicle use changed as a result of P2P carsharing. The fourth section presents qualitative findings from interviews with 36 owners. The fifth section focuses on findings related to owners’ experience with P2P carsharing, apart from changes in driving behavior, followed by some findings related to other sharing economy experiences and opinions. The final section focuses on the owners who exited the study early.
6.1 How Often Were the Owners’ Vehicles Rented?
Overall, most vehicles owned by study participants were rented infrequently, as shown in Table 36. Of the 330 owner participants for whom we have rental information, 27% never rented out their vehicle. Sixteen percent only rented their vehicle out one or two times, while another 12% rented three to four times. Sixteen percent were in the five to nine rental range; 15% in the 10 to 19 rental range; and 14% rented out 20 times or more.
Dividing the number of total rentals by the months the participant was active in the study yields the rentals per month. Again, 27% never rented, and 36% rented out less than once every two months on average. Around 15% rented out their vehicle more than once every two months, but less than once a month (the 0.5 to .99 category), and 14% rented out between one and two times per month. A small group, representing 8% of the study participants, rented out their vehicle more than twice per month, with 1% renting out five or more times per month.
The median number of rentals (among those who rented at least once) was six rentals total and 0.49 per month, while the average number of rentals was 13.8 total and 0.9 per month. The participant with the highest number of observed rentals had 205 total rentals total and 11.4 rentals per month. Figure 14 provides geographic context for the locations of participants with rentals compared to those without rentals.
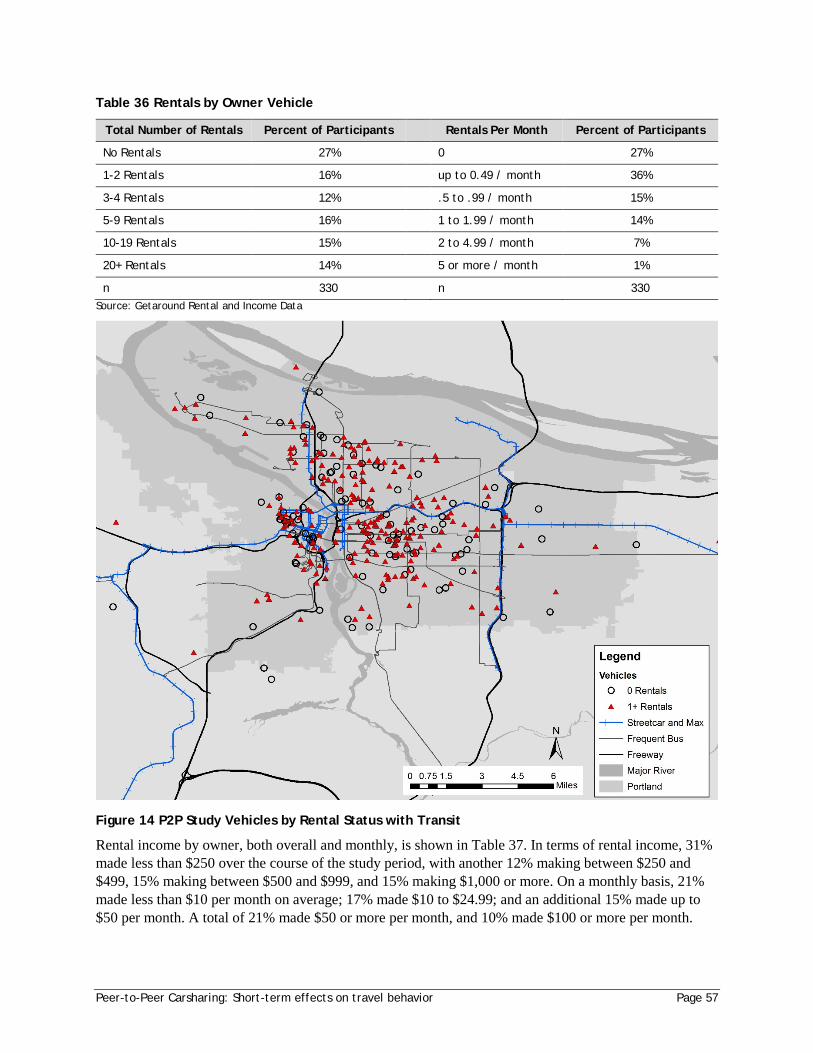
Peer-to-Peer Carsharing: Short-term effects on travel behavior Page 57
Table 36 Rentals by Owner Vehicle
Total Number of Rentals Percent of Participants Rentals Per Month Percent of Participants
No Rentals 27% 0 27%
1-2 Rentals 16% up to 0.49 / month 36%
3-4 Rentals 12% .5 to .99 / month 15%
5-9 Rentals 16% 1 to 1.99 / month 14%
10-19 Rentals 15% 2 to 4.99 / month 7%
20+ Rentals 14% 5 or more / month 1%
n 330 n 330 Source: Getaround Rental and Income Data
Figure 14 P2P Study Vehicles by Rental Status with Transit
Rental income by owner, both overall and monthly, is shown in Table 37. In terms of rental income, 31% made less than $250 over the course of the study period, with another 12% making between $250 and $499, 15% making between $500 and $999, and 15% making $1,000 or more. On a monthly basis, 21% made less than $10 per month on average; 17% made $10 to $24.99; and an additional 15% made up to $50 per month. A total of 21% made $50 or more per month, and 10% made $100 or more per month.
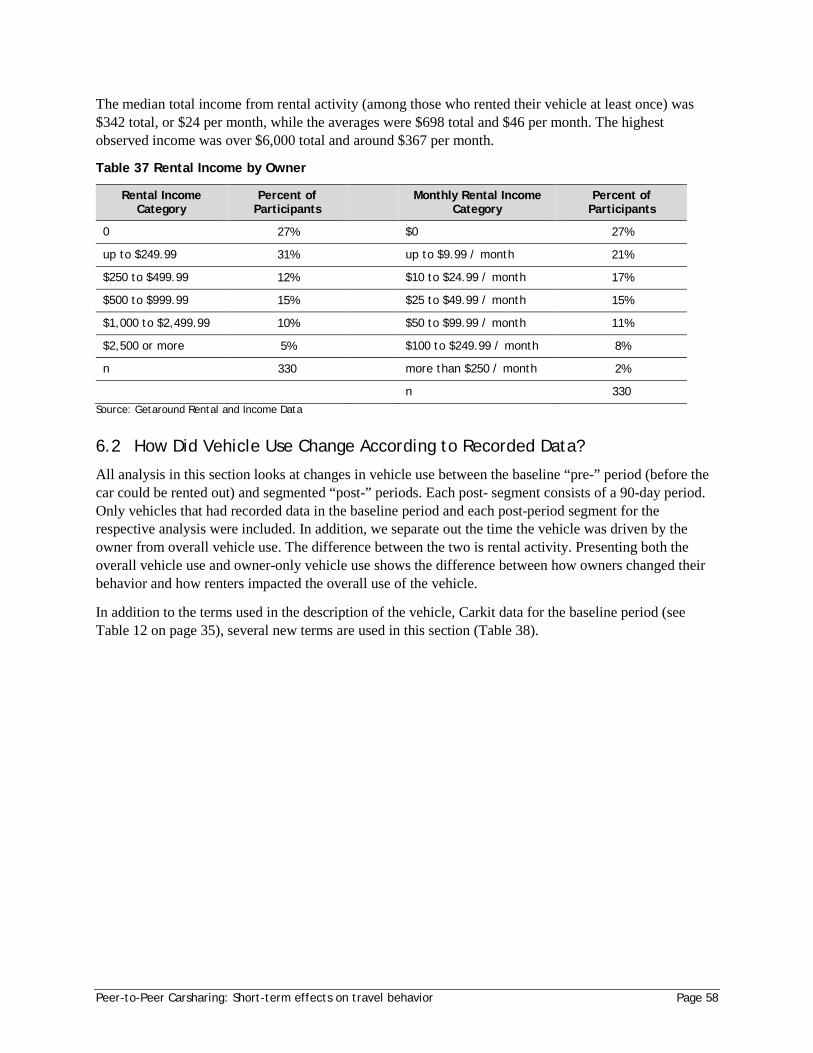
Peer-to-Peer Carsharing: Short-term effects on travel behavior Page 58
The median total income from rental activity (among those who rented their vehicle at least once) was $342 total, or $24 per month, while the averages were $698 total and $46 per month. The highest observed income was over $6,000 total and around $367 per month.
Table 37 Rental Income by Owner
Rental Income Category
Percent of Participants
Monthly Rental Income Category
Percent of Participants
0 27% $0 27%
up to $249.99 31% up to $9.99 / month 21%
$250 to $499.99 12% $10 to $24.99 / month 17%
$500 to $999.99 15% $25 to $49.99 / month 15%
$1,000 to $2,499.99 10% $50 to $99.99 / month 11%
$2,500 or more 5% $100 to $249.99 / month 8%
n 330 more than $250 / month 2%
n 330 Source: Getaround Rental and Income Data
6.2 How Did Vehicle Use Change According to Recorded Data?
All analysis in this section looks at changes in vehicle use between the baseline “pre-” period (before the car could be rented out) and segmented “post-” periods. Each post- segment consists of a 90-day period. Only vehicles that had recorded data in the baseline period and each post-period segment for the respective analysis were included. In addition, we separate out the time the vehicle was driven by the owner from overall vehicle use. The difference between the two is rental activity. Presenting both the overall vehicle use and owner-only vehicle use shows the difference between how owners changed their behavior and how renters impacted the overall use of the vehicle.
In addition to the terms used in the description of the vehicle, Carkit data for the baseline period (see Table 12 on page 35), several new terms are used in this section (Table 38).
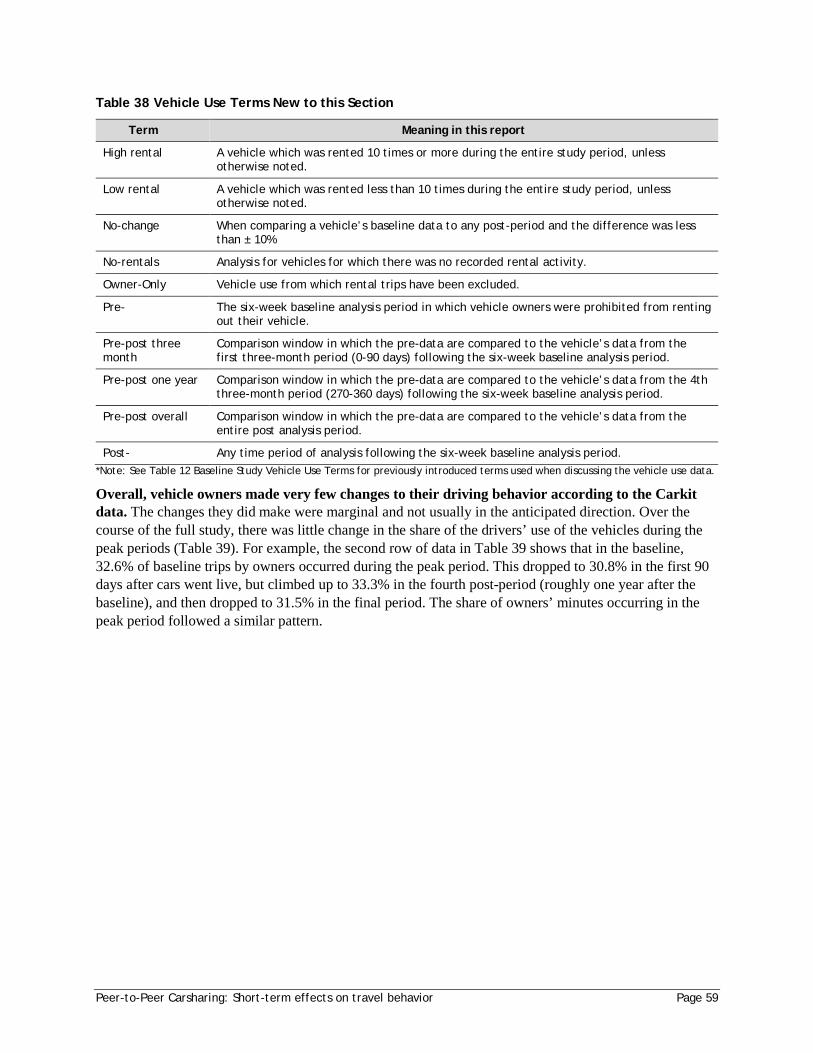
Peer-to-Peer Carsharing: Short-term effects on travel behavior Page 59
Table 38 Vehicle Use Terms New to this Section
Term Meaning in this report
High rental A vehicle which was rented 10 times or more during the entire study period, unless otherwise noted.
Low rental A vehicle which was rented less than 10 times during the entire study period, unless otherwise noted.
No-change When comparing a vehicle’s baseline data to any post-period and the difference was less than ± 10%
No-rentals Analysis for vehicles for which there was no recorded rental activity.
Owner-Only Vehicle use from which rental trips have been excluded.
Pre- The six-week baseline analysis period in which vehicle owners were prohibited from renting out their vehicle.
Pre-post three month
Comparison window in which the pre-data are compared to the vehicle’s data from the first three-month period (0-90 days) following the six-week baseline analysis period.
Pre-post one year Comparison window in which the pre-data are compared to the vehicle’s data from the 4th three-month period (270-360 days) following the six-week baseline analysis period.
Pre-post overall Comparison window in which the pre-data are compared to the vehicle’s data from the entire post analysis period.
Post- Any time period of analysis following the six-week baseline analysis period. *Note: See Table 12 Baseline Study Vehicle Use Terms for previously introduced terms used when discussing the vehicle use data.
Overall, vehicle owners made very few changes to their driving behavior according to the Carkit data. The changes they did make were marginal and not usually in the anticipated direction. Over the course of the full study, there was little change in the share of the drivers’ use of the vehicles during the peak periods (Table 39). For example, the second row of data in Table 39 shows that in the baseline, 32.6% of baseline trips by owners occurred during the peak period. This dropped to 30.8% in the first 90 days after cars went live, but climbed up to 33.3% in the fourth post-period (roughly one year after the baseline), and then dropped to 31.5% in the final period. The share of owners’ minutes occurring in the peak period followed a similar pattern.
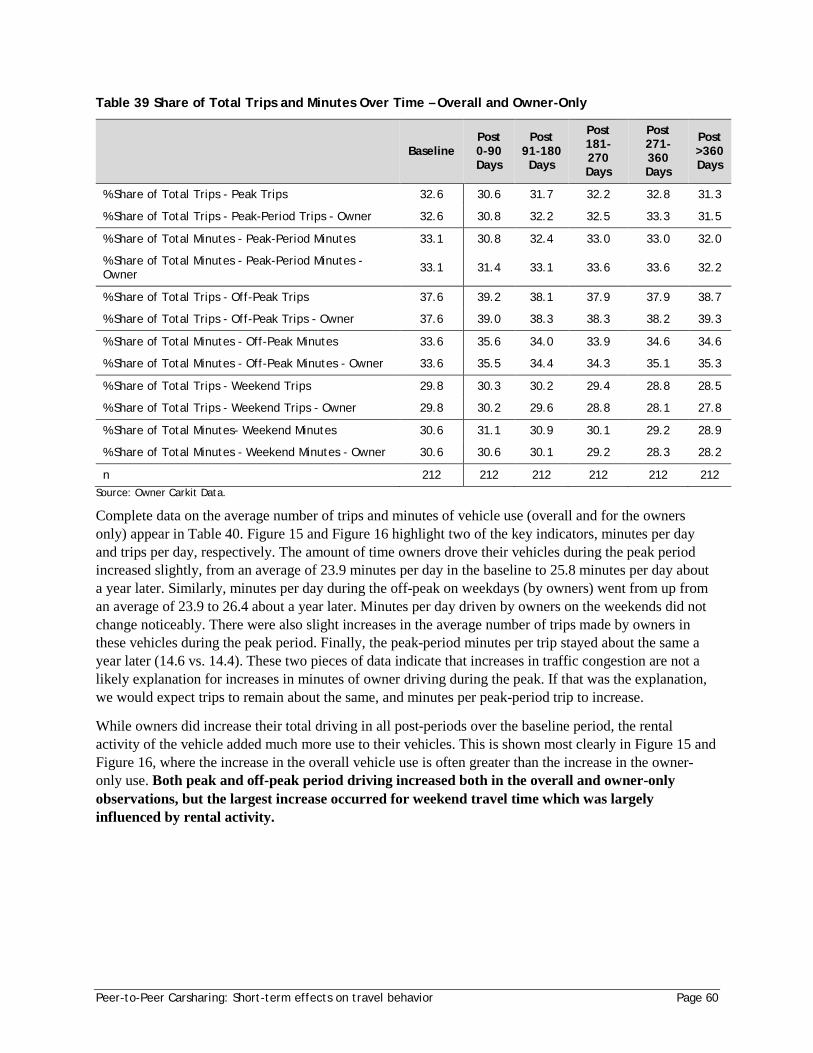
Peer-to-Peer Carsharing: Short-term effects on travel behavior Page 60
Table 39 Share of Total Trips and Minutes Over Time – Overall and Owner-Only
Baseline Post 0-90 Days
Post 91-180 Days
Post 181-270 Days
Post 271-360 Days
Post >360 Days
% Share of Total Trips - Peak Trips 32.6 30.6 31.7 32.2 32.8 31.3
% Share of Total Trips - Peak-Period Trips - Owner 32.6 30.8 32.2 32.5 33.3 31.5
% Share of Total Minutes - Peak-Period Minutes 33.1 30.8 32.4 33.0 33.0 32.0
% Share of Total Minutes - Peak-Period Minutes - Owner 33.1 31.4 33.1 33.6 33.6 32.2
% Share of Total Trips - Off-Peak Trips 37.6 39.2 38.1 37.9 37.9 38.7
% Share of Total Trips - Off-Peak Trips - Owner 37.6 39.0 38.3 38.3 38.2 39.3
% Share of Total Minutes - Off-Peak Minutes 33.6 35.6 34.0 33.9 34.6 34.6
% Share of Total Minutes - Off-Peak Minutes - Owner 33.6 35.5 34.4 34.3 35.1 35.3
% Share of Total Trips - Weekend Trips 29.8 30.3 30.2 29.4 28.8 28.5
% Share of Total Trips - Weekend Trips - Owner 29.8 30.2 29.6 28.8 28.1 27.8
% Share of Total Minutes- Weekend Minutes 30.6 31.1 30.9 30.1 29.2 28.9
% Share of Total Minutes - Weekend Minutes - Owner 30.6 30.6 30.1 29.2 28.3 28.2
n 212 212 212 212 212 212 Source: Owner Carkit Data.
Complete data on the average number of trips and minutes of vehicle use (overall and for the owners only) appear in Table 40. Figure 15 and Figure 16 highlight two of the key indicators, minutes per day and trips per day, respectively. The amount of time owners drove their vehicles during the peak period increased slightly, from an average of 23.9 minutes per day in the baseline to 25.8 minutes per day about a year later. Similarly, minutes per day during the off-peak on weekdays (by owners) went from up from an average of 23.9 to 26.4 about a year later. Minutes per day driven by owners on the weekends did not change noticeably. There were also slight increases in the average number of trips made by owners in these vehicles during the peak period. Finally, the peak-period minutes per trip stayed about the same a year later (14.6 vs. 14.4). These two pieces of data indicate that increases in traffic congestion are not a likely explanation for increases in minutes of owner driving during the peak. If that was the explanation, we would expect trips to remain about the same, and minutes per peak-period trip to increase.
While owners did increase their total driving in all post-periods over the baseline period, the rental activity of the vehicle added much more use to their vehicles. This is shown most clearly in Figure 15 and Figure 16, where the increase in the overall vehicle use is often greater than the increase in the owner-only use. Both peak and off-peak period driving increased both in the overall and owner-only observations, but the largest increase occurred for weekend travel time which was largely influenced by rental activity.
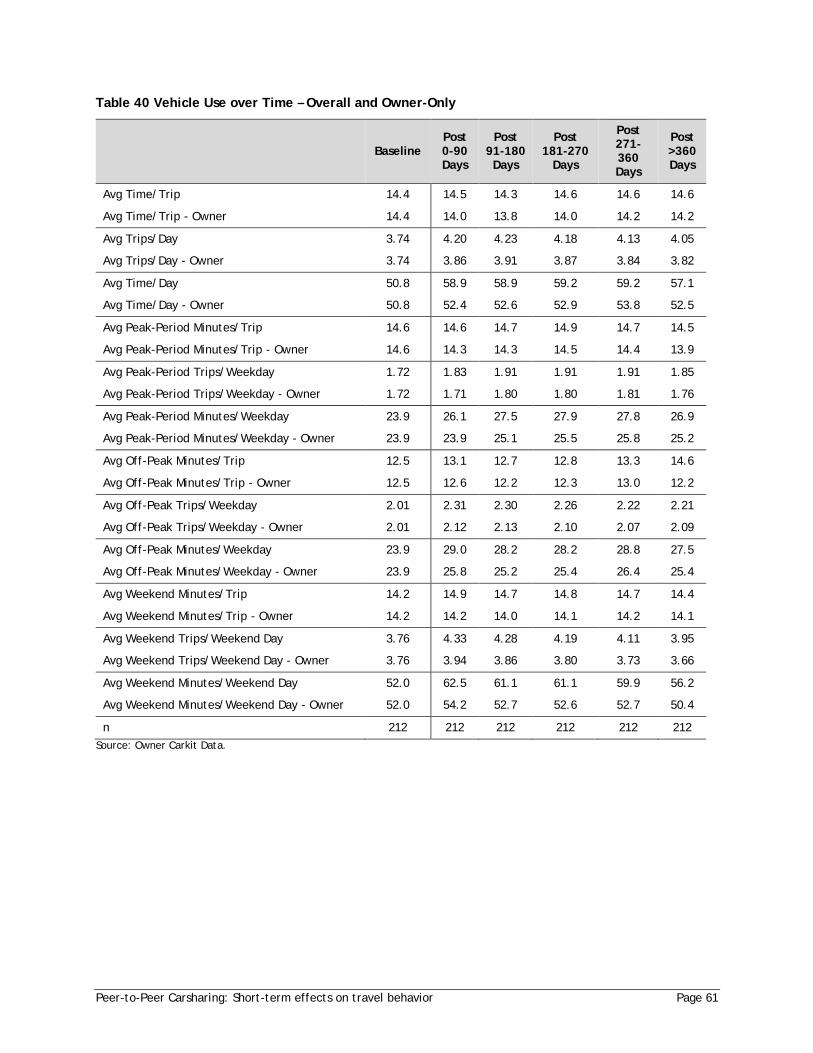
Peer-to-Peer Carsharing: Short-term effects on travel behavior Page 61
Table 40 Vehicle Use over Time – Overall and Owner-Only
Baseline Post 0-90 Days
Post 91-180 Days
Post 181-270
Days
Post 271-360 Days
Post >360 Days
Avg Time/Trip 14.4 14.5 14.3 14.6 14.6 14.6
Avg Time/Trip - Owner 14.4 14.0 13.8 14.0 14.2 14.2
Avg Trips/Day 3.74 4.20 4.23 4.18 4.13 4.05
Avg Trips/Day - Owner 3.74 3.86 3.91 3.87 3.84 3.82
Avg Time/Day 50.8 58.9 58.9 59.2 59.2 57.1
Avg Time/Day - Owner 50.8 52.4 52.6 52.9 53.8 52.5
Avg Peak-Period Minutes/Trip 14.6 14.6 14.7 14.9 14.7 14.5
Avg Peak-Period Minutes/Trip - Owner 14.6 14.3 14.3 14.5 14.4 13.9
Avg Peak-Period Trips/Weekday 1.72 1.83 1.91 1.91 1.91 1.85
Avg Peak-Period Trips/Weekday - Owner 1.72 1.71 1.80 1.80 1.81 1.76
Avg Peak-Period Minutes/Weekday 23.9 26.1 27.5 27.9 27.8 26.9
Avg Peak-Period Minutes/Weekday - Owner 23.9 23.9 25.1 25.5 25.8 25.2
Avg Off-Peak Minutes/Trip 12.5 13.1 12.7 12.8 13.3 14.6
Avg Off-Peak Minutes/Trip - Owner 12.5 12.6 12.2 12.3 13.0 12.2
Avg Off-Peak Trips/Weekday 2.01 2.31 2.30 2.26 2.22 2.21
Avg Off-Peak Trips/Weekday - Owner 2.01 2.12 2.13 2.10 2.07 2.09
Avg Off-Peak Minutes/Weekday 23.9 29.0 28.2 28.2 28.8 27.5
Avg Off-Peak Minutes/Weekday - Owner 23.9 25.8 25.2 25.4 26.4 25.4
Avg Weekend Minutes/Trip 14.2 14.9 14.7 14.8 14.7 14.4
Avg Weekend Minutes/Trip - Owner 14.2 14.2 14.0 14.1 14.2 14.1
Avg Weekend Trips/Weekend Day 3.76 4.33 4.28 4.19 4.11 3.95
Avg Weekend Trips/Weekend Day - Owner 3.76 3.94 3.86 3.80 3.73 3.66
Avg Weekend Minutes/Weekend Day 52.0 62.5 61.1 61.1 59.9 56.2
Avg Weekend Minutes/Weekend Day - Owner 52.0 54.2 52.7 52.6 52.7 50.4
n 212 212 212 212 212 212 Source: Owner Carkit Data.
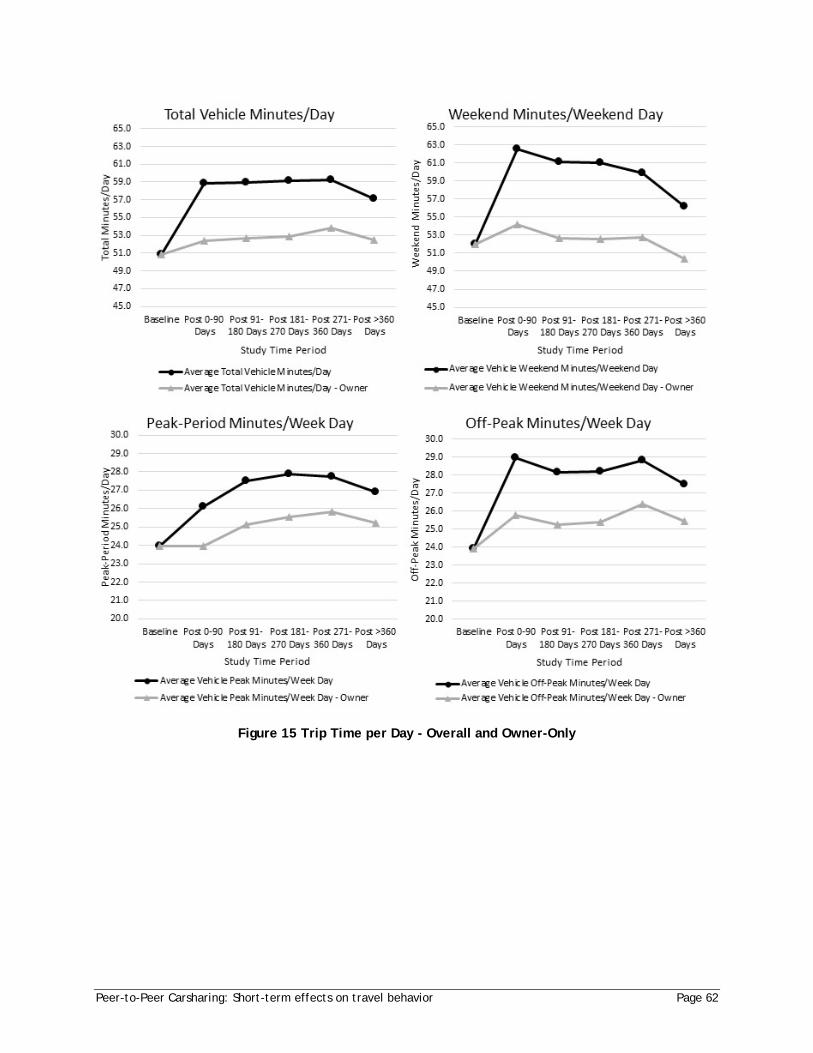
Peer-to-Peer Carsharing: Short-term effects on travel behavior Page 62
Figure 15 Trip Time per Day - Overall and Owner-Only
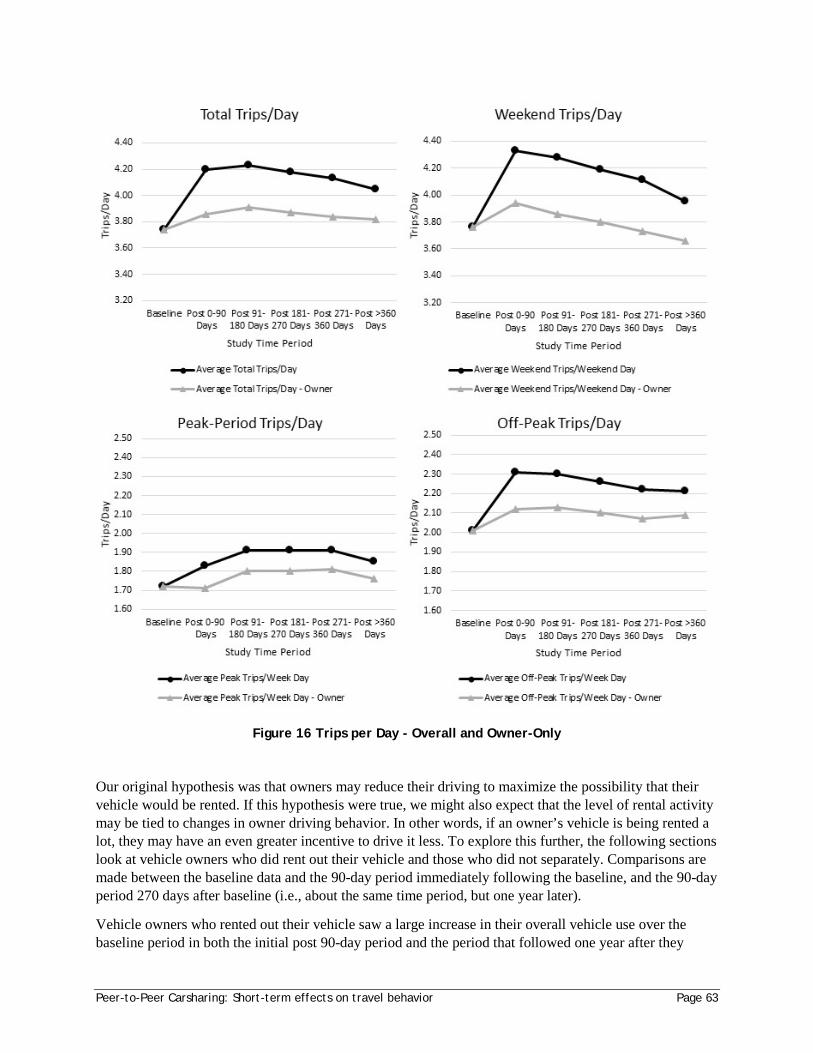
Peer-to-Peer Carsharing: Short-term effects on travel behavior Page 63
Figure 16 Trips per Day - Overall and Owner-Only
Our original hypothesis was that owners may reduce their driving to maximize the possibility that their vehicle would be rented. If this hypothesis were true, we might also expect that the level of rental activity may be tied to changes in owner driving behavior. In other words, if an owner’s vehicle is being rented a lot, they may have an even greater incentive to drive it less. To explore this further, the following sections look at vehicle owners who did rent out their vehicle and those who did not separately. Comparisons are made between the baseline data and the 90-day period immediately following the baseline, and the 90-day period 270 days after baseline (i.e., about the same time period, but one year later).
Vehicle owners who rented out their vehicle saw a large increase in their overall vehicle use over the baseline period in both the initial post 90-day period and the period that followed one year after they
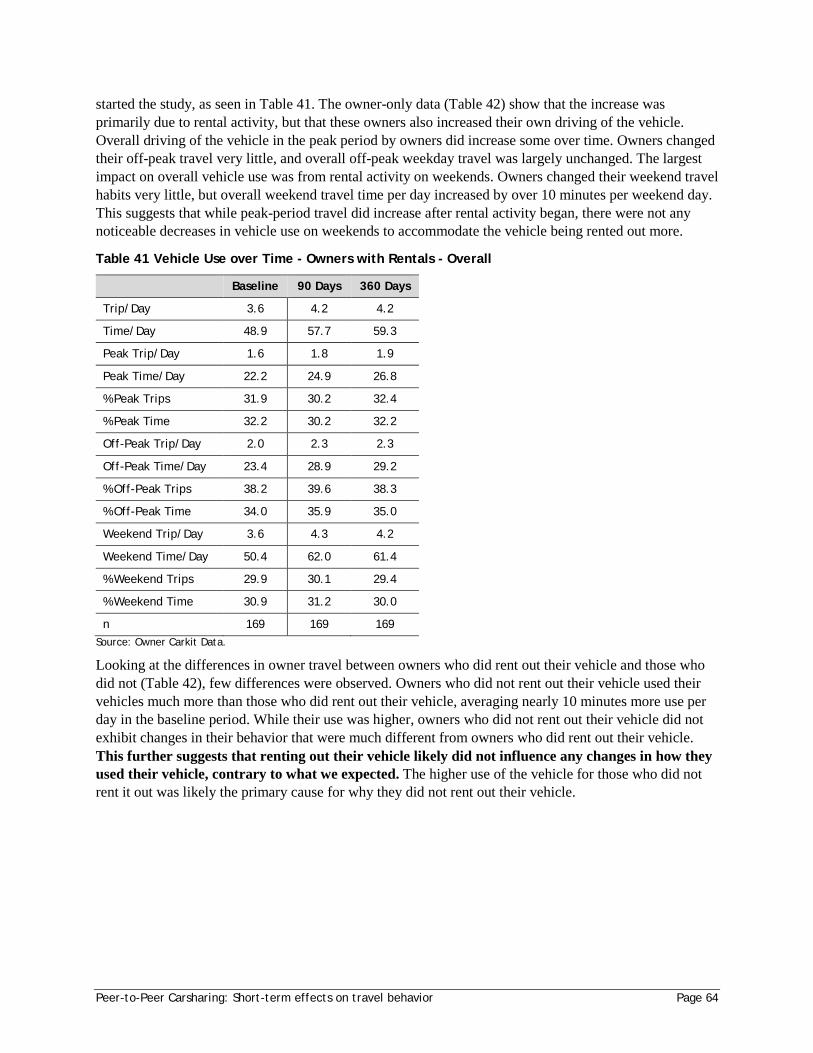
Peer-to-Peer Carsharing: Short-term effects on travel behavior Page 64
started the study, as seen in Table 41. The owner-only data (Table 42) show that the increase was primarily due to rental activity, but that these owners also increased their own driving of the vehicle. Overall driving of the vehicle in the peak period by owners did increase some over time. Owners changed their off-peak travel very little, and overall off-peak weekday travel was largely unchanged. The largest impact on overall vehicle use was from rental activity on weekends. Owners changed their weekend travel habits very little, but overall weekend travel time per day increased by over 10 minutes per weekend day. This suggests that while peak-period travel did increase after rental activity began, there were not any noticeable decreases in vehicle use on weekends to accommodate the vehicle being rented out more.
Table 41 Vehicle Use over Time - Owners with Rentals - Overall
Baseline 90 Days 360 Days
Trip/Day 3.6 4.2 4.2
Time/Day 48.9 57.7 59.3
Peak Trip/Day 1.6 1.8 1.9
Peak Time/Day 22.2 24.9 26.8
% Peak Trips 31.9 30.2 32.4
% Peak Time 32.2 30.2 32.2
Off-Peak Trip/Day 2.0 2.3 2.3
Off-Peak Time/Day 23.4 28.9 29.2
% Off-Peak Trips 38.2 39.6 38.3
% Off-Peak Time 34.0 35.9 35.0
Weekend Trip/Day 3.6 4.3 4.2
Weekend Time/Day 50.4 62.0 61.4
% Weekend Trips 29.9 30.1 29.4
% Weekend Time 30.9 31.2 30.0
n 169 169 169 Source: Owner Carkit Data.
Looking at the differences in owner travel between owners who did rent out their vehicle and those who did not (Table 42), few differences were observed. Owners who did not rent out their vehicle used their vehicles much more than those who did rent out their vehicle, averaging nearly 10 minutes more use per day in the baseline period. While their use was higher, owners who did not rent out their vehicle did not exhibit changes in their behavior that were much different from owners who did rent out their vehicle. This further suggests that renting out their vehicle likely did not influence any changes in how they used their vehicle, contrary to what we expected. The higher use of the vehicle for those who did not rent it out was likely the primary cause for why they did not rent out their vehicle.
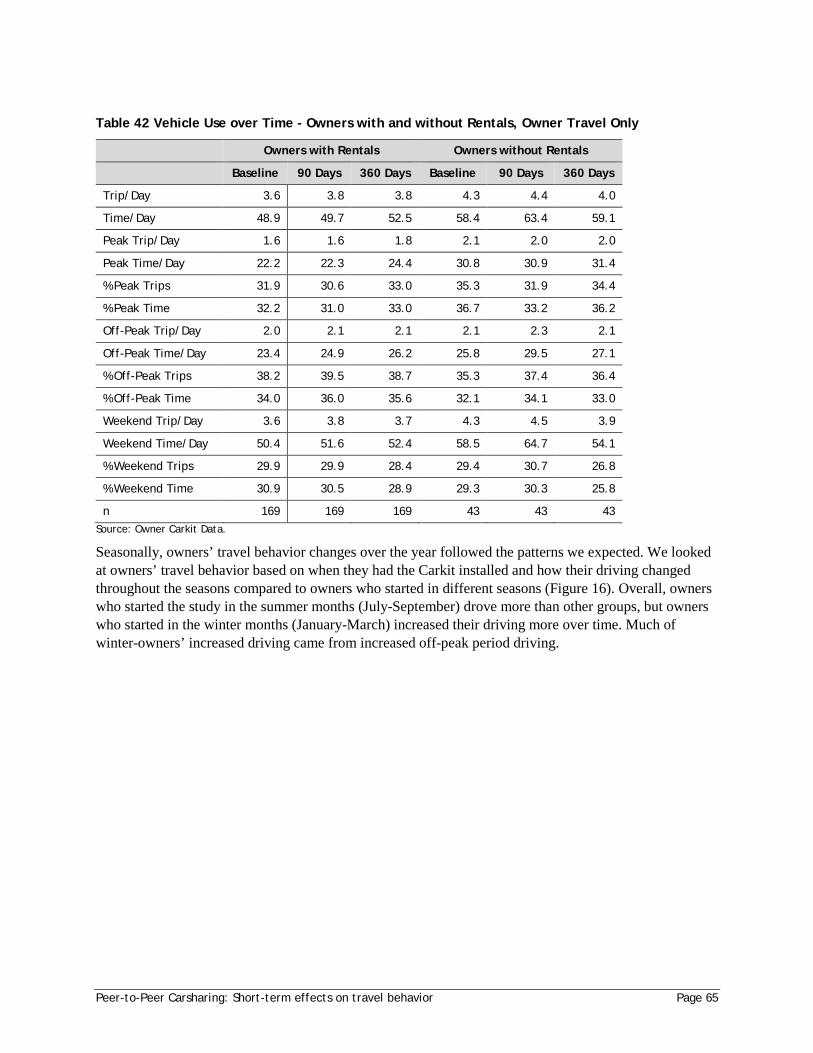
Peer-to-Peer Carsharing: Short-term effects on travel behavior Page 65
Table 42 Vehicle Use over Time - Owners with and without Rentals, Owner Travel Only
Owners with Rentals Owners without Rentals
Baseline 90 Days 360 Days Baseline 90 Days 360 Days
Trip/Day 3.6 3.8 3.8 4.3 4.4 4.0
Time/Day 48.9 49.7 52.5 58.4 63.4 59.1
Peak Trip/Day 1.6 1.6 1.8 2.1 2.0 2.0
Peak Time/Day 22.2 22.3 24.4 30.8 30.9 31.4
% Peak Trips 31.9 30.6 33.0 35.3 31.9 34.4
% Peak Time 32.2 31.0 33.0 36.7 33.2 36.2
Off-Peak Trip/Day 2.0 2.1 2.1 2.1 2.3 2.1
Off-Peak Time/Day 23.4 24.9 26.2 25.8 29.5 27.1
% Off-Peak Trips 38.2 39.5 38.7 35.3 37.4 36.4
% Off-Peak Time 34.0 36.0 35.6 32.1 34.1 33.0
Weekend Trip/Day 3.6 3.8 3.7 4.3 4.5 3.9
Weekend Time/Day 50.4 51.6 52.4 58.5 64.7 54.1
% Weekend Trips 29.9 29.9 28.4 29.4 30.7 26.8
% Weekend Time 30.9 30.5 28.9 29.3 30.3 25.8
n 169 169 169 43 43 43 Source: Owner Carkit Data.
Seasonally, owners’ travel behavior changes over the year followed the patterns we expected. We looked at owners’ travel behavior based on when they had the Carkit installed and how their driving changed throughout the seasons compared to owners who started in different seasons (Figure 16). Overall, owners who started the study in the summer months (July-September) drove more than other groups, but owners who started in the winter months (January-March) increased their driving more over time. Much of winter-owners’ increased driving came from increased off-peak period driving.
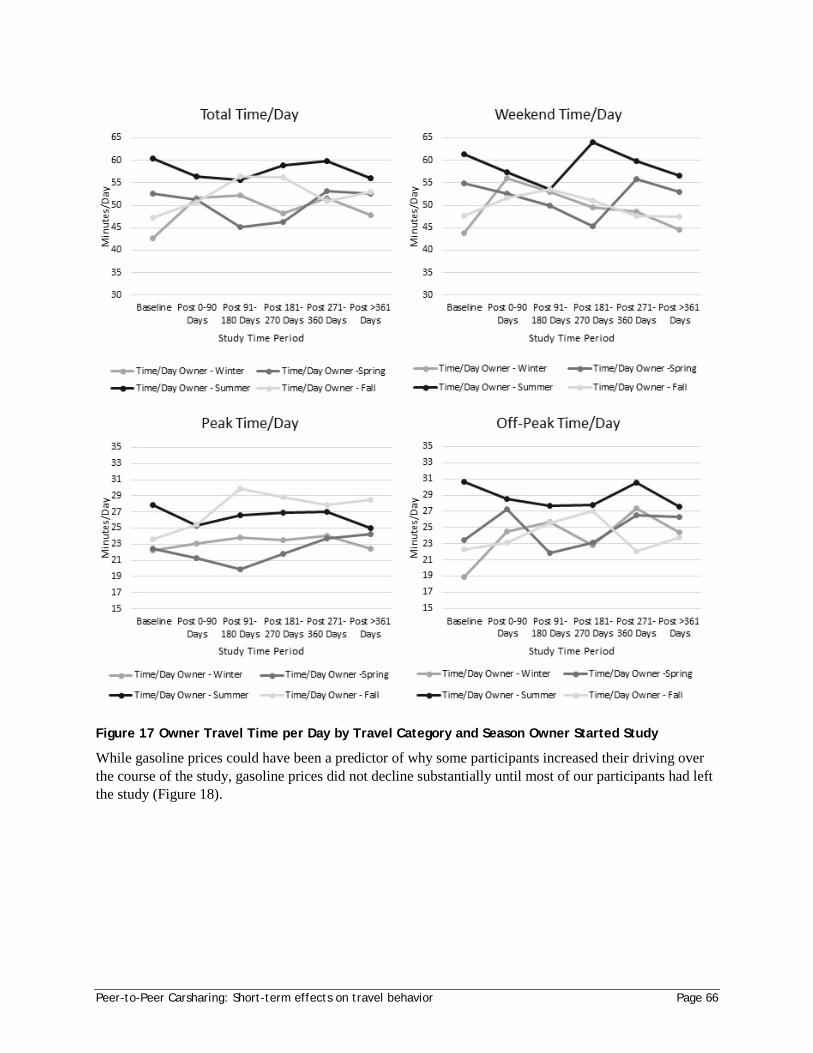
Peer-to-Peer Carsharing: Short-term effects on travel behavior Page 66
Figure 17 Owner Travel Time per Day by Travel Category and Season Owner Started Study
While gasoline prices could have been a predictor of why some participants increased their driving over the course of the study, gasoline prices did not decline substantially until most of our participants had left the study (Figure 18).
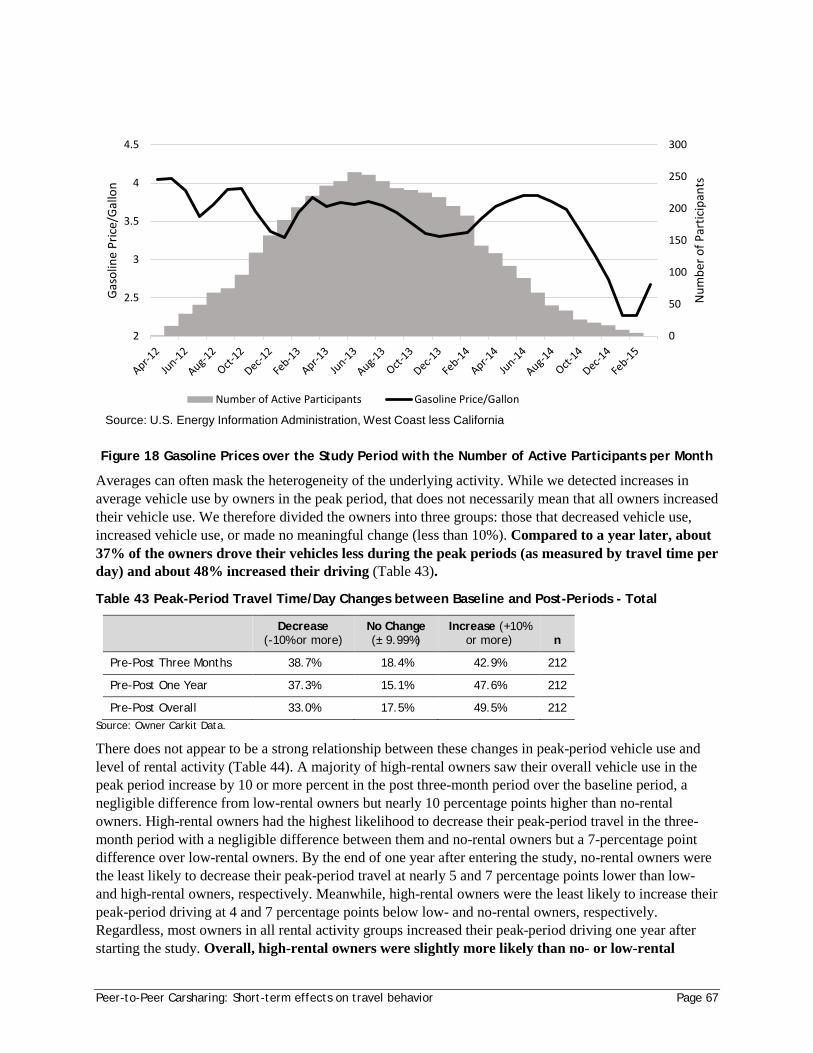
Peer-to-Peer Carsharing: Short-term effects on travel behavior Page 67
Figure 18 Gasoline Prices over the Study Period with the Number of Active Participants per Month
Averages can often mask the heterogeneity of the underlying activity. While we detected increases in average vehicle use by owners in the peak period, that does not necessarily mean that all owners increased their vehicle use. We therefore divided the owners into three groups: those that decreased vehicle use, increased vehicle use, or made no meaningful change (less than 10%). Compared to a year later, about 37% of the owners drove their vehicles less during the peak periods (as measured by travel time per day) and about 48% increased their driving (Table 43).
Table 43 Peak-Period Travel Time/Day Changes between Baseline and Post-Periods - Total
Decrease
(-10% or more) No Change (± 9.99%)
Increase (+10% or more) n
Pre-Post Three Months 38.7% 18.4% 42.9% 212
Pre-Post One Year 37.3% 15.1% 47.6% 212
Pre-Post Overall 33.0% 17.5% 49.5% 212 Source: Owner Carkit Data.
There does not appear to be a strong relationship between these changes in peak-period vehicle use and level of rental activity (Table 44). A majority of high-rental owners saw their overall vehicle use in the peak period increase by 10 or more percent in the post three-month period over the baseline period, a negligible difference from low-rental owners but nearly 10 percentage points higher than no-rental owners. High-rental owners had the highest likelihood to decrease their peak-period travel in the three-month period with a negligible difference between them and no-rental owners but a 7-percentage point difference over low-rental owners. By the end of one year after entering the study, no-rental owners were the least likely to decrease their peak-period travel at nearly 5 and 7 percentage points lower than low- and high-rental owners, respectively. Meanwhile, high-rental owners were the least likely to increase their peak-period driving at 4 and 7 percentage points below low- and no-rental owners, respectively. Regardless, most owners in all rental activity groups increased their peak-period driving one year after starting the study. Overall, high-rental owners were slightly more likely than no- or low-rental
0
50
100
150
200
250
300
2
2.5
3
3.5
4
4.5
Num
ber o
f Par
ticip
ants
Gaso
line
Pric
e/Ga
llon
Number of Active Participants Gasoline Price/Gallon
Source: U.S. Energy Information Administration, West Coast less California
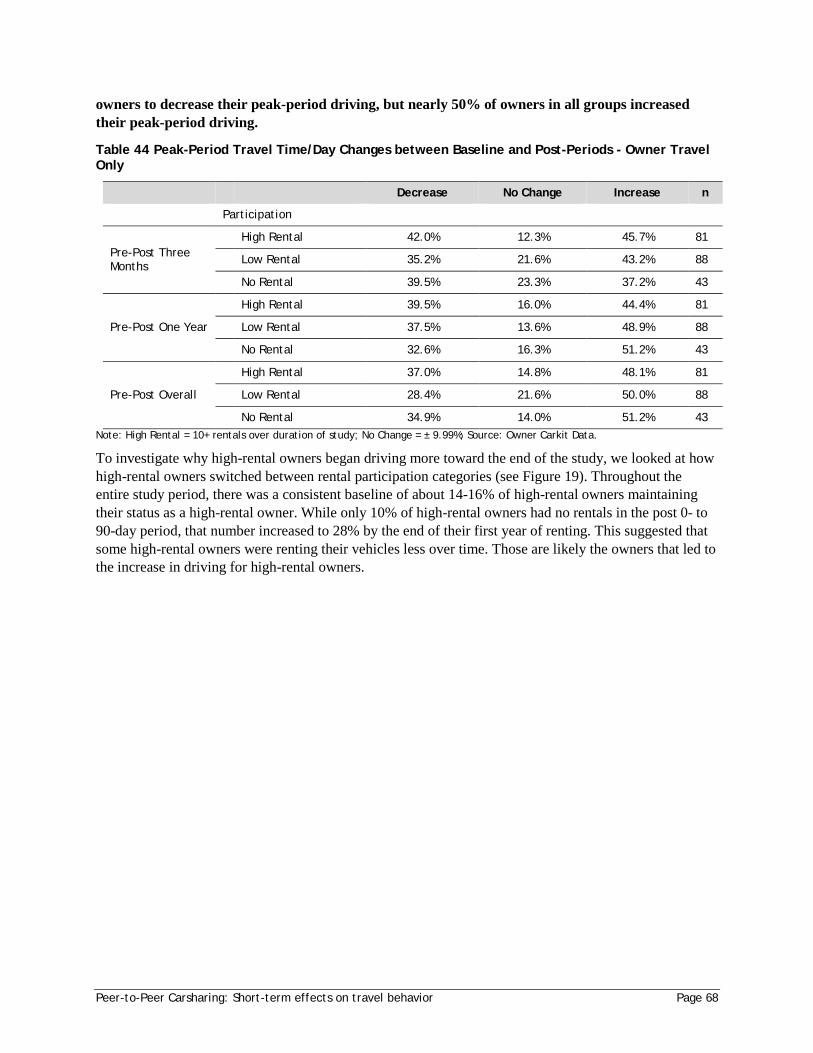
Peer-to-Peer Carsharing: Short-term effects on travel behavior Page 68
owners to decrease their peak-period driving, but nearly 50% of owners in all groups increased their peak-period driving.
Table 44 Peak-Period Travel Time/Day Changes between Baseline and Post-Periods - Owner Travel Only
Decrease No Change Increase n
Participation
Pre-Post Three Months
High Rental 42.0% 12.3% 45.7% 81
Low Rental 35.2% 21.6% 43.2% 88
No Rental 39.5% 23.3% 37.2% 43
Pre-Post One Year
High Rental 39.5% 16.0% 44.4% 81
Low Rental 37.5% 13.6% 48.9% 88
No Rental 32.6% 16.3% 51.2% 43
Pre-Post Overall
High Rental 37.0% 14.8% 48.1% 81
Low Rental 28.4% 21.6% 50.0% 88
No Rental 34.9% 14.0% 51.2% 43 Note: High Rental = 10+ rentals over duration of study; No Change = ± 9.99%; Source: Owner Carkit Data.
To investigate why high-rental owners began driving more toward the end of the study, we looked at how high-rental owners switched between rental participation categories (see Figure 19). Throughout the entire study period, there was a consistent baseline of about 14-16% of high-rental owners maintaining their status as a high-rental owner. While only 10% of high-rental owners had no rentals in the post 0- to 90-day period, that number increased to 28% by the end of their first year of renting. This suggested that some high-rental owners were renting their vehicles less over time. Those are likely the owners that led to the increase in driving for high-rental owners.
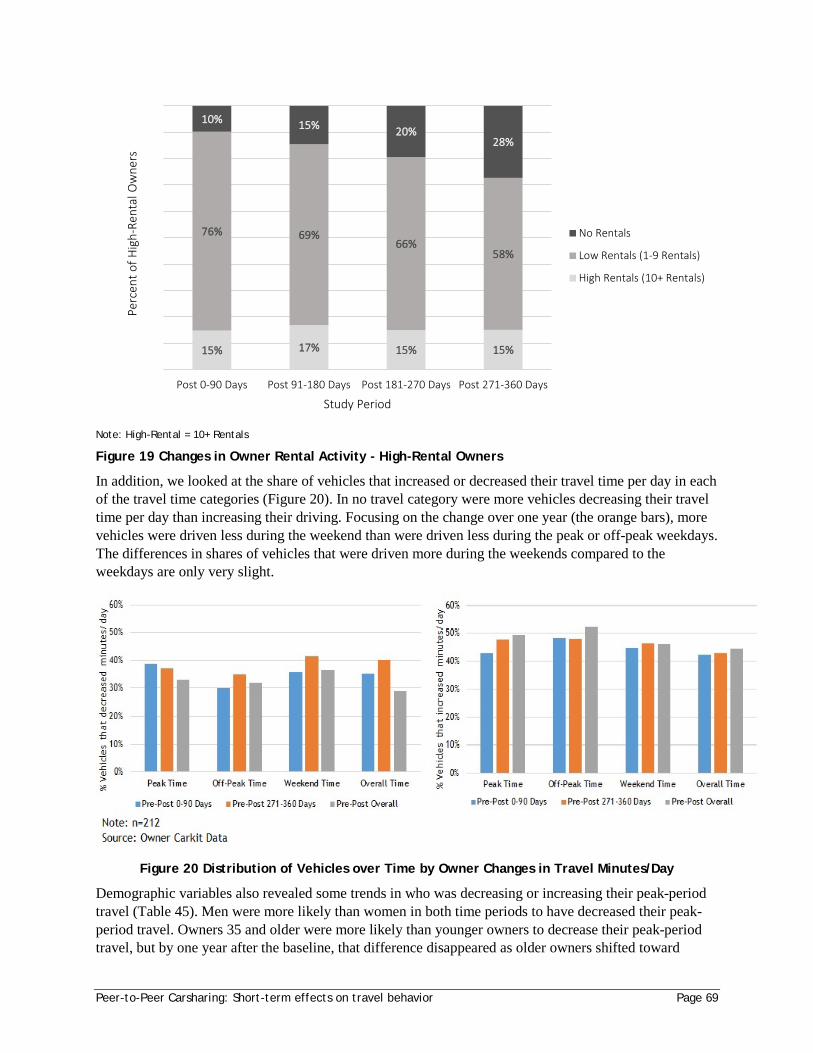
Peer-to-Peer Carsharing: Short-term effects on travel behavior Page 69
Note: High-Rental = 10+ Rentals
Figure 19 Changes in Owner Rental Activity - High-Rental Owners
In addition, we looked at the share of vehicles that increased or decreased their travel time per day in each of the travel time categories (Figure 20). In no travel category were more vehicles decreasing their travel time per day than increasing their driving. Focusing on the change over one year (the orange bars), more vehicles were driven less during the weekend than were driven less during the peak or off-peak weekdays. The differences in shares of vehicles that were driven more during the weekends compared to the weekdays are only very slight.
Figure 20 Distribution of Vehicles over Time by Owner Changes in Travel Minutes/Day
Demographic variables also revealed some trends in who was decreasing or increasing their peak-period travel (Table 45). Men were more likely than women in both time periods to have decreased their peak-period travel. Owners 35 and older were more likely than younger owners to decrease their peak-period travel, but by one year after the baseline, that difference disappeared as older owners shifted toward
15% 17% 15% 15%
76% 69%66%
58%
10% 15% 20%28%
Post 0-90 Days Post 91-180 Days Post 181-270 Days Post 271-360 Days
Perc
ent o
f Hig
h-Re
ntal
Ow
ners
Study Period
No Rentals
Low Rentals (1-9 Rentals)
High Rentals (10+ Rentals)
Peer-to-Peer Carsharing: Short-term effects on travel behavior Page 70
increasing their peak-period travel. In the initial 90 days of being able to rent, owners with household incomes less than $35,000 were the least likely to increase their peak-period travel by a large margin, but that difference narrowed considerably by the one-year mark. Middle-income owners were the most likely to increase their travel in both time periods. The income descriptor variable showed similar trends but more markedly, showing a trend that as available income increased owners were less likely to decrease their peak-period travel. Households with at least one child were more likely to increase their peak-period travel over time. Those living closest to downtown (distance to Pioneer Courthouse Square) were the most likely to decrease their peak-period travel at the 90-day interval. At the one-year mark, though, those closest to downtown had shown an increase of nearly 12 percentage points in those who increased their peak-period driving.
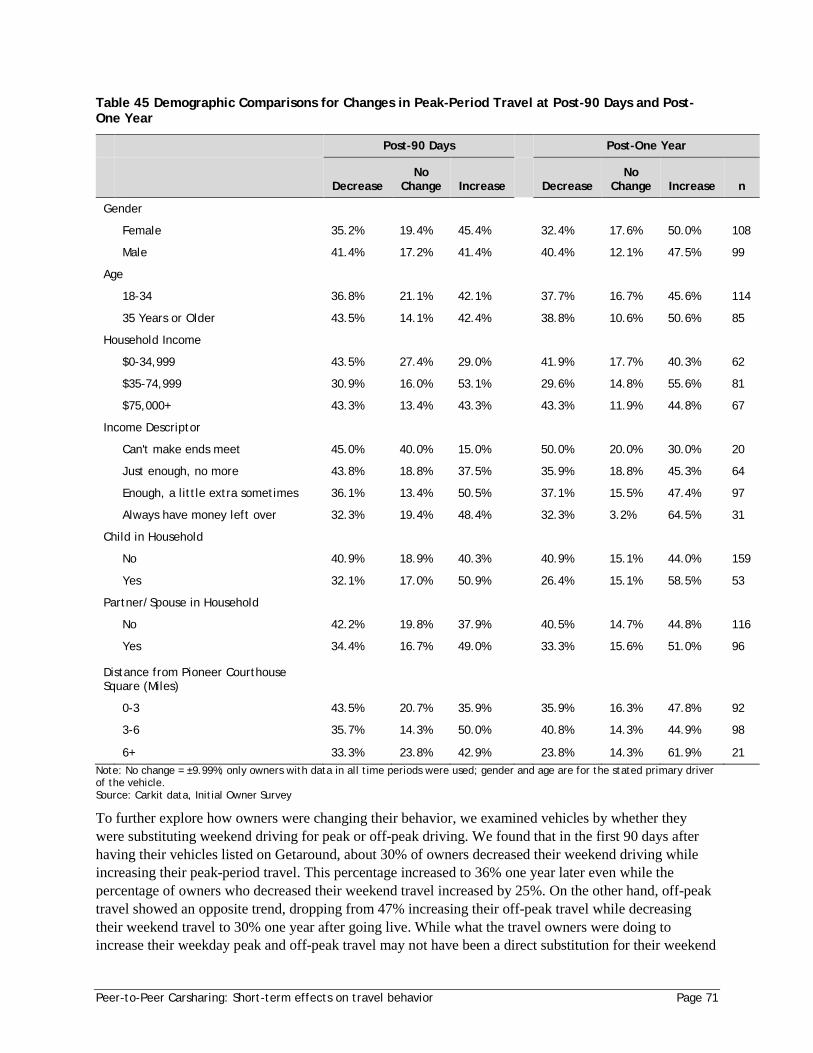
Peer-to-Peer Carsharing: Short-term effects on travel behavior Page 71
Table 45 Demographic Comparisons for Changes in Peak-Period Travel at Post-90 Days and Post- One Year
Post-90 Days Post-One Year
Decrease No
Change Increase Decrease No
Change Increase n
Gender
Female 35.2% 19.4% 45.4%
32.4% 17.6% 50.0% 108
Male 41.4% 17.2% 41.4%
40.4% 12.1% 47.5% 99
Age
18-34 36.8% 21.1% 42.1%
37.7% 16.7% 45.6% 114
35 Years or Older 43.5% 14.1% 42.4%
38.8% 10.6% 50.6% 85
Household Income
$0-34,999 43.5% 27.4% 29.0%
41.9% 17.7% 40.3% 62
$35-74,999 30.9% 16.0% 53.1%
29.6% 14.8% 55.6% 81
$75,000+ 43.3% 13.4% 43.3%
43.3% 11.9% 44.8% 67
Income Descriptor
Can't make ends meet 45.0% 40.0% 15.0%
50.0% 20.0% 30.0% 20
Just enough, no more 43.8% 18.8% 37.5%
35.9% 18.8% 45.3% 64
Enough, a little extra sometimes 36.1% 13.4% 50.5%
37.1% 15.5% 47.4% 97
Always have money left over 32.3% 19.4% 48.4%
32.3% 3.2% 64.5% 31
Child in Household
No 40.9% 18.9% 40.3%
40.9% 15.1% 44.0% 159
Yes 32.1% 17.0% 50.9%
26.4% 15.1% 58.5% 53
Partner/Spouse in Household
No 42.2% 19.8% 37.9%
40.5% 14.7% 44.8% 116
Yes 34.4% 16.7% 49.0%
33.3% 15.6% 51.0% 96
Distance from Pioneer Courthouse Square (Miles)
0-3 43.5% 20.7% 35.9%
35.9% 16.3% 47.8% 92
3-6 35.7% 14.3% 50.0%
40.8% 14.3% 44.9% 98
6+ 33.3% 23.8% 42.9% 23.8% 14.3% 61.9% 21 Note: No change = ±9.99%; only owners with data in all time periods were used; gender and age are for the stated primary driver of the vehicle. Source: Carkit data, Initial Owner Survey
To further explore how owners were changing their behavior, we examined vehicles by whether they were substituting weekend driving for peak or off-peak driving. We found that in the first 90 days after having their vehicles listed on Getaround, about 30% of owners decreased their weekend driving while increasing their peak-period travel. This percentage increased to 36% one year later even while the percentage of owners who decreased their weekend travel increased by 25%. On the other hand, off-peak travel showed an opposite trend, dropping from 47% increasing their off-peak travel while decreasing their weekend travel to 30% one year after going live. While what the travel owners were doing to increase their weekday peak and off-peak travel may not have been a direct substitution for their weekend
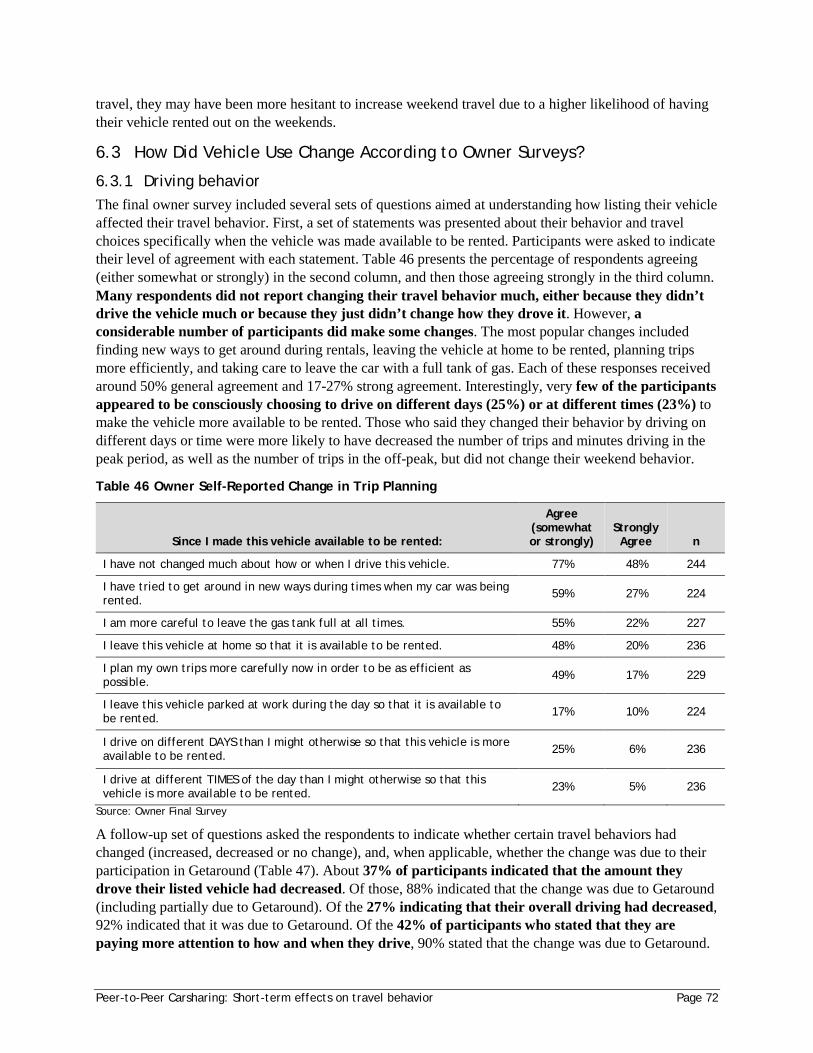
Peer-to-Peer Carsharing: Short-term effects on travel behavior Page 72
travel, they may have been more hesitant to increase weekend travel due to a higher likelihood of having their vehicle rented out on the weekends.
6.3 How Did Vehicle Use Change According to Owner Surveys?
6.3.1 Driving behavior The final owner survey included several sets of questions aimed at understanding how listing their vehicle affected their travel behavior. First, a set of statements was presented about their behavior and travel choices specifically when the vehicle was made available to be rented. Participants were asked to indicate their level of agreement with each statement. Table 46 presents the percentage of respondents agreeing (either somewhat or strongly) in the second column, and then those agreeing strongly in the third column. Many respondents did not report changing their travel behavior much, either because they didn’t drive the vehicle much or because they just didn’t change how they drove it. However, a considerable number of participants did make some changes. The most popular changes included finding new ways to get around during rentals, leaving the vehicle at home to be rented, planning trips more efficiently, and taking care to leave the car with a full tank of gas. Each of these responses received around 50% general agreement and 17-27% strong agreement. Interestingly, very few of the participants appeared to be consciously choosing to drive on different days (25%) or at different times (23%) to make the vehicle more available to be rented. Those who said they changed their behavior by driving on different days or time were more likely to have decreased the number of trips and minutes driving in the peak period, as well as the number of trips in the off-peak, but did not change their weekend behavior.
Table 46 Owner Self-Reported Change in Trip Planning
Since I made this vehicle available to be rented:
Agree (somewhat or strongly)
Strongly Agree n
I have not changed much about how or when I drive this vehicle. 77% 48% 244
I have tried to get around in new ways during times when my car was being rented. 59% 27% 224
I am more careful to leave the gas tank full at all times. 55% 22% 227
I leave this vehicle at home so that it is available to be rented. 48% 20% 236
I plan my own trips more carefully now in order to be as efficient as possible. 49% 17% 229
I leave this vehicle parked at work during the day so that it is available to be rented. 17% 10% 224
I drive on different DAYS than I might otherwise so that this vehicle is more available to be rented. 25% 6% 236
I drive at different TIMES of the day than I might otherwise so that this vehicle is more available to be rented. 23% 5% 236
Source: Owner Final Survey
A follow-up set of questions asked the respondents to indicate whether certain travel behaviors had changed (increased, decreased or no change), and, when applicable, whether the change was due to their participation in Getaround (Table 47). About 37% of participants indicated that the amount they drove their listed vehicle had decreased. Of those, 88% indicated that the change was due to Getaround (including partially due to Getaround). Of the 27% indicating that their overall driving had decreased, 92% indicated that it was due to Getaround. Of the 42% of participants who stated that they are paying more attention to how and when they drive, 90% stated that the change was due to Getaround.
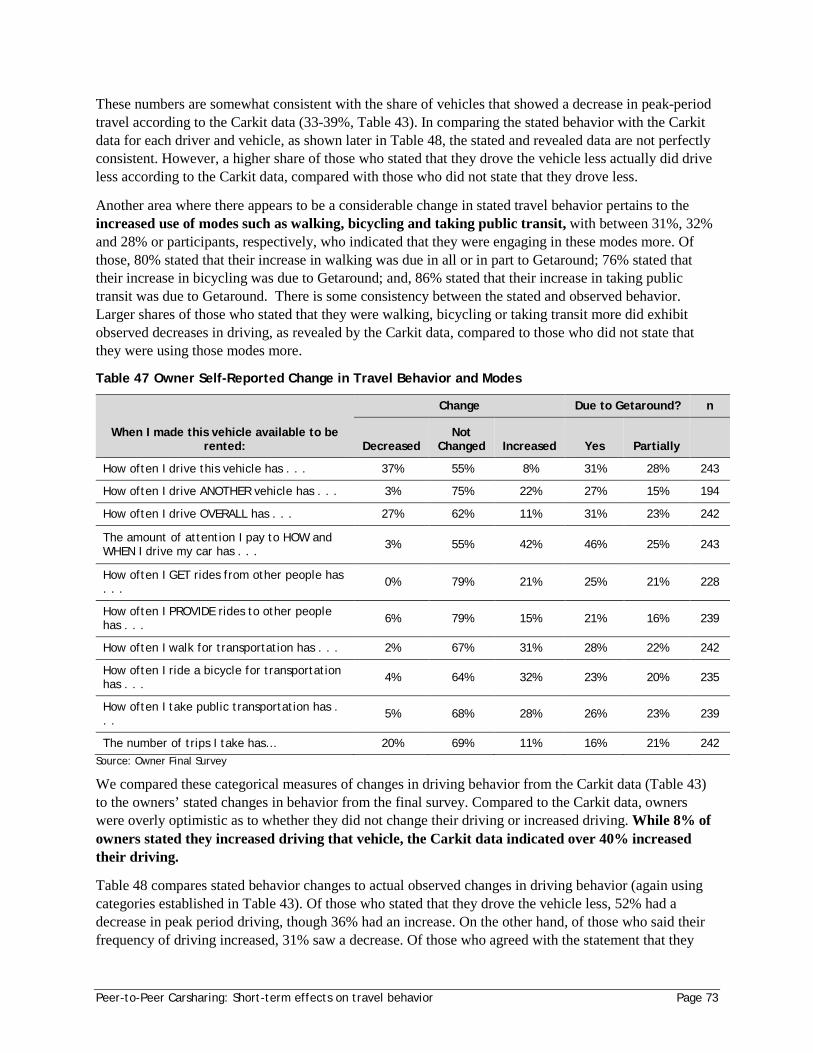
Peer-to-Peer Carsharing: Short-term effects on travel behavior Page 73
These numbers are somewhat consistent with the share of vehicles that showed a decrease in peak-period travel according to the Carkit data (33-39%, Table 43). In comparing the stated behavior with the Carkit data for each driver and vehicle, as shown later in Table 48, the stated and revealed data are not perfectly consistent. However, a higher share of those who stated that they drove the vehicle less actually did drive less according to the Carkit data, compared with those who did not state that they drove less.
Another area where there appears to be a considerable change in stated travel behavior pertains to the increased use of modes such as walking, bicycling and taking public transit, with between 31%, 32% and 28% or participants, respectively, who indicated that they were engaging in these modes more. Of those, 80% stated that their increase in walking was due in all or in part to Getaround; 76% stated that their increase in bicycling was due to Getaround; and, 86% stated that their increase in taking public transit was due to Getaround. There is some consistency between the stated and observed behavior. Larger shares of those who stated that they were walking, bicycling or taking transit more did exhibit observed decreases in driving, as revealed by the Carkit data, compared to those who did not state that they were using those modes more.
Table 47 Owner Self-Reported Change in Travel Behavior and Modes
When I made this vehicle available to be rented:
Change Due to Getaround? n
Decreased Not
Changed Increased Yes Partially
How often I drive this vehicle has . . . 37% 55% 8% 31% 28% 243
How often I drive ANOTHER vehicle has . . . 3% 75% 22% 27% 15% 194
How often I drive OVERALL has . . . 27% 62% 11% 31% 23% 242
The amount of attention I pay to HOW and WHEN I drive my car has . . . 3% 55% 42% 46% 25% 243
How often I GET rides from other people has . . . 0% 79% 21% 25% 21% 228
How often I PROVIDE rides to other people has . . . 6% 79% 15% 21% 16% 239
How often I walk for transportation has . . . 2% 67% 31% 28% 22% 242
How often I ride a bicycle for transportation has . . . 4% 64% 32% 23% 20% 235
How often I take public transportation has . . . 5% 68% 28% 26% 23% 239
The number of trips I take has… 20% 69% 11% 16% 21% 242 Source: Owner Final Survey
We compared these categorical measures of changes in driving behavior from the Carkit data (Table 43) to the owners’ stated changes in behavior from the final survey. Compared to the Carkit data, owners were overly optimistic as to whether they did not change their driving or increased driving. While 8% of owners stated they increased driving that vehicle, the Carkit data indicated over 40% increased their driving.
Table 48 compares stated behavior changes to actual observed changes in driving behavior (again using categories established in Table 43). Of those who stated that they drove the vehicle less, 52% had a decrease in peak period driving, though 36% had an increase. On the other hand, of those who said their frequency of driving increased, 31% saw a decrease. Of those who agreed with the statement that they
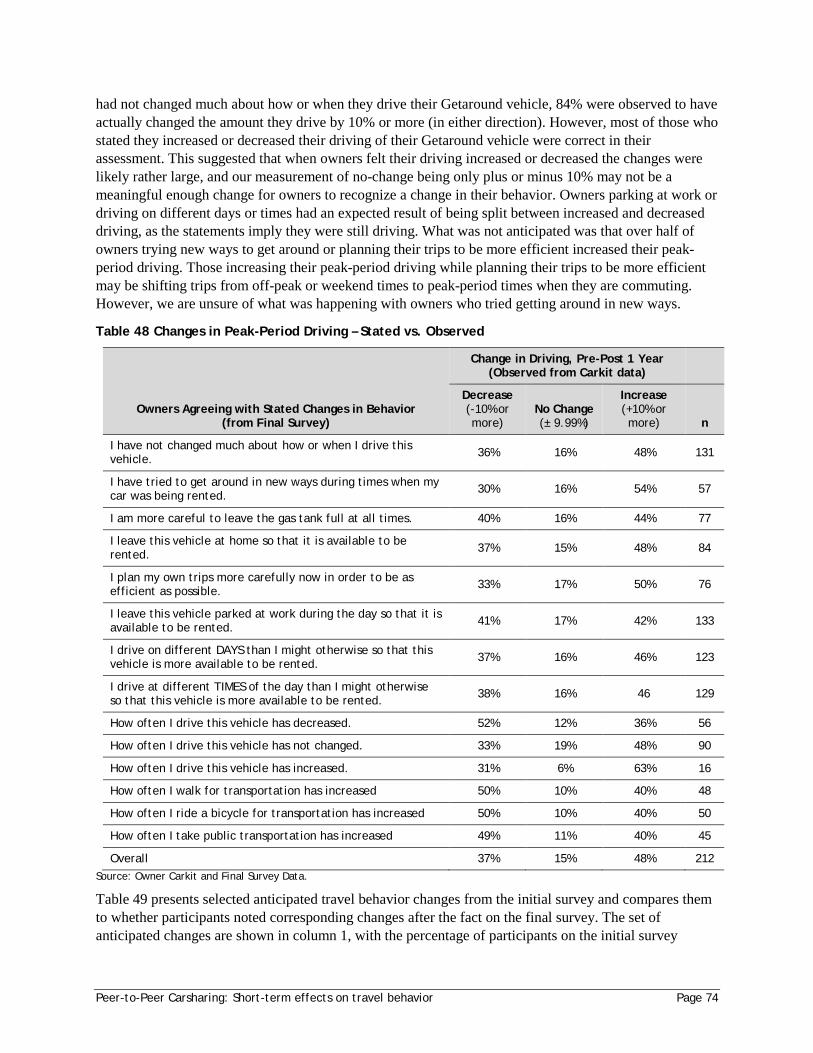
Peer-to-Peer Carsharing: Short-term effects on travel behavior Page 74
had not changed much about how or when they drive their Getaround vehicle, 84% were observed to have actually changed the amount they drive by 10% or more (in either direction). However, most of those who stated they increased or decreased their driving of their Getaround vehicle were correct in their assessment. This suggested that when owners felt their driving increased or decreased the changes were likely rather large, and our measurement of no-change being only plus or minus 10% may not be a meaningful enough change for owners to recognize a change in their behavior. Owners parking at work or driving on different days or times had an expected result of being split between increased and decreased driving, as the statements imply they were still driving. What was not anticipated was that over half of owners trying new ways to get around or planning their trips to be more efficient increased their peak-period driving. Those increasing their peak-period driving while planning their trips to be more efficient may be shifting trips from off-peak or weekend times to peak-period times when they are commuting. However, we are unsure of what was happening with owners who tried getting around in new ways.
Table 48 Changes in Peak-Period Driving – Stated vs. Observed
Owners Agreeing with Stated Changes in Behavior (from Final Survey)
Change in Driving, Pre-Post 1 Year (Observed from Carkit data)
Decrease (-10% or more)
No Change (± 9.99%)
Increase (+10% or more) n
I have not changed much about how or when I drive this vehicle. 36% 16% 48% 131
I have tried to get around in new ways during times when my car was being rented. 30% 16% 54% 57
I am more careful to leave the gas tank full at all times. 40% 16% 44% 77
I leave this vehicle at home so that it is available to be rented. 37% 15% 48% 84
I plan my own trips more carefully now in order to be as efficient as possible. 33% 17% 50% 76
I leave this vehicle parked at work during the day so that it is available to be rented. 41% 17% 42% 133
I drive on different DAYS than I might otherwise so that this vehicle is more available to be rented. 37% 16% 46% 123
I drive at different TIMES of the day than I might otherwise so that this vehicle is more available to be rented. 38% 16% 46 129
How often I drive this vehicle has decreased. 52% 12% 36% 56
How often I drive this vehicle has not changed. 33% 19% 48% 90
How often I drive this vehicle has increased. 31% 6% 63% 16
How often I walk for transportation has increased 50% 10% 40% 48
How often I ride a bicycle for transportation has increased 50% 10% 40% 50
How often I take public transportation has increased 49% 11% 40% 45
Overall 37% 15% 48% 212 Source: Owner Carkit and Final Survey Data.
Table 49 presents selected anticipated travel behavior changes from the initial survey and compares them to whether participants noted corresponding changes after the fact on the final survey. The set of anticipated changes are shown in column 1, with the percentage of participants on the initial survey
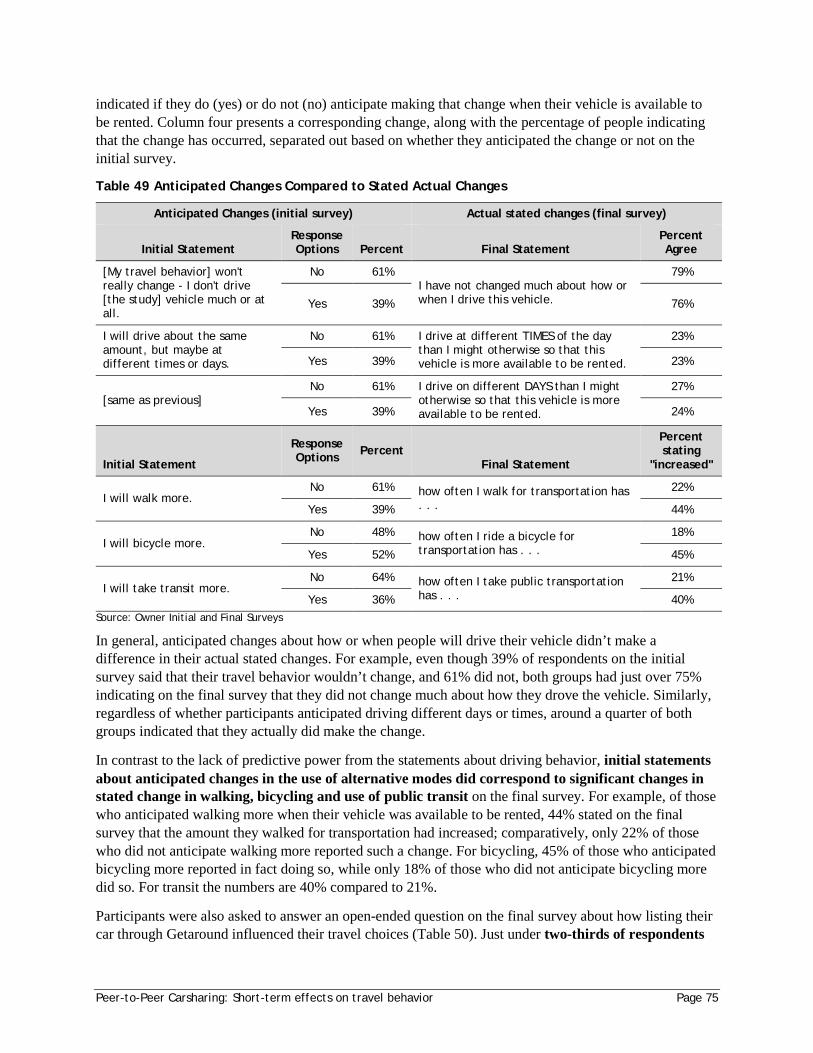
Peer-to-Peer Carsharing: Short-term effects on travel behavior Page 75
indicated if they do (yes) or do not (no) anticipate making that change when their vehicle is available to be rented. Column four presents a corresponding change, along with the percentage of people indicating that the change has occurred, separated out based on whether they anticipated the change or not on the initial survey.
Table 49 Anticipated Changes Compared to Stated Actual Changes
Anticipated Changes (initial survey) Actual stated changes (final survey)
Initial Statement Response Options Percent Final Statement
Percent Agree
[My travel behavior] won't really change - I don't drive [the study] vehicle much or at all.
No 61% I have not changed much about how or when I drive this vehicle.
79%
Yes 39% 76%
I will drive about the same amount, but maybe at different times or days.
No 61% I drive at different TIMES of the day than I might otherwise so that this vehicle is more available to be rented.
23%
Yes 39% 23%
[same as previous] No 61% I drive on different DAYS than I might
otherwise so that this vehicle is more available to be rented.
27%
Yes 39% 24%
Initial Statement
Response Options Percent
Final Statement
Percent stating
"increased"
I will walk more. No 61% how often I walk for transportation has
. . .
22%
Yes 39% 44%
I will bicycle more. No 48% how often I ride a bicycle for
transportation has . . .
18%
Yes 52% 45%
I will take transit more. No 64% how often I take public transportation
has . . .
21%
Yes 36% 40% Source: Owner Initial and Final Surveys
In general, anticipated changes about how or when people will drive their vehicle didn’t make a difference in their actual stated changes. For example, even though 39% of respondents on the initial survey said that their travel behavior wouldn’t change, and 61% did not, both groups had just over 75% indicating on the final survey that they did not change much about how they drove the vehicle. Similarly, regardless of whether participants anticipated driving different days or times, around a quarter of both groups indicated that they actually did make the change.
In contrast to the lack of predictive power from the statements about driving behavior, initial statements about anticipated changes in the use of alternative modes did correspond to significant changes in stated change in walking, bicycling and use of public transit on the final survey. For example, of those who anticipated walking more when their vehicle was available to be rented, 44% stated on the final survey that the amount they walked for transportation had increased; comparatively, only 22% of those who did not anticipate walking more reported such a change. For bicycling, 45% of those who anticipated bicycling more reported in fact doing so, while only 18% of those who did not anticipate bicycling more did so. For transit the numbers are 40% compared to 21%.
Participants were also asked to answer an open-ended question on the final survey about how listing their car through Getaround influenced their travel choices (Table 50). Just under two-thirds of respondents
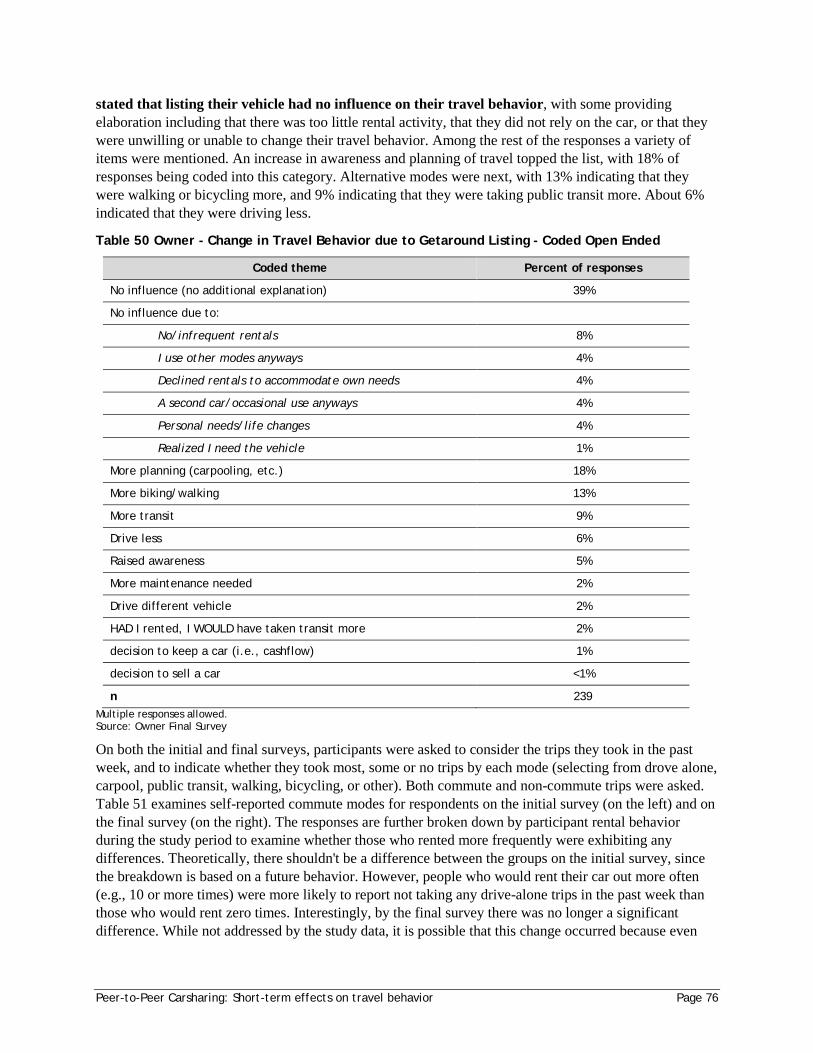
Peer-to-Peer Carsharing: Short-term effects on travel behavior Page 76
stated that listing their vehicle had no influence on their travel behavior, with some providing elaboration including that there was too little rental activity, that they did not rely on the car, or that they were unwilling or unable to change their travel behavior. Among the rest of the responses a variety of items were mentioned. An increase in awareness and planning of travel topped the list, with 18% of responses being coded into this category. Alternative modes were next, with 13% indicating that they were walking or bicycling more, and 9% indicating that they were taking public transit more. About 6% indicated that they were driving less.
Table 50 Owner - Change in Travel Behavior due to Getaround Listing - Coded Open Ended
Coded theme Percent of responses
No influence (no additional explanation) 39%
No influence due to:
No/infrequent rentals 8%
I use other modes anyways 4%
Declined rentals to accommodate own needs 4%
A second car/occasional use anyways 4%
Personal needs/life changes 4%
Realized I need the vehicle 1%
More planning (carpooling, etc.) 18%
More biking/walking 13%
More transit 9%
Drive less 6%
Raised awareness 5%
More maintenance needed 2%
Drive different vehicle 2%
HAD I rented, I WOULD have taken transit more 2%
decision to keep a car (i.e., cashflow) 1%
decision to sell a car <1%
n 239 Multiple responses allowed. Source: Owner Final Survey
On both the initial and final surveys, participants were asked to consider the trips they took in the past week, and to indicate whether they took most, some or no trips by each mode (selecting from drove alone, carpool, public transit, walking, bicycling, or other). Both commute and non-commute trips were asked. Table 51 examines self-reported commute modes for respondents on the initial survey (on the left) and on the final survey (on the right). The responses are further broken down by participant rental behavior during the study period to examine whether those who rented more frequently were exhibiting any differences. Theoretically, there shouldn't be a difference between the groups on the initial survey, since the breakdown is based on a future behavior. However, people who would rent their car out more often (e.g., 10 or more times) were more likely to report not taking any drive-alone trips in the past week than those who would rent zero times. Interestingly, by the final survey there was no longer a significant difference. While not addressed by the study data, it is possible that this change occurred because even
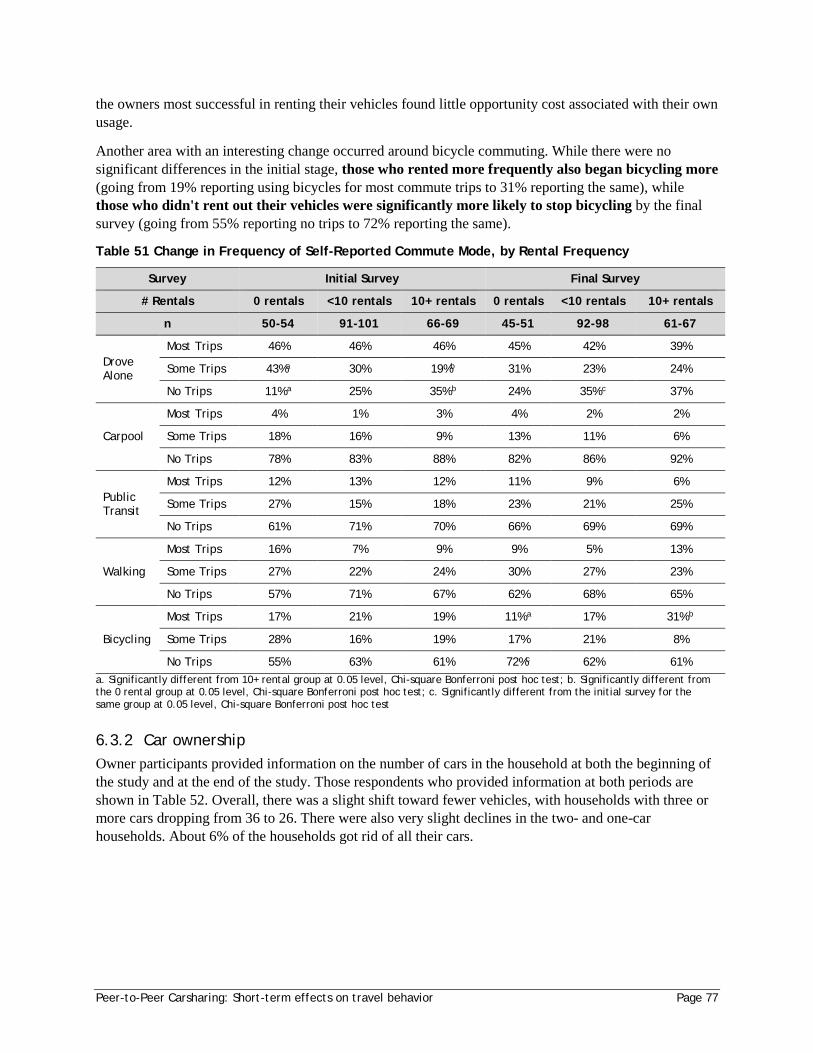
Peer-to-Peer Carsharing: Short-term effects on travel behavior Page 77
the owners most successful in renting their vehicles found little opportunity cost associated with their own usage.
Another area with an interesting change occurred around bicycle commuting. While there were no significant differences in the initial stage, those who rented more frequently also began bicycling more (going from 19% reporting using bicycles for most commute trips to 31% reporting the same), while those who didn't rent out their vehicles were significantly more likely to stop bicycling by the final survey (going from 55% reporting no trips to 72% reporting the same).
Table 51 Change in Frequency of Self-Reported Commute Mode, by Rental Frequency
Survey Initial Survey Final Survey
# Rentals 0 rentals <10 rentals 10+ rentals 0 rentals <10 rentals 10+ rentals
n 50-54 91-101 66-69 45-51 92-98 61-67
Drove Alone
Most Trips 46% 46% 46% 45% 42% 39%
Some Trips 43%a 30% 19%b 31% 23% 24%
No Trips 11% a 25% 35% b 24% 35% c 37%
Carpool
Most Trips 4% 1% 3% 4% 2% 2%
Some Trips 18% 16% 9% 13% 11% 6%
No Trips 78% 83% 88% 82% 86% 92%
Public Transit
Most Trips 12% 13% 12% 11% 9% 6%
Some Trips 27% 15% 18% 23% 21% 25%
No Trips 61% 71% 70% 66% 69% 69%
Walking
Most Trips 16% 7% 9% 9% 5% 13%
Some Trips 27% 22% 24% 30% 27% 23%
No Trips 57% 71% 67% 62% 68% 65%
Bicycling
Most Trips 17% 21% 19% 11% a 17% 31% b
Some Trips 28% 16% 19% 17% 21% 8%
No Trips 55% 63% 61% 72%c 62% 61% a. Significantly different from 10+ rental group at 0.05 level, Chi-square Bonferroni post hoc test; b. Significantly different from the 0 rental group at 0.05 level, Chi-square Bonferroni post hoc test; c. Significantly different from the initial survey for the same group at 0.05 level, Chi-square Bonferroni post hoc test
6.3.2 Car ownership Owner participants provided information on the number of cars in the household at both the beginning of the study and at the end of the study. Those respondents who provided information at both periods are shown in Table 52. Overall, there was a slight shift toward fewer vehicles, with households with three or more cars dropping from 36 to 26. There were also very slight declines in the two- and one-car households. About 6% of the households got rid of all their cars.
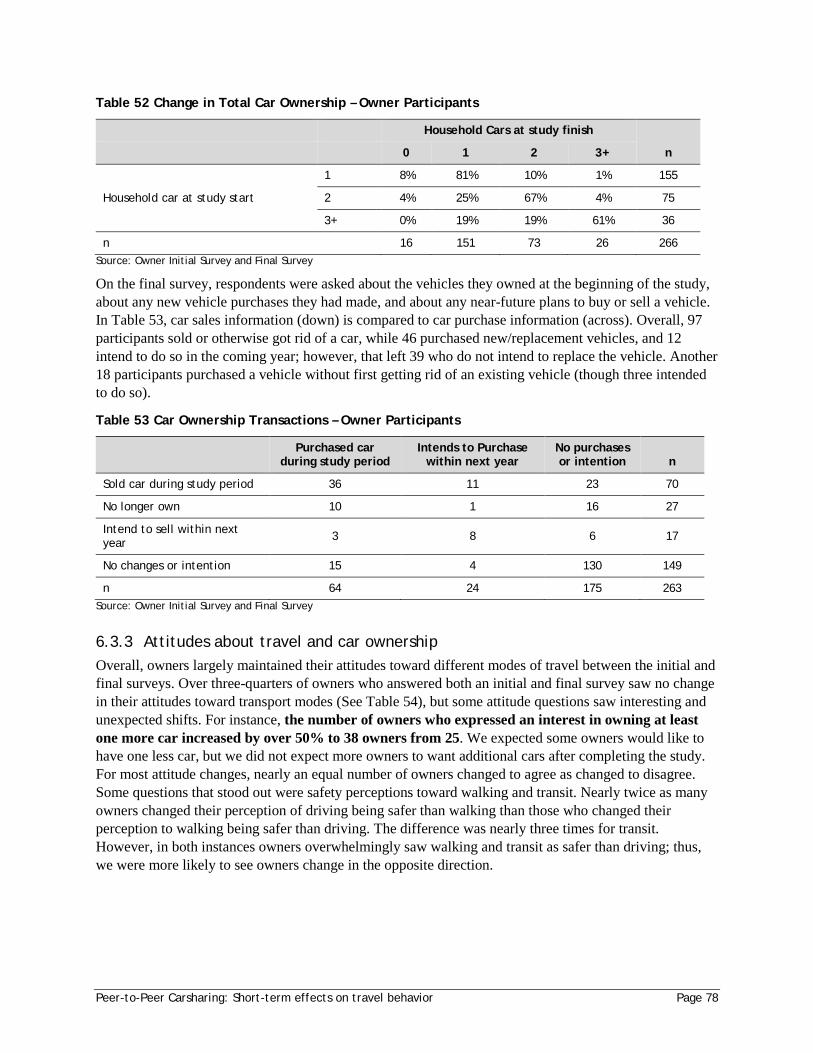
Peer-to-Peer Carsharing: Short-term effects on travel behavior Page 78
Table 52 Change in Total Car Ownership – Owner Participants
Household Cars at study finish
n 0 1 2 3+
Household car at study start
1 8% 81% 10% 1% 155
2 4% 25% 67% 4% 75
3+ 0% 19% 19% 61% 36
n 16 151 73 26 266 Source: Owner Initial Survey and Final Survey
On the final survey, respondents were asked about the vehicles they owned at the beginning of the study, about any new vehicle purchases they had made, and about any near-future plans to buy or sell a vehicle. In Table 53, car sales information (down) is compared to car purchase information (across). Overall, 97 participants sold or otherwise got rid of a car, while 46 purchased new/replacement vehicles, and 12 intend to do so in the coming year; however, that left 39 who do not intend to replace the vehicle. Another 18 participants purchased a vehicle without first getting rid of an existing vehicle (though three intended to do so).
Table 53 Car Ownership Transactions – Owner Participants
Purchased car
during study period Intends to Purchase
within next year No purchases or intention n
Sold car during study period 36 11 23 70
No longer own 10 1 16 27
Intend to sell within next year 3 8 6 17
No changes or intention 15 4 130 149
n 64 24 175 263 Source: Owner Initial Survey and Final Survey
6.3.3 Attitudes about travel and car ownership Overall, owners largely maintained their attitudes toward different modes of travel between the initial and final surveys. Over three-quarters of owners who answered both an initial and final survey saw no change in their attitudes toward transport modes (See Table 54), but some attitude questions saw interesting and unexpected shifts. For instance, the number of owners who expressed an interest in owning at least one more car increased by over 50% to 38 owners from 25. We expected some owners would like to have one less car, but we did not expect more owners to want additional cars after completing the study. For most attitude changes, nearly an equal number of owners changed to agree as changed to disagree. Some questions that stood out were safety perceptions toward walking and transit. Nearly twice as many owners changed their perception of driving being safer than walking than those who changed their perception to walking being safer than driving. The difference was nearly three times for transit. However, in both instances owners overwhelmingly saw walking and transit as safer than driving; thus, we were more likely to see owners change in the opposite direction.
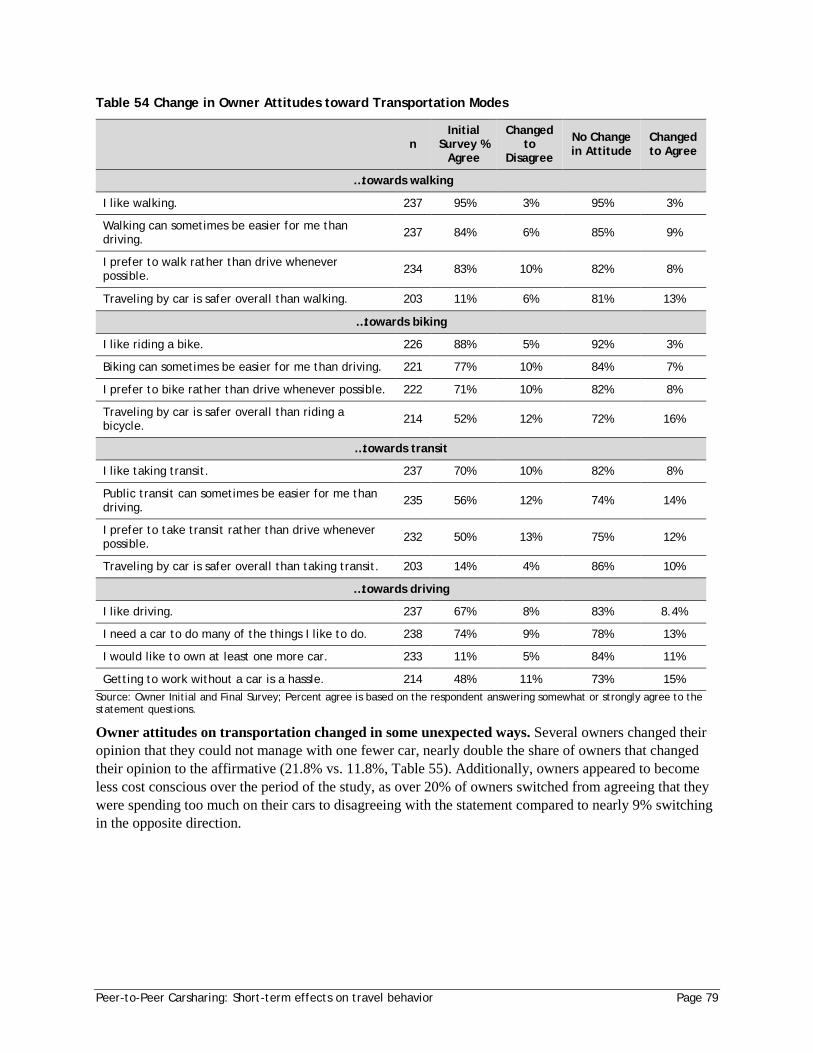
Peer-to-Peer Carsharing: Short-term effects on travel behavior Page 79
Table 54 Change in Owner Attitudes toward Transportation Modes
n Initial
Survey % Agree
Changed to
Disagree
No Change in Attitude
Changed to Agree
…towards walking
I like walking. 237 95% 3% 95% 3%
Walking can sometimes be easier for me than driving. 237 84% 6% 85% 9%
I prefer to walk rather than drive whenever possible. 234 83% 10% 82% 8%
Traveling by car is safer overall than walking. 203 11% 6% 81% 13%
…towards biking
I like riding a bike. 226 88% 5% 92% 3%
Biking can sometimes be easier for me than driving. 221 77% 10% 84% 7%
I prefer to bike rather than drive whenever possible. 222 71% 10% 82% 8%
Traveling by car is safer overall than riding a bicycle. 214 52% 12% 72% 16%
…towards transit
I like taking transit. 237 70% 10% 82% 8%
Public transit can sometimes be easier for me than driving. 235 56% 12% 74% 14%
I prefer to take transit rather than drive whenever possible. 232 50% 13% 75% 12%
Traveling by car is safer overall than taking transit. 203 14% 4% 86% 10%
…towards driving
I like driving. 237 67% 8% 83% 8.4%
I need a car to do many of the things I like to do. 238 74% 9% 78% 13%
I would like to own at least one more car. 233 11% 5% 84% 11%
Getting to work without a car is a hassle. 214 48% 11% 73% 15% Source: Owner Initial and Final Survey; Percent agree is based on the respondent answering somewhat or strongly agree to the statement questions.
Owner attitudes on transportation changed in some unexpected ways. Several owners changed their opinion that they could not manage with one fewer car, nearly double the share of owners that changed their opinion to the affirmative (21.8% vs. 11.8%, Table 55). Additionally, owners appeared to become less cost conscious over the period of the study, as over 20% of owners switched from agreeing that they were spending too much on their cars to disagreeing with the statement compared to nearly 9% switching in the opposite direction.
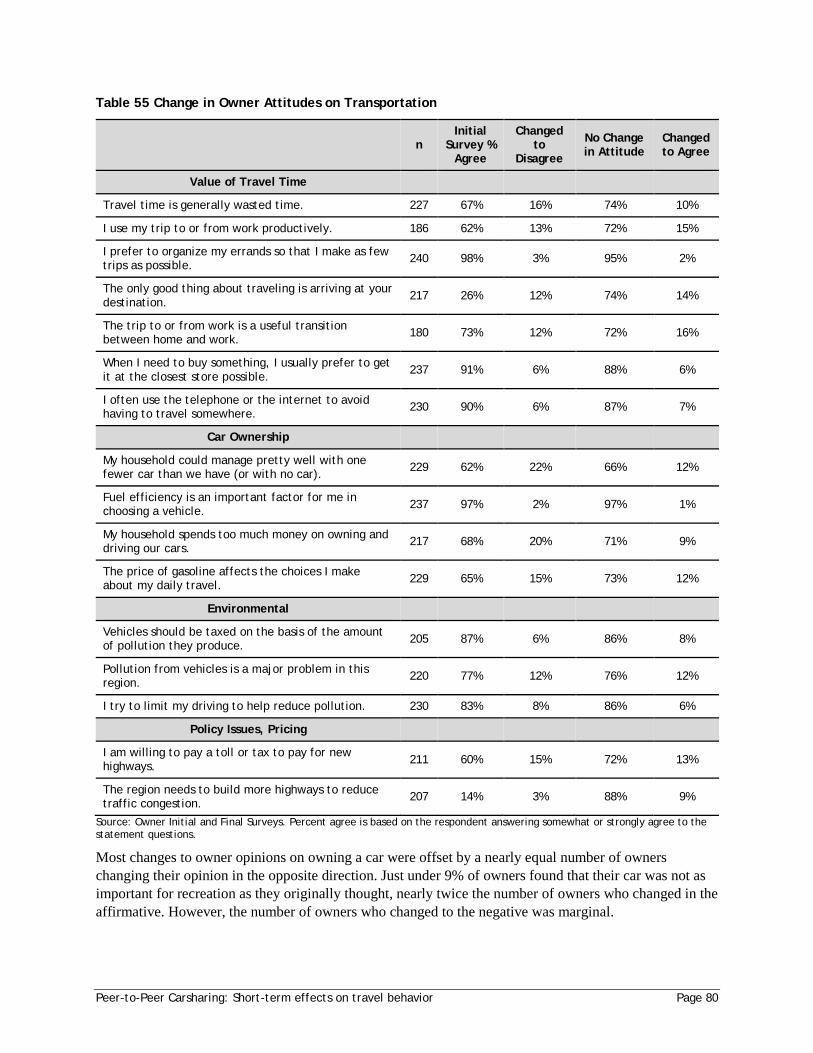
Peer-to-Peer Carsharing: Short-term effects on travel behavior Page 80
Table 55 Change in Owner Attitudes on Transportation
n Initial
Survey % Agree
Changed to
Disagree
No Change in Attitude
Changed to Agree
Value of Travel Time
Travel time is generally wasted time. 227 67% 16% 74% 10%
I use my trip to or from work productively. 186 62% 13% 72% 15%
I prefer to organize my errands so that I make as few trips as possible. 240 98% 3% 95% 2%
The only good thing about traveling is arriving at your destination. 217 26% 12% 74% 14%
The trip to or from work is a useful transition between home and work. 180 73% 12% 72% 16%
When I need to buy something, I usually prefer to get it at the closest store possible. 237 91% 6% 88% 6%
I often use the telephone or the internet to avoid having to travel somewhere. 230 90% 6% 87% 7%
Car Ownership
My household could manage pretty well with one fewer car than we have (or with no car). 229 62% 22% 66% 12%
Fuel efficiency is an important factor for me in choosing a vehicle. 237 97% 2% 97% 1%
My household spends too much money on owning and driving our cars. 217 68% 20% 71% 9%
The price of gasoline affects the choices I make about my daily travel. 229 65% 15% 73% 12%
Environmental
Vehicles should be taxed on the basis of the amount of pollution they produce. 205 87% 6% 86% 8%
Pollution from vehicles is a major problem in this region. 220 77% 12% 76% 12%
I try to limit my driving to help reduce pollution. 230 83% 8% 86% 6%
Policy Issues, Pricing
I am willing to pay a toll or tax to pay for new highways. 211 60% 15% 72% 13%
The region needs to build more highways to reduce traffic congestion. 207 14% 3% 88% 9%
Source: Owner Initial and Final Surveys. Percent agree is based on the respondent answering somewhat or strongly agree to the statement questions.
Most changes to owner opinions on owning a car were offset by a nearly equal number of owners changing their opinion in the opposite direction. Just under 9% of owners found that their car was not as important for recreation as they originally thought, nearly twice the number of owners who changed in the affirmative. However, the number of owners who changed to the negative was marginal.
Peer-to-Peer Carsharing: Short-term effects on travel behavior Page 81
Larger changes came from owners’ opinions on their willingness to drive less and share their car with others. A willingness to drive less was a signal that they may be willing to alter their behavior in order to allow their vehicle to be available for rental more often. In the initial survey, just over 84% of owners who also answered the final survey said they would like to drive less (Table 56). However, by the end of their participation in the study, 38 of the owners who wanted to drive less no longer wanted to while 21 owners changed their opinion in the other direction. This analysis of change is slightly muddled as owners may have already begun driving less and thus did not wish to drive even less. More shocking was owners’ response to wanting to share their car. While nearly all owners expressed agreement with the statement that they were willing to share their car with others, 32 owners (over 13% of all owners) who agreed initially no longer agreed by the end of their participation. The interviews in the next section provide some insights into why this might be the case.
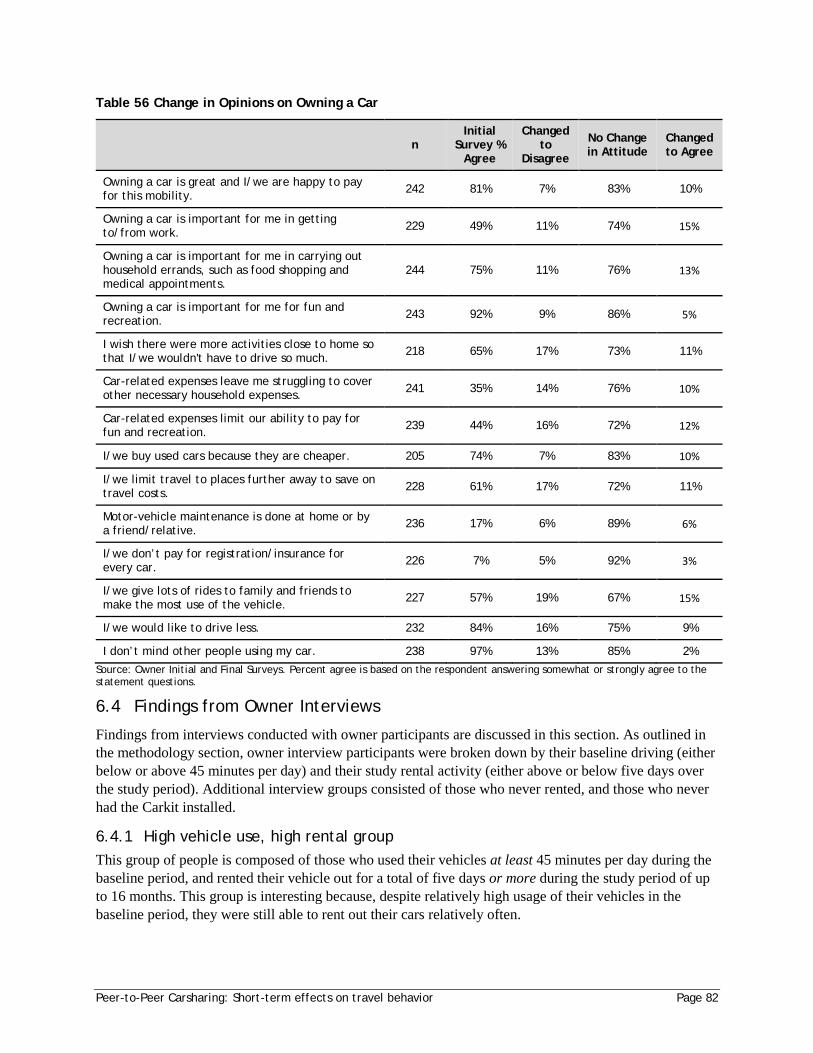
Peer-to-Peer Carsharing: Short-term effects on travel behavior Page 82
Table 56 Change in Opinions on Owning a Car
n Initial
Survey % Agree
Changed to
Disagree
No Change in Attitude
Changed to Agree
Owning a car is great and I/we are happy to pay for this mobility. 242 81% 7% 83% 10%
Owning a car is important for me in getting to/from work. 229 49% 11% 74% 15%
Owning a car is important for me in carrying out household errands, such as food shopping and medical appointments.
244 75% 11% 76% 13%
Owning a car is important for me for fun and recreation. 243 92% 9% 86% 5%
I wish there were more activities close to home so that I/we wouldn't have to drive so much. 218 65% 17% 73% 11%
Car-related expenses leave me struggling to cover other necessary household expenses. 241 35% 14% 76% 10%
Car-related expenses limit our ability to pay for fun and recreation. 239 44% 16% 72% 12%
I/we buy used cars because they are cheaper. 205 74% 7% 83% 10%
I/we limit travel to places further away to save on travel costs. 228 61% 17% 72% 11%
Motor-vehicle maintenance is done at home or by a friend/relative. 236 17% 6% 89% 6%
I/we don’t pay for registration/insurance for every car. 226 7% 5% 92% 3%
I/we give lots of rides to family and friends to make the most use of the vehicle. 227 57% 19% 67% 15%
I/we would like to drive less. 232 84% 16% 75% 9%
I don’t mind other people using my car. 238 97% 13% 85% 2%
Source: Owner Initial and Final Surveys. Percent agree is based on the respondent answering somewhat or strongly agree to the statement questions.
6.4 Findings from Owner Interviews
Findings from interviews conducted with owner participants are discussed in this section. As outlined in the methodology section, owner interview participants were broken down by their baseline driving (either below or above 45 minutes per day) and their study rental activity (either above or below five days over the study period). Additional interview groups consisted of those who never rented, and those who never had the Carkit installed.
6.4.1 High vehicle use, high rental group This group of people is composed of those who used their vehicles at least 45 minutes per day during the baseline period, and rented their vehicle out for a total of five days or more during the study period of up to 16 months. This group is interesting because, despite relatively high usage of their vehicles in the baseline period, they were still able to rent out their cars relatively often.
Peer-to-Peer Carsharing: Short-term effects on travel behavior Page 83
One trend observed among members of the High, High group was that many used Getaround as a motivating factor to do something they already wanted to do, such as keeping their car clean, driving less, and using alternative modes of transportation more. These people were, in a sense, seeking motivation to change their behavior and saw participation in Getaround as a possible way. Some quotes from participants demonstrate this:
• "I liked the incentive to bike because I am lazy" • "I need that little extra push. It was like, hey, if I am making money, I will leave my car at home, and
now I will have to bike, and I liked that. I also liked the incentive to keep my car clean because I kind of live out of my car. So like, you know, I better keep it clean so when somebody rents it, I don't have to do the whole big thing again. Those were the two, big reasons."
• “The whole idea of sharing your car and maybe make a little money and decrease the overall car usage, and it might encourage me to drive less which is always a good thing so, yeah, it was kind of a win-win”
• “I loved [not going places during rentals]. I really loved that. And I sort of used it for that. I was like, okay, I'm not going to have my car, I can stay at home and get more stuff done or just like hang out with my kids or not spend money, not even little trips for groceries. Not do any of that and I sort of loved that.”
For some, making extra money was the main motivation, though, and they had periods when they weren’t using the car, often because they were already using other modes to get around.
Members of this group also were inclined to plan their schedules out in advance to either make their car available, or to not depend on their car when a rental was requested. Some actually paid to promote their vehicles, with one person spending several hundred dollars on postcards to advertise their vehicle around the neighborhood (though they felt Getaround should have been doing the advertising).
Members in this group did tend to say that they changed their travel behavior and were walking, biking and taking transit more. However, in many cases, the change in behavior was just “early on” or “at the beginning.” Some indicated that they wanted to use their vehicles more in the rainy season.
One common theme in this group and among those who rented their car out more frequently in other groups (for example the Low, High group), was that many indicated that they were not that concerned with things happening to their cars, or at least did not let it bother them that much. For example:
• “It never concerned me too much because I can fix stuff pretty well and so it never really bugs me. Same with my house, if someone breaks something I never really make a big deal about it. I'm pretty handy, I can fix stuff. So, I think that's another reason I like pure rental things is that it doesn't bug me if people use my stuff and they accidentally do something to it.”
• “My car is not, like, brand new. We didn't worry about scratches or dings, I have plenty of those. I think if I had a nice, new car, I would want to inspect it after each person.”
• “So it's definitely not going to be the same van once it's all said and done, so you kind of just have to anticipate that because people, unfortunately, are not as respectful with other people’s things as you would like for them to be. They kind of take some liberties.”
It’s not that people in this group weren’t concerned at all – one person told us:
• “You never know how they're driving it. If they're like revving up the engine and like going a 100 miles an hour and hopping off curbs. You don't know how well they're taking care of it.”
Peer-to-Peer Carsharing: Short-term effects on travel behavior Page 84
Still, in this group, these fears didn’t seem to be their primary consideration, and that, “As long as [the renter] had good ratings from other people I felt a lot more comfortable renting it out.”
A number of these people indicated that they had very positive experiences, with a number citing renters who left appreciative notes (or even gift cards) as a way of saying thanks: “Somebody left a really sweet note and messages about ‘Oh, we had so much fun, we went to the beach and this is what we did.’ I had this sense of community that I loved. Most of these people I never met in person, but just to feel like we are in this together and sharing something like benefitting both of us.”
Still, concern over the possible wear did lead to some people in this group to stop renting their vehicles eventually. Others left because they could no longer accept or reject requests given the transition to the instant system, or because they could no longer keep their car in a locked garage. Across all groups, some left due to moving or to cars aging out of the system (e.g., more than 150,000 miles or older than 1996).
6.4.2 High vehicle use, low rental group This group of people is composed of those who used their vehicles at least 45 minutes per day during the baseline period, and rented their vehicle out for a total of less than five days during the study period of up to 16 months. In a sense, their lack of renting out makes sense since they appeared to be using their vehicle relatively frequently, thereby reducing their opportunity to rent.
Generally people in this group felt like they had times when they weren’t using their car much, either during the day, during the week or on weekends, and wanted to put it to better use. The appeal of the sharing economy was mentioned by a number, while a few were looking for ways to earn a bit more money. Some participants in this group didn’t get a lot of rental requests: one person had a car with a manual transmission and felt that restricted their customer base substantially.
Many people in this group didn’t accept many of the rental requests that were made of their vehicle, either because they were too busy, were nervous about potential damage or wear on the car, or needed the car during the requested time. Some in this group also felt that their lifestyle didn’t accommodate the need to be monitoring for rentals. One person explained that:
• “It was like, if I'm in a busy day or if I'm working or if I'm having a meeting for my employees or whatever it was I was doing, I'm not going to see a personal email that says, ‘Hey, you have somebody who wants to rent your car.’ So once I get home, make dinner, get settled in, it's 8 p.m. Then I would get to sit down with my personal emails, that's when I would notice that oh, somebody at 2:00 today all of a sudden instantaneously decided they wanted to rent my car and I wasn't available to respond.”
Others were just too busy, both in life and in their use of the car, to rent it out:
• “It was like I'm living in Portland, I'm working in [another city] and [my boyfriend’s living in another part of Portland], and it became a scheduling coordination nightmare. Add in a dog and a cat in separate locations that need food and attention. It became so complicated that I generally was like, I will only rent this out if it's a hundred percent simple for me, an obvious time that I don't need my car.”
• “I started my own business, and then I needed my car a lot more.” • “I only did it a handful of times and my circumstances meant that I just couldn't do it anymore. It just
seemed like everyone that wanted it, wanted it for like ten days and I was like, ‘I can't rent you my car for ten days’.”
Peer-to-Peer Carsharing: Short-term effects on travel behavior Page 85
• “I can remember a couple experiences where I'd get a text from Getaround that said someone wanted to rent it and I'd think like, well I'm actually going to want to use my car later.”
Sometimes people weren’t sure if they needed the car, but thought they might want to:
• “There were times that I didn't text "accept" back to Getaround just because, I don't know, I thought maybe I'd want to use it, or I wanted to have the flexibility if I wanted to go somewhere, a friend's house or whatever, just to have it available in that free time.”
Another common reason people cited for not renting out their vehicle was that people were concerned about not knowing who was renting their car, how they would treat it, and whether they might damage it:
• “I was definitely more reluctant with the car anyway just because it's my main vehicle and I love my little car.”
• “[People requested to use the vehicle] in ways that'd make me nervous: [for example, potential renters would say]: ‘We're going to take it to the beach. We're from out of town and we're going to take it to the Gorge.’ I don't love that idea, so then I kept on having to say no because they wanted it for so long.”
• “I would literally say no and in the notes be like, ‘Why don't you just rent a car? It's going to cost this much and here's a great location that offers cheap deals. Good luck.’ I was like, do you have bad credit? Do you have a bad driving record?”
• “I think my car got a little scratched by the person who'd been using it and so I had some more trepidation after that point. I think that was the only rental that I did, because I think it was the first one and it sort of gave me, not like a bad impression, but it made me a little less confident that I could share my vehicle and have people use it easily. I noticed it and it seemed new to me. It wasn't like a large dent or anything, but it was enough for me to notice something was different. I don't remember what happened and I sort of ended up just not worrying about it.”
In other cases, renting out their car seemed more attractive when they were making less money or otherwise were more urgently in need of cash, but the hassle was not worth it anymore:
• “It's kind of progressively gotten busier over the last two years, and I've become more financially secure. I'm not as interested in trading and other sources of income as I was a couple of years ago. Yeah, just using my car more because of meeting clients and just being, in general, super busy and not having time to be flexible. My schedule was a lot more flexible before.”
• “I didn't feel like I ended up making a ton of money off of it. I'm not sure if it ... Like I said, part of the reason I probably am not as impressed by it now is because I didn't feel like it was that great of a revenue stream for me. If I don't really need it right now, then it's not really worth it.”
• “At the prices I had it, it didn't seem worthwhile when I would get a request to accept it because it was like, whoever wants to rent your car for two hours for sixteen bucks and it didn't seem worthwhile.”
In some cases, there was a sense that if damage occurred, even though it was covered by Getaround, there would be hassle involved:
• “This became more of a hassle, more of a risk, and even if someone [messes] up my car in a minor way, I don't have even the mental capacity to make this worth my while. To be financially worth my while. I think that I just became too busy and too high of an earner for this to make sense.” [At some point] “Something clicked in my head and I was like okay, even if someone [messes] up my car and
Peer-to-Peer Carsharing: Short-term effects on travel behavior Page 86
Getaround's going to protect it, what is the administrative process I'm going to have to go through with Getaround to make this worthwhile? That made me falter. When I saw just how frustrating insurance is, especially for minor stuff.”
• “It's one of those things where there's a lot of risk to the person who owns the vehicle. It does seem as if the payout should be a little bit higher.”
• [Describing a friend who was considering Getaround] “I think that her hesitation is she was like, ‘I'm not completely convinced that they're going to take care of me completely if there's a problem.’ And I wasn't able to tell her that they take care of me perfectly every single time because like I said I still have outstanding claims and I still have things that just take a little bit longer and it's still a little bit clunky, the system. They need to get those pieces worked out.”
6.4.3 Low vehicle use, high rental group This group of people is composed of those who used their vehicles less than 45 minutes per day during the baseline period, and rented their vehicle out for a total of five days or more during the study period of up to 16 months. People in this group tended to have extra vehicles in the household that they rarely used. Often this would be composed of one person who drove a primary car regularly, and a partner or spouse who rarely did but could still access the primary vehicle when needed, leaving a secondary vehicle potentially available.
As mentioned, many in this category had cars largely sitting idle, along with the motivation to put it to better use:
• “I am kind of an advocate of environmental things, stewards of the earth, and trying not to use any more resources than what we have to. I had a car and I was not using it that often, just for errands and trips and things like that. I thought that was a great opportunity to try a project like this. I thought it was a really good idea.”
• “I had just become aware that it was better for the environment to not drive if you didn't have to, and also for health reasons. Also, I guess after I joined Getaround it probably was a little more, that was an extra reason to have my car more available, if possible.”
• “The [rental] car is more for in case of emergency or my wife is out and I'm home with the kids and need to do something.”
Further, these tended to be people who could plan their own use and need of the vehicle in advance (in contrast to the High, Low group members who tended to need the option of using the vehicle available to them):
• “If someone was going to rent my car, then I would definitely organize my appointments, or chores, or errands around that, for sure. I tried to make the priority to have my car available, if I could.”
• “If one week out of the month I couldn't use it for my days off, I would just use my work car if I needed to go to the store or something, but I didn't have any big plans ... I wouldn't have any big plans on the days off when I was renting.”
• “I do my best to keep it open. I have one day a week where I watch my kids for the day so I keep it blocked off for that time period. I try and plan as far ahead as possible so if we know we have family in town, I'll just block it out a month in advance.”
• “If I knew I had to use it, I definitely marked it as unavailable. But it was, you know, pretty few and far between comparatively to most people.”
• “Probably the worst part, I suppose is, having to reschedule your time a little bit, if necessary, and being without your car. But, actually that is a probably a good way to get people thinking about how to do other things while doing without your car. So, I think that could also be a positive.”
Peer-to-Peer Carsharing: Short-term effects on travel behavior Page 87
These people were also pretty open with who they would accept. One person said: “My acceptance rate was pretty darn high. And I cannot recall. I may have had to decline one and I can't remember the details. But if I declined anyone, it was one time.”
These group members generally also indicated positive customer service experiences with Getaround in the times when there were issues or damage to the vehicles. There was a sense that these people trusted that they would be taken care of if needed:
• “As an owner, it's been really, really good experiences with Getaround. The times when my car was like, one time, came back smelling like cigarettes smoke and they're like, ‘Oh, yeah, just take it to ... get it cleaned, give us a receipt and we’ll reimburse you, don't even worry about it.’ And one other time, the renter was really good, they got backed into in a parking lot or something. They called me right away and were really apologetic, and the Getaround team picked up my car. It wasn't even a huge team but they picked up my car, took it to a body shop, brought it back ... I did nothing and they just completely took care of it.”
• Asked if they did research on the insurance: “Basically, I just trust them. The insurance card they gave me was actually legit.”
In general, people in this group were aware that sometimes the car might be damaged or come back dirty, but were willing to live with that. For example, one person stated that, “There's been a couple of bad apples, where it came back with scratches or really dirty inside. It's been the minority of cases but it's still annoying when it happens.” Whereas other people might remove their car and never rent again, this person was willing to move on and accept this occasional annoyance.
Another person provided some insight into their thinking on why they were willing to accept the inevitable wear and potential for damage on their vehicle, but that they might have different considerations if their vehicle were new:
• “Because it's an older car ... I trust that it's in Getaround's best value proposition to screen people enough. For me the value [of getting a lot of rentals] is more important [than stronger vetting of renters]. Plus, I have enough trust that if something goes bad Getaround will make it right. Just because I've had that experience with them. If I had a newer car, I would be more nervous that they couldn't return it to a brand new condition. As is [with the older car], whatever, they'll be able to take things out of the door and shampoo the seats and it'll be fine. It's not perfect now and it doesn't need to be perfect. I've often wondered, eventually we'll replace the car and whether we would list a newer car on Getaround. If we did, I'd be much more interested in making sure people are well vetted.”
6.4.4 Low vehicle use, low rental group This group of people is composed of those who used their vehicles less than 45 minutes per day during the baseline period, and rented their vehicle out for a total of less than five days during the study period of up to 16 months. In general, the individuals interviewed in this group were supportive of the idea of carsharing and were not using their cars much now. However, they were also not dependent upon the income and felt that the (real or potential) hassles involved didn’t make it worthwhile.
Some in this group also didn’t have many rental requests:
• “It was available fairly frequently, because I worked at home. There weren't many times where I didn't have it available.”
• “I did not get many bites.” • “We didn't have a ton of requests.”
Peer-to-Peer Carsharing: Short-term effects on travel behavior Page 88
In several cases, these individuals were in partner or family households in which one partner or the other was not comfortable giving up the option to use the vehicle if they should want to:
• “The reason we didn't was kind of a result of the different opinions between myself and my husband. I'm kind of the all in, let's share as much as we can.” “In a way I remember when we'd get some of the Getaround share requests, I managed that, so I would get them, and I would text him. Be like, ‘Do you need the car this afternoon between 6 and 9?’ There were times when he'd be like, ‘I don't know, I might. Don't rent it.’ You know? Part of it was just balancing ... He was more of the mindset of I don't want to let somebody else use it unless I'm 100% sure that I won't need it.”
In other cases, the inconvenience of managing the process was too great for the amount of money they would make or given the amount of time they had:
• “What I found challenging is that it's my car. It's got my [possessions] in it. I don't know what my needs are necessarily going to be and then I get a text message like, ‘Approve this driver.’ And then I have to meet this driver, and kind of feel like ‘Do I trust this driver?’ Even though I know insurance is included, but how are they going to drive my car? I don't know this person, you know what I mean? Can I trust this person? For me, the time involved to actually rent the car was a barrier that I personally wasn't willing to overcome. I wouldn't say it's insurmountable, but I didn't need the 50 bucks that I was going to make.”
• “I think in order for it to work, you have to really commit to be like, ‘I need the money.’ The people it works for are like, ‘I need the money from this car’.”
• “I didn't actually rent my car out that many times because the other thing too is that people would want it, like, right now. And since I'm a massage therapist, I don't have access to my phone for an hour at a time.”
• “Is it worth my time to keep my car in pristine condition? When I'm only getting like three dollars an hour for it?”
• “In the end, it was like ‘This is too inconvenient for the extra $50.’ And I wasn't keeping the 50 bucks, it wasn't adding to household income, it was anytime we did bring something in we would use it as mad money. So it's like, ‘Okay kids, you clean the car up, somebody's going to rent it, you get 10 bucks,’ and then we'll have the other 20 bucks and go get pizza or something. So it was really luxury discretionary income, which should have been more of an incentive, but in the end turned out to not be an incentive for any of us. Because it's not like the kids didn't have ten dollars anywhere else so it wasn't worth it to them, and who cares about pizza, really?”
• “It wasn't the time cost, it was the extra thing that you feel you're responsible for. It’s like, ‘Oh I have to check the schedule today. Do I have this right? Or did I block off everything?’ And it was just an extra task and I have a very busy practice”
Others felt the risk of renting their car out was just too great:
• “I'm all for sharing, but I want that final say over who is going to use my stuff.” “I wanted to have an exchange with that person, and make sure that they communicated clearly. Make sure that I understood why they wanted to use my car. I could have seen like if it was a legitimate request, and they weren't going off for I don't know what.”
• “What's the downside risk of doing this? What if somebody totals our car and makes it undriveable? I know the Getaround policy said you're protected and insured, and whatever, but really what would have happened?” “There was some concern. How long would it have taken to get our remediation, or whatever, through this bureaucracy in Silicon Valley?”
Peer-to-Peer Carsharing: Short-term effects on travel behavior Page 89
In other situations, people placed restrictions on where their vehicle was available, or priced the vehicle at a level that might have been above others, such that they may have squeezed out their potential market:
• “I blocked it off [when it wasn’t available]. I didn't want people to have unrealistic expectations, because I always thought, I can't stand it when something says it's available and then they tell me it's not. That didn't seem fair, so I would make sure that when it wasn't available it wasn't available, so that might have certainly dampened requests.”
• "I don't want to be the cheapest one out there. I want to be charging higher than market rate, because I only want people who are willing to pay higher than market rate. We have a desirable car. It's super clean, and in good condition.”
6.4.5 No-rentals group People in the no-rental group signed up for Getaround and to participate in the study, took the initial survey (at least), and had a Carkit installed. However, they never actually rented out their vehicle through Getaround. Their lack of rentals occurred due to a variety of reasons. One person’s vehicle had mechanical problems and, “At one period of time there was just me giving money to my mechanic to keep it running for me, so the idea of actively being on Getaround and having someone have those issues that kind of put it on hold for a while.” One person had the vehicle completely available, lowered the price, and still never really got much interest. Another ended up needing the car more for work and didn’t rent because of that. Another mentioned that they never really put much effort into making their vehicle profile attractive, or doing any other sort of marketing. Many of these reasons are similar to reasons some members of the High-Low and Low-Low groups did not rent out their vehicles much, though there was not a unique thread distinguishing this group from those.
6.4.6 No-Carkit group Those in the no-Carkit group also signed up for Getaround and to participate in the study, and took the initial survey; however, they never took the next step, which was getting the Carkit installed. Reasons cited for not doing so included two people who sold their cars not long after signing up, and another who in fact rented their car out (mostly to friends and students living nearby), but told us that Getaround wanted them to pay to have the Carkit installed (this may have been later than the study signup period).
Perhaps the most surprising conversation in this group was with a retired man who was interested in P2P carsharing, but thought the legality of P2P from an insurance perspective needed to be further sorted out:
• “The conversation I had with my insurance agent made me a little bit wary of getting involved. Being on the leading edge of something new is great, but on the bleeding edge of financially putting myself at risk, I thought, it's just not worth going there until maybe this thing settles out and there's some court cases that establish precedent and insurance companies get aboard and I'm just not willing to stick my neck out that far. That's when I kind of lost interest in Getaround.”
6.5 What Was the Owner Experience with P2P Carsharing?
This section discusses feedback from participant owners on their experience with peer-to-peer carsharing.
6.5.1 General opinions about peer-to-peer carsharing All owner participants were asked to explain, in their own words, what they thought was the best thing about peer-to-peer carsharing. Responses were coded into thematic categories based on their content, and are presented in Table 57. Some responses touched on multiple ideas, and were coded into more than one
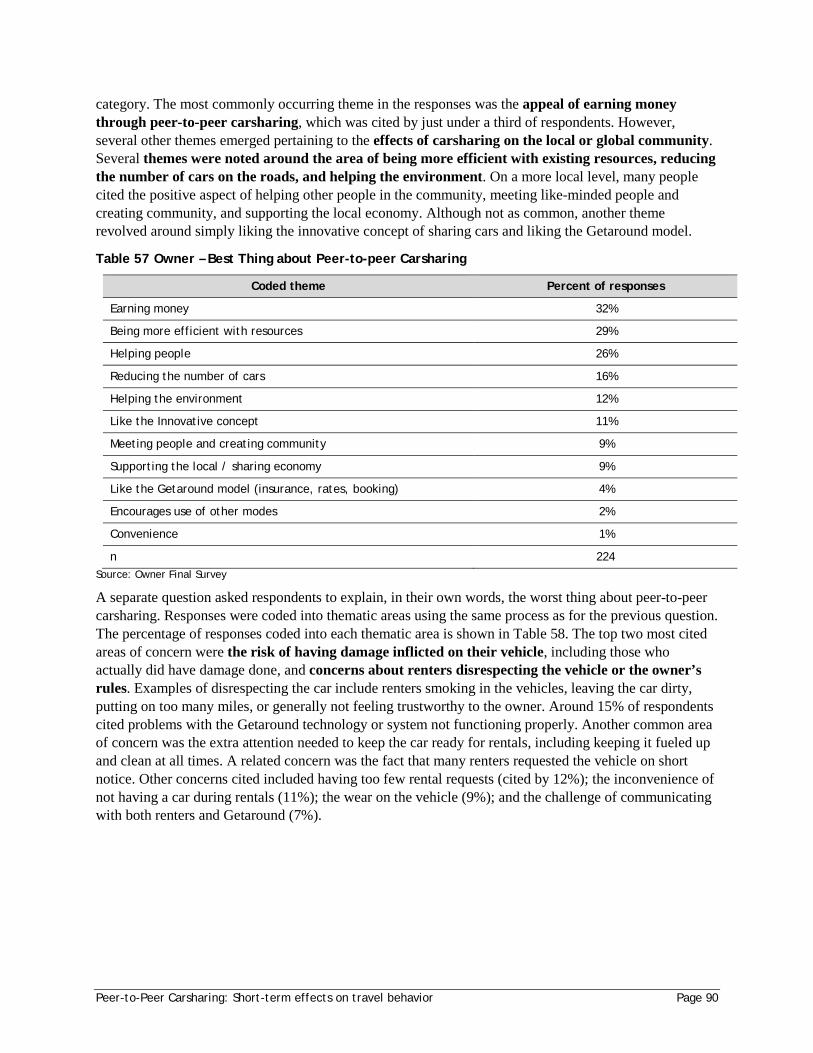
Peer-to-Peer Carsharing: Short-term effects on travel behavior Page 90
category. The most commonly occurring theme in the responses was the appeal of earning money through peer-to-peer carsharing, which was cited by just under a third of respondents. However, several other themes emerged pertaining to the effects of carsharing on the local or global community. Several themes were noted around the area of being more efficient with existing resources, reducing the number of cars on the roads, and helping the environment. On a more local level, many people cited the positive aspect of helping other people in the community, meeting like-minded people and creating community, and supporting the local economy. Although not as common, another theme revolved around simply liking the innovative concept of sharing cars and liking the Getaround model.
Table 57 Owner – Best Thing about Peer-to-peer Carsharing
Coded theme Percent of responses
Earning money 32%
Being more efficient with resources 29%
Helping people 26%
Reducing the number of cars 16%
Helping the environment 12%
Like the Innovative concept 11%
Meeting people and creating community 9%
Supporting the local / sharing economy 9%
Like the Getaround model (insurance, rates, booking) 4%
Encourages use of other modes 2%
Convenience 1%
n 224 Source: Owner Final Survey
A separate question asked respondents to explain, in their own words, the worst thing about peer-to-peer carsharing. Responses were coded into thematic areas using the same process as for the previous question. The percentage of responses coded into each thematic area is shown in Table 58. The top two most cited areas of concern were the risk of having damage inflicted on their vehicle, including those who actually did have damage done, and concerns about renters disrespecting the vehicle or the owner’s rules. Examples of disrespecting the car include renters smoking in the vehicles, leaving the car dirty, putting on too many miles, or generally not feeling trustworthy to the owner. Around 15% of respondents cited problems with the Getaround technology or system not functioning properly. Another common area of concern was the extra attention needed to keep the car ready for rentals, including keeping it fueled up and clean at all times. A related concern was the fact that many renters requested the vehicle on short notice. Other concerns cited included having too few rental requests (cited by 12%); the inconvenience of not having a car during rentals (11%); the wear on the vehicle (9%); and the challenge of communicating with both renters and Getaround (7%).
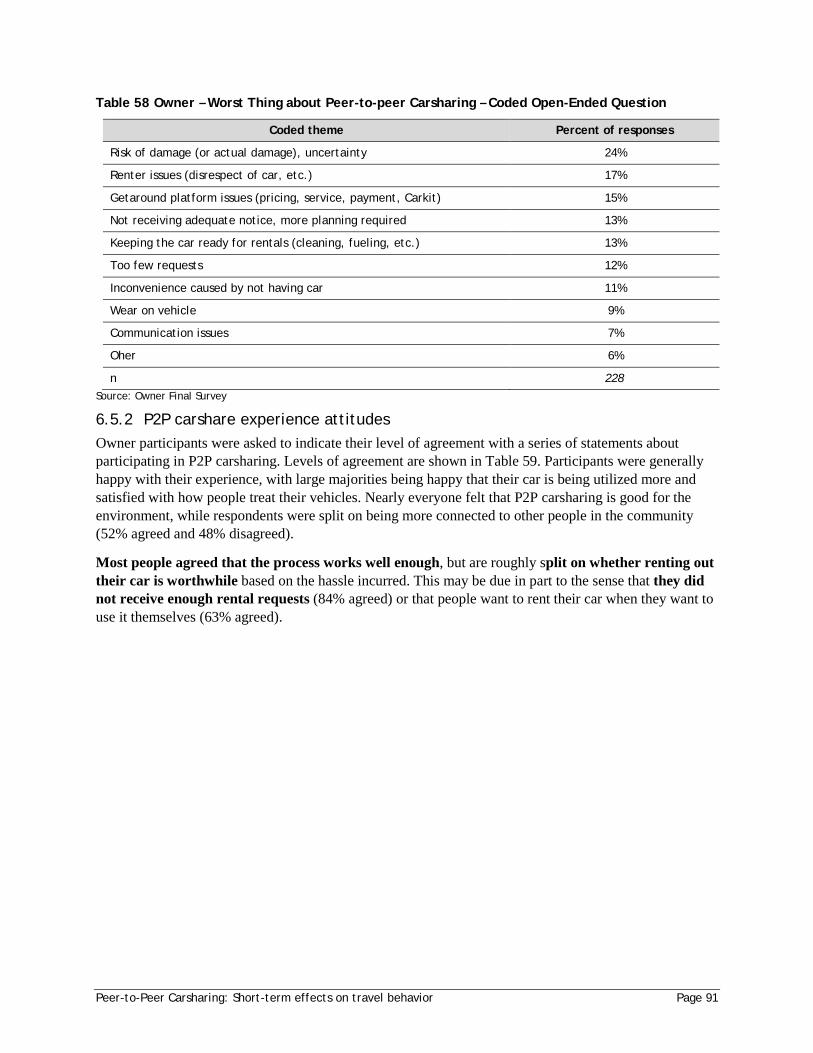
Peer-to-Peer Carsharing: Short-term effects on travel behavior Page 91
Table 58 Owner – Worst Thing about Peer-to-peer Carsharing – Coded Open-Ended Question
Coded theme Percent of responses
Risk of damage (or actual damage), uncertainty 24%
Renter issues (disrespect of car, etc.) 17%
Getaround platform issues (pricing, service, payment, Carkit) 15%
Not receiving adequate notice, more planning required 13%
Keeping the car ready for rentals (cleaning, fueling, etc.) 13%
Too few requests 12%
Inconvenience caused by not having car 11%
Wear on vehicle 9%
Communication issues 7%
Oher 6%
n 228 Source: Owner Final Survey
6.5.2 P2P carshare experience attitudes Owner participants were asked to indicate their level of agreement with a series of statements about participating in P2P carsharing. Levels of agreement are shown in Table 59. Participants were generally happy with their experience, with large majorities being happy that their car is being utilized more and satisfied with how people treat their vehicles. Nearly everyone felt that P2P carsharing is good for the environment, while respondents were split on being more connected to other people in the community (52% agreed and 48% disagreed).
Most people agreed that the process works well enough, but are roughly split on whether renting out their car is worthwhile based on the hassle incurred. This may be due in part to the sense that they did not receive enough rental requests (84% agreed) or that people want to rent their car when they want to use it themselves (63% agreed).
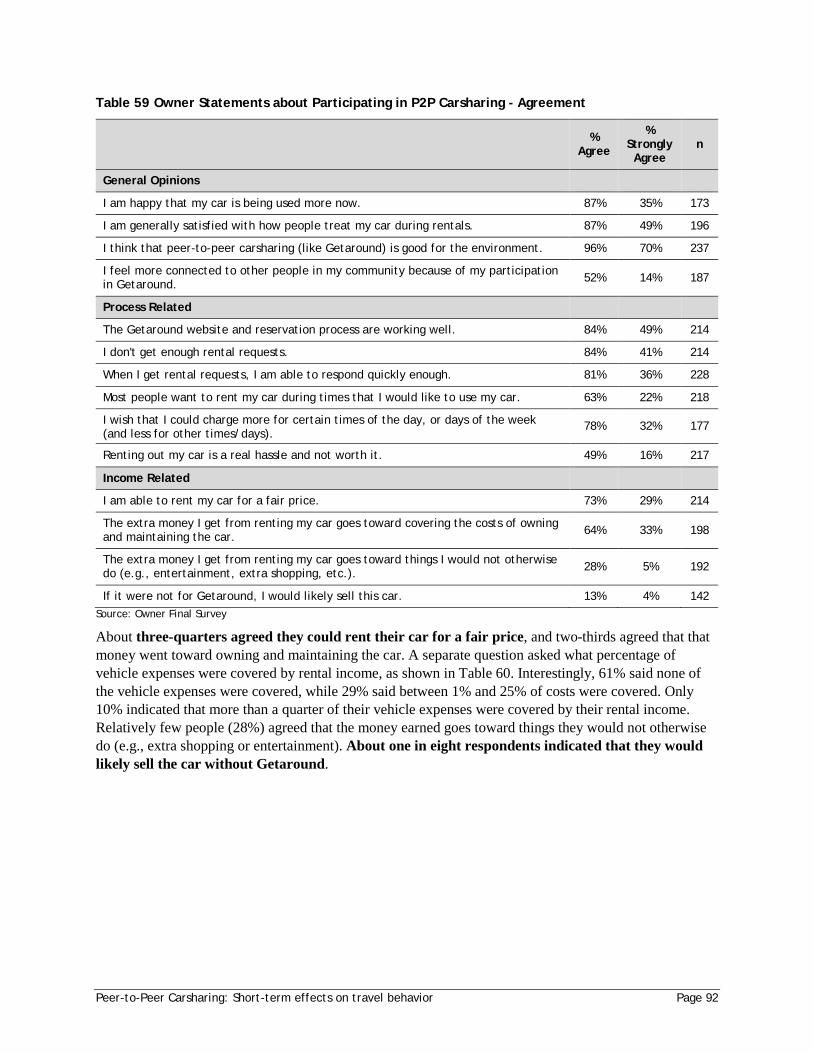
Peer-to-Peer Carsharing: Short-term effects on travel behavior Page 92
Table 59 Owner Statements about Participating in P2P Carsharing - Agreement
% Agree
% Strongly Agree
n
General Opinions
I am happy that my car is being used more now. 87% 35% 173
I am generally satisfied with how people treat my car during rentals. 87% 49% 196
I think that peer-to-peer carsharing (like Getaround) is good for the environment. 96% 70% 237
I feel more connected to other people in my community because of my participation in Getaround. 52% 14% 187
Process Related
The Getaround website and reservation process are working well. 84% 49% 214
I don't get enough rental requests. 84% 41% 214
When I get rental requests, I am able to respond quickly enough. 81% 36% 228
Most people want to rent my car during times that I would like to use my car. 63% 22% 218
I wish that I could charge more for certain times of the day, or days of the week (and less for other times/days).
78% 32% 177
Renting out my car is a real hassle and not worth it. 49% 16% 217
Income Related
I am able to rent my car for a fair price. 73% 29% 214
The extra money I get from renting my car goes toward covering the costs of owning and maintaining the car. 64% 33% 198
The extra money I get from renting my car goes toward things I would not otherwise do (e.g., entertainment, extra shopping, etc.). 28% 5% 192
If it were not for Getaround, I would likely sell this car. 13% 4% 142 Source: Owner Final Survey
About three-quarters agreed they could rent their car for a fair price, and two-thirds agreed that that money went toward owning and maintaining the car. A separate question asked what percentage of vehicle expenses were covered by rental income, as shown in Table 60. Interestingly, 61% said none of the vehicle expenses were covered, while 29% said between 1% and 25% of costs were covered. Only 10% indicated that more than a quarter of their vehicle expenses were covered by their rental income. Relatively few people (28%) agreed that the money earned goes toward things they would not otherwise do (e.g., extra shopping or entertainment). About one in eight respondents indicated that they would likely sell the car without Getaround.
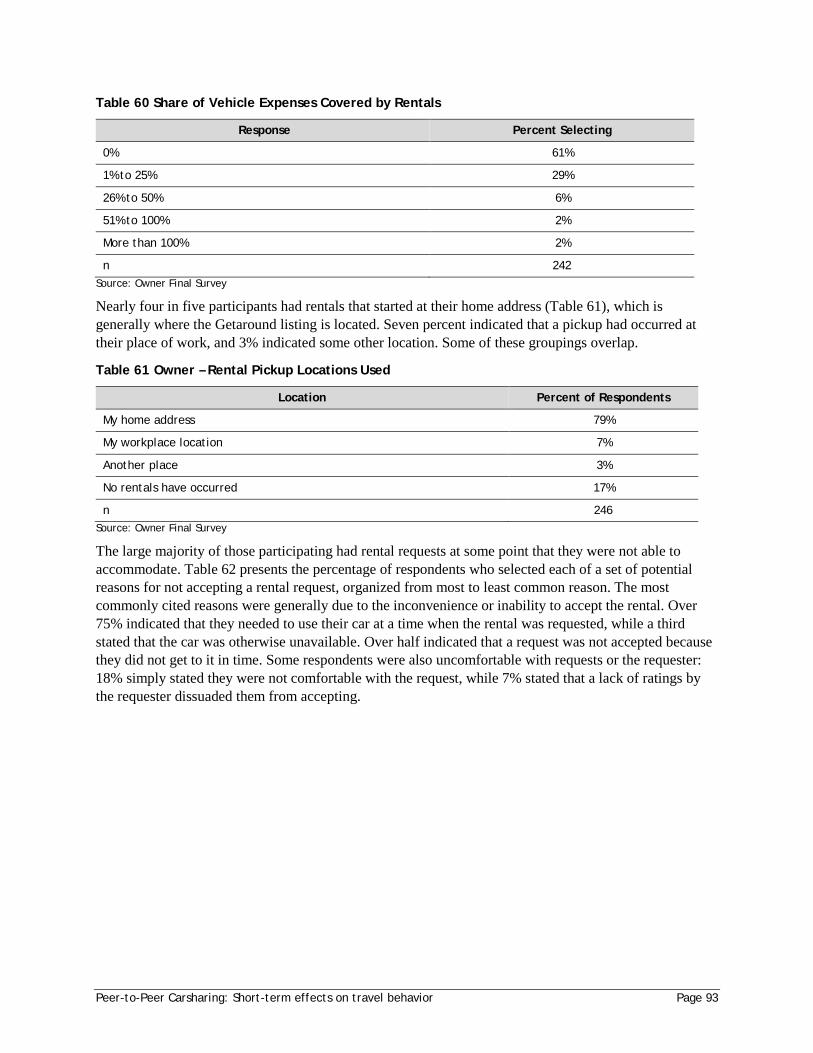
Peer-to-Peer Carsharing: Short-term effects on travel behavior Page 93
Table 60 Share of Vehicle Expenses Covered by Rentals
Response Percent Selecting
0% 61%
1% to 25% 29%
26% to 50% 6%
51% to 100% 2%
More than 100% 2%
n 242 Source: Owner Final Survey
Nearly four in five participants had rentals that started at their home address (Table 61), which is generally where the Getaround listing is located. Seven percent indicated that a pickup had occurred at their place of work, and 3% indicated some other location. Some of these groupings overlap.
Table 61 Owner – Rental Pickup Locations Used
Location Percent of Respondents
My home address 79%
My workplace location 7%
Another place 3%
No rentals have occurred 17%
n 246 Source: Owner Final Survey
The large majority of those participating had rental requests at some point that they were not able to accommodate. Table 62 presents the percentage of respondents who selected each of a set of potential reasons for not accepting a rental request, organized from most to least common reason. The most commonly cited reasons were generally due to the inconvenience or inability to accept the rental. Over 75% indicated that they needed to use their car at a time when the rental was requested, while a third stated that the car was otherwise unavailable. Over half indicated that a request was not accepted because they did not get to it in time. Some respondents were also uncomfortable with requests or the requester: 18% simply stated they were not comfortable with the request, while 7% stated that a lack of ratings by the requester dissuaded them from accepting.
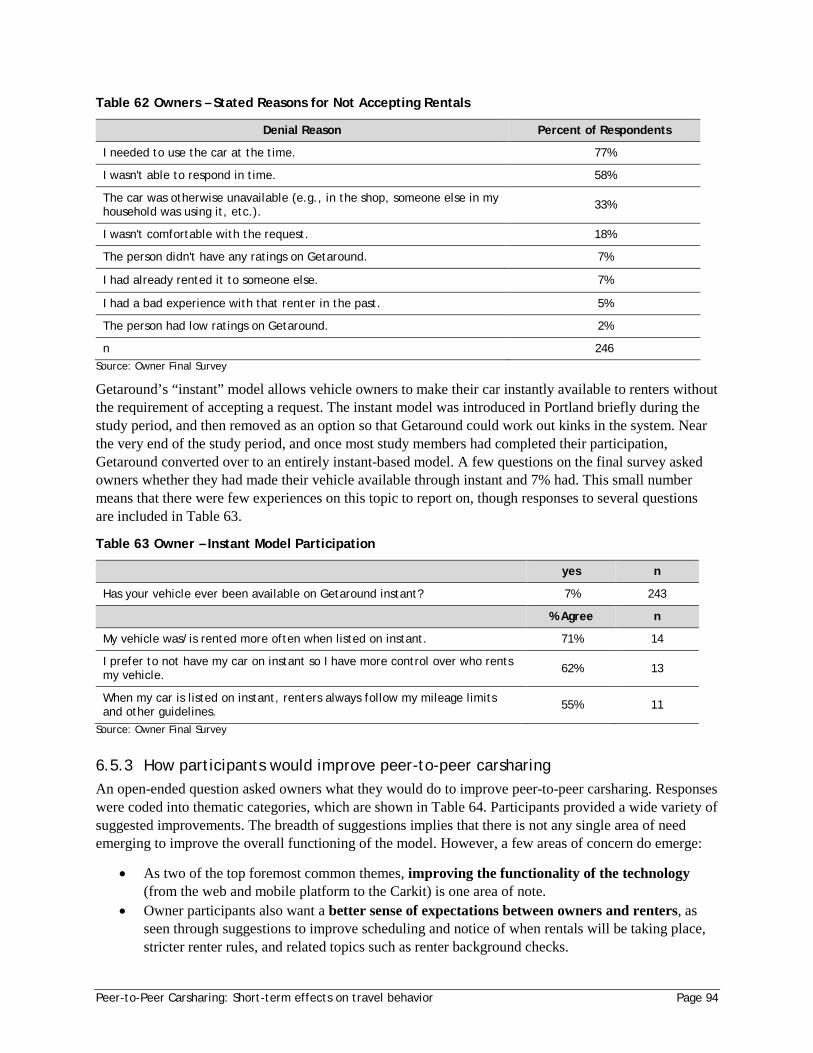
Peer-to-Peer Carsharing: Short-term effects on travel behavior Page 94
Table 62 Owners – Stated Reasons for Not Accepting Rentals
Denial Reason Percent of Respondents
I needed to use the car at the time. 77%
I wasn't able to respond in time. 58%
The car was otherwise unavailable (e.g., in the shop, someone else in my household was using it, etc.). 33%
I wasn't comfortable with the request. 18%
The person didn't have any ratings on Getaround. 7%
I had already rented it to someone else. 7%
I had a bad experience with that renter in the past. 5%
The person had low ratings on Getaround. 2%
n 246 Source: Owner Final Survey
Getaround’s “instant” model allows vehicle owners to make their car instantly available to renters without the requirement of accepting a request. The instant model was introduced in Portland briefly during the study period, and then removed as an option so that Getaround could work out kinks in the system. Near the very end of the study period, and once most study members had completed their participation, Getaround converted over to an entirely instant-based model. A few questions on the final survey asked owners whether they had made their vehicle available through instant and 7% had. This small number means that there were few experiences on this topic to report on, though responses to several questions are included in Table 63.
Table 63 Owner – Instant Model Participation
yes n
Has your vehicle ever been available on Getaround instant? 7% 243
% Agree n
My vehicle was/is rented more often when listed on instant. 71% 14
I prefer to not have my car on instant so I have more control over who rents my vehicle. 62% 13
When my car is listed on instant, renters always follow my mileage limits and other guidelines. 55% 11
Source: Owner Final Survey
6.5.3 How participants would improve peer-to-peer carsharing An open-ended question asked owners what they would do to improve peer-to-peer carsharing. Responses were coded into thematic categories, which are shown in Table 64. Participants provided a wide variety of suggested improvements. The breadth of suggestions implies that there is not any single area of need emerging to improve the overall functioning of the model. However, a few areas of concern do emerge:
• As two of the top foremost common themes, improving the functionality of the technology (from the web and mobile platform to the Carkit) is one area of note.
• Owner participants also want a better sense of expectations between owners and renters, as seen through suggestions to improve scheduling and notice of when rentals will be taking place, stricter renter rules, and related topics such as renter background checks.
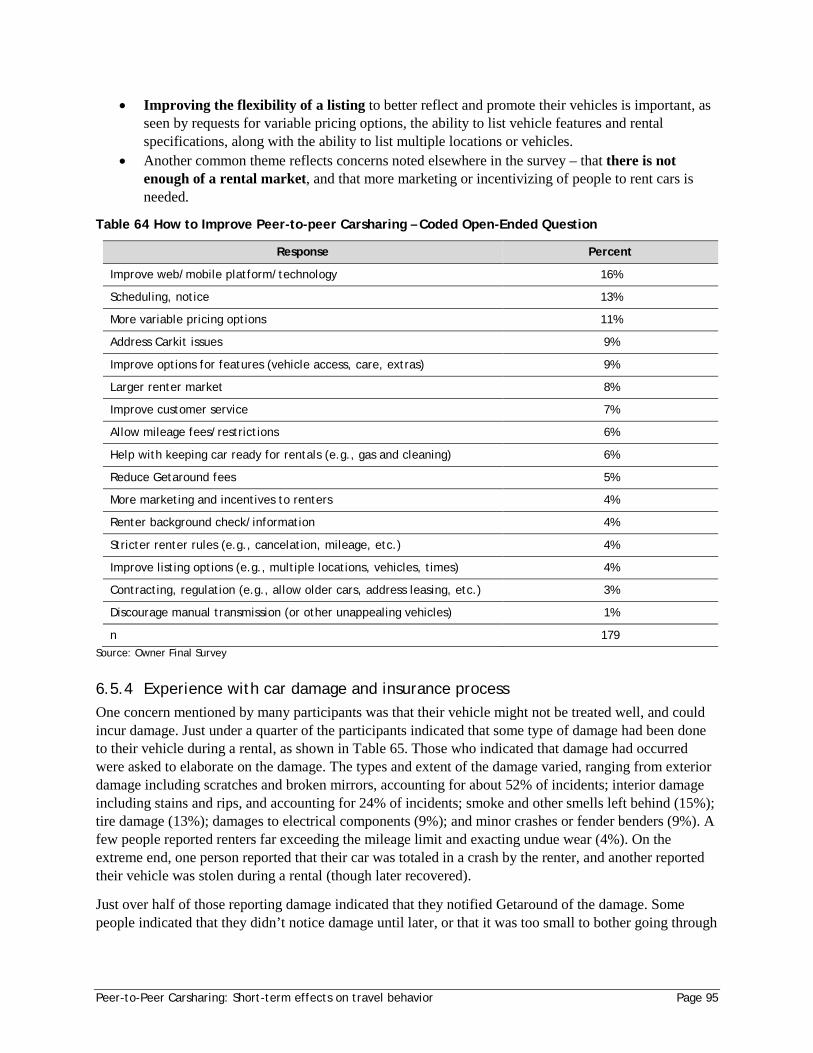
Peer-to-Peer Carsharing: Short-term effects on travel behavior Page 95
• Improving the flexibility of a listing to better reflect and promote their vehicles is important, as seen by requests for variable pricing options, the ability to list vehicle features and rental specifications, along with the ability to list multiple locations or vehicles.
• Another common theme reflects concerns noted elsewhere in the survey – that there is not enough of a rental market, and that more marketing or incentivizing of people to rent cars is needed.
Table 64 How to Improve Peer-to-peer Carsharing – Coded Open-Ended Question
Response Percent
Improve web/mobile platform/technology 16%
Scheduling, notice 13%
More variable pricing options 11%
Address Carkit issues 9%
Improve options for features (vehicle access, care, extras) 9%
Larger renter market 8%
Improve customer service 7%
Allow mileage fees/restrictions 6%
Help with keeping car ready for rentals (e.g., gas and cleaning) 6%
Reduce Getaround fees 5%
More marketing and incentives to renters 4%
Renter background check/information 4%
Stricter renter rules (e.g., cancelation, mileage, etc.) 4%
Improve listing options (e.g., multiple locations, vehicles, times) 4%
Contracting, regulation (e.g., allow older cars, address leasing, etc.) 3%
Discourage manual transmission (or other unappealing vehicles) 1%
n 179 Source: Owner Final Survey
6.5.4 Experience with car damage and insurance process One concern mentioned by many participants was that their vehicle might not be treated well, and could incur damage. Just under a quarter of the participants indicated that some type of damage had been done to their vehicle during a rental, as shown in Table 65. Those who indicated that damage had occurred were asked to elaborate on the damage. The types and extent of the damage varied, ranging from exterior damage including scratches and broken mirrors, accounting for about 52% of incidents; interior damage including stains and rips, and accounting for 24% of incidents; smoke and other smells left behind (15%); tire damage (13%); damages to electrical components (9%); and minor crashes or fender benders (9%). A few people reported renters far exceeding the mileage limit and exacting undue wear (4%). On the extreme end, one person reported that their car was totaled in a crash by the renter, and another reported their vehicle was stolen during a rental (though later recovered).
Just over half of those reporting damage indicated that they notified Getaround of the damage. Some people indicated that they didn’t notice damage until later, or that it was too small to bother going through
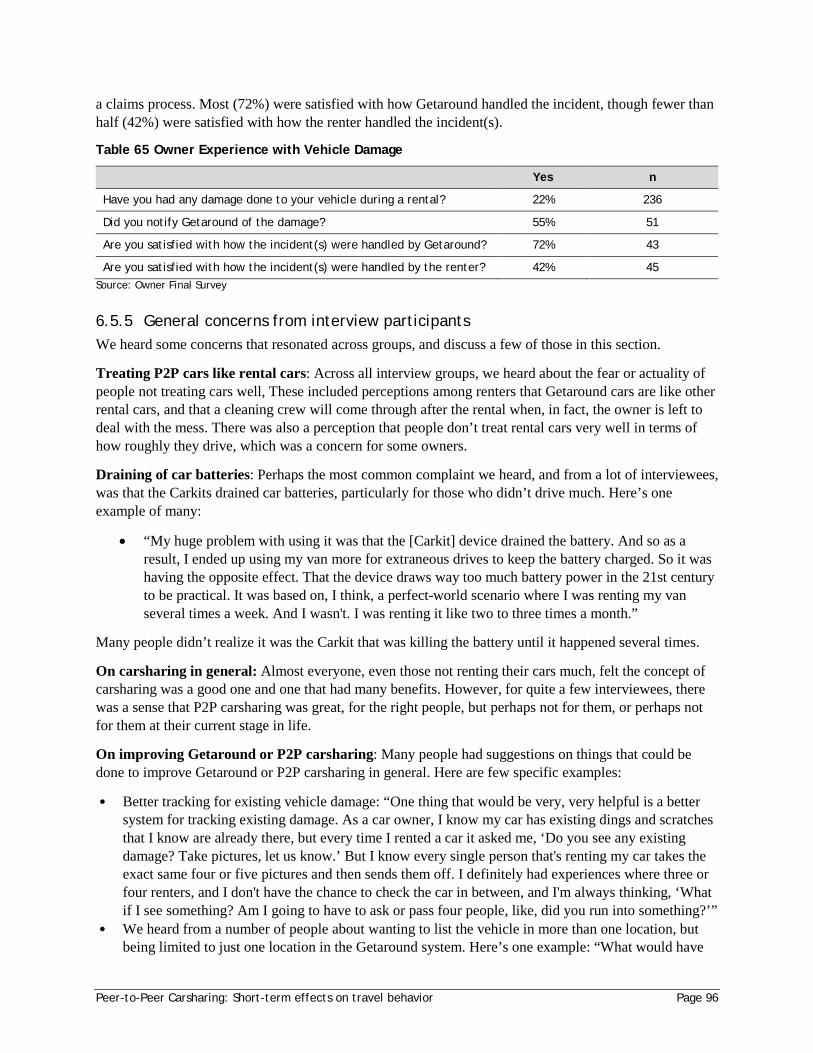
Peer-to-Peer Carsharing: Short-term effects on travel behavior Page 96
a claims process. Most (72%) were satisfied with how Getaround handled the incident, though fewer than half (42%) were satisfied with how the renter handled the incident(s).
Table 65 Owner Experience with Vehicle Damage
Yes n
Have you had any damage done to your vehicle during a rental? 22% 236
Did you notify Getaround of the damage? 55% 51
Are you satisfied with how the incident(s) were handled by Getaround? 72% 43
Are you satisfied with how the incident(s) were handled by the renter? 42% 45 Source: Owner Final Survey
6.5.5 General concerns from interview participants We heard some concerns that resonated across groups, and discuss a few of those in this section.
Treating P2P cars like rental cars: Across all interview groups, we heard about the fear or actuality of people not treating cars well, These included perceptions among renters that Getaround cars are like other rental cars, and that a cleaning crew will come through after the rental when, in fact, the owner is left to deal with the mess. There was also a perception that people don’t treat rental cars very well in terms of how roughly they drive, which was a concern for some owners.
Draining of car batteries: Perhaps the most common complaint we heard, and from a lot of interviewees, was that the Carkits drained car batteries, particularly for those who didn’t drive much. Here’s one example of many:
• “My huge problem with using it was that the [Carkit] device drained the battery. And so as a result, I ended up using my van more for extraneous drives to keep the battery charged. So it was having the opposite effect. That the device draws way too much battery power in the 21st century to be practical. It was based on, I think, a perfect-world scenario where I was renting my van several times a week. And I wasn't. I was renting it like two to three times a month.”
Many people didn’t realize it was the Carkit that was killing the battery until it happened several times.
On carsharing in general: Almost everyone, even those not renting their cars much, felt the concept of carsharing was a good one and one that had many benefits. However, for quite a few interviewees, there was a sense that P2P carsharing was great, for the right people, but perhaps not for them, or perhaps not for them at their current stage in life.
On improving Getaround or P2P carsharing: Many people had suggestions on things that could be done to improve Getaround or P2P carsharing in general. Here are few specific examples:
• Better tracking for existing vehicle damage: “One thing that would be very, very helpful is a better system for tracking existing damage. As a car owner, I know my car has existing dings and scratches that I know are already there, but every time I rented a car it asked me, ‘Do you see any existing damage? Take pictures, let us know.’ But I know every single person that's renting my car takes the exact same four or five pictures and then sends them off. I definitely had experiences where three or four renters, and I don't have the chance to check the car in between, and I'm always thinking, ‘What if I see something? Am I going to have to ask or pass four people, like, did you run into something?’”
• We heard from a number of people about wanting to list the vehicle in more than one location, but being limited to just one location in the Getaround system. Here’s one example: “What would have
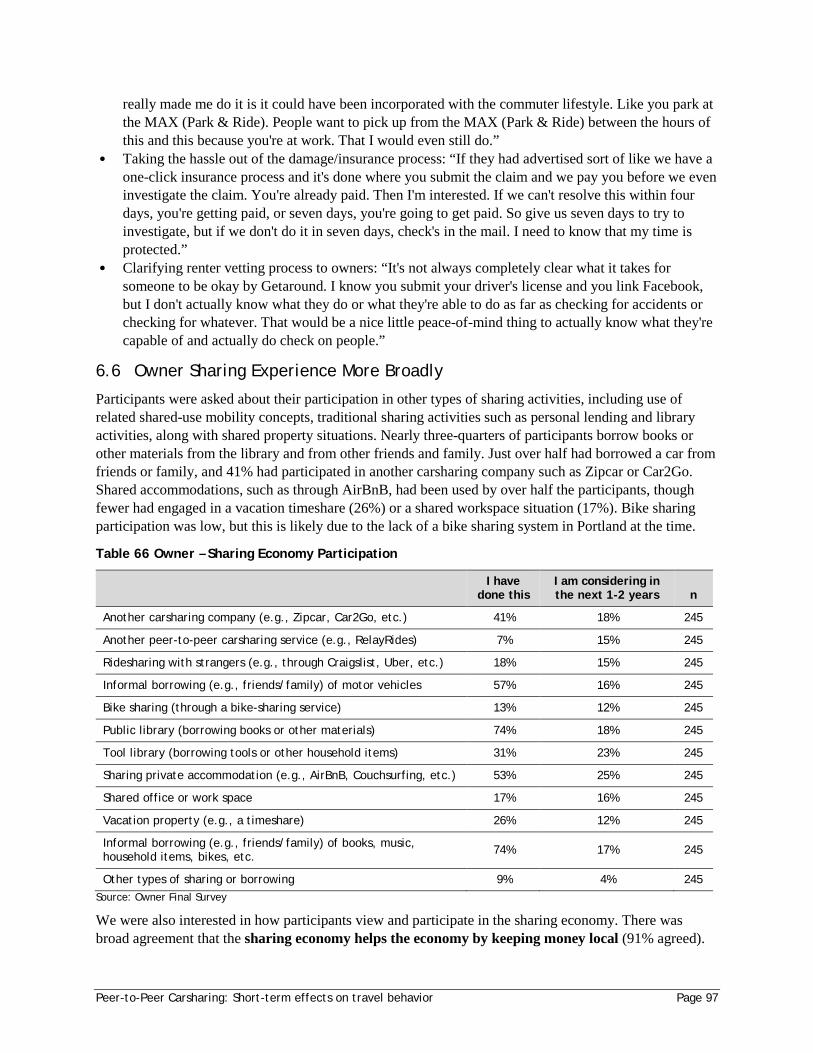
Peer-to-Peer Carsharing: Short-term effects on travel behavior Page 97
really made me do it is it could have been incorporated with the commuter lifestyle. Like you park at the MAX (Park & Ride). People want to pick up from the MAX (Park & Ride) between the hours of this and this because you're at work. That I would even still do.”
• Taking the hassle out of the damage/insurance process: “If they had advertised sort of like we have a one-click insurance process and it's done where you submit the claim and we pay you before we even investigate the claim. You're already paid. Then I'm interested. If we can't resolve this within four days, you're getting paid, or seven days, you're going to get paid. So give us seven days to try to investigate, but if we don't do it in seven days, check's in the mail. I need to know that my time is protected.”
• Clarifying renter vetting process to owners: “It's not always completely clear what it takes for someone to be okay by Getaround. I know you submit your driver's license and you link Facebook, but I don't actually know what they do or what they're able to do as far as checking for accidents or checking for whatever. That would be a nice little peace-of-mind thing to actually know what they're capable of and actually do check on people.”
6.6 Owner Sharing Experience More Broadly
Participants were asked about their participation in other types of sharing activities, including use of related shared-use mobility concepts, traditional sharing activities such as personal lending and library activities, along with shared property situations. Nearly three-quarters of participants borrow books or other materials from the library and from other friends and family. Just over half had borrowed a car from friends or family, and 41% had participated in another carsharing company such as Zipcar or Car2Go. Shared accommodations, such as through AirBnB, had been used by over half the participants, though fewer had engaged in a vacation timeshare (26%) or a shared workspace situation (17%). Bike sharing participation was low, but this is likely due to the lack of a bike sharing system in Portland at the time.
Table 66 Owner – Sharing Economy Participation
I have
done this I am considering in the next 1-2 years n
Another carsharing company (e.g., Zipcar, Car2Go, etc.) 41% 18% 245
Another peer-to-peer carsharing service (e.g., RelayRides) 7% 15% 245
Ridesharing with strangers (e.g., through Craigslist, Uber, etc.) 18% 15% 245
Informal borrowing (e.g., friends/family) of motor vehicles 57% 16% 245
Bike sharing (through a bike-sharing service) 13% 12% 245
Public library (borrowing books or other materials) 74% 18% 245
Tool library (borrowing tools or other household items) 31% 23% 245
Sharing private accommodation (e.g., AirBnB, Couchsurfing, etc.) 53% 25% 245
Shared office or work space 17% 16% 245
Vacation property (e.g., a timeshare) 26% 12% 245
Informal borrowing (e.g., friends/family) of books, music, household items, bikes, etc. 74% 17% 245
Other types of sharing or borrowing 9% 4% 245 Source: Owner Final Survey
We were also interested in how participants view and participate in the sharing economy. There was broad agreement that the sharing economy helps the economy by keeping money local (91% agreed).
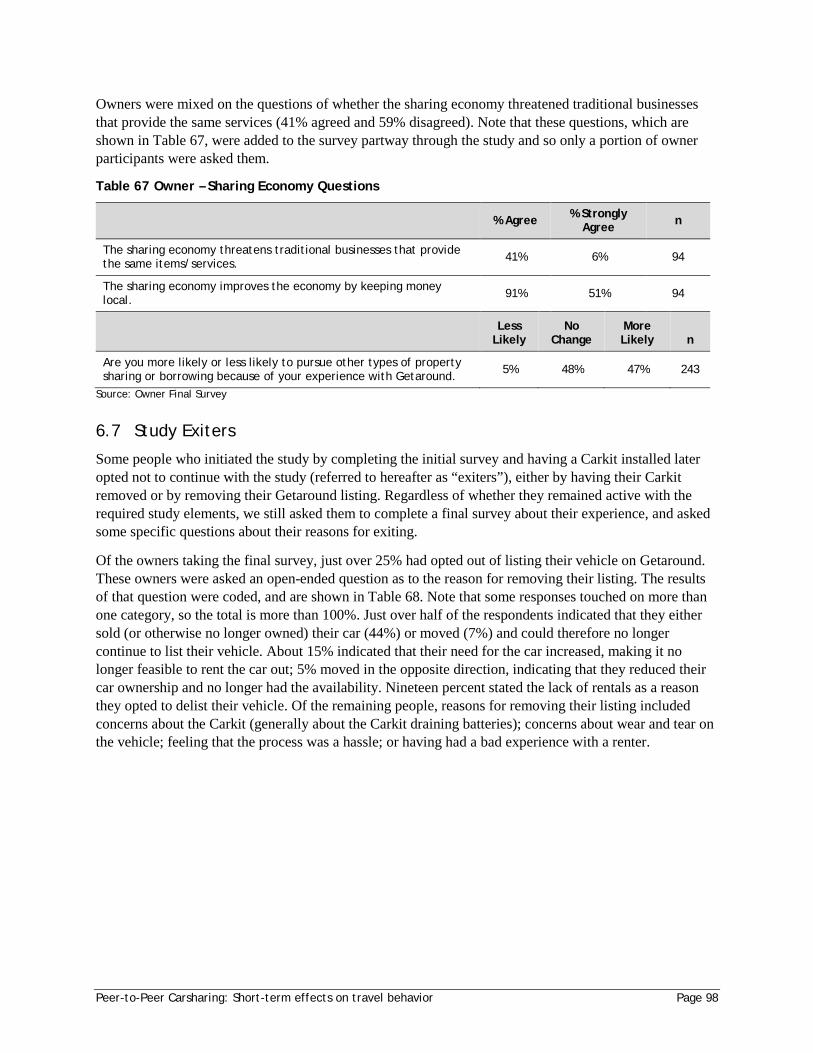
Peer-to-Peer Carsharing: Short-term effects on travel behavior Page 98
Owners were mixed on the questions of whether the sharing economy threatened traditional businesses that provide the same services (41% agreed and 59% disagreed). Note that these questions, which are shown in Table 67, were added to the survey partway through the study and so only a portion of owner participants were asked them.
Table 67 Owner – Sharing Economy Questions
% Agree % Strongly Agree n
The sharing economy threatens traditional businesses that provide the same items/services. 41% 6% 94
The sharing economy improves the economy by keeping money local. 91% 51% 94
Less
Likely No
Change More Likely n
Are you more likely or less likely to pursue other types of property sharing or borrowing because of your experience with Getaround. 5% 48% 47% 243
Source: Owner Final Survey
6.7 Study Exiters
Some people who initiated the study by completing the initial survey and having a Carkit installed later opted not to continue with the study (referred to hereafter as “exiters”), either by having their Carkit removed or by removing their Getaround listing. Regardless of whether they remained active with the required study elements, we still asked them to complete a final survey about their experience, and asked some specific questions about their reasons for exiting.
Of the owners taking the final survey, just over 25% had opted out of listing their vehicle on Getaround. These owners were asked an open-ended question as to the reason for removing their listing. The results of that question were coded, and are shown in Table 68. Note that some responses touched on more than one category, so the total is more than 100%. Just over half of the respondents indicated that they either sold (or otherwise no longer owned) their car (44%) or moved (7%) and could therefore no longer continue to list their vehicle. About 15% indicated that their need for the car increased, making it no longer feasible to rent the car out; 5% moved in the opposite direction, indicating that they reduced their car ownership and no longer had the availability. Nineteen percent stated the lack of rentals as a reason they opted to delist their vehicle. Of the remaining people, reasons for removing their listing included concerns about the Carkit (generally about the Carkit draining batteries); concerns about wear and tear on the vehicle; feeling that the process was a hassle; or having had a bad experience with a renter.
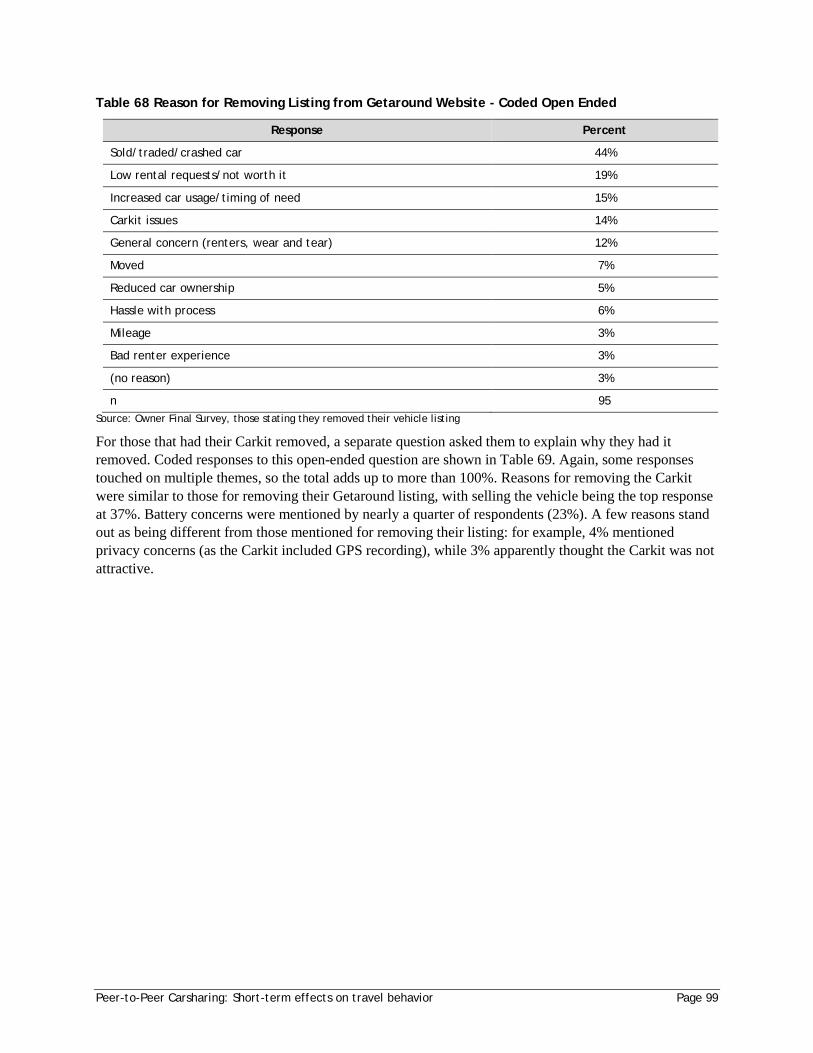
Peer-to-Peer Carsharing: Short-term effects on travel behavior Page 99
Table 68 Reason for Removing Listing from Getaround Website - Coded Open Ended
Response Percent
Sold/traded/crashed car 44%
Low rental requests/not worth it 19%
Increased car usage/timing of need 15%
Carkit issues 14%
General concern (renters, wear and tear) 12%
Moved 7%
Reduced car ownership 5%
Hassle with process 6%
Mileage 3%
Bad renter experience 3%
(no reason) 3%
n 95 Source: Owner Final Survey, those stating they removed their vehicle listing
For those that had their Carkit removed, a separate question asked them to explain why they had it removed. Coded responses to this open-ended question are shown in Table 69. Again, some responses touched on multiple themes, so the total adds up to more than 100%. Reasons for removing the Carkit were similar to those for removing their Getaround listing, with selling the vehicle being the top response at 37%. Battery concerns were mentioned by nearly a quarter of respondents (23%). A few reasons stand out as being different from those mentioned for removing their listing: for example, 4% mentioned privacy concerns (as the Carkit included GPS recording), while 3% apparently thought the Carkit was not attractive.
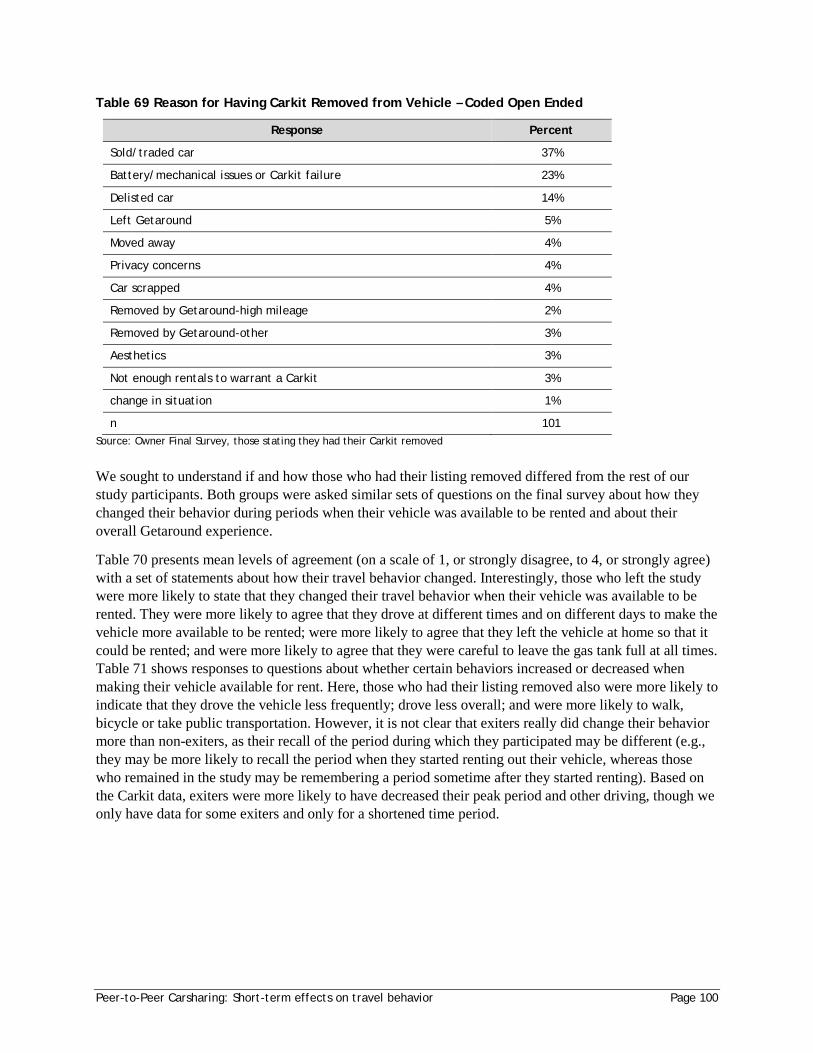
Peer-to-Peer Carsharing: Short-term effects on travel behavior Page 100
Table 69 Reason for Having Carkit Removed from Vehicle – Coded Open Ended
Response Percent
Sold/traded car 37%
Battery/mechanical issues or Carkit failure 23%
Delisted car 14%
Left Getaround 5%
Moved away 4%
Privacy concerns 4%
Car scrapped 4%
Removed by Getaround-high mileage 2%
Removed by Getaround-other 3%
Aesthetics 3%
Not enough rentals to warrant a Carkit 3%
change in situation 1%
n 101 Source: Owner Final Survey, those stating they had their Carkit removed
We sought to understand if and how those who had their listing removed differed from the rest of our study participants. Both groups were asked similar sets of questions on the final survey about how they changed their behavior during periods when their vehicle was available to be rented and about their overall Getaround experience.
Table 70 presents mean levels of agreement (on a scale of 1, or strongly disagree, to 4, or strongly agree) with a set of statements about how their travel behavior changed. Interestingly, those who left the study were more likely to state that they changed their travel behavior when their vehicle was available to be rented. They were more likely to agree that they drove at different times and on different days to make the vehicle more available to be rented; were more likely to agree that they left the vehicle at home so that it could be rented; and were more likely to agree that they were careful to leave the gas tank full at all times. Table 71 shows responses to questions about whether certain behaviors increased or decreased when making their vehicle available for rent. Here, those who had their listing removed also were more likely to indicate that they drove the vehicle less frequently; drove less overall; and were more likely to walk, bicycle or take public transportation. However, it is not clear that exiters really did change their behavior more than non-exiters, as their recall of the period during which they participated may be different (e.g., they may be more likely to recall the period when they started renting out their vehicle, whereas those who remained in the study may be remembering a period sometime after they started renting). Based on the Carkit data, exiters were more likely to have decreased their peak period and other driving, though we only have data for some exiters and only for a shortened time period.
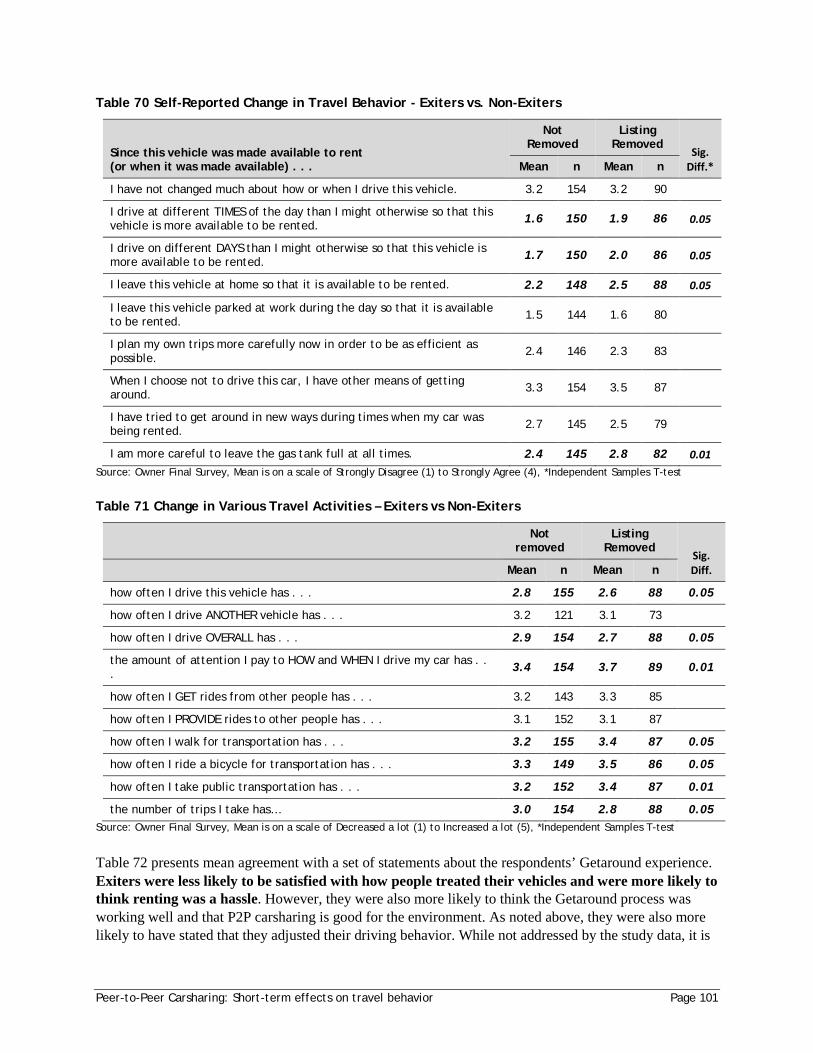
Peer-to-Peer Carsharing: Short-term effects on travel behavior Page 101
Table 70 Self-Reported Change in Travel Behavior - Exiters vs. Non-Exiters
Since this vehicle was made available to rent (or when it was made available) . . .
Not Removed
Listing Removed
Sig. Diff.* Mean n Mean n
I have not changed much about how or when I drive this vehicle. 3.2 154 3.2 90
I drive at different TIMES of the day than I might otherwise so that this vehicle is more available to be rented. 1.6 150 1.9 86 0.05
I drive on different DAYS than I might otherwise so that this vehicle is more available to be rented. 1.7 150 2.0 86 0.05
I leave this vehicle at home so that it is available to be rented. 2.2 148 2.5 88 0.05
I leave this vehicle parked at work during the day so that it is available to be rented. 1.5 144 1.6 80
I plan my own trips more carefully now in order to be as efficient as possible. 2.4 146 2.3 83
When I choose not to drive this car, I have other means of getting around. 3.3 154 3.5 87
I have tried to get around in new ways during times when my car was being rented. 2.7 145 2.5 79
I am more careful to leave the gas tank full at all times. 2.4 145 2.8 82 0.01 Source: Owner Final Survey, Mean is on a scale of Strongly Disagree (1) to Strongly Agree (4), *Independent Samples T-test
Table 71 Change in Various Travel Activities – Exiters vs Non-Exiters
Not removed
Listing Removed
Sig. Diff.
Mean n Mean n
how often I drive this vehicle has . . . 2.8 155 2.6 88 0.05
how often I drive ANOTHER vehicle has . . . 3.2 121 3.1 73
how often I drive OVERALL has . . . 2.9 154 2.7 88 0.05
the amount of attention I pay to HOW and WHEN I drive my car has . . . 3.4 154 3.7 89 0.01
how often I GET rides from other people has . . . 3.2 143 3.3 85
how often I PROVIDE rides to other people has . . . 3.1 152 3.1 87
how often I walk for transportation has . . . 3.2 155 3.4 87 0.05
how often I ride a bicycle for transportation has . . . 3.3 149 3.5 86 0.05
how often I take public transportation has . . . 3.2 152 3.4 87 0.01
the number of trips I take has… 3.0 154 2.8 88 0.05 Source: Owner Final Survey, Mean is on a scale of Decreased a lot (1) to Increased a lot (5), *Independent Samples T-test
Table 72 presents mean agreement with a set of statements about the respondents’ Getaround experience. Exiters were less likely to be satisfied with how people treated their vehicles and were more likely to think renting was a hassle. However, they were also more likely to think the Getaround process was working well and that P2P carsharing is good for the environment. As noted above, they were also more likely to have stated that they adjusted their driving behavior. While not addressed by the study data, it is
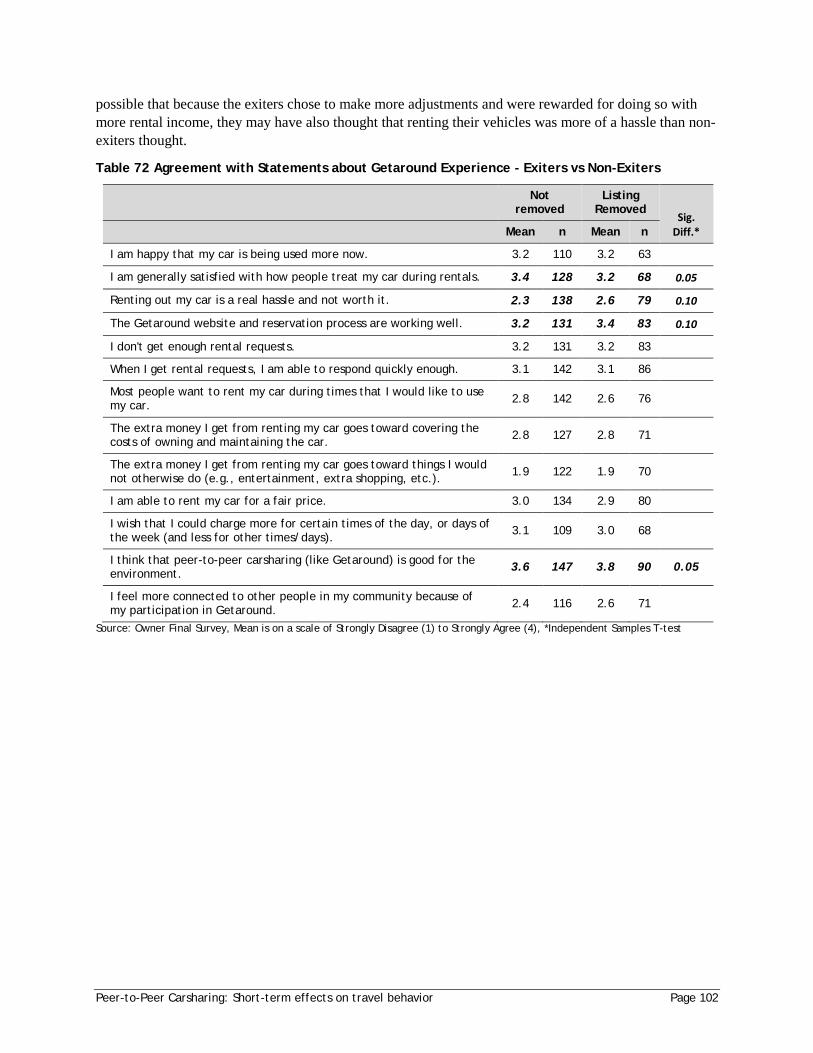
Peer-to-Peer Carsharing: Short-term effects on travel behavior Page 102
possible that because the exiters chose to make more adjustments and were rewarded for doing so with more rental income, they may have also thought that renting their vehicles was more of a hassle than non-exiters thought.
Table 72 Agreement with Statements about Getaround Experience - Exiters vs Non-Exiters
Not removed
Listing Removed
Sig. Diff.*
Mean n Mean n
I am happy that my car is being used more now. 3.2 110 3.2 63
I am generally satisfied with how people treat my car during rentals. 3.4 128 3.2 68 0.05
Renting out my car is a real hassle and not worth it. 2.3 138 2.6 79 0.10
The Getaround website and reservation process are working well. 3.2 131 3.4 83 0.10
I don't get enough rental requests. 3.2 131 3.2 83
When I get rental requests, I am able to respond quickly enough. 3.1 142 3.1 86
Most people want to rent my car during times that I would like to use my car. 2.8 142 2.6 76
The extra money I get from renting my car goes toward covering the costs of owning and maintaining the car. 2.8 127 2.8 71
The extra money I get from renting my car goes toward things I would not otherwise do (e.g., entertainment, extra shopping, etc.). 1.9 122 1.9 70
I am able to rent my car for a fair price. 3.0 134 2.9 80
I wish that I could charge more for certain times of the day, or days of the week (and less for other times/days). 3.1 109 3.0 68
I think that peer-to-peer carsharing (like Getaround) is good for the environment. 3.6 147 3.8 90 0.05
I feel more connected to other people in my community because of my participation in Getaround. 2.4 116 2.6 71
Source: Owner Final Survey, Mean is on a scale of Strongly Disagree (1) to Strongly Agree (4), *Independent Samples T-test
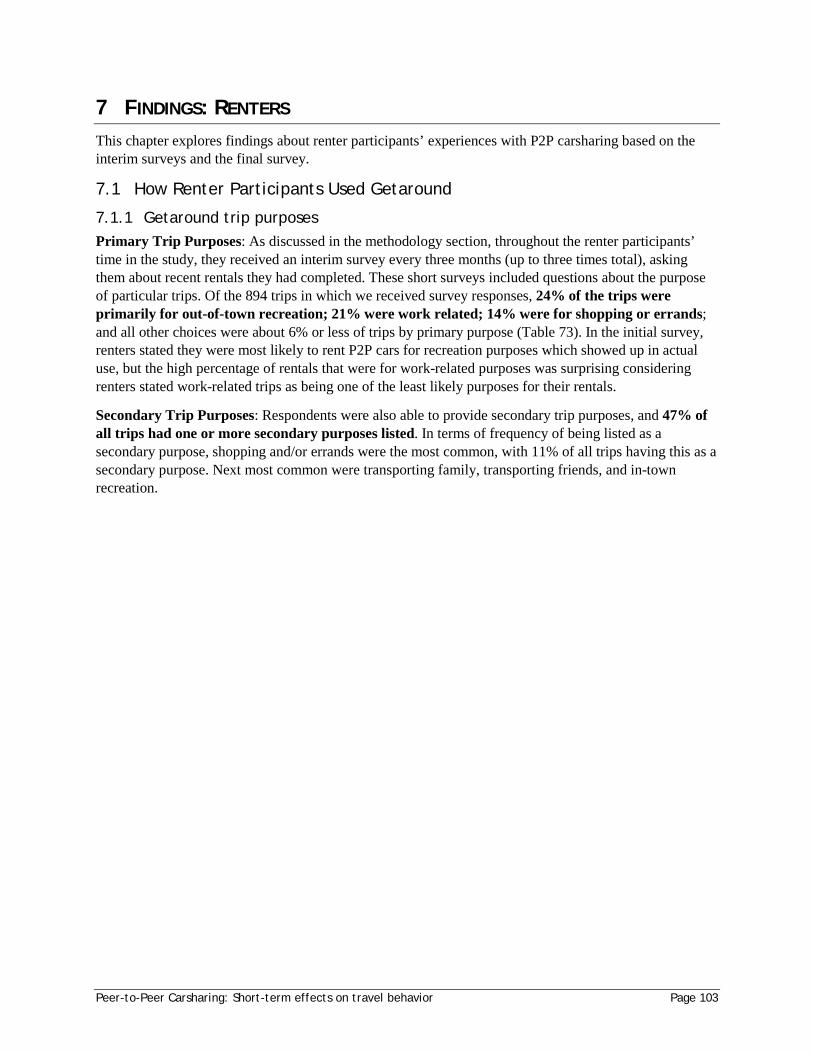
Peer-to-Peer Carsharing: Short-term effects on travel behavior Page 103
7 FINDINGS: RENTERS This chapter explores findings about renter participants’ experiences with P2P carsharing based on the interim surveys and the final survey.
7.1 How Renter Participants Used Getaround
7.1.1 Getaround trip purposes Primary Trip Purposes: As discussed in the methodology section, throughout the renter participants’ time in the study, they received an interim survey every three months (up to three times total), asking them about recent rentals they had completed. These short surveys included questions about the purpose of particular trips. Of the 894 trips in which we received survey responses, 24% of the trips were primarily for out-of-town recreation; 21% were work related; 14% were for shopping or errands; and all other choices were about 6% or less of trips by primary purpose (Table 73). In the initial survey, renters stated they were most likely to rent P2P cars for recreation purposes which showed up in actual use, but the high percentage of rentals that were for work-related purposes was surprising considering renters stated work-related trips as being one of the least likely purposes for their rentals.
Secondary Trip Purposes: Respondents were also able to provide secondary trip purposes, and 47% of all trips had one or more secondary purposes listed. In terms of frequency of being listed as a secondary purpose, shopping and/or errands were the most common, with 11% of all trips having this as a secondary purpose. Next most common were transporting family, transporting friends, and in-town recreation.
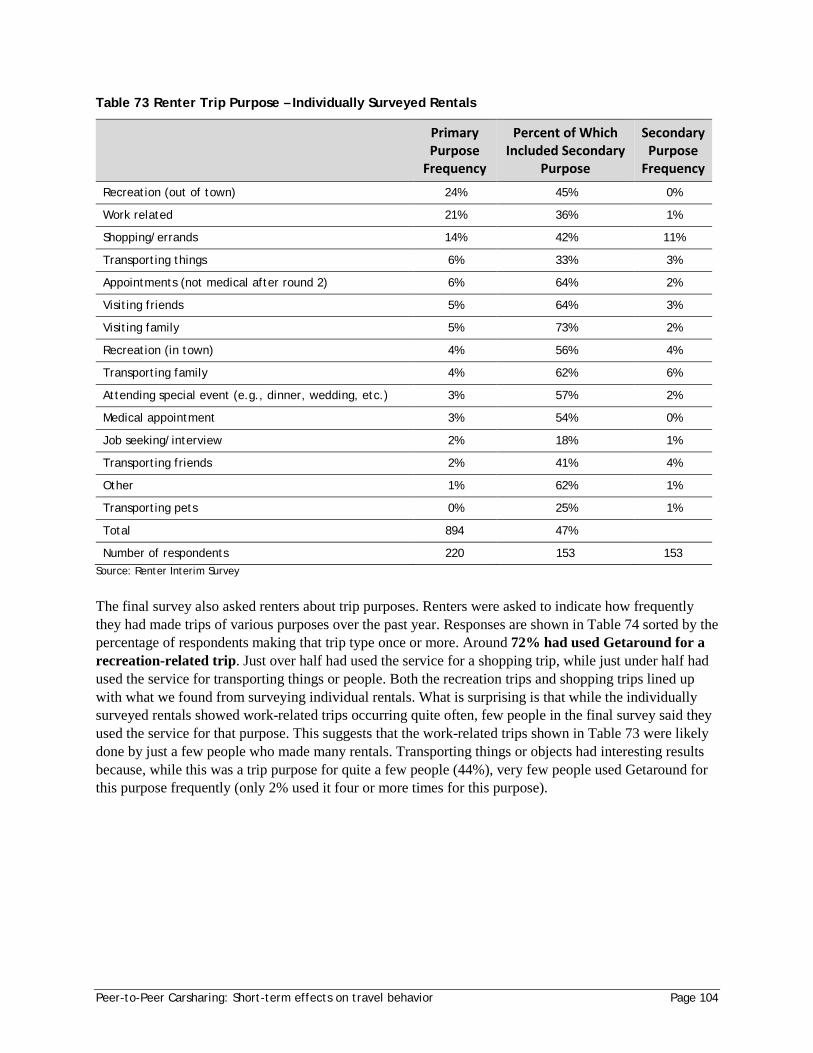
Peer-to-Peer Carsharing: Short-term effects on travel behavior Page 104
Table 73 Renter Trip Purpose – Individually Surveyed Rentals
Primary Purpose
Frequency
Percent of Which Included Secondary
Purpose
Secondary Purpose
Frequency
Recreation (out of town) 24% 45% 0%
Work related 21% 36% 1%
Shopping/errands 14% 42% 11%
Transporting things 6% 33% 3%
Appointments (not medical after round 2) 6% 64% 2%
Visiting friends 5% 64% 3%
Visiting family 5% 73% 2%
Recreation (in town) 4% 56% 4%
Transporting family 4% 62% 6%
Attending special event (e.g., dinner, wedding, etc.) 3% 57% 2%
Medical appointment 3% 54% 0%
Job seeking/interview 2% 18% 1%
Transporting friends 2% 41% 4%
Other 1% 62% 1%
Transporting pets 0% 25% 1%
Total 894 47%
Number of respondents 220 153 153 Source: Renter Interim Survey
The final survey also asked renters about trip purposes. Renters were asked to indicate how frequently they had made trips of various purposes over the past year. Responses are shown in Table 74 sorted by the percentage of respondents making that trip type once or more. Around 72% had used Getaround for a recreation-related trip. Just over half had used the service for a shopping trip, while just under half had used the service for transporting things or people. Both the recreation trips and shopping trips lined up with what we found from surveying individual rentals. What is surprising is that while the individually surveyed rentals showed work-related trips occurring quite often, few people in the final survey said they used the service for that purpose. This suggests that the work-related trips shown in Table 73 were likely done by just a few people who made many rentals. Transporting things or objects had interesting results because, while this was a trip purpose for quite a few people (44%), very few people used Getaround for this purpose frequently (only 2% used it four or more times for this purpose).
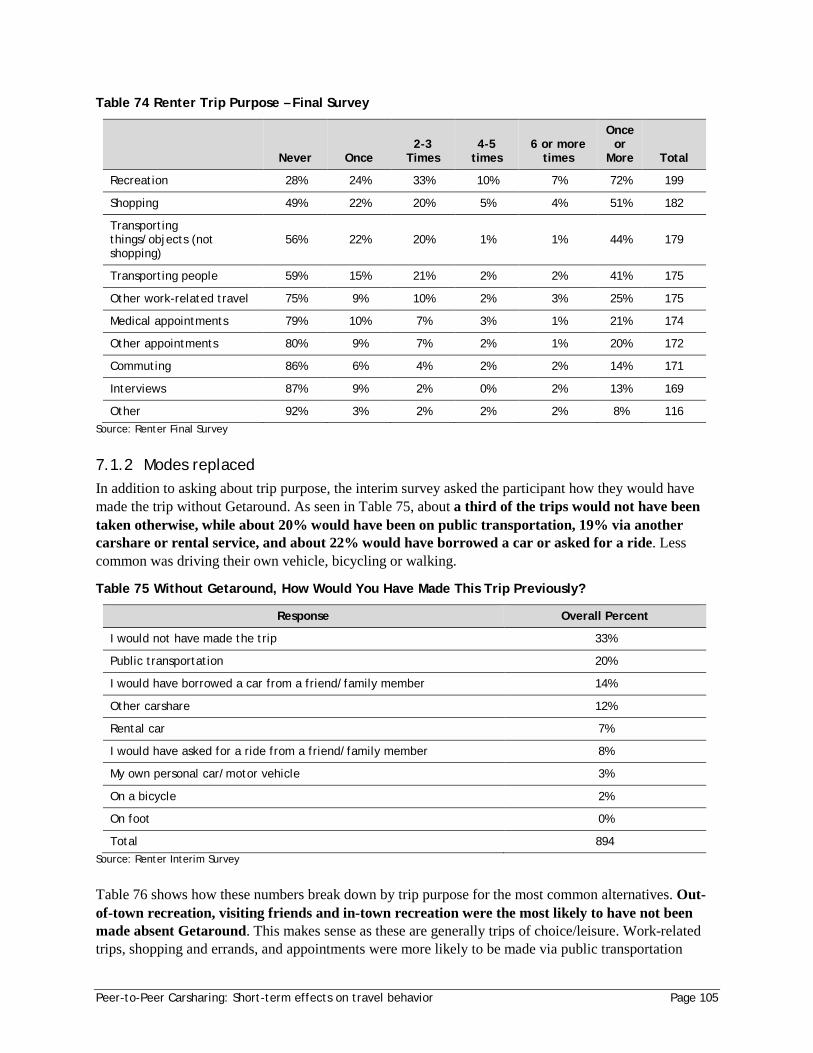
Peer-to-Peer Carsharing: Short-term effects on travel behavior Page 105
Table 74 Renter Trip Purpose – Final Survey
Never Once 2-3
Times 4-5
times 6 or more
times
Once or
More Total
Recreation 28% 24% 33% 10% 7% 72% 199
Shopping 49% 22% 20% 5% 4% 51% 182
Transporting things/objects (not shopping)
56% 22% 20% 1% 1% 44% 179
Transporting people 59% 15% 21% 2% 2% 41% 175
Other work-related travel 75% 9% 10% 2% 3% 25% 175
Medical appointments 79% 10% 7% 3% 1% 21% 174
Other appointments 80% 9% 7% 2% 1% 20% 172
Commuting 86% 6% 4% 2% 2% 14% 171
Interviews 87% 9% 2% 0% 2% 13% 169
Other 92% 3% 2% 2% 2% 8% 116 Source: Renter Final Survey
7.1.2 Modes replaced In addition to asking about trip purpose, the interim survey asked the participant how they would have made the trip without Getaround. As seen in Table 75, about a third of the trips would not have been taken otherwise, while about 20% would have been on public transportation, 19% via another carshare or rental service, and about 22% would have borrowed a car or asked for a ride. Less common was driving their own vehicle, bicycling or walking.
Table 75 Without Getaround, How Would You Have Made This Trip Previously?
Response Overall Percent
I would not have made the trip 33%
Public transportation 20%
I would have borrowed a car from a friend/family member 14%
Other carshare 12%
Rental car 7%
I would have asked for a ride from a friend/family member 8%
My own personal car/motor vehicle 3%
On a bicycle 2%
On foot 0%
Total 894 Source: Renter Interim Survey
Table 76 shows how these numbers break down by trip purpose for the most common alternatives. Out-of-town recreation, visiting friends and in-town recreation were the most likely to have not been made absent Getaround. This makes sense as these are generally trips of choice/leisure. Work-related trips, shopping and errands, and appointments were more likely to be made via public transportation
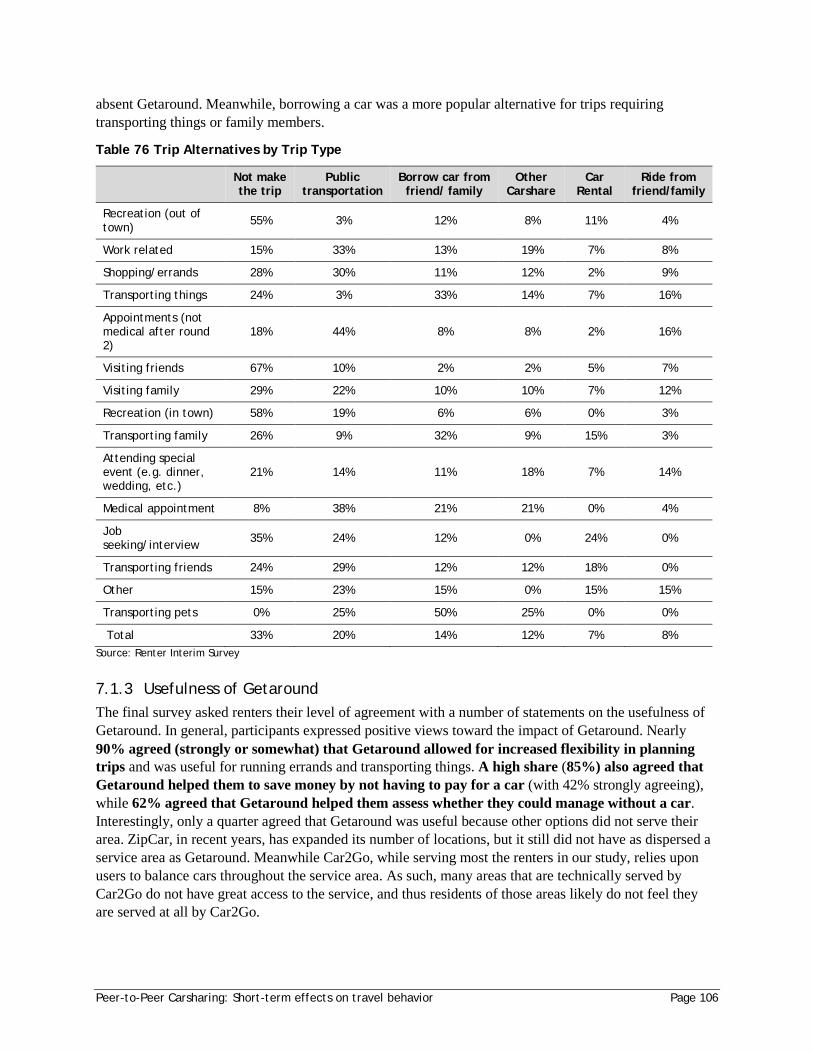
Peer-to-Peer Carsharing: Short-term effects on travel behavior Page 106
absent Getaround. Meanwhile, borrowing a car was a more popular alternative for trips requiring transporting things or family members.
Table 76 Trip Alternatives by Trip Type
Not make the trip
Public transportation
Borrow car from friend/ family
Other Carshare
Car Rental
Ride from friend/family
Recreation (out of town) 55% 3% 12% 8% 11% 4%
Work related 15% 33% 13% 19% 7% 8%
Shopping/errands 28% 30% 11% 12% 2% 9%
Transporting things 24% 3% 33% 14% 7% 16%
Appointments (not medical after round 2)
18% 44% 8% 8% 2% 16%
Visiting friends 67% 10% 2% 2% 5% 7%
Visiting family 29% 22% 10% 10% 7% 12%
Recreation (in town) 58% 19% 6% 6% 0% 3%
Transporting family 26% 9% 32% 9% 15% 3%
Attending special event (e.g. dinner, wedding, etc.)
21% 14% 11% 18% 7% 14%
Medical appointment 8% 38% 21% 21% 0% 4%
Job seeking/interview 35% 24% 12% 0% 24% 0%
Transporting friends 24% 29% 12% 12% 18% 0%
Other 15% 23% 15% 0% 15% 15%
Transporting pets 0% 25% 50% 25% 0% 0%
Total 33% 20% 14% 12% 7% 8% Source: Renter Interim Survey
7.1.3 Usefulness of Getaround The final survey asked renters their level of agreement with a number of statements on the usefulness of Getaround. In general, participants expressed positive views toward the impact of Getaround. Nearly 90% agreed (strongly or somewhat) that Getaround allowed for increased flexibility in planning trips and was useful for running errands and transporting things. A high share (85%) also agreed that Getaround helped them to save money by not having to pay for a car (with 42% strongly agreeing), while 62% agreed that Getaround helped them assess whether they could manage without a car. Interestingly, only a quarter agreed that Getaround was useful because other options did not serve their area. ZipCar, in recent years, has expanded its number of locations, but it still did not have as dispersed a service area as Getaround. Meanwhile Car2Go, while serving most the renters in our study, relies upon users to balance cars throughout the service area. As such, many areas that are technically served by Car2Go do not have great access to the service, and thus residents of those areas likely do not feel they are served at all by Car2Go.
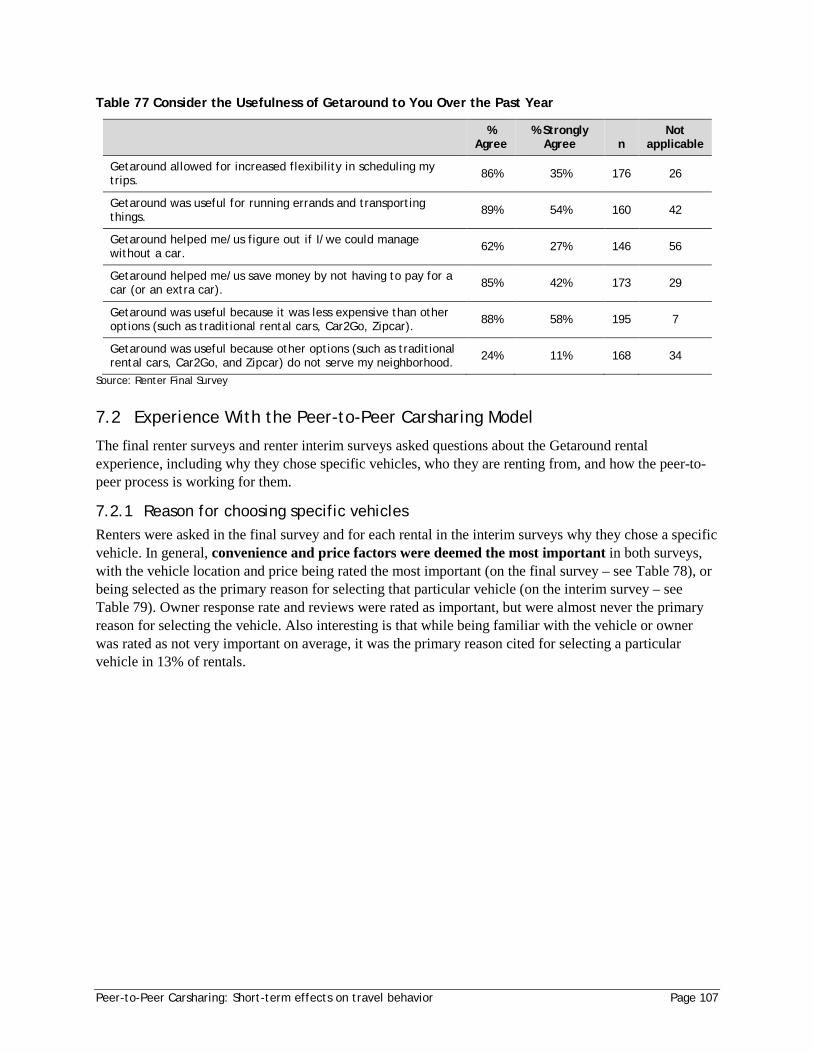
Peer-to-Peer Carsharing: Short-term effects on travel behavior Page 107
Table 77 Consider the Usefulness of Getaround to You Over the Past Year
%
Agree % Strongly
Agree n Not
applicable
Getaround allowed for increased flexibility in scheduling my trips. 86% 35% 176 26
Getaround was useful for running errands and transporting things. 89% 54% 160 42
Getaround helped me/us figure out if I/we could manage without a car. 62% 27% 146 56
Getaround helped me/us save money by not having to pay for a car (or an extra car). 85% 42% 173 29
Getaround was useful because it was less expensive than other options (such as traditional rental cars, Car2Go, Zipcar). 88% 58% 195 7
Getaround was useful because other options (such as traditional rental cars, Car2Go, and Zipcar) do not serve my neighborhood. 24% 11% 168 34
Source: Renter Final Survey
7.2 Experience With the Peer-to-Peer Carsharing Model
The final renter surveys and renter interim surveys asked questions about the Getaround rental experience, including why they chose specific vehicles, who they are renting from, and how the peer-to-peer process is working for them.
7.2.1 Reason for choosing specific vehicles Renters were asked in the final survey and for each rental in the interim surveys why they chose a specific vehicle. In general, convenience and price factors were deemed the most important in both surveys, with the vehicle location and price being rated the most important (on the final survey – see Table 78), or being selected as the primary reason for selecting that particular vehicle (on the interim survey – see Table 79). Owner response rate and reviews were rated as important, but were almost never the primary reason for selecting the vehicle. Also interesting is that while being familiar with the vehicle or owner was rated as not very important on average, it was the primary reason cited for selecting a particular vehicle in 13% of rentals.
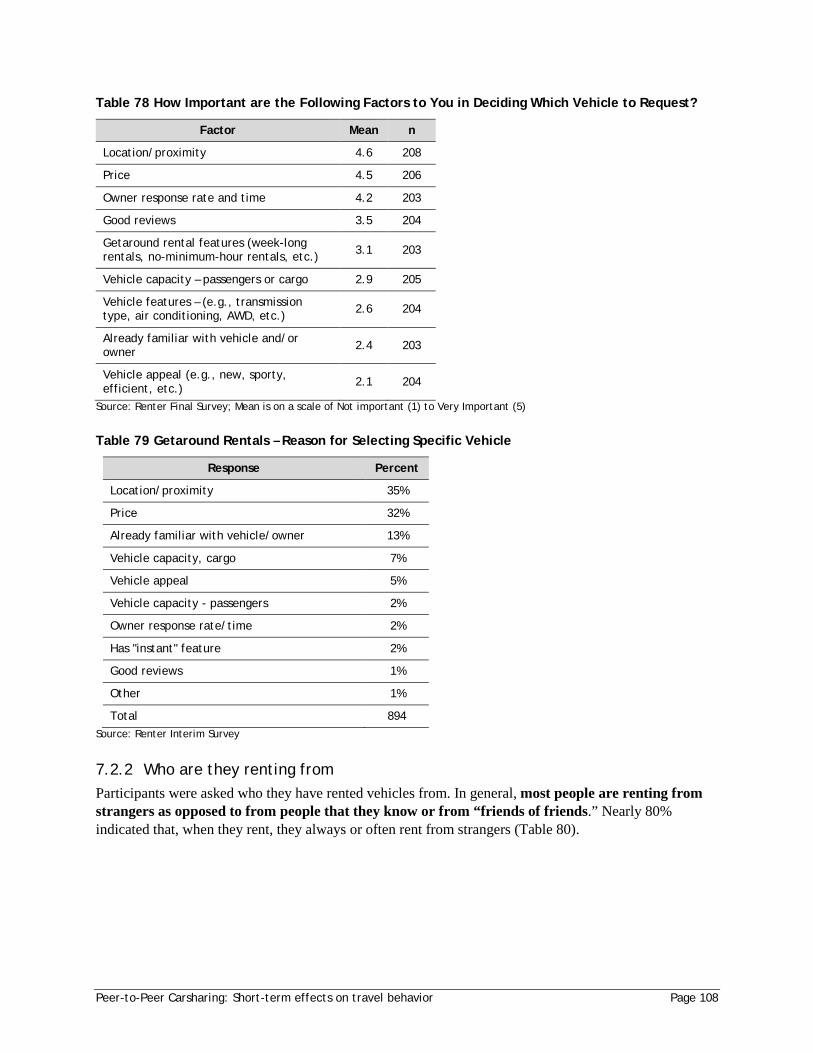
Peer-to-Peer Carsharing: Short-term effects on travel behavior Page 108
Table 78 How Important are the Following Factors to You in Deciding Which Vehicle to Request?
Factor Mean n
Location/proximity 4.6 208
Price 4.5 206
Owner response rate and time 4.2 203
Good reviews 3.5 204
Getaround rental features (week-long rentals, no-minimum-hour rentals, etc.) 3.1 203
Vehicle capacity – passengers or cargo 2.9 205
Vehicle features – (e.g., transmission type, air conditioning, AWD, etc.) 2.6 204
Already familiar with vehicle and/or owner 2.4 203
Vehicle appeal (e.g., new, sporty, efficient, etc.) 2.1 204
Source: Renter Final Survey; Mean is on a scale of Not important (1) to Very Important (5)
Table 79 Getaround Rentals – Reason for Selecting Specific Vehicle
Response Percent
Location/proximity 35%
Price 32%
Already familiar with vehicle/owner 13%
Vehicle capacity, cargo 7%
Vehicle appeal 5%
Vehicle capacity - passengers 2%
Owner response rate/time 2%
Has "instant" feature 2%
Good reviews 1%
Other 1%
Total 894 Source: Renter Interim Survey
7.2.2 Who are they renting from Participants were asked who they have rented vehicles from. In general, most people are renting from strangers as opposed to from people that they know or from “friends of friends.” Nearly 80% indicated that, when they rent, they always or often rent from strangers (Table 80).
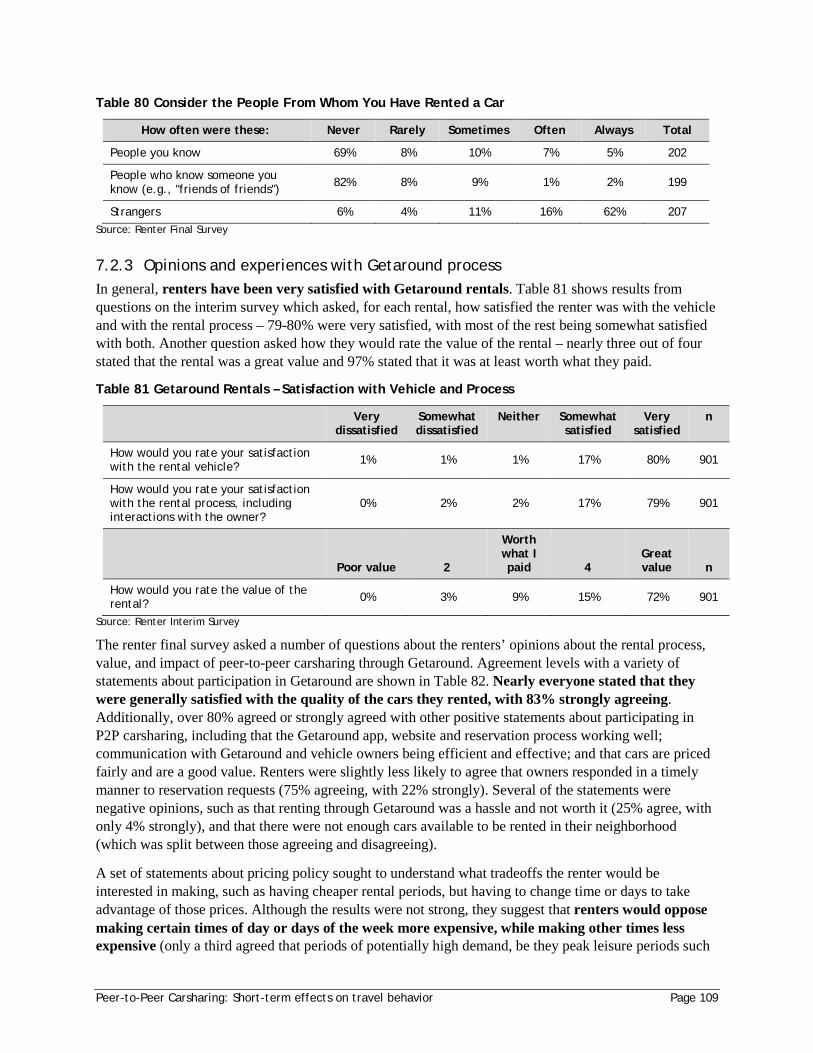
Peer-to-Peer Carsharing: Short-term effects on travel behavior Page 109
Table 80 Consider the People From Whom You Have Rented a Car
How often were these: Never Rarely Sometimes Often Always Total
People you know 69% 8% 10% 7% 5% 202
People who know someone you know (e.g., "friends of friends") 82% 8% 9% 1% 2% 199
Strangers 6% 4% 11% 16% 62% 207 Source: Renter Final Survey
7.2.3 Opinions and experiences with Getaround process In general, renters have been very satisfied with Getaround rentals. Table 81 shows results from questions on the interim survey which asked, for each rental, how satisfied the renter was with the vehicle and with the rental process – 79-80% were very satisfied, with most of the rest being somewhat satisfied with both. Another question asked how they would rate the value of the rental – nearly three out of four stated that the rental was a great value and 97% stated that it was at least worth what they paid.
Table 81 Getaround Rentals – Satisfaction with Vehicle and Process
Very
dissatisfied Somewhat dissatisfied
Neither Somewhat satisfied
Very satisfied
n
How would you rate your satisfaction with the rental vehicle? 1% 1% 1% 17% 80% 901
How would you rate your satisfaction with the rental process, including interactions with the owner?
0% 2% 2% 17% 79% 901
Poor value 2
Worth what I paid 4
Great value n
How would you rate the value of the rental? 0% 3% 9% 15% 72% 901
Source: Renter Interim Survey
The renter final survey asked a number of questions about the renters’ opinions about the rental process, value, and impact of peer-to-peer carsharing through Getaround. Agreement levels with a variety of statements about participation in Getaround are shown in Table 82. Nearly everyone stated that they were generally satisfied with the quality of the cars they rented, with 83% strongly agreeing. Additionally, over 80% agreed or strongly agreed with other positive statements about participating in P2P carsharing, including that the Getaround app, website and reservation process working well; communication with Getaround and vehicle owners being efficient and effective; and that cars are priced fairly and are a good value. Renters were slightly less likely to agree that owners responded in a timely manner to reservation requests (75% agreeing, with 22% strongly). Several of the statements were negative opinions, such as that renting through Getaround was a hassle and not worth it (25% agree, with only 4% strongly), and that there were not enough cars available to be rented in their neighborhood (which was split between those agreeing and disagreeing).
A set of statements about pricing policy sought to understand what tradeoffs the renter would be interested in making, such as having cheaper rental periods, but having to change time or days to take advantage of those prices. Although the results were not strong, they suggest that renters would oppose making certain times of day or days of the week more expensive, while making other times less expensive (only a third agreed that periods of potentially high demand, be they peak leisure periods such
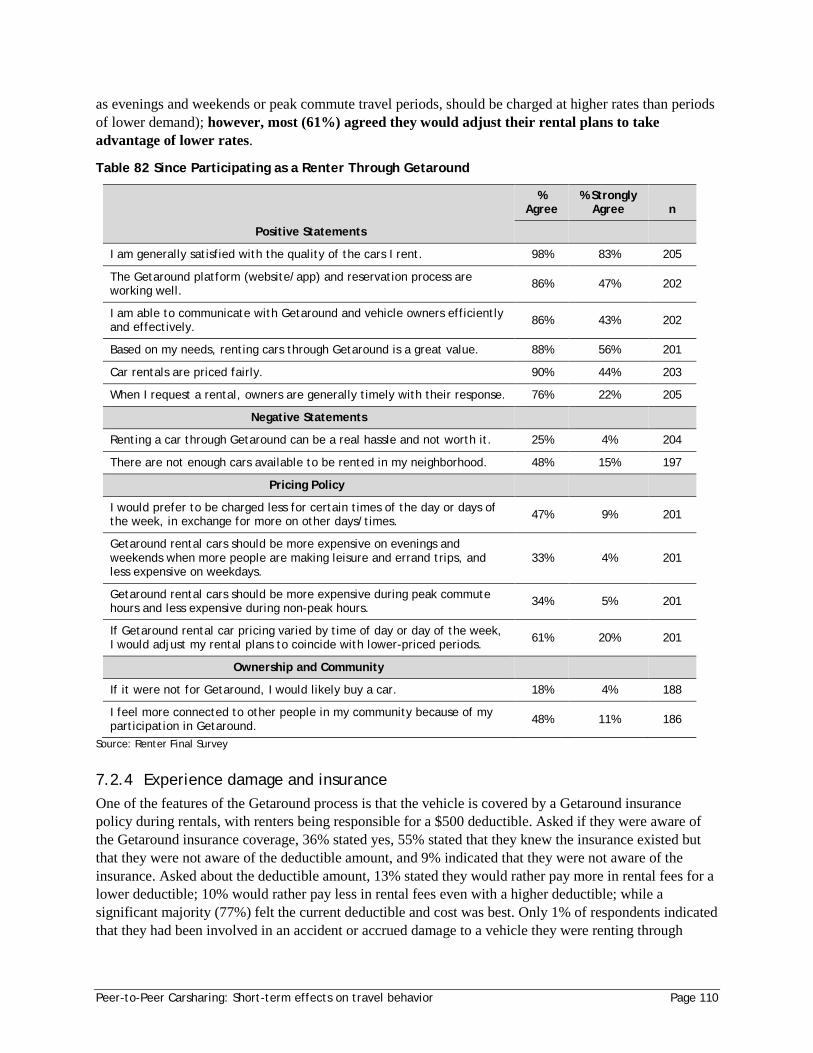
Peer-to-Peer Carsharing: Short-term effects on travel behavior Page 110
as evenings and weekends or peak commute travel periods, should be charged at higher rates than periods of lower demand); however, most (61%) agreed they would adjust their rental plans to take advantage of lower rates.
Table 82 Since Participating as a Renter Through Getaround
Positive Statements
% Agree
% Strongly Agree n
I am generally satisfied with the quality of the cars I rent. 98% 83% 205
The Getaround platform (website/app) and reservation process are working well. 86% 47% 202
I am able to communicate with Getaround and vehicle owners efficiently and effectively. 86% 43% 202
Based on my needs, renting cars through Getaround is a great value. 88% 56% 201
Car rentals are priced fairly. 90% 44% 203
When I request a rental, owners are generally timely with their response. 76% 22% 205
Negative Statements
Renting a car through Getaround can be a real hassle and not worth it. 25% 4% 204
There are not enough cars available to be rented in my neighborhood. 48% 15% 197
Pricing Policy
I would prefer to be charged less for certain times of the day or days of the week, in exchange for more on other days/times. 47% 9% 201
Getaround rental cars should be more expensive on evenings and weekends when more people are making leisure and errand trips, and less expensive on weekdays.
33% 4% 201
Getaround rental cars should be more expensive during peak commute hours and less expensive during non-peak hours. 34% 5% 201
If Getaround rental car pricing varied by time of day or day of the week, I would adjust my rental plans to coincide with lower-priced periods. 61% 20% 201
Ownership and Community
If it were not for Getaround, I would likely buy a car. 18% 4% 188
I feel more connected to other people in my community because of my participation in Getaround. 48% 11% 186
Source: Renter Final Survey
7.2.4 Experience damage and insurance One of the features of the Getaround process is that the vehicle is covered by a Getaround insurance policy during rentals, with renters being responsible for a $500 deductible. Asked if they were aware of the Getaround insurance coverage, 36% stated yes, 55% stated that they knew the insurance existed but that they were not aware of the deductible amount, and 9% indicated that they were not aware of the insurance. Asked about the deductible amount, 13% stated they would rather pay more in rental fees for a lower deductible; 10% would rather pay less in rental fees even with a higher deductible; while a significant majority (77%) felt the current deductible and cost was best. Only 1% of respondents indicated that they had been involved in an accident or accrued damage to a vehicle they were renting through
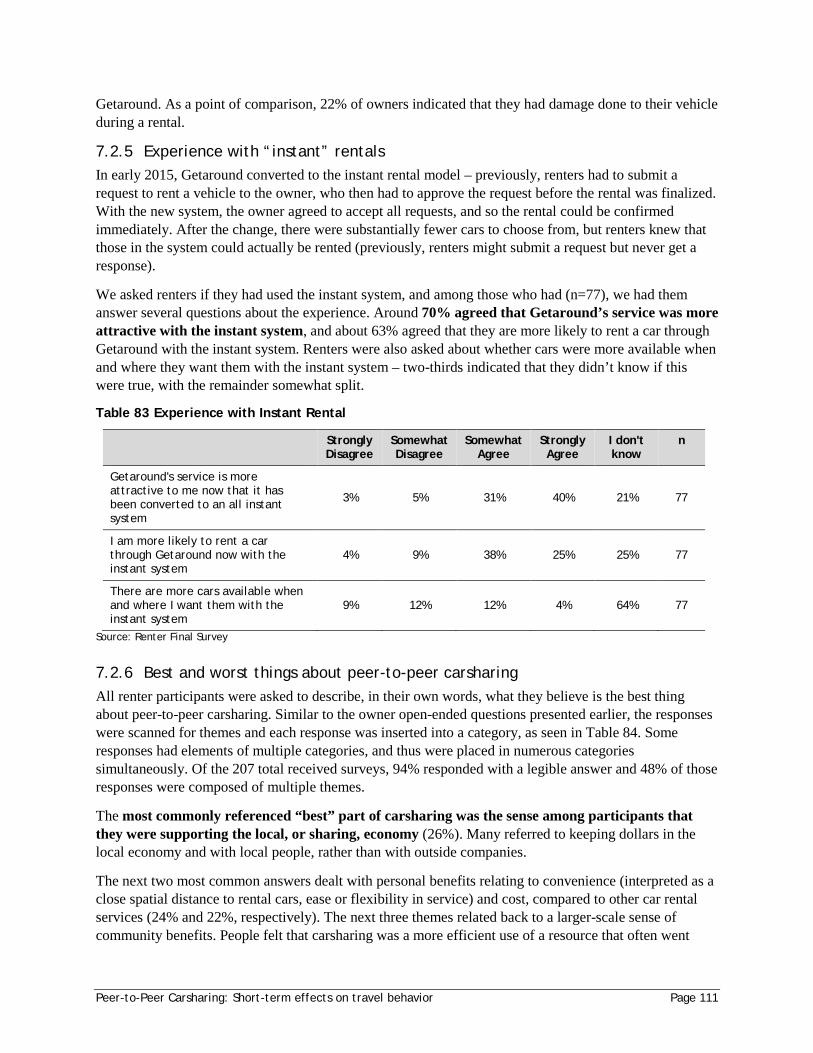
Peer-to-Peer Carsharing: Short-term effects on travel behavior Page 111
Getaround. As a point of comparison, 22% of owners indicated that they had damage done to their vehicle during a rental.
7.2.5 Experience with “instant” rentals In early 2015, Getaround converted to the instant rental model – previously, renters had to submit a request to rent a vehicle to the owner, who then had to approve the request before the rental was finalized. With the new system, the owner agreed to accept all requests, and so the rental could be confirmed immediately. After the change, there were substantially fewer cars to choose from, but renters knew that those in the system could actually be rented (previously, renters might submit a request but never get a response).
We asked renters if they had used the instant system, and among those who had (n=77), we had them answer several questions about the experience. Around 70% agreed that Getaround’s service was more attractive with the instant system, and about 63% agreed that they are more likely to rent a car through Getaround with the instant system. Renters were also asked about whether cars were more available when and where they want them with the instant system – two-thirds indicated that they didn’t know if this were true, with the remainder somewhat split.
Table 83 Experience with Instant Rental
Strongly Disagree
Somewhat Disagree
Somewhat Agree
Strongly Agree
I don't know
n
Getaround's service is more attractive to me now that it has been converted to an all instant system
3% 5% 31% 40% 21% 77
I am more likely to rent a car through Getaround now with the instant system
4% 9% 38% 25% 25% 77
There are more cars available when and where I want them with the instant system
9% 12% 12% 4% 64% 77
Source: Renter Final Survey
7.2.6 Best and worst things about peer-to-peer carsharing All renter participants were asked to describe, in their own words, what they believe is the best thing about peer-to-peer carsharing. Similar to the owner open-ended questions presented earlier, the responses were scanned for themes and each response was inserted into a category, as seen in Table 84. Some responses had elements of multiple categories, and thus were placed in numerous categories simultaneously. Of the 207 total received surveys, 94% responded with a legible answer and 48% of those responses were composed of multiple themes.
The most commonly referenced “best” part of carsharing was the sense among participants that they were supporting the local, or sharing, economy (26%). Many referred to keeping dollars in the local economy and with local people, rather than with outside companies.
The next two most common answers dealt with personal benefits relating to convenience (interpreted as a close spatial distance to rental cars, ease or flexibility in service) and cost, compared to other car rental services (24% and 22%, respectively). The next three themes related back to a larger-scale sense of community benefits. People felt that carsharing was a more efficient use of a resource that often went
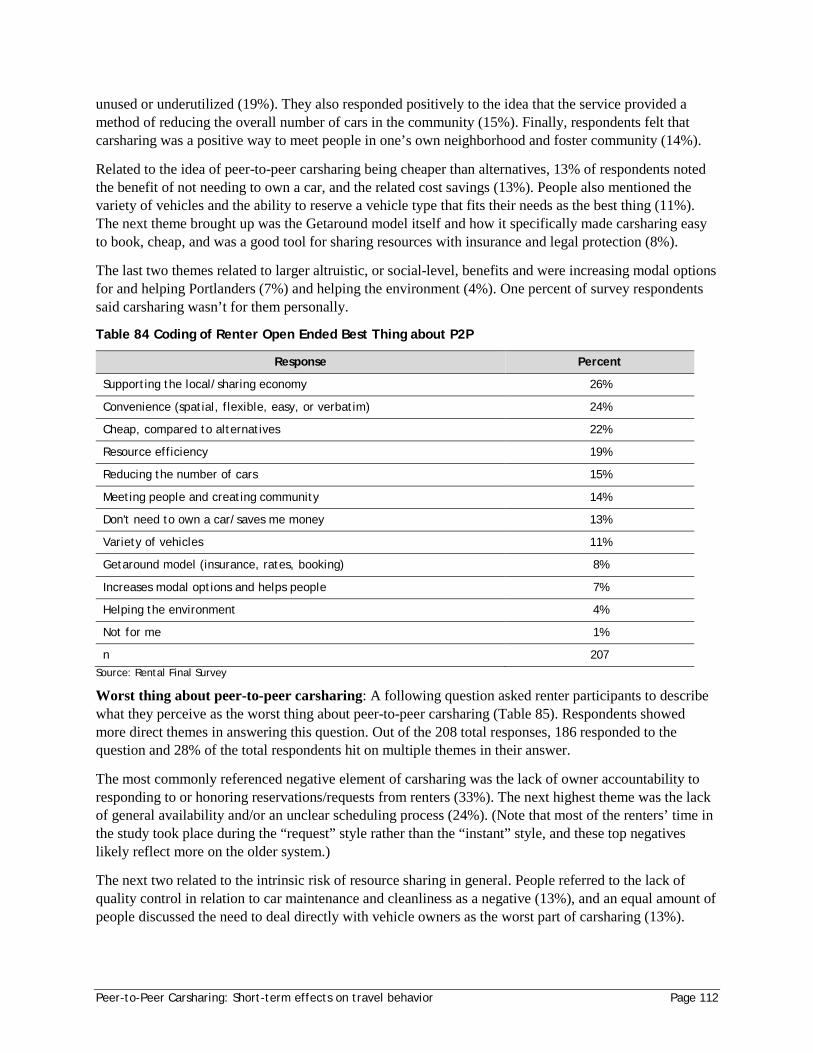
Peer-to-Peer Carsharing: Short-term effects on travel behavior Page 112
unused or underutilized (19%). They also responded positively to the idea that the service provided a method of reducing the overall number of cars in the community (15%). Finally, respondents felt that carsharing was a positive way to meet people in one’s own neighborhood and foster community (14%).
Related to the idea of peer-to-peer carsharing being cheaper than alternatives, 13% of respondents noted the benefit of not needing to own a car, and the related cost savings (13%). People also mentioned the variety of vehicles and the ability to reserve a vehicle type that fits their needs as the best thing (11%). The next theme brought up was the Getaround model itself and how it specifically made carsharing easy to book, cheap, and was a good tool for sharing resources with insurance and legal protection (8%).
The last two themes related to larger altruistic, or social-level, benefits and were increasing modal options for and helping Portlanders (7%) and helping the environment (4%). One percent of survey respondents said carsharing wasn’t for them personally.
Table 84 Coding of Renter Open Ended Best Thing about P2P
Response Percent
Supporting the local/sharing economy 26%
Convenience (spatial, flexible, easy, or verbatim) 24%
Cheap, compared to alternatives 22%
Resource efficiency 19%
Reducing the number of cars 15%
Meeting people and creating community 14%
Don't need to own a car/saves me money 13%
Variety of vehicles 11%
Getaround model (insurance, rates, booking) 8%
Increases modal options and helps people 7%
Helping the environment 4%
Not for me 1%
n 207 Source: Rental Final Survey
Worst thing about peer-to-peer carsharing: A following question asked renter participants to describe what they perceive as the worst thing about peer-to-peer carsharing (Table 85). Respondents showed more direct themes in answering this question. Out of the 208 total responses, 186 responded to the question and 28% of the total respondents hit on multiple themes in their answer.
The most commonly referenced negative element of carsharing was the lack of owner accountability to responding to or honoring reservations/requests from renters (33%). The next highest theme was the lack of general availability and/or an unclear scheduling process (24%). (Note that most of the renters’ time in the study took place during the “request” style rather than the “instant” style, and these top negatives likely reflect more on the older system.)
The next two related to the intrinsic risk of resource sharing in general. People referred to the lack of quality control in relation to car maintenance and cleanliness as a negative (13%), and an equal amount of people discussed the need to deal directly with vehicle owners as the worst part of carsharing (13%).
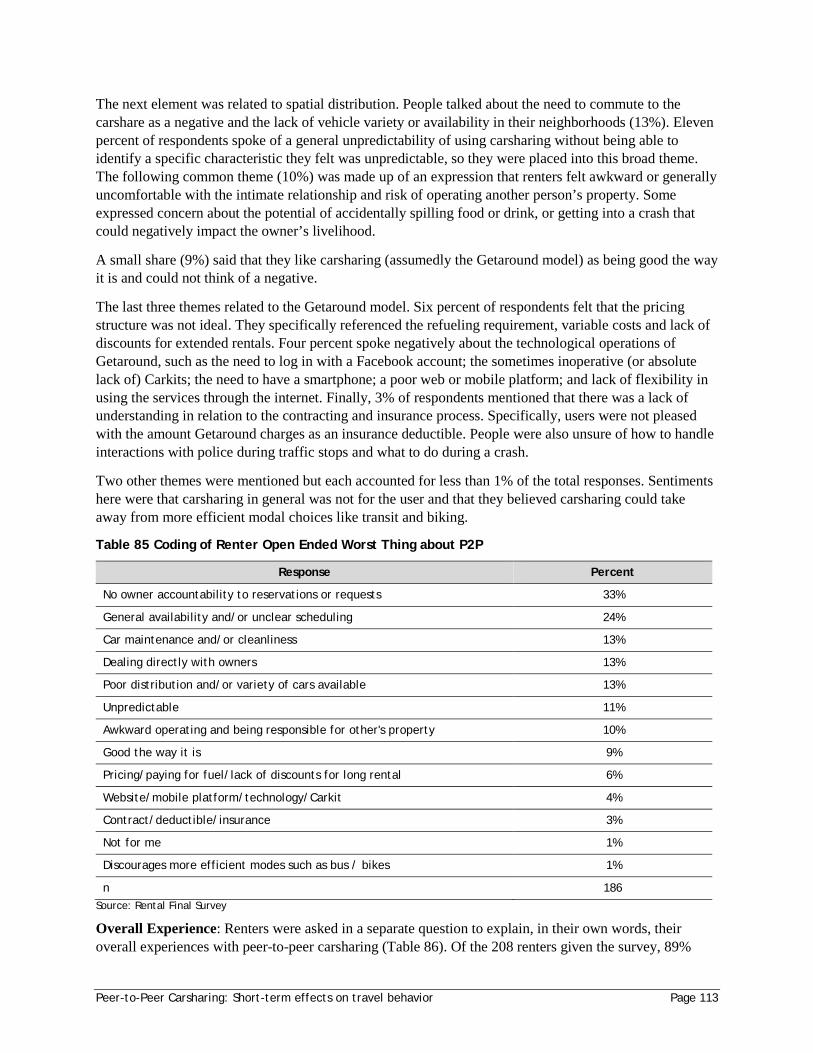
Peer-to-Peer Carsharing: Short-term effects on travel behavior Page 113
The next element was related to spatial distribution. People talked about the need to commute to the carshare as a negative and the lack of vehicle variety or availability in their neighborhoods (13%). Eleven percent of respondents spoke of a general unpredictability of using carsharing without being able to identify a specific characteristic they felt was unpredictable, so they were placed into this broad theme. The following common theme (10%) was made up of an expression that renters felt awkward or generally uncomfortable with the intimate relationship and risk of operating another person’s property. Some expressed concern about the potential of accidentally spilling food or drink, or getting into a crash that could negatively impact the owner’s livelihood.
A small share (9%) said that they like carsharing (assumedly the Getaround model) as being good the way it is and could not think of a negative.
The last three themes related to the Getaround model. Six percent of respondents felt that the pricing structure was not ideal. They specifically referenced the refueling requirement, variable costs and lack of discounts for extended rentals. Four percent spoke negatively about the technological operations of Getaround, such as the need to log in with a Facebook account; the sometimes inoperative (or absolute lack of) Carkits; the need to have a smartphone; a poor web or mobile platform; and lack of flexibility in using the services through the internet. Finally, 3% of respondents mentioned that there was a lack of understanding in relation to the contracting and insurance process. Specifically, users were not pleased with the amount Getaround charges as an insurance deductible. People were also unsure of how to handle interactions with police during traffic stops and what to do during a crash.
Two other themes were mentioned but each accounted for less than 1% of the total responses. Sentiments here were that carsharing in general was not for the user and that they believed carsharing could take away from more efficient modal choices like transit and biking.
Table 85 Coding of Renter Open Ended Worst Thing about P2P
Response Percent
No owner accountability to reservations or requests 33%
General availability and/or unclear scheduling 24%
Car maintenance and/or cleanliness 13%
Dealing directly with owners 13%
Poor distribution and/or variety of cars available 13%
Unpredictable 11%
Awkward operating and being responsible for other's property 10%
Good the way it is 9%
Pricing/paying for fuel/lack of discounts for long rental 6%
Website/mobile platform/technology/Carkit 4%
Contract/deductible/insurance 3%
Not for me 1%
Discourages more efficient modes such as bus / bikes 1%
n 186 Source: Rental Final Survey
Overall Experience: Renters were asked in a separate question to explain, in their own words, their overall experiences with peer-to-peer carsharing (Table 86). Of the 208 renters given the survey, 89%
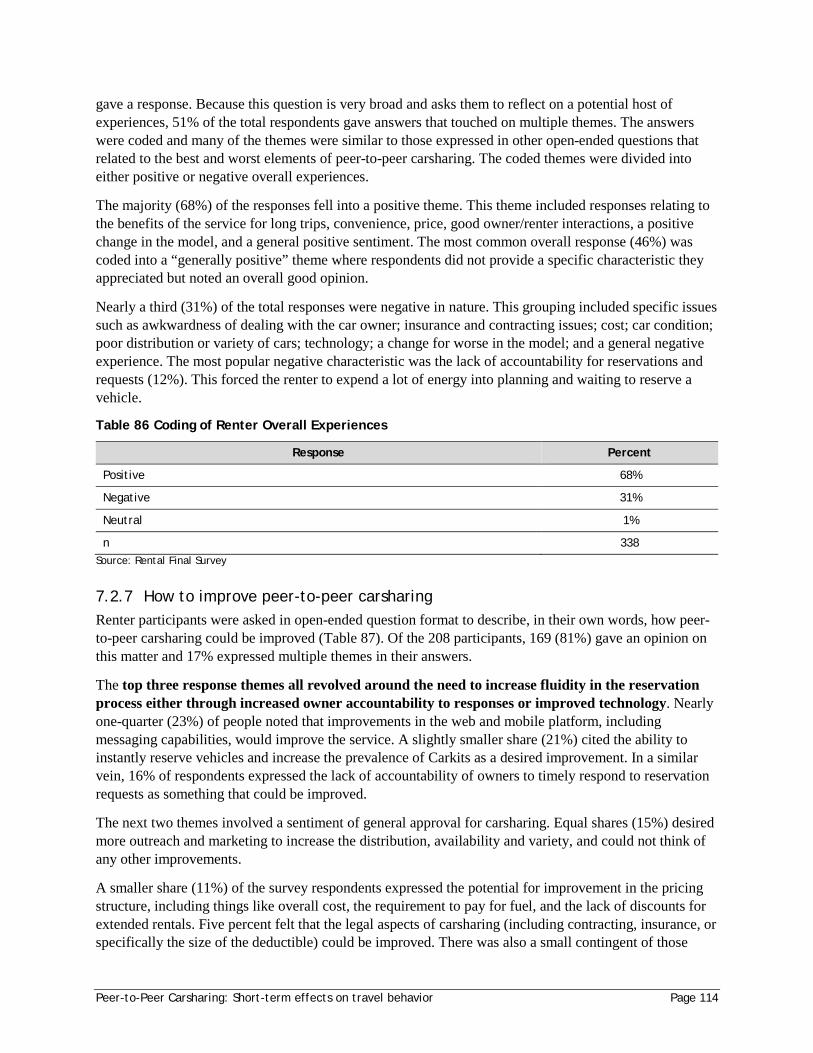
Peer-to-Peer Carsharing: Short-term effects on travel behavior Page 114
gave a response. Because this question is very broad and asks them to reflect on a potential host of experiences, 51% of the total respondents gave answers that touched on multiple themes. The answers were coded and many of the themes were similar to those expressed in other open-ended questions that related to the best and worst elements of peer-to-peer carsharing. The coded themes were divided into either positive or negative overall experiences.
The majority (68%) of the responses fell into a positive theme. This theme included responses relating to the benefits of the service for long trips, convenience, price, good owner/renter interactions, a positive change in the model, and a general positive sentiment. The most common overall response (46%) was coded into a “generally positive” theme where respondents did not provide a specific characteristic they appreciated but noted an overall good opinion.
Nearly a third (31%) of the total responses were negative in nature. This grouping included specific issues such as awkwardness of dealing with the car owner; insurance and contracting issues; cost; car condition; poor distribution or variety of cars; technology; a change for worse in the model; and a general negative experience. The most popular negative characteristic was the lack of accountability for reservations and requests (12%). This forced the renter to expend a lot of energy into planning and waiting to reserve a vehicle.
Table 86 Coding of Renter Overall Experiences
Response Percent
Positive 68%
Negative 31%
Neutral 1%
n 338 Source: Rental Final Survey
7.2.7 How to improve peer-to-peer carsharing Renter participants were asked in open-ended question format to describe, in their own words, how peer-to-peer carsharing could be improved (Table 87). Of the 208 participants, 169 (81%) gave an opinion on this matter and 17% expressed multiple themes in their answers.
The top three response themes all revolved around the need to increase fluidity in the reservation process either through increased owner accountability to responses or improved technology. Nearly one-quarter (23%) of people noted that improvements in the web and mobile platform, including messaging capabilities, would improve the service. A slightly smaller share (21%) cited the ability to instantly reserve vehicles and increase the prevalence of Carkits as a desired improvement. In a similar vein, 16% of respondents expressed the lack of accountability of owners to timely respond to reservation requests as something that could be improved.
The next two themes involved a sentiment of general approval for carsharing. Equal shares (15%) desired more outreach and marketing to increase the distribution, availability and variety, and could not think of any other improvements.
A smaller share (11%) of the survey respondents expressed the potential for improvement in the pricing structure, including things like overall cost, the requirement to pay for fuel, and the lack of discounts for extended rentals. Five percent felt that the legal aspects of carsharing (including contracting, insurance, or specifically the size of the deductible) could be improved. There was also a small contingent of those
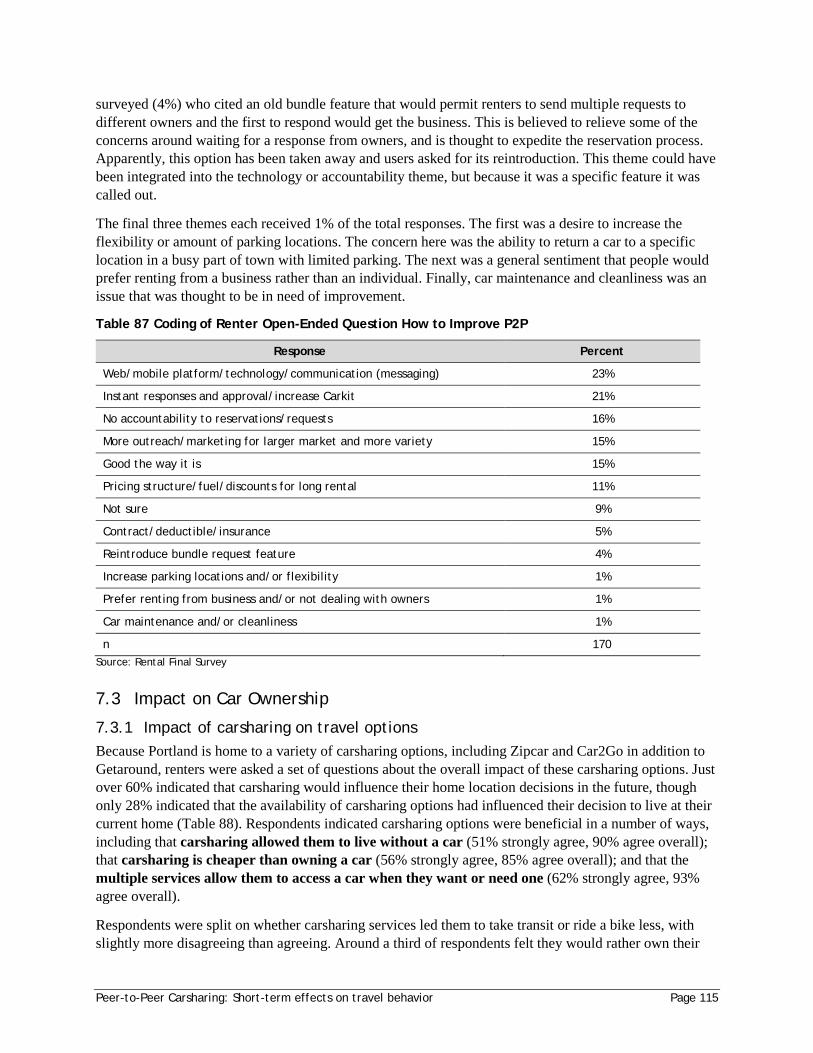
Peer-to-Peer Carsharing: Short-term effects on travel behavior Page 115
surveyed (4%) who cited an old bundle feature that would permit renters to send multiple requests to different owners and the first to respond would get the business. This is believed to relieve some of the concerns around waiting for a response from owners, and is thought to expedite the reservation process. Apparently, this option has been taken away and users asked for its reintroduction. This theme could have been integrated into the technology or accountability theme, but because it was a specific feature it was called out.
The final three themes each received 1% of the total responses. The first was a desire to increase the flexibility or amount of parking locations. The concern here was the ability to return a car to a specific location in a busy part of town with limited parking. The next was a general sentiment that people would prefer renting from a business rather than an individual. Finally, car maintenance and cleanliness was an issue that was thought to be in need of improvement.
Table 87 Coding of Renter Open-Ended Question How to Improve P2P
Response Percent
Web/mobile platform/technology/communication (messaging) 23%
Instant responses and approval/increase Carkit 21%
No accountability to reservations/requests 16%
More outreach/marketing for larger market and more variety 15%
Good the way it is 15%
Pricing structure/fuel/discounts for long rental 11%
Not sure 9%
Contract/deductible/insurance 5%
Reintroduce bundle request feature 4%
Increase parking locations and/or flexibility 1%
Prefer renting from business and/or not dealing with owners 1%
Car maintenance and/or cleanliness 1%
n 170 Source: Rental Final Survey
7.3 Impact on Car Ownership
7.3.1 Impact of carsharing on travel options Because Portland is home to a variety of carsharing options, including Zipcar and Car2Go in addition to Getaround, renters were asked a set of questions about the overall impact of these carsharing options. Just over 60% indicated that carsharing would influence their home location decisions in the future, though only 28% indicated that the availability of carsharing options had influenced their decision to live at their current home (Table 88). Respondents indicated carsharing options were beneficial in a number of ways, including that carsharing allowed them to live without a car (51% strongly agree, 90% agree overall); that carsharing is cheaper than owning a car (56% strongly agree, 85% agree overall); and that the multiple services allow them to access a car when they want or need one (62% strongly agree, 93% agree overall).
Respondents were split on whether carsharing services led them to take transit or ride a bike less, with slightly more disagreeing than agreeing. Around a third of respondents felt they would rather own their
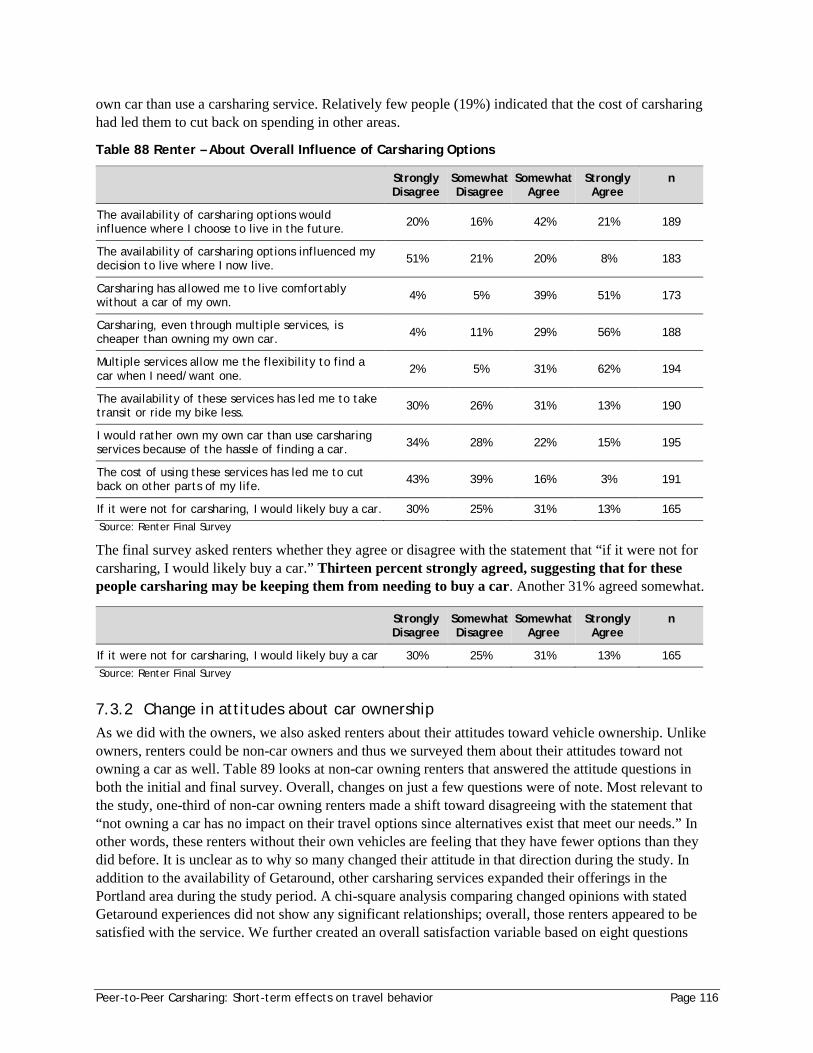
Peer-to-Peer Carsharing: Short-term effects on travel behavior Page 116
own car than use a carsharing service. Relatively few people (19%) indicated that the cost of carsharing had led them to cut back on spending in other areas.
Table 88 Renter – About Overall Influence of Carsharing Options
Strongly Disagree
Somewhat Disagree
Somewhat Agree
Strongly Agree
n
The availability of carsharing options would influence where I choose to live in the future. 20% 16% 42% 21% 189
The availability of carsharing options influenced my decision to live where I now live. 51% 21% 20% 8% 183
Carsharing has allowed me to live comfortably without a car of my own. 4% 5% 39% 51% 173
Carsharing, even through multiple services, is cheaper than owning my own car. 4% 11% 29% 56% 188
Multiple services allow me the flexibility to find a car when I need/want one. 2% 5% 31% 62% 194
The availability of these services has led me to take transit or ride my bike less. 30% 26% 31% 13% 190
I would rather own my own car than use carsharing services because of the hassle of finding a car. 34% 28% 22% 15% 195
The cost of using these services has led me to cut back on other parts of my life. 43% 39% 16% 3% 191
If it were not for carsharing, I would likely buy a car. 30% 25% 31% 13% 165 Source: Renter Final Survey
The final survey asked renters whether they agree or disagree with the statement that “if it were not for carsharing, I would likely buy a car.” Thirteen percent strongly agreed, suggesting that for these people carsharing may be keeping them from needing to buy a car. Another 31% agreed somewhat.
Strongly Disagree
Somewhat Disagree
Somewhat Agree
Strongly Agree
n
If it were not for carsharing, I would likely buy a car 30% 25% 31% 13% 165 Source: Renter Final Survey
7.3.2 Change in attitudes about car ownership As we did with the owners, we also asked renters about their attitudes toward vehicle ownership. Unlike owners, renters could be non-car owners and thus we surveyed them about their attitudes toward not owning a car as well. Table 89 looks at non-car owning renters that answered the attitude questions in both the initial and final survey. Overall, changes on just a few questions were of note. Most relevant to the study, one-third of non-car owning renters made a shift toward disagreeing with the statement that “not owning a car has no impact on their travel options since alternatives exist that meet our needs.” In other words, these renters without their own vehicles are feeling that they have fewer options than they did before. It is unclear as to why so many changed their attitude in that direction during the study. In addition to the availability of Getaround, other carsharing services expanded their offerings in the Portland area during the study period. A chi-square analysis comparing changed opinions with stated Getaround experiences did not show any significant relationships; overall, those renters appeared to be satisfied with the service. We further created an overall satisfaction variable based on eight questions
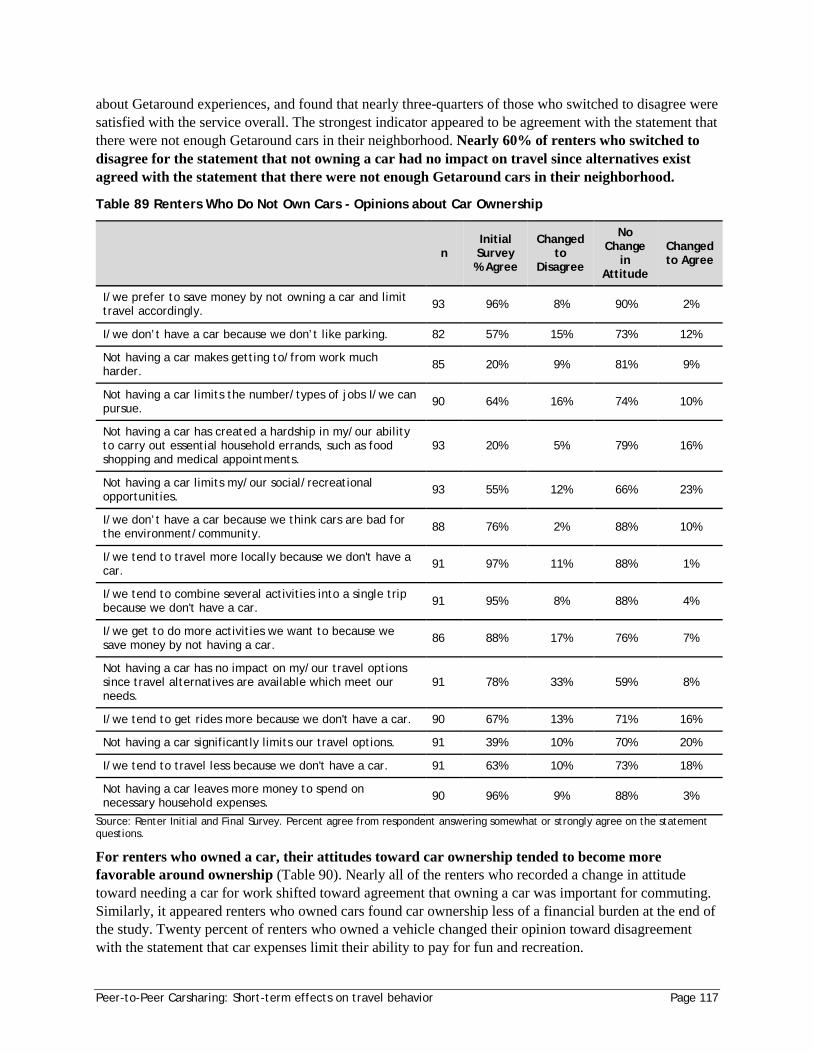
Peer-to-Peer Carsharing: Short-term effects on travel behavior Page 117
about Getaround experiences, and found that nearly three-quarters of those who switched to disagree were satisfied with the service overall. The strongest indicator appeared to be agreement with the statement that there were not enough Getaround cars in their neighborhood. Nearly 60% of renters who switched to disagree for the statement that not owning a car had no impact on travel since alternatives exist agreed with the statement that there were not enough Getaround cars in their neighborhood.
Table 89 Renters Who Do Not Own Cars - Opinions about Car Ownership
n Initial Survey % Agree
Changed to
Disagree
No Change
in Attitude
Changed to Agree
I/we prefer to save money by not owning a car and limit travel accordingly. 93 96% 8% 90% 2%
I/we don’t have a car because we don’t like parking. 82 57% 15% 73% 12%
Not having a car makes getting to/from work much harder. 85 20% 9% 81% 9%
Not having a car limits the number/types of jobs I/we can pursue. 90 64% 16% 74% 10%
Not having a car has created a hardship in my/our ability to carry out essential household errands, such as food shopping and medical appointments.
93 20% 5% 79% 16%
Not having a car limits my/our social/recreational opportunities. 93 55% 12% 66% 23%
I/we don’t have a car because we think cars are bad for the environment/community. 88 76% 2% 88% 10%
I/we tend to travel more locally because we don't have a car. 91 97% 11% 88% 1%
I/we tend to combine several activities into a single trip because we don't have a car. 91 95% 8% 88% 4%
I/we get to do more activities we want to because we save money by not having a car. 86 88% 17% 76% 7%
Not having a car has no impact on my/our travel options since travel alternatives are available which meet our needs.
91 78% 33% 59% 8%
I/we tend to get rides more because we don't have a car. 90 67% 13% 71% 16%
Not having a car significantly limits our travel options. 91 39% 10% 70% 20%
I/we tend to travel less because we don't have a car. 91 63% 10% 73% 18%
Not having a car leaves more money to spend on necessary household expenses. 90 96% 9% 88% 3%
Source: Renter Initial and Final Survey. Percent agree from respondent answering somewhat or strongly agree on the statement questions.
For renters who owned a car, their attitudes toward car ownership tended to become more favorable around ownership (Table 90). Nearly all of the renters who recorded a change in attitude toward needing a car for work shifted toward agreement that owning a car was important for commuting. Similarly, it appeared renters who owned cars found car ownership less of a financial burden at the end of the study. Twenty percent of renters who owned a vehicle changed their opinion toward disagreement with the statement that car expenses limit their ability to pay for fun and recreation.
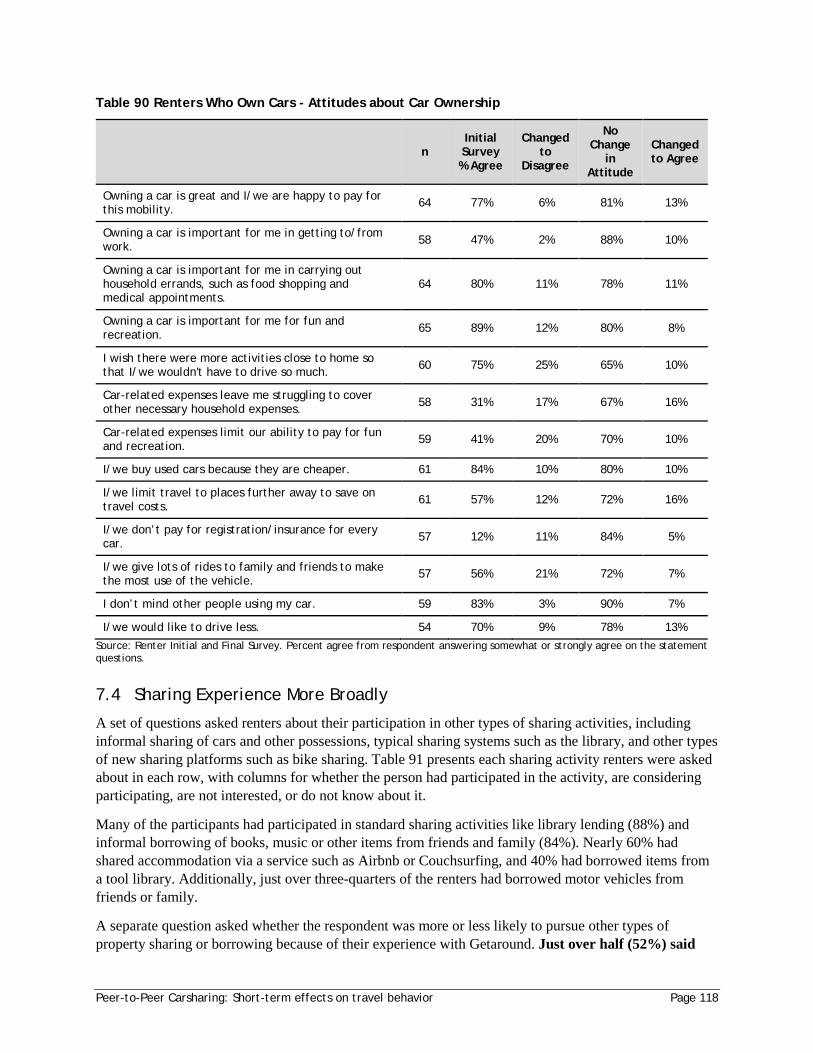
Peer-to-Peer Carsharing: Short-term effects on travel behavior Page 118
Table 90 Renters Who Own Cars - Attitudes about Car Ownership
n Initial Survey % Agree
Changed to
Disagree
No Change
in Attitude
Changed to Agree
Owning a car is great and I/we are happy to pay for this mobility. 64 77% 6% 81% 13%
Owning a car is important for me in getting to/from work. 58 47% 2% 88% 10%
Owning a car is important for me in carrying out household errands, such as food shopping and medical appointments.
64 80% 11% 78% 11%
Owning a car is important for me for fun and recreation. 65 89% 12% 80% 8%
I wish there were more activities close to home so that I/we wouldn't have to drive so much. 60 75% 25% 65% 10%
Car-related expenses leave me struggling to cover other necessary household expenses. 58 31% 17% 67% 16%
Car-related expenses limit our ability to pay for fun and recreation. 59 41% 20% 70% 10%
I/we buy used cars because they are cheaper. 61 84% 10% 80% 10%
I/we limit travel to places further away to save on travel costs. 61 57% 12% 72% 16%
I/we don’t pay for registration/insurance for every car. 57 12% 11% 84% 5%
I/we give lots of rides to family and friends to make the most use of the vehicle. 57 56% 21% 72% 7%
I don’t mind other people using my car. 59 83% 3% 90% 7%
I/we would like to drive less. 54 70% 9% 78% 13%
Source: Renter Initial and Final Survey. Percent agree from respondent answering somewhat or strongly agree on the statement questions.
7.4 Sharing Experience More Broadly
A set of questions asked renters about their participation in other types of sharing activities, including informal sharing of cars and other possessions, typical sharing systems such as the library, and other types of new sharing platforms such as bike sharing. Table 91 presents each sharing activity renters were asked about in each row, with columns for whether the person had participated in the activity, are considering participating, are not interested, or do not know about it.
Many of the participants had participated in standard sharing activities like library lending (88%) and informal borrowing of books, music or other items from friends and family (84%). Nearly 60% had shared accommodation via a service such as Airbnb or Couchsurfing, and 40% had borrowed items from a tool library. Additionally, just over three-quarters of the renters had borrowed motor vehicles from friends or family.
A separate question asked whether the respondent was more or less likely to pursue other types of property sharing or borrowing because of their experience with Getaround. Just over half (52%) said
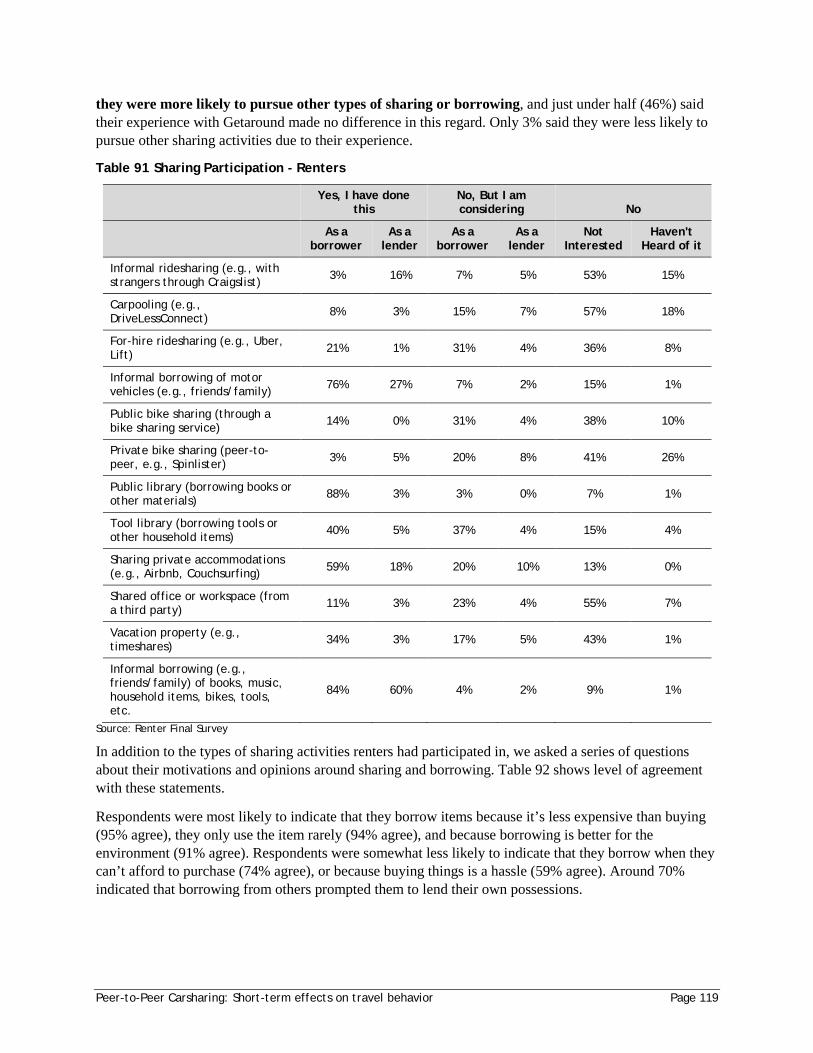
Peer-to-Peer Carsharing: Short-term effects on travel behavior Page 119
they were more likely to pursue other types of sharing or borrowing, and just under half (46%) said their experience with Getaround made no difference in this regard. Only 3% said they were less likely to pursue other sharing activities due to their experience.
Table 91 Sharing Participation - Renters
Yes, I have done
this No, But I am considering No
As a
borrower As a
lender As a
borrower As a
lender Not
Interested Haven't
Heard of it
Informal ridesharing (e.g., with strangers through Craigslist) 3% 16% 7% 5% 53% 15%
Carpooling (e.g., DriveLessConnect) 8% 3% 15% 7% 57% 18%
For-hire ridesharing (e.g., Uber, Lift) 21% 1% 31% 4% 36% 8%
Informal borrowing of motor vehicles (e.g., friends/family) 76% 27% 7% 2% 15% 1%
Public bike sharing (through a bike sharing service) 14% 0% 31% 4% 38% 10%
Private bike sharing (peer-to-peer, e.g., Spinlister) 3% 5% 20% 8% 41% 26%
Public library (borrowing books or other materials) 88% 3% 3% 0% 7% 1%
Tool library (borrowing tools or other household items) 40% 5% 37% 4% 15% 4%
Sharing private accommodations (e.g., Airbnb, Couchsurfing) 59% 18% 20% 10% 13% 0%
Shared office or workspace (from a third party) 11% 3% 23% 4% 55% 7%
Vacation property (e.g., timeshares) 34% 3% 17% 5% 43% 1%
Informal borrowing (e.g., friends/family) of books, music, household items, bikes, tools, etc.
84% 60% 4% 2% 9% 1%
Source: Renter Final Survey
In addition to the types of sharing activities renters had participated in, we asked a series of questions about their motivations and opinions around sharing and borrowing. Table 92 shows level of agreement with these statements.
Respondents were most likely to indicate that they borrow items because it’s less expensive than buying (95% agree), they only use the item rarely (94% agree), and because borrowing is better for the environment (91% agree). Respondents were somewhat less likely to indicate that they borrow when they can’t afford to purchase (74% agree), or because buying things is a hassle (59% agree). Around 70% indicated that borrowing from others prompted them to lend their own possessions.
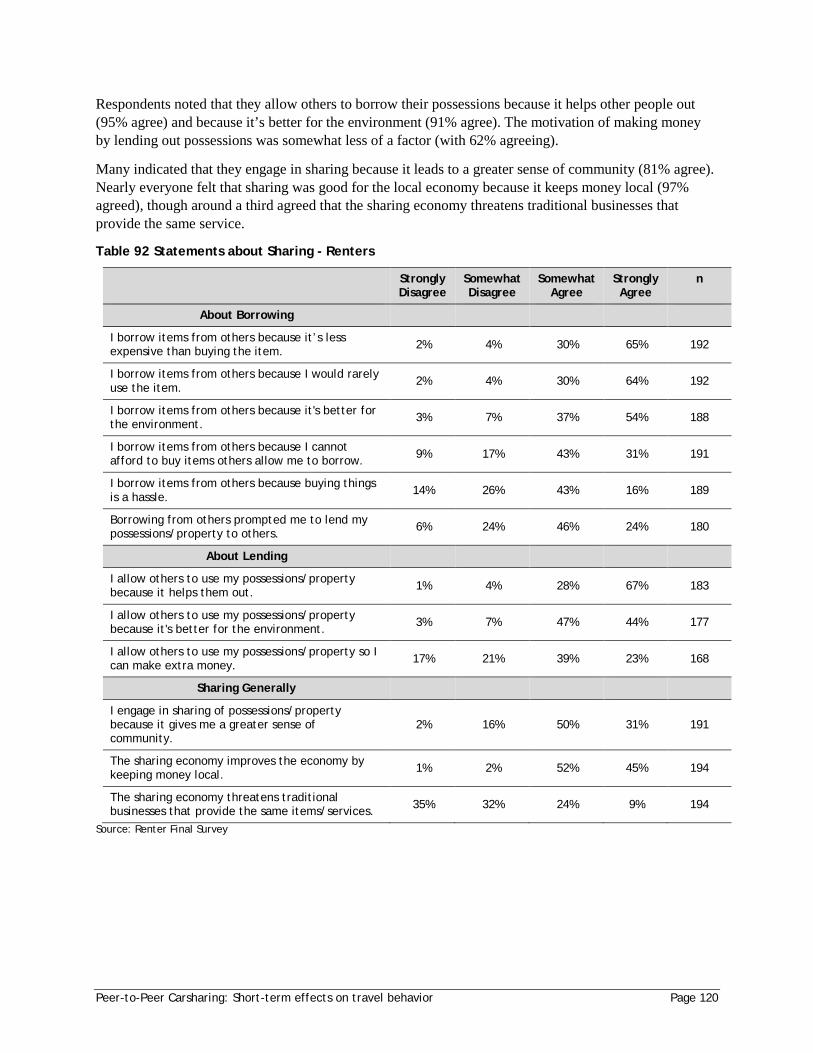
Peer-to-Peer Carsharing: Short-term effects on travel behavior Page 120
Respondents noted that they allow others to borrow their possessions because it helps other people out (95% agree) and because it’s better for the environment (91% agree). The motivation of making money by lending out possessions was somewhat less of a factor (with 62% agreeing).
Many indicated that they engage in sharing because it leads to a greater sense of community (81% agree). Nearly everyone felt that sharing was good for the local economy because it keeps money local (97% agreed), though around a third agreed that the sharing economy threatens traditional businesses that provide the same service.
Table 92 Statements about Sharing - Renters
Strongly Disagree
Somewhat Disagree
Somewhat Agree
Strongly Agree
n
About Borrowing
I borrow items from others because it’s less expensive than buying the item. 2% 4% 30% 65% 192
I borrow items from others because I would rarely use the item. 2% 4% 30% 64% 192
I borrow items from others because it's better for the environment. 3% 7% 37% 54% 188
I borrow items from others because I cannot afford to buy items others allow me to borrow. 9% 17% 43% 31% 191
I borrow items from others because buying things is a hassle. 14% 26% 43% 16% 189
Borrowing from others prompted me to lend my possessions/property to others. 6% 24% 46% 24% 180
About Lending
I allow others to use my possessions/property because it helps them out. 1% 4% 28% 67% 183
I allow others to use my possessions/property because it's better for the environment. 3% 7% 47% 44% 177
I allow others to use my possessions/property so I can make extra money. 17% 21% 39% 23% 168
Sharing Generally
I engage in sharing of possessions/property because it gives me a greater sense of community.
2% 16% 50% 31% 191
The sharing economy improves the economy by keeping money local. 1% 2% 52% 45% 194
The sharing economy threatens traditional businesses that provide the same items/services. 35% 32% 24% 9% 194
Source: Renter Final Survey
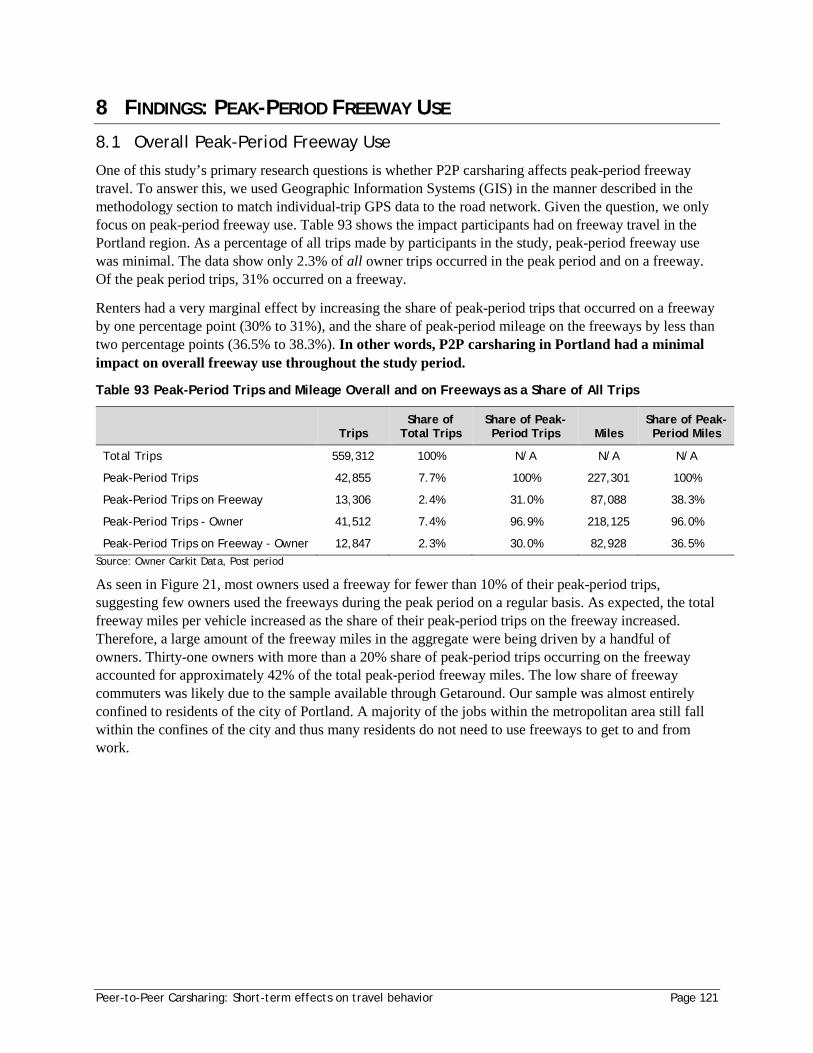
Peer-to-Peer Carsharing: Short-term effects on travel behavior Page 121
8 FINDINGS: PEAK-PERIOD FREEWAY USE
8.1 Overall Peak-Period Freeway Use
One of this study’s primary research questions is whether P2P carsharing affects peak-period freeway travel. To answer this, we used Geographic Information Systems (GIS) in the manner described in the methodology section to match individual-trip GPS data to the road network. Given the question, we only focus on peak-period freeway use. Table 93 shows the impact participants had on freeway travel in the Portland region. As a percentage of all trips made by participants in the study, peak-period freeway use was minimal. The data show only 2.3% of all owner trips occurred in the peak period and on a freeway. Of the peak period trips, 31% occurred on a freeway.
Renters had a very marginal effect by increasing the share of peak-period trips that occurred on a freeway by one percentage point (30% to 31%), and the share of peak-period mileage on the freeways by less than two percentage points (36.5% to 38.3%). In other words, P2P carsharing in Portland had a minimal impact on overall freeway use throughout the study period.
Table 93 Peak-Period Trips and Mileage Overall and on Freeways as a Share of All Trips
Trips Share of
Total Trips Share of Peak-Period Trips Miles
Share of Peak-Period Miles
Total Trips 559,312 100% N/A N/A N/A
Peak-Period Trips 42,855 7.7% 100% 227,301 100%
Peak-Period Trips on Freeway 13,306 2.4% 31.0% 87,088 38.3%
Peak-Period Trips - Owner 41,512 7.4% 96.9% 218,125 96.0%
Peak-Period Trips on Freeway - Owner 12,847 2.3% 30.0% 82,928 36.5% Source: Owner Carkit Data, Post period
As seen in Figure 21, most owners used a freeway for fewer than 10% of their peak-period trips, suggesting few owners used the freeways during the peak period on a regular basis. As expected, the total freeway miles per vehicle increased as the share of their peak-period trips on the freeway increased. Therefore, a large amount of the freeway miles in the aggregate were being driven by a handful of owners. Thirty-one owners with more than a 20% share of peak-period trips occurring on the freeway accounted for approximately 42% of the total peak-period freeway miles. The low share of freeway commuters was likely due to the sample available through Getaround. Our sample was almost entirely confined to residents of the city of Portland. A majority of the jobs within the metropolitan area still fall within the confines of the city and thus many residents do not need to use freeways to get to and from work.
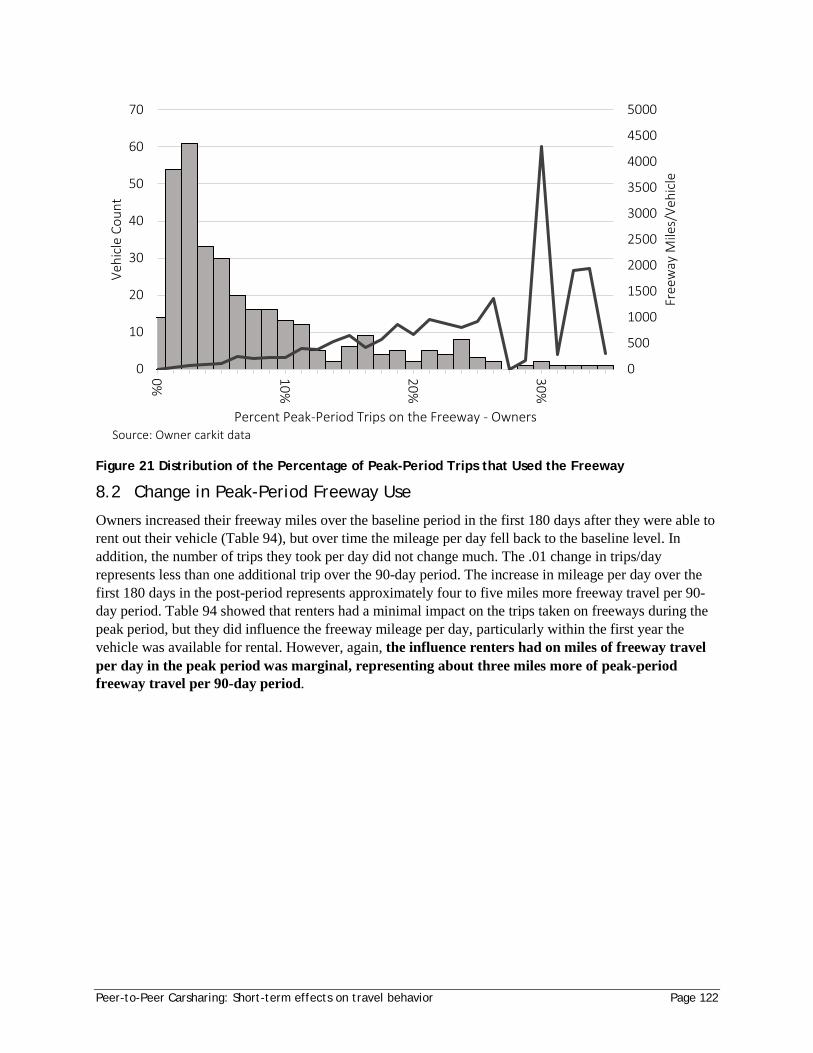
Peer-to-Peer Carsharing: Short-term effects on travel behavior Page 122
Figure 21 Distribution of the Percentage of Peak-Period Trips that Used the Freeway
8.2 Change in Peak-Period Freeway Use
Owners increased their freeway miles over the baseline period in the first 180 days after they were able to rent out their vehicle (Table 94), but over time the mileage per day fell back to the baseline level. In addition, the number of trips they took per day did not change much. The .01 change in trips/day represents less than one additional trip over the 90-day period. The increase in mileage per day over the first 180 days in the post-period represents approximately four to five miles more freeway travel per 90-day period. Table 94 showed that renters had a minimal impact on the trips taken on freeways during the peak period, but they did influence the freeway mileage per day, particularly within the first year the vehicle was available for rental. However, again, the influence renters had on miles of freeway travel per day in the peak period was marginal, representing about three miles more of peak-period freeway travel per 90-day period.
0
500
1000
1500
2000
2500
3000
3500
4000
4500
5000
0
10
20
30
40
50
60
70
0% 10%
20%
30%
Free
way
Mile
s/Ve
hicl
e
Vehi
cle
Coun
t
Percent Peak-Period Trips on the Freeway - OwnersSource: Owner carkit data
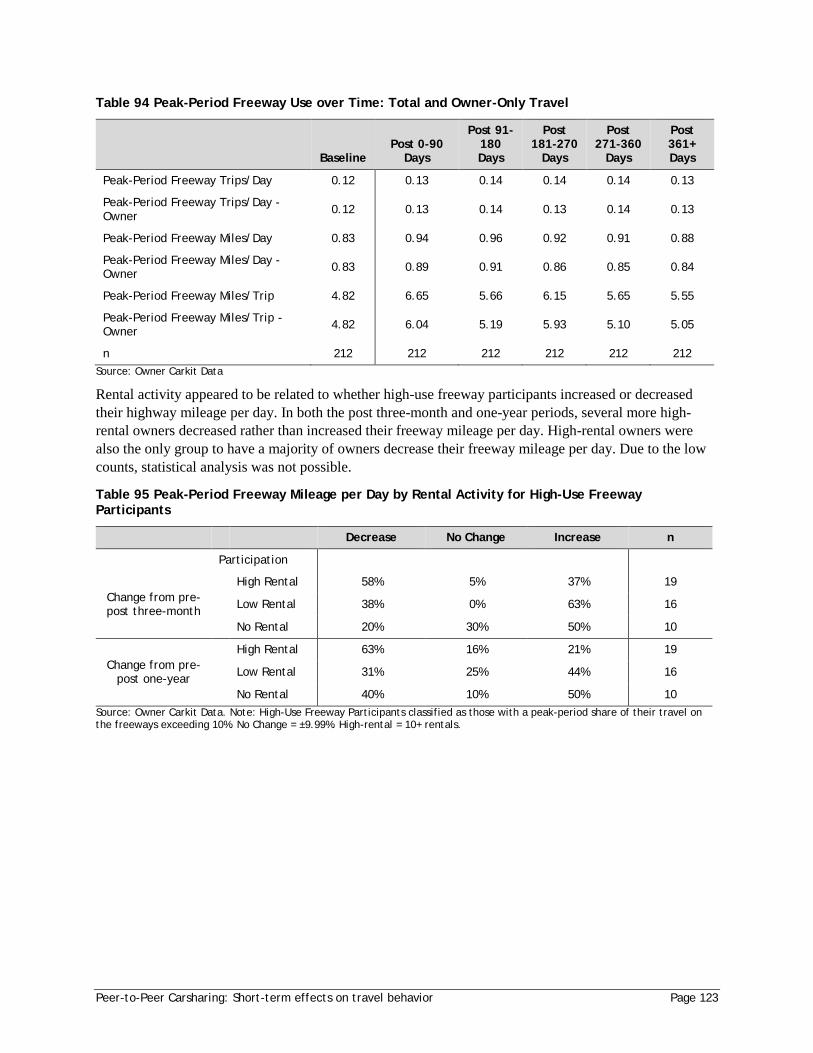
Peer-to-Peer Carsharing: Short-term effects on travel behavior Page 123
Table 94 Peak-Period Freeway Use over Time: Total and Owner-Only Travel
Baseline Post 0-90
Days
Post 91-180 Days
Post 181-270
Days
Post 271-360
Days
Post 361+ Days
Peak-Period Freeway Trips/Day 0.12 0.13 0.14 0.14 0.14 0.13
Peak-Period Freeway Trips/Day - Owner 0.12 0.13 0.14 0.13 0.14 0.13
Peak-Period Freeway Miles/Day 0.83 0.94 0.96 0.92 0.91 0.88
Peak-Period Freeway Miles/Day - Owner 0.83 0.89 0.91 0.86 0.85 0.84
Peak-Period Freeway Miles/Trip 4.82 6.65 5.66 6.15 5.65 5.55
Peak-Period Freeway Miles/Trip - Owner 4.82 6.04 5.19 5.93 5.10 5.05
n 212 212 212 212 212 212 Source: Owner Carkit Data
Rental activity appeared to be related to whether high-use freeway participants increased or decreased their highway mileage per day. In both the post three-month and one-year periods, several more high-rental owners decreased rather than increased their freeway mileage per day. High-rental owners were also the only group to have a majority of owners decrease their freeway mileage per day. Due to the low counts, statistical analysis was not possible.
Table 95 Peak-Period Freeway Mileage per Day by Rental Activity for High-Use Freeway Participants
Decrease No Change Increase n
Participation
Change from pre-post three-month
High Rental 58% 5% 37% 19
Low Rental 38% 0% 63% 16
No Rental 20% 30% 50% 10
Change from pre-post one-year
High Rental 63% 16% 21% 19
Low Rental 31% 25% 44% 16
No Rental 40% 10% 50% 10 Source: Owner Carkit Data. Note: High-Use Freeway Participants classified as those with a peak-period share of their travel on the freeways exceeding 10%. No Change = ±9.99%. High-rental = 10+ rentals.
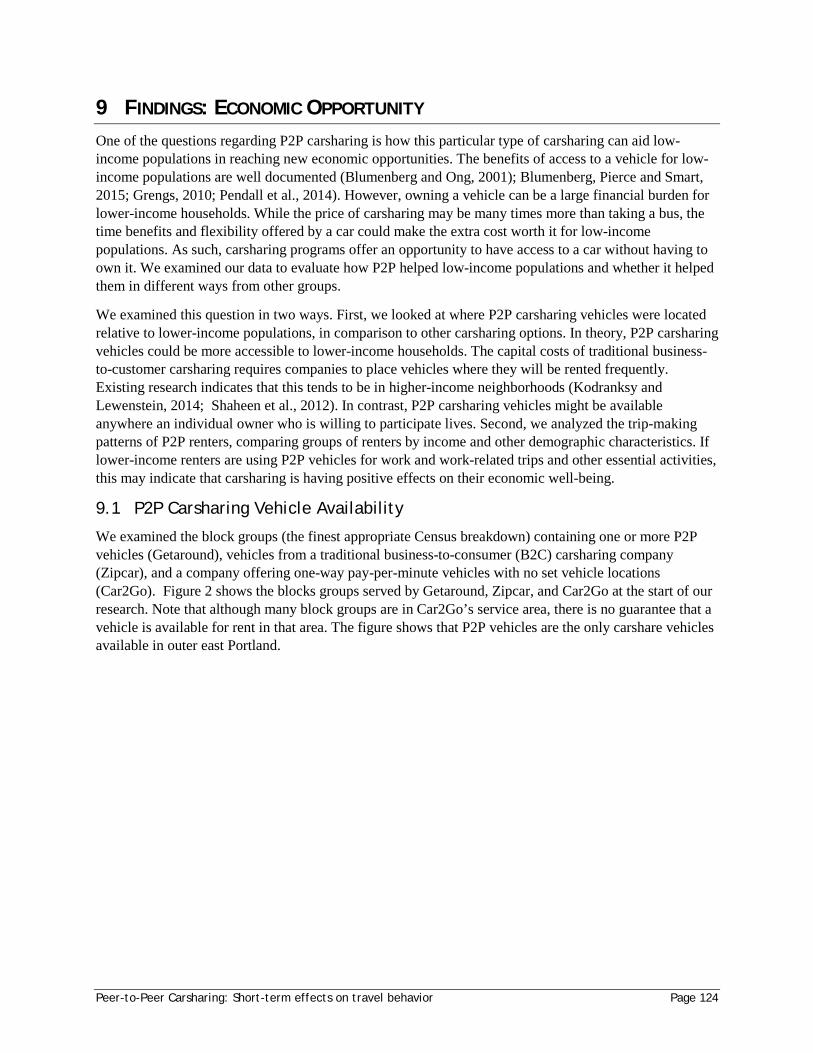
Peer-to-Peer Carsharing: Short-term effects on travel behavior Page 124
9 FINDINGS: ECONOMIC OPPORTUNITY One of the questions regarding P2P carsharing is how this particular type of carsharing can aid low-income populations in reaching new economic opportunities. The benefits of access to a vehicle for low-income populations are well documented (Blumenberg and Ong, 2001); Blumenberg, Pierce and Smart, 2015; Grengs, 2010; Pendall et al., 2014). However, owning a vehicle can be a large financial burden for lower-income households. While the price of carsharing may be many times more than taking a bus, the time benefits and flexibility offered by a car could make the extra cost worth it for low-income populations. As such, carsharing programs offer an opportunity to have access to a car without having to own it. We examined our data to evaluate how P2P helped low-income populations and whether it helped them in different ways from other groups.
We examined this question in two ways. First, we looked at where P2P carsharing vehicles were located relative to lower-income populations, in comparison to other carsharing options. In theory, P2P carsharing vehicles could be more accessible to lower-income households. The capital costs of traditional business-to-customer carsharing requires companies to place vehicles where they will be rented frequently. Existing research indicates that this tends to be in higher-income neighborhoods (Kodranksy and Lewenstein, 2014; Shaheen et al., 2012). In contrast, P2P carsharing vehicles might be available anywhere an individual owner who is willing to participate lives. Second, we analyzed the trip-making patterns of P2P renters, comparing groups of renters by income and other demographic characteristics. If lower-income renters are using P2P vehicles for work and work-related trips and other essential activities, this may indicate that carsharing is having positive effects on their economic well-being.
9.1 P2P Carsharing Vehicle Availability
We examined the block groups (the finest appropriate Census breakdown) containing one or more P2P vehicles (Getaround), vehicles from a traditional business-to-consumer (B2C) carsharing company (Zipcar), and a company offering one-way pay-per-minute vehicles with no set vehicle locations (Car2Go). Figure 2 shows the blocks groups served by Getaround, Zipcar, and Car2Go at the start of our research. Note that although many block groups are in Car2Go’s service area, there is no guarantee that a vehicle is available for rent in that area. The figure shows that P2P vehicles are the only carshare vehicles available in outer east Portland.
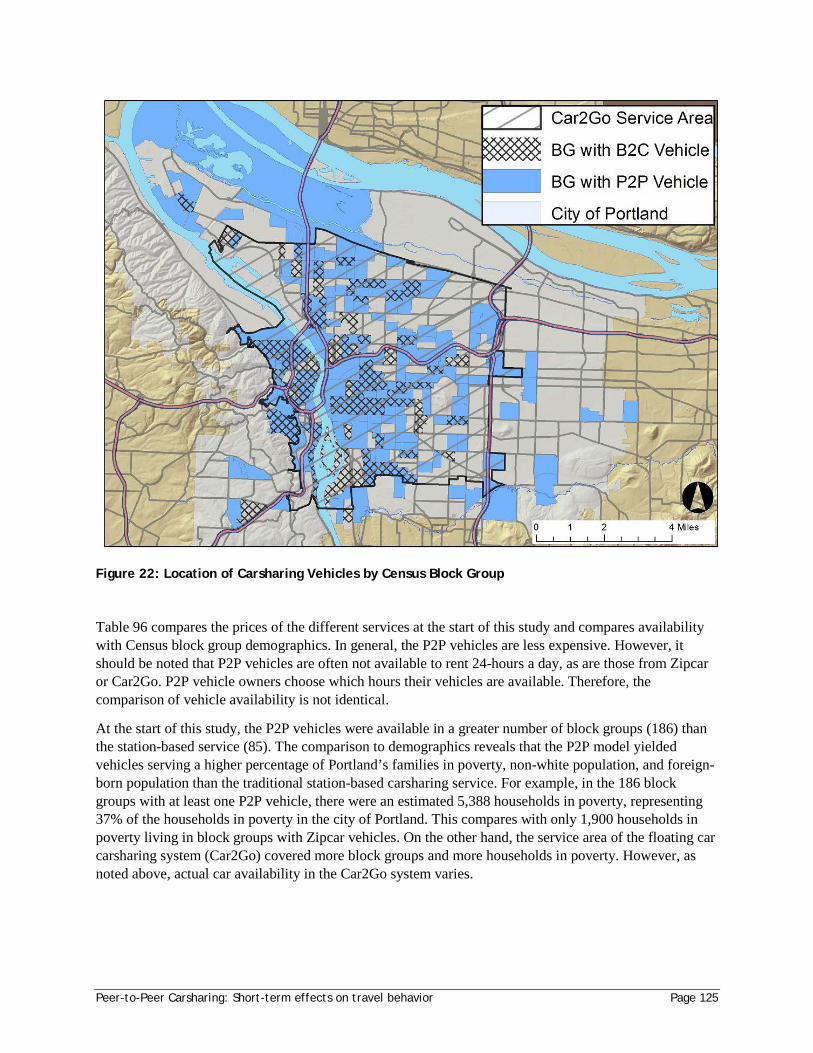
Peer-to-Peer Carsharing: Short-term effects on travel behavior Page 125
Figure 22: Location of Carsharing Vehicles by Census Block Group
Table 96 compares the prices of the different services at the start of this study and compares availability with Census block group demographics. In general, the P2P vehicles are less expensive. However, it should be noted that P2P vehicles are often not available to rent 24-hours a day, as are those from Zipcar or Car2Go. P2P vehicle owners choose which hours their vehicles are available. Therefore, the comparison of vehicle availability is not identical.
At the start of this study, the P2P vehicles were available in a greater number of block groups (186) than the station-based service (85). The comparison to demographics reveals that the P2P model yielded vehicles serving a higher percentage of Portland’s families in poverty, non-white population, and foreign-born population than the traditional station-based carsharing service. For example, in the 186 block groups with at least one P2P vehicle, there were an estimated 5,388 households in poverty, representing 37% of the households in poverty in the city of Portland. This compares with only 1,900 households in poverty living in block groups with Zipcar vehicles. On the other hand, the service area of the floating car carsharing system (Car2Go) covered more block groups and more households in poverty. However, as noted above, actual car availability in the Car2Go system varies.
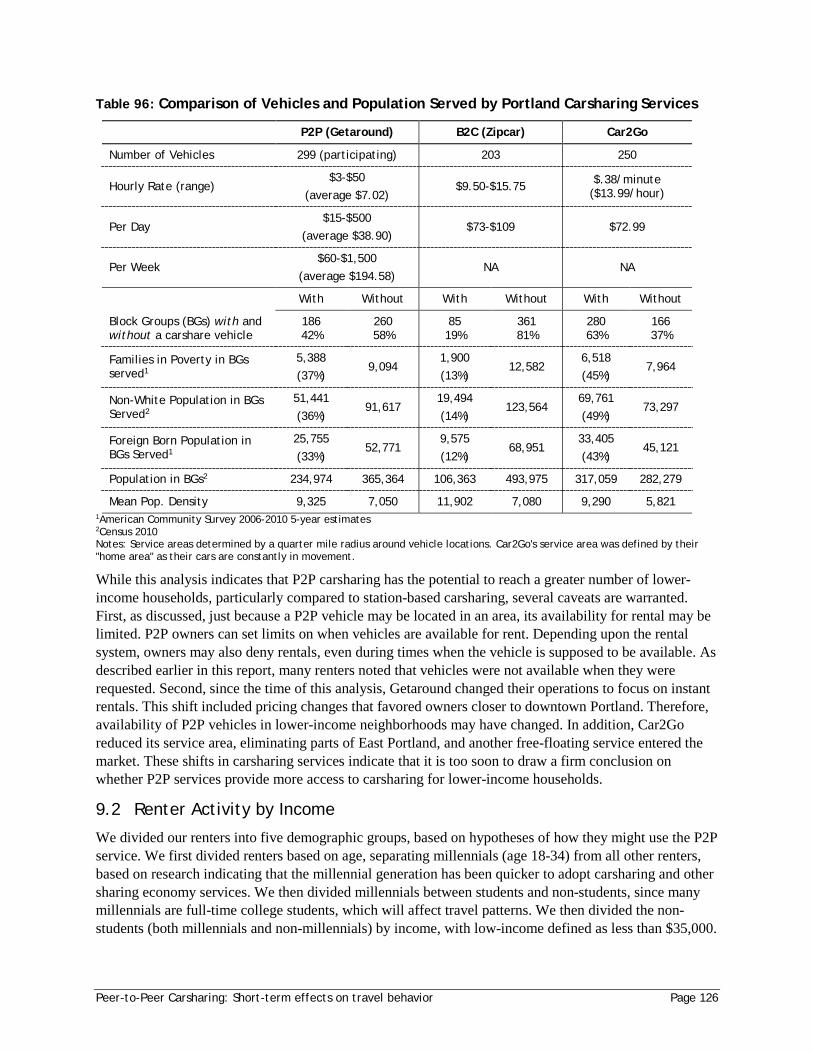
Peer-to-Peer Carsharing: Short-term effects on travel behavior Page 126
Table 96: Comparison of Vehicles and Population Served by Portland Carsharing Services
P2P (Getaround) B2C (Zipcar) Car2Go
Number of Vehicles 299 (participating) 203 250
Hourly Rate (range) $3-$50
(average $7.02) $9.50-$15.75 $.38/minute
($13.99/hour)
Per Day $15-$500
(average $38.90) $73-$109 $72.99
Per Week $60-$1,500
(average $194.58) NA NA
Block Groups (BGs) with and without a carshare vehicle
With Without With Without With Without
186 42%
260 58%
85 19%
361 81%
280 63%
166 37%
Families in Poverty in BGs served1
5,388 (37%)
9,094 1,900 (13%)
12,582 6,518 (45%)
7,964
Non-White Population in BGs Served2
51,441 (36%)
91,617 19,494 (14%)
123,564 69,761 (49%)
73,297
Foreign Born Population in BGs Served1
25,755 (33%)
52,771 9,575 (12%)
68,951 33,405 (43%)
45,121
Population in BGs2 234,974 365,364 106,363 493,975 317,059 282,279
Mean Pop. Density 9,325 7,050 11,902 7,080 9,290 5,821 1American Community Survey 2006-2010 5-year estimates 2Census 2010 Notes: Service areas determined by a quarter mile radius around vehicle locations. Car2Go's service area was defined by their "home area" as their cars are constantly in movement.
While this analysis indicates that P2P carsharing has the potential to reach a greater number of lower-income households, particularly compared to station-based carsharing, several caveats are warranted. First, as discussed, just because a P2P vehicle may be located in an area, its availability for rental may be limited. P2P owners can set limits on when vehicles are available for rent. Depending upon the rental system, owners may also deny rentals, even during times when the vehicle is supposed to be available. As described earlier in this report, many renters noted that vehicles were not available when they were requested. Second, since the time of this analysis, Getaround changed their operations to focus on instant rentals. This shift included pricing changes that favored owners closer to downtown Portland. Therefore, availability of P2P vehicles in lower-income neighborhoods may have changed. In addition, Car2Go reduced its service area, eliminating parts of East Portland, and another free-floating service entered the market. These shifts in carsharing services indicate that it is too soon to draw a firm conclusion on whether P2P services provide more access to carsharing for lower-income households.
9.2 Renter Activity by Income
We divided our renters into five demographic groups, based on hypotheses of how they might use the P2P service. We first divided renters based on age, separating millennials (age 18-34) from all other renters, based on research indicating that the millennial generation has been quicker to adopt carsharing and other sharing economy services. We then divided millennials between students and non-students, since many millennials are full-time college students, which will affect travel patterns. We then divided the non-students (both millennials and non-millennials) by income, with low-income defined as less than $35,000.
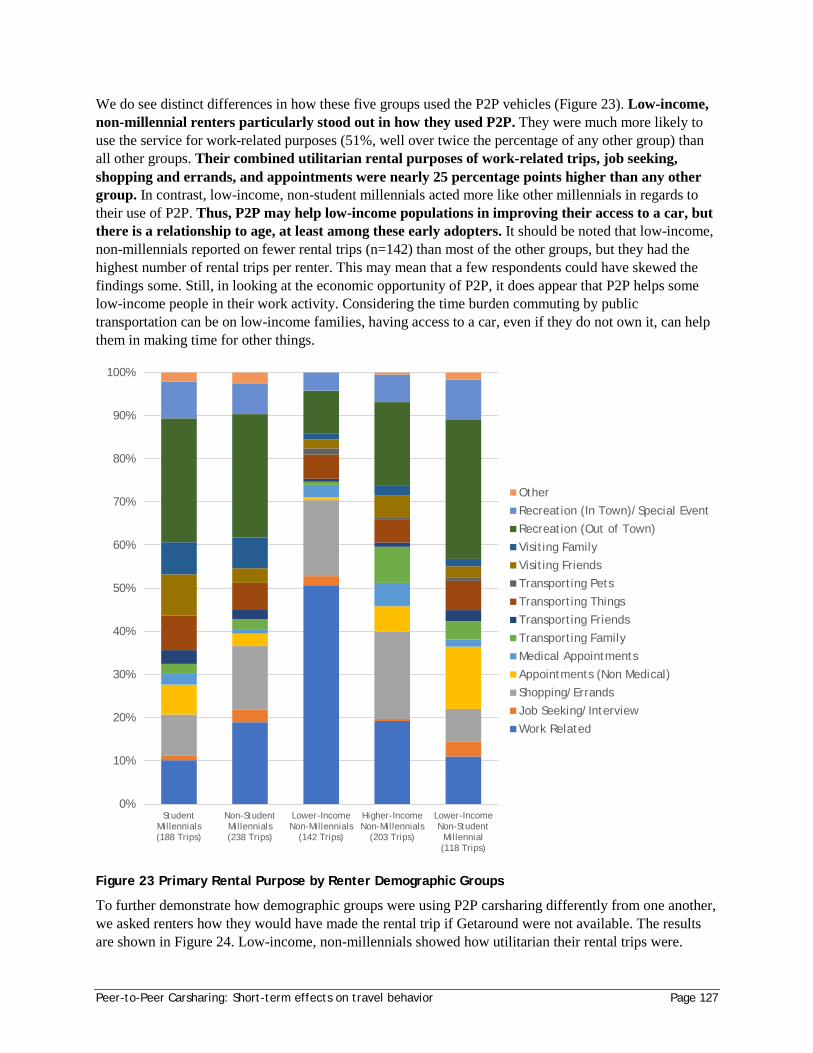
Peer-to-Peer Carsharing: Short-term effects on travel behavior Page 127
We do see distinct differences in how these five groups used the P2P vehicles (Figure 23). Low-income, non-millennial renters particularly stood out in how they used P2P. They were much more likely to use the service for work-related purposes (51%, well over twice the percentage of any other group) than all other groups. Their combined utilitarian rental purposes of work-related trips, job seeking, shopping and errands, and appointments were nearly 25 percentage points higher than any other group. In contrast, low-income, non-student millennials acted more like other millennials in regards to their use of P2P. Thus, P2P may help low-income populations in improving their access to a car, but there is a relationship to age, at least among these early adopters. It should be noted that low-income, non-millennials reported on fewer rental trips (n=142) than most of the other groups, but they had the highest number of rental trips per renter. This may mean that a few respondents could have skewed the findings some. Still, in looking at the economic opportunity of P2P, it does appear that P2P helps some low-income people in their work activity. Considering the time burden commuting by public transportation can be on low-income families, having access to a car, even if they do not own it, can help them in making time for other things.
Figure 23 Primary Rental Purpose by Renter Demographic Groups
To further demonstrate how demographic groups were using P2P carsharing differently from one another, we asked renters how they would have made the rental trip if Getaround were not available. The results are shown in Figure 24. Low-income, non-millennials showed how utilitarian their rental trips were.
0%
10%
20%
30%
40%
50%
60%
70%
80%
90%
100%
StudentMillennials(188 Trips)
Non-StudentMillennials(238 Trips)
Lower-IncomeNon-Millennials
(142 Trips)
Higher-IncomeNon-Millennials
(203 Trips)
Lower-IncomeNon-Student
Millennial(118 Trips)
Other
Recreation (In Town)/Special Event
Recreation (Out of Town)
Visiting Family
Visiting Friends
Transporting Pets
Transporting Things
Transporting Friends
Transporting Family
Medical Appointments
Appointments (Non Medical)
Shopping/Errands
Job Seeking/Interview
Work Related
Peer-to-Peer Carsharing: Short-term effects on travel behavior Page 128
Millennials reported they were likely to not have taken the trip at all for between 40-50% of their trips, likely due to their high share of recreation-related rentals. In contrast, low-income, non-millennials said they would not have taken the trip for only 16% of their rentals. Additionally, low-income, non-millennials were the most likely to ask someone to borrow a car (20% of trips) or take public transit (30% of trips). In some areas of transportation research, the tradeoff of transit trips for vehicle trips could be concerning, but as mentioned above, dependence on transit can unfairly burden low-income populations and leave them lagging economically. Given the higher cost, it is likely that the lower-income renters are using P2P vehicles for trips where transit would be particularly time-consuming, inconvenient, or unreliable.
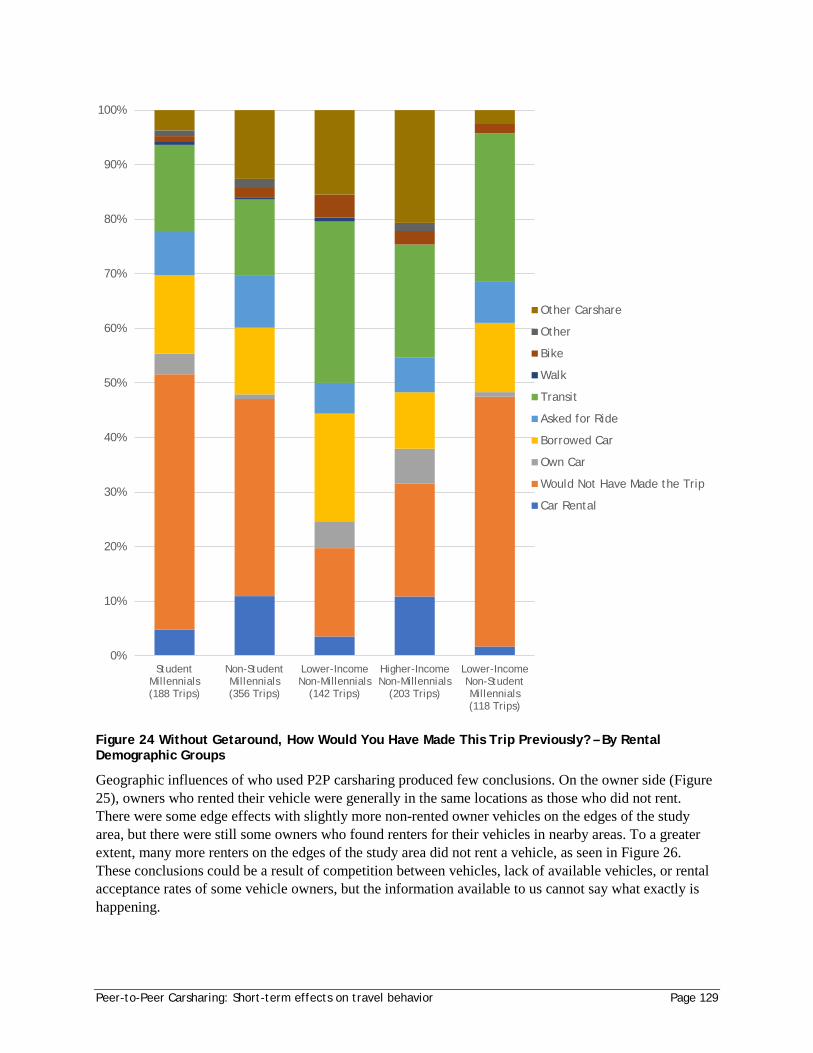
Peer-to-Peer Carsharing: Short-term effects on travel behavior Page 129
Figure 24 Without Getaround, How Would You Have Made This Trip Previously? – By Rental Demographic Groups
Geographic influences of who used P2P carsharing produced few conclusions. On the owner side (Figure 25), owners who rented their vehicle were generally in the same locations as those who did not rent. There were some edge effects with slightly more non-rented owner vehicles on the edges of the study area, but there were still some owners who found renters for their vehicles in nearby areas. To a greater extent, many more renters on the edges of the study area did not rent a vehicle, as seen in Figure 26. These conclusions could be a result of competition between vehicles, lack of available vehicles, or rental acceptance rates of some vehicle owners, but the information available to us cannot say what exactly is happening.
0%
10%
20%
30%
40%
50%
60%
70%
80%
90%
100%
StudentMillennials(188 Trips)
Non-StudentMillennials(356 Trips)
Lower-IncomeNon-Millennials
(142 Trips)
Higher-IncomeNon-Millennials
(203 Trips)
Lower-IncomeNon-StudentMillennials(118 Trips)
Other Carshare
Other
Bike
Walk
Transit
Asked for Ride
Borrowed Car
Own Car
Would Not Have Made the Trip
Car Rental
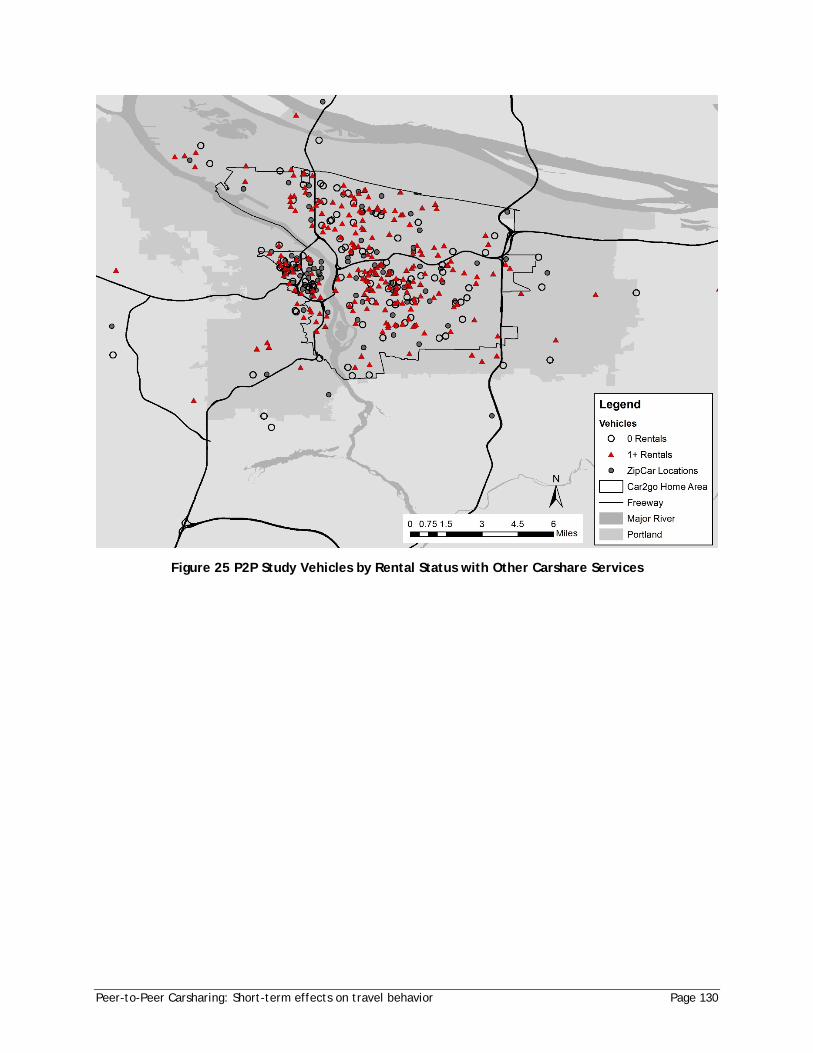
Peer-to-Peer Carsharing: Short-term effects on travel behavior Page 130
Figure 25 P2P Study Vehicles by Rental Status with Other Carshare Services
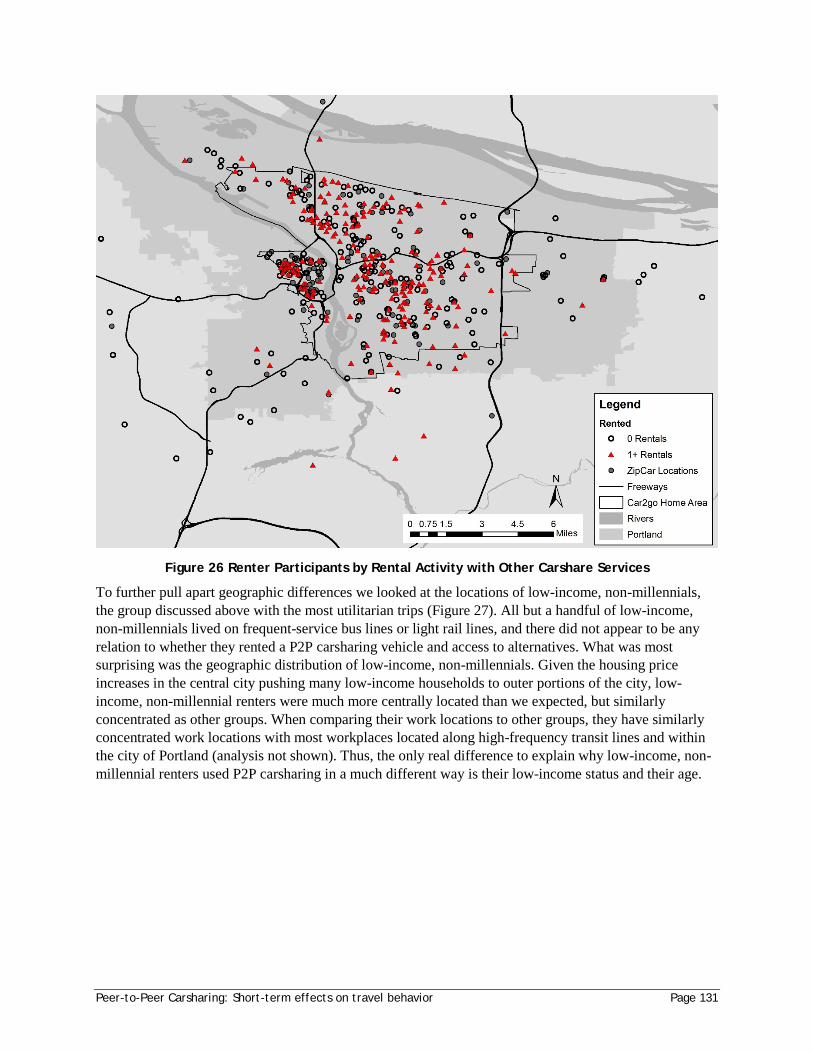
Peer-to-Peer Carsharing: Short-term effects on travel behavior Page 131
Figure 26 Renter Participants by Rental Activity with Other Carshare Services
To further pull apart geographic differences we looked at the locations of low-income, non-millennials, the group discussed above with the most utilitarian trips (Figure 27). All but a handful of low-income, non-millennials lived on frequent-service bus lines or light rail lines, and there did not appear to be any relation to whether they rented a P2P carsharing vehicle and access to alternatives. What was most surprising was the geographic distribution of low-income, non-millennials. Given the housing price increases in the central city pushing many low-income households to outer portions of the city, low-income, non-millennial renters were much more centrally located than we expected, but similarly concentrated as other groups. When comparing their work locations to other groups, they have similarly concentrated work locations with most workplaces located along high-frequency transit lines and within the city of Portland (analysis not shown). Thus, the only real difference to explain why low-income, non-millennial renters used P2P carsharing in a much different way is their low-income status and their age.
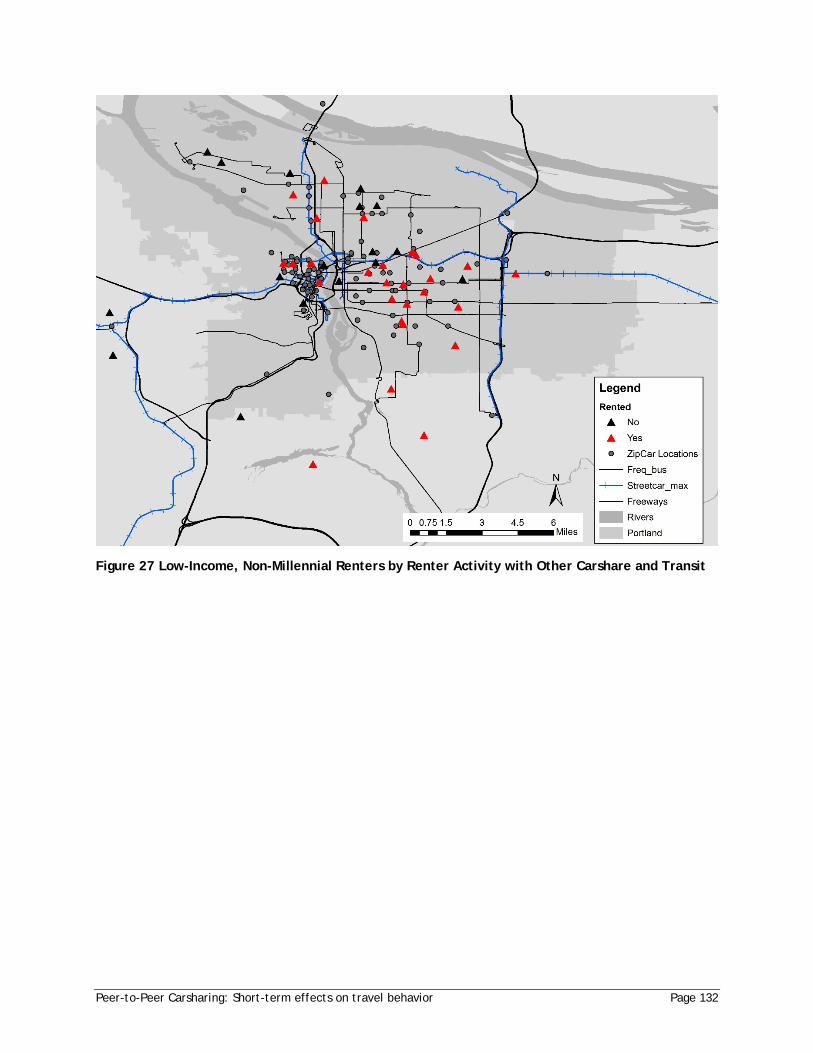
Peer-to-Peer Carsharing: Short-term effects on travel behavior Page 132
Figure 27 Low-Income, Non-Millennial Renters by Renter Activity with Other Carshare and Transit
Peer-to-Peer Carsharing: Short-term effects on travel behavior Page 133
10 CONCLUSIONS
10.1 Owner Key findings
Overall, vehicle owners made very few changes to their driving behavior, according to the GPS data (Table 40). The changes they did make were marginal and not usually in the anticipated direction. On average, owners did not decrease the portion of their driving activity that occurred during the weekday peak periods. Moreover, the average amount of time owners drove their vehicle during the weekday peak increased by nearly two minutes per day. There was a similar increase in the average time driving during the off-peak on weekdays. Other data indicate that traffic congestion does not explain these changes.
Including the rental activity, average use of the P2P vehicles was about eight minutes per day higher one year after the baseline, with most of that increase attributed to rental activity. The largest increases occurred during the weekend, when average daily use went from about 52 minutes to about 60 minutes a year later. Self-reported changes based on survey data confirm that many did not change their travel behavior much, either because they didn’t drive the vehicle much or because they just didn’t change how they drove it. This seems consistent with findings that a considerable portion of participants never rented out their vehicles (27%), or rented infrequently (another 28% rented their vehicles out fewer than five times).
While overall owners did not reduce their peak-period driving, a subset (37%) did decrease their driving during weekday peak periods by 10% or more one year after the baseline. Participants who rented out their vehicle more were somewhat more likely to decrease peak-period driving than those who rented their vehicle between one and nine times. Both groups were more likely to decrease their peak-period driving than those who didn’t ever rent out their vehicle. However, for all rental activity groups, about half of owners increased their driving in the peak period over time. Also of note is that owners who drove more to begin with were less likely to rent out their vehicle.
The survey data show that a considerable number of owner participants did make some behavioral changes, with around half indicating that they worked to find new ways to get around during rentals, left the vehicle at home to be rented, planned trips more efficiently, and took care to leave the car with a full tank of gas. Quite a few participants also reported increased use of alternative modes such as walking, bicycling and taking public transit. Interviews with owner participants and survey responses indicate that participation in P2P carsharing helped those who already wanted to make certain changes, such as driving less and taking other modes of transportation such as transit, walking and bicycling, to actually make those changes.
Overall, we detected only very marginal changes in peak-period freeway driving. However, our results were limited by the fact that our sample of vehicle owners lived in the city of Portland, and most work in Portland as well. Our data showed only 2.3% of all owner trips occurred in the peak period and on a freeway. In contrast, people living in the suburban areas surrounding Portland might be more inclined to use freeways. Renters had a very marginal effect by increasing the share of peak-period trips that occurred on a freeway by one percentage point, and the share of peak-period mileage on the freeways by less than two percentage points. The influence renters had on miles of freeway travel per day in the peak period was only about three miles more of peak-period freeway travel per 90-day period.
The level of rental activity likely influences changes in owner behavior. Overall, the vehicles in our study were not rented very often. Over one-quarter (27%) were not rented at all during the study period of
Peer-to-Peer Carsharing: Short-term effects on travel behavior Page 134
over one year, while another 28% were rented less than five times. Only 22% of the vehicles were rented once a month or more. With this low volume of rental activity, it is not surprising that owners did not change their driving behavior significantly. However, there was some indication that owners with a higher number of rentals were slightly more likely to decrease their peak-period driving.
Whether or not a vehicle is rented a lot is likely influenced by the attitudes of the owner. Interviews with owner participants also revealed that those who rented their vehicles out frequently were inclined to plan their schedules out in advance to either make their car available, or to not depend on their car when a rental was requested. Further, they were not that concerned with things happening to their cars, or at least didn’t let it bother them that much. They also generally indicated positive customer service experiences when there were issues or damage to the vehicles. In contrast, owners who did not rent out their car often were more likely to deny rental requests, either because they were too busy, needed the car during the requested time, or wanted to keep open the option of using the car at all times (regardless of need). Many were also too concerned about potential damage to the vehicle and not knowing who was renting their car to go through with rentals.
Overall, owners had a positive experience with sharing their vehicles, though with some reservations. Over 85% of the owners surveyed were happy that their car was being used more and satisfied with how is was treated when rented. However, 84% indicated that they did not get enough rentals, and 49% indicated that renting out their car was a hassle and not worth it. These concerns might be reduced with the instant rental option, a larger customer base, and improvements to the technology. Earning money, being more efficient with resources, and helping people were identified by owners as the best things about P2P carsharing.
Some owners used P2P as a catalyst to change travel behavior. Quite a few participants (28-32%) reported increased use of modes such as walking, bicycling and public transit. Interviews with owner participants and survey responses indicate that participation in P2P carsharing helped those who already wanted to make certain changes, such as driving less and taking other modes of transportation, to actually make those changes. Interviews confirmed that, among those who rented out their car often, a primary motivator was the desire to use that car less frequently in favor of other options.
10.2 Renter Key Findings
Renters used the service for a variety of trips, with out-of-town recreation being most common. Of the nearly 900 trips on which we received survey responses, 24% were primarily for out-of-town recreation, 21% were work-related, and 14% were for shopping or errands. The high percentage of rentals that were for work-related purposes was surprising considering renters stated work-related trips as being one of the least likely purposes for their rentals. Many respondents used the vehicles for trip-chaining; 47% of all trips had one or more secondary purposes listed. Shopping and/or errands were the most common secondary purpose, followed by transporting family, transporting friends and in-town recreation.
Many of the trips made by renters would not have been made without the P2P carsharing service, though this varies by trip purpose. Survey respondents indicated that about a third of the trips would not have been taken otherwise, while about 20% would have been on public transportation, 19% via another carshare or rental service, and about 22% would have borrowed a car or asked for a ride. Out-of-town recreation, visiting friends and in-town recreation were the most likely to have not been made absent Getaround. This makes sense as these are generally trips of choice/leisure. Work-related trips, shopping and errands, and appointments were more likely to be made via public transportation absent Getaround.
Peer-to-Peer Carsharing: Short-term effects on travel behavior Page 135
Meanwhile borrowing a car was a more popular alternative for trips requiring transporting things or family members.
In general, renters expressed positive views toward the service. Nearly 90% agreed that the P2P service allowed for increased flexibility in planning trips, and was useful for running errands and transporting things. A similarly high share (85%) agreed that it helped them to save money by not having to pay for a car (with 42% strongly agreeing), while 62% agreed that it helped them assess whether they could manage without a car. Renters were asked how satisfied they were with the vehicle and with the rental process for each rental – 79-80% stated they were very satisfied, with most of the rest being somewhat satisfied with both. All renter participants were asked to describe what they believed were the best and worst things about peer-to-peer carsharing. The most commonly referenced “best” part of carsharing was the sense that they were supporting the local, or sharing, economy (26%). The next two most common answers dealt with personal benefits relating to convenience and cost compared to other car rental services. The most commonly referenced negative elements of carsharing were the lack of owner accountability to responding to or honoring reservations/requests from renters (33%), and the lack of general availability and/or an unclear scheduling process (24%).
Carsharing, including P2P carsharing, helps support no- or low-car ownership households. On a number of questions, respondents indicated carsharing options were beneficial, including that carsharing allowed them to live without a car (90% agree overall); that carsharing is cheaper than owning a car (85% agree overall); and that the multiple services allow them to access a car when they want or need one (93% agree overall). More specifically, 13% strongly agreed that if it were not for carsharing, they would likely buy a car.
P2P carsharing may provide a valuable service for lower-income households. Our analysis of the geographic distribution of carsharing vehicles indicates that P2P services have the potential to reach a greater number of lower-income households, though this is dependent on frequently shifting services. In addition, the older (over 35 years), lower-income renters were more likely to use the service for trips of greater utilitarian value, particularly work-related trips. Unlike many of the renters, they were not using the service for many recreational trips that otherwise might not have been made. These findings, however, are based on a limited sample and a service in its early stages of operation. The potential to serve lower-income households will depend on whether vehicles are located near where lower-income people live. This depends, in part on how the P2P providers price and market the service.
10.3 Research Challenges
We encountered several challenges in implementing this study. First, because P2P carsharing is a new model, the system worked through a number of early changes and included dramatic updates to the model by the conclusion of the study – namely, the switch from the request-style system to the instant system. Further, participants were likely to be drawn largely from the “early-adopter” subset of residents, a group that may differ from the broader population.
Perhaps most importantly, demand for rentals was low, particularly in areas outside of the inner Portland neighborhoods. This may be due to the newness of the system and concept or to other factors, possibly including the less dense nature of Portland compared to Getaround’s initial launching area of San Francisco. Low demand, in turn, made studying the effects of participation in P2P schemes challenging. Low enrollment in target areas of East Portland made the study’s initial goal of understanding the impact of P2P carsharing in lower-income areas and areas less served by other forms of transit and carsharing all but impossible.
Peer-to-Peer Carsharing: Short-term effects on travel behavior Page 136
The data collection efforts through the Carkits led to limitations in the data we had available to analyze. Carkits were programmed to record a GPS point once every two minutes as well as a point for every time the vehicle was turned on and off. This presented limitations in how accurate any mileage calculations could be as two minutes of travel covers considerable distance, making it difficult to determine possible routes used. As such, we opted to present most of the analysis for the Carkit data in terms of trips and minutes of travel.
To complicate calculations, there were numerous errors with the data. Since the Carkits were dependent upon cell-tower networks, connection timing problems as well as lack of cell-tower coverage or interference prevented consistent and accurate recording of when trips started and ended as well as some loss of data during travel. Some amount of data loss was attributed to such errors, but additional data loss was attributed to errors for which neither we nor Getaround could account. Although the numerous errors presented problems with using the data, the data cleaning methods employed for this study resulted in data high enough in quality for analysis with a tolerable level of error.
Peer-to-Peer Carsharing: Short-term effects on travel behavior Page 137
11 REFERENCES AND RELEVANT RESOURCES Ballús-Armet, Ingrid, Susan Shaheen, Kelly Clonts, and David Weinzimmer, Peer-to-peer Carsharing:
Exploring Public Perception and Market Characteristics in the San Francisco Bay Area. Transportation Research Record: Journal of the Transportation Research Board, No 2416, Transportation Research Board of the National Academies, Washington, D.C., 2014, pp. 27-36.
Barter, Paul. Cars are parked 95% of the time: Let's Check! Reinventing Parking. http://www.reinventingparking.org/2013/02/cars-are-parked-95-of-time-lets-check.html. Accessed July 24, 2014.
Baumeister, Christoph and Wangenheim, Florian V., Access vs. Ownership: Understanding Consumers’ Consumption Mode Preference (July 7, 2014). Available at SSRN: http://ssrn.com/abstract=2463076 or http://dx.doi.org/10.2139/ssrn.2463076
Bear, Charlie. Let A Stranger Drive Your Car? More Owners Say 'Yes', NPR News, March 6, 2012. Transcript accessed online 7/31/13 at www.npr.org/templates/transcript/transcript.php?storyId=147962028
Belk, Russell. You are what you can access: Sharing and Collaborative consumption online. Journal of Business Research, Vol. 67, 2014, pp 1595-1600.
Birdsall, Michelle. Carsharing in a Sharing Economy. ITE Journal, Vol. 84, No. 4, Institute of Transportation Engineers, 2014, pp. 37-40.
Blumenberg, Evelyn and Paul Ong. Cars, Buses, and Jobs: Welfare Participants and Employment Access in Los Angeles. Transportation Research Record: Journal of the Transportation Research Board, No 1756, Transportation Research Board of the National Academies, Washington, D.C., 2001, pp. 22-31.
Blumenberg, Evelyn, Gregory Pierce, and Michael Smart. Transportation Access, Residential Location, and Economic Opportunity: Evidence from Two Housing Voucher Experiments. Cityscape: A Journal of Policy Development and Research. Vol. 17, No. 2, 2015, pp. 89-111.
Burkhardt, Jon., and Adam Millard-Ball. Who is attracted to carsharing? Transportation Research Record: Journal of the Transportation Research Board, No. 1986, 2006, pp. 98-105.
Cervero, Robert., Nina Creedman, Muhammed Pohan, and Madhav Pai. City CarShare: Assessment of Short-Term Travel-Behavior Impacts. Department of Transportation and Parking, City of Francisco, May 2002.
Cervero, Robert, Aaron Golub, and Brendan Nee. City CarShare: Longer-Term Travel Demand and Car Ownership Impacts. In Transportation Research Record: Journal of the Transportation Research Board, No. 1992, Transportation Research Board of the National Academies, Washington, D.C., 2007, pp. 70–80.
Cervero, Robert, and Yuhsin Tsai. City CarShare in San Francisco, California: Second-Year Travel Demand and Car Ownership Impacts. In Transportation Research Record: Journal of the Transportation Research Board, No. 1887, Transportation Research Board of the National Academies, Washington, D.C., 2004, pp. 117–127.
Peer-to-Peer Carsharing: Short-term effects on travel behavior Page 138
City of Portland. Sidewalks. Portland Bureau of Transportation. 2015. Accessed November 25, 2015 at https://www.portlandoregon.gov/transportation/65323.
City of Portland. 2014 Portland Traffic Safety Report. Portland Bureau of Transportation. 2015b. Accessed November 25, 2015 at https://www.portlandoregon.gov/transportation/article/524195.
Clark, Matthew, Kate Gifford, and Scott Le Vine. The usage and impacts of emerging carsharing business models: Evidence from the peer-to-peer and business-to-business market segments. Transportation Research Board 93rd Annual Meeting, Transportation Research Board, Washington, DC, 2014.
Cooper, Gigi, Deborah Howe, and Peter Mye. The Missing Link: An Evaluation of CarSharing Portland Inc., Portland, Oregon. Oregon Department of Environmental Quality and CarSharing Portland, March 2000.
Costain, Cindy, Carolyn Ardron, and Khandker Nurul Habib. Synopsis of users’ behaviour of a carsharing program: A case study in Toronto. In Transportation Research Part A, No. 46, 2012, pp. 421–434.
Dill, Jennifer and Nathan McNeil. Four Types of Cyclists? Examination of Typology for Better Understanding of Bicycling Behavior and Potential. Transportation Research Record: Journal of the Transportation Research Board, No. 2387, Transportation Research Board of the National Academies, Washington, D.C., 2013, pp. 129-138.
Dill, Jennifer, Steven Howland, and Nathan McNeil. Peer-to-Peer Carsharing: A Preliminary Analysis of Vehicle Owners in Portland, Oregon, and the Potential to Meet Policy Objectives. In Transportation Research Board 93rd Annual Meeting, Transportation Research Board, Washington, DC, 2014.
Efthymiou, Dimitrios, Constantinos Antoniou, and Paul Waddell. Factors affecting the adoption of vehicle sharing systems by young drivers. Transport Policy, Vol. 29, 2013, pp. 64-73.
Frost and Sullivan. Rapid Growth of the Market for Carsharing in North America Unleashes New Business Opportunities. Market Research Report. 2010. Available at http://www.frost.com/prod/servlet/report-overview.pag?repid=N748-01-00-00-00
Graham, Jefferson. Need a car? Mine's for rent; Peer-to-peer carsharing takes off. USA Today. December 6, 2012, page 4B.
Grengs, Joe. Job Accessibility and The Modal Mismatch in Detroit. Journal of Transport Geography, Vol. 18, No. 1, 2010, pp. 42-54.
Hamari, Juno, Mimmi Sjöklint, and Antti Ukkonen. The Sharing Economy: Why People Participate in Collaborative Consumption. Journal of the Association for Information Science and Technology. Available at SSRN: http://ssrn.com/abstract=2271971 or http://dx.doi.org/10.2139/ssrn.2271971
Hampshire, Robert C. and Craig Gaites. Peer-to-Peer Carsharing: Market Analysis and Potential Growth. In Transportation Research Record: Journal of the Transportation Research Board, No. 2217, Transportation Research Board of the National Academies, Washington, D.C., 2011, pp. 119-126.
Peer-to-Peer Carsharing: Short-term effects on travel behavior Page 139
Interrante, Erica. The Next Generation of Travel: Research, Analysis and Scenario Development. FHWA 39 Office of Policy and Governmental Affairs, Transportation Studies (HPTS), November 2011. http://www.fhwa.dot.gov/policy/otps/nextgen_finalreport.cfm
Kodranksy, Michael, and Gabriel Lewenstein. Connecting Low-Income People to Opportunity with Shared Mobility. Institute for Transportation and Development Policy, Report. 2014.
Lewis, Aaron, and Mark Simmons. P2P Carsharing Service Design: Informing User Experience Development. Master’s Thesis, 2012, Blekinge Institute of Technology, Karlskrona, Sweden.
Katzev, Richard. CarSharing Portland: Review and Analysis of Its First Year. Oregon Department of Environmental Quality, Portland, 1999.
Katsev, Richard, David Brook, and Matthew Nice. The effects of carsharing on travel behaviour: analysis of CarSharing Portland’s first year. World Transport Policy & Practice, Volume 6, Number 3, (2000) 20-26.
Lane, Clayton. PhillyCarShare: First-Year Social and Mobility Impacts of Carsharing in Philadelphia, Pennsylvania. In Transportation Research Record: Journal of the Transportation Research Board, No. 1927, Transportation Research Board of the National Academies, Washington, D.C., 2005, pp. 158-166.
Martin, Andrew. Carsharing Catches On In Avis Deal To Buy Zipcar. The New York Times, January 3, 2013, Page B1.
Martin, Elliot, and Susan A. Shaheen. The Impact of Carsharing on Public Transit and Non-Motorized Travel: An Exploration of North American Carsharing Survey Data. Energies, Vol. 4, 2010, pp. 2094-2114.
Martin, Elliot, and Susan A. Shaheen. Greenhouse Gas Emission Impacts of Carsharing in North America. In IEEE Transactions on Intelligent Transportations Systems, Vol. 12, No. 4, 2011, pp. 1074-1086.
Martin, Elliot, Susan A. Shaheen, and Jeffrey Lidicker. Impact of Carsharing on Household Vehicle Holdings: Results from North American Shared Use Vehicle Survey. In Transportation Research Record: Journal of the Transportation Research Board, No. 2143, Transportation Research Board of the National Academies, Washington, D.C., 2010, pp. 150–158.
Millard-Ball, Adam, Gail Murray, Jon Burkhardt, Jessica ter Schure. Car-sharing: Where and How it Succeeds Final Report. In TCRP Project B-26, TRB National Research Council, Washington, D.C., 2005.
Oakil, Abue Toasin Md, Dick Ettema, Theo Arentze, and Harry Timmermans. Changing household car ownership level and life cycle events: an action in anticipation or an action on occurrence. Transportation, 2013, p. 1-16.
Pendall, Rolf, Christopher Hayes, Arthur (Taz) George, Zach McDade, Casey Dawkins, Jae Sik Jeon, Eli
Knapp, Evelyn Blumenberg, Gregory Pierce, and Michael Smart. Driving to Opportunity: Understanding the Links Among Transportation Access, Residential Outcomes, and Economic Opportunity for Housing Voucher Recipients. Urban Institute, Washington, D.C., 2014.
Peer-to-Peer Carsharing: Short-term effects on travel behavior Page 140
Price, Jeff, Paul DeMaio, and Chris Hamilton. Arlington Carshare Program: 2006 Report. Arlington County Commuter Services, Division of Transportation, Department of Environmental Services, Arlington, Va., June 2006.
Raphael, Steven, Michael A. Stoll, Kenneth A. Small and Clifford Winston. Can Boosting Minority Car-Ownership Rates Narrow Inter-Racial Employment Gaps? Brookings-Wharton Papers on Urban Affairs, 2001, pp. 99-145.
Ravindranath, Mohana. A Personal take on Carsharing. Washington Post, January 7, 2013, page A03.
Rose, Joseph. Has the Portland area’s growing light-rail system been worth the investment? The Oregonian, May 6, 2014. Accessed November 25, 2015 at http://www.oregonlive.com/commuting/index.ssf/2014/05/has_the_portland_areas_growing.html
Shaheen, Susan A., and Adam P. Cohen. Carsharing and Personal Vehicle Services: Worldwide Market Developments and Emerging Trends. International Journal of Sustainable Transportation, Vol. 7, No. 1, 2012, pp. 5-34.
Shaheen, Susan A., Adam P. Cohen, and Melissa S. Chung. North American Carsharing: 10-Year Retrospective. In Transportation Research Record: Journal of the Transportation Research Board, No. 2110, Transportation Research Board of the National Academies, Washington, D.C., 2009, pp. 35–44.
Shaheen, Susan A., and Caroline Rodier. Travel effects of a suburban commuter carsharing service: CarLink case study. Transportation Research Record: Journal of the Transportation Research Board, Vol. 1927, No. 1, 2005, pp. 182-188.
Shaheen, Susan A., Mark A. Mallery, and Karla J. Kingsley. Personal Vehicle Sharing Services in North America. Research in Transportation Business & Management 3, (2012): 71-81.
Shellooe, Stephanie D. Wheels when who wants them: Assessing Social Equity and Access Implications of Carsharing in NYC. In Faculty of Architecture and Planning, No. Master of Science and Urban Planning, Columbia University, New York City, 2013.
Sioui, Louiselle, Catherine Morency, and Martin Trépanier. How Carsharing Affects the Travel Behavior of Households: A Case Study of Montréal, Canada. International Journal of Sustainable Transportation, Vol. 7, No. 1, 2013, pp. 52-69.
Stillwater, Tai, Patricia L. Mokhtarian, and Susan A. Shaheen. Carsharing and the Built Environment Geographic Information System–Based Study of One U.S. Operator. Transportation Research Record: Journal of the Transportation Research Board, No. 2110, Transportation Research Board of the National Academies, Washington, D.C., 2009, pp. 27–34.
Stross, Randall. Lending Your Car to Strangers (for Cash). New York Times, February 19, 2012, page BU4.
The Center for a New American Dream (TCFANAD). Analysis Report: New American Dream Survey 2014. http://newdream.s3.amazonaws.com/19/d9/7/3866/NewDreamPollFinalAnalysis.pdf. Accessed July 31, 2014, 2014.
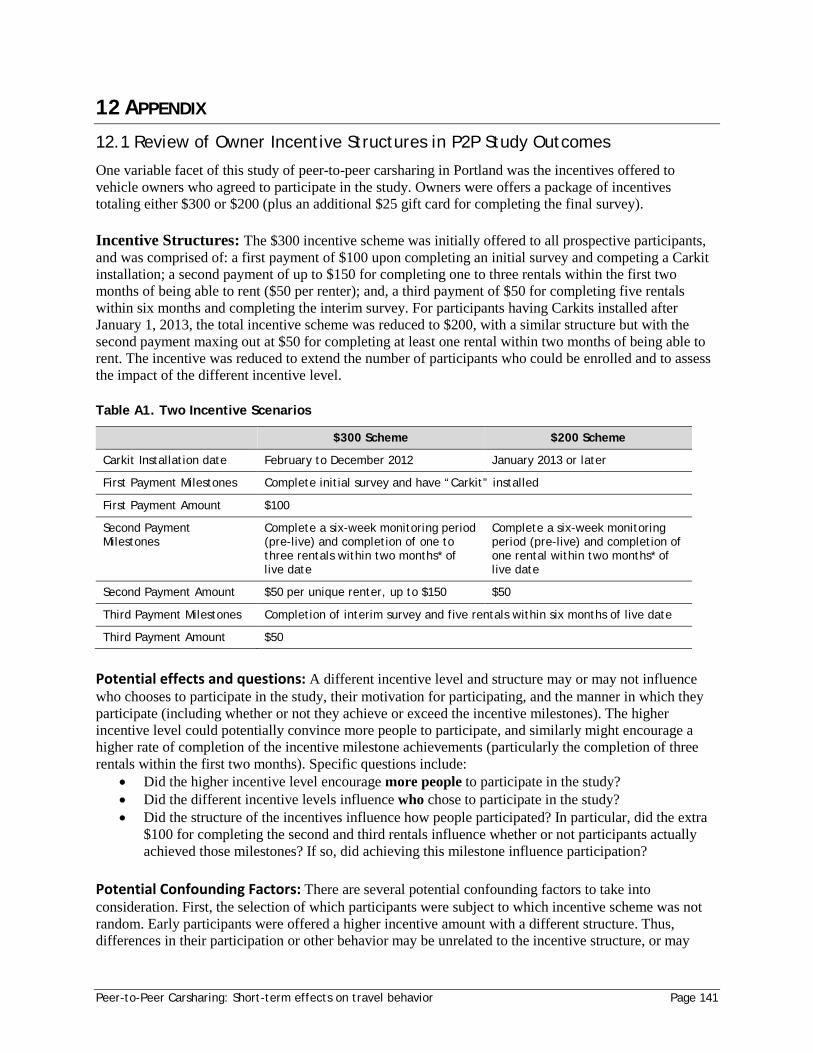
Peer-to-Peer Carsharing: Short-term effects on travel behavior Page 141
12 APPENDIX
12.1 Review of Owner Incentive Structures in P2P Study Outcomes
One variable facet of this study of peer-to-peer carsharing in Portland was the incentives offered to vehicle owners who agreed to participate in the study. Owners were offers a package of incentives totaling either $300 or $200 (plus an additional $25 gift card for completing the final survey). Incentive Structures: The $300 incentive scheme was initially offered to all prospective participants, and was comprised of: a first payment of $100 upon completing an initial survey and competing a Carkit installation; a second payment of up to $150 for completing one to three rentals within the first two months of being able to rent ($50 per renter); and, a third payment of $50 for completing five rentals within six months and completing the interim survey. For participants having Carkits installed after January 1, 2013, the total incentive scheme was reduced to $200, with a similar structure but with the second payment maxing out at $50 for completing at least one rental within two months of being able to rent. The incentive was reduced to extend the number of participants who could be enrolled and to assess the impact of the different incentive level. Table A1. Two Incentive Scenarios
$300 Scheme $200 Scheme
Carkit Installation date February to December 2012 January 2013 or later
First Payment Milestones Complete initial survey and have “Carkit” installed
First Payment Amount $100
Second Payment Milestones
Complete a six-week monitoring period (pre-live) and completion of one to three rentals within two months* of live date
Complete a six-week monitoring period (pre-live) and completion of one rental within two months* of live date
Second Payment Amount $50 per unique renter, up to $150 $50
Third Payment Milestones Completion of interim survey and five rentals within six months of live date
Third Payment Amount $50
Potential effects and questions: A different incentive level and structure may or may not influence who chooses to participate in the study, their motivation for participating, and the manner in which they participate (including whether or not they achieve or exceed the incentive milestones). The higher incentive level could potentially convince more people to participate, and similarly might encourage a higher rate of completion of the incentive milestone achievements (particularly the completion of three rentals within the first two months). Specific questions include:
• Did the higher incentive level encourage more people to participate in the study? • Did the different incentive levels influence who chose to participate in the study? • Did the structure of the incentives influence how people participated? In particular, did the extra
$100 for completing the second and third rentals influence whether or not participants actually achieved those milestones? If so, did achieving this milestone influence participation?
Potential Confounding Factors: There are several potential confounding factors to take into consideration. First, the selection of which participants were subject to which incentive scheme was not random. Early participants were offered a higher incentive amount with a different structure. Thus, differences in their participation or other behavior may be unrelated to the incentive structure, or may
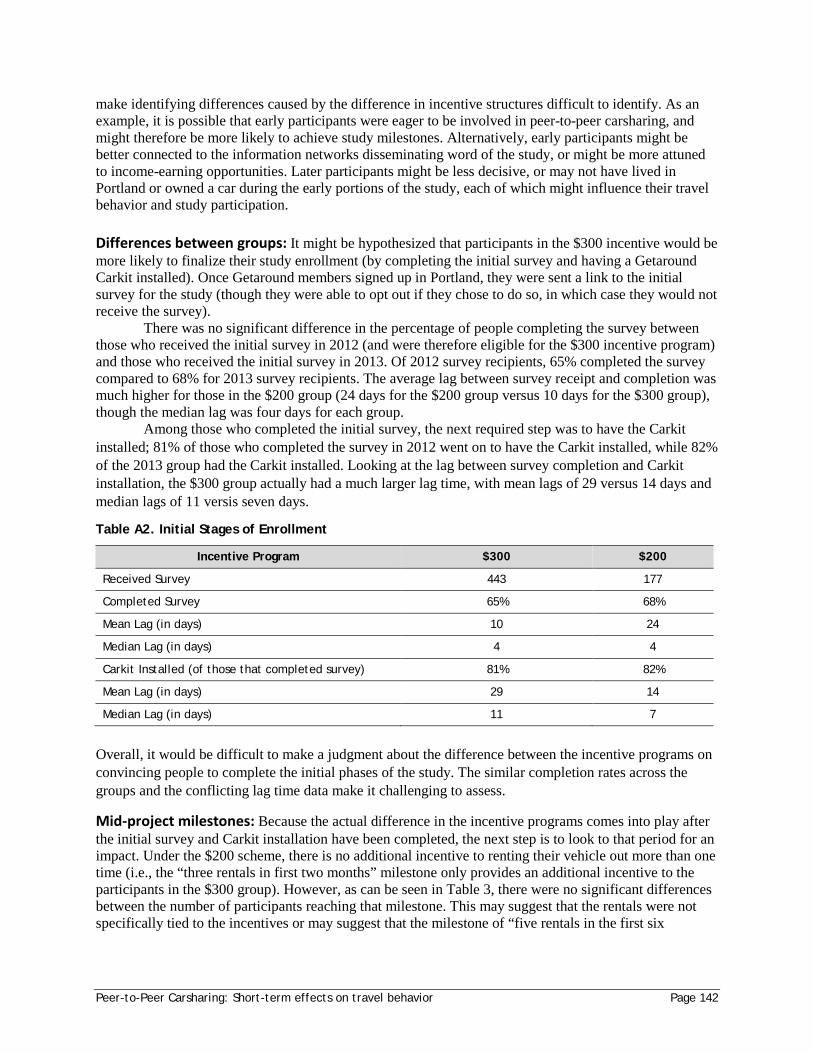
Peer-to-Peer Carsharing: Short-term effects on travel behavior Page 142
make identifying differences caused by the difference in incentive structures difficult to identify. As an example, it is possible that early participants were eager to be involved in peer-to-peer carsharing, and might therefore be more likely to achieve study milestones. Alternatively, early participants might be better connected to the information networks disseminating word of the study, or might be more attuned to income-earning opportunities. Later participants might be less decisive, or may not have lived in Portland or owned a car during the early portions of the study, each of which might influence their travel behavior and study participation.
Differences between groups: It might be hypothesized that participants in the $300 incentive would be more likely to finalize their study enrollment (by completing the initial survey and having a Getaround Carkit installed). Once Getaround members signed up in Portland, they were sent a link to the initial survey for the study (though they were able to opt out if they chose to do so, in which case they would not receive the survey).
There was no significant difference in the percentage of people completing the survey between those who received the initial survey in 2012 (and were therefore eligible for the $300 incentive program) and those who received the initial survey in 2013. Of 2012 survey recipients, 65% completed the survey compared to 68% for 2013 survey recipients. The average lag between survey receipt and completion was much higher for those in the $200 group (24 days for the $200 group versus 10 days for the $300 group), though the median lag was four days for each group.
Among those who completed the initial survey, the next required step was to have the Carkit installed; 81% of those who completed the survey in 2012 went on to have the Carkit installed, while 82% of the 2013 group had the Carkit installed. Looking at the lag between survey completion and Carkit installation, the $300 group actually had a much larger lag time, with mean lags of 29 versus 14 days and median lags of 11 versis seven days.
Table A2. Initial Stages of Enrollment
Incentive Program $300 $200
Received Survey 443 177
Completed Survey 65% 68%
Mean Lag (in days) 10 24
Median Lag (in days) 4 4
Carkit Installed (of those that completed survey) 81% 82%
Mean Lag (in days) 29 14
Median Lag (in days) 11 7
Overall, it would be difficult to make a judgment about the difference between the incentive programs on convincing people to complete the initial phases of the study. The similar completion rates across the groups and the conflicting lag time data make it challenging to assess.
Mid-project milestones: Because the actual difference in the incentive programs comes into play after the initial survey and Carkit installation have been completed, the next step is to look to that period for an impact. Under the $200 scheme, there is no additional incentive to renting their vehicle out more than one time (i.e., the “three rentals in first two months” milestone only provides an additional incentive to the participants in the $300 group). However, as can be seen in Table 3, there were no significant differences between the number of participants reaching that milestone. This may suggest that the rentals were not specifically tied to the incentives or may suggest that the milestone of “five rentals in the first six
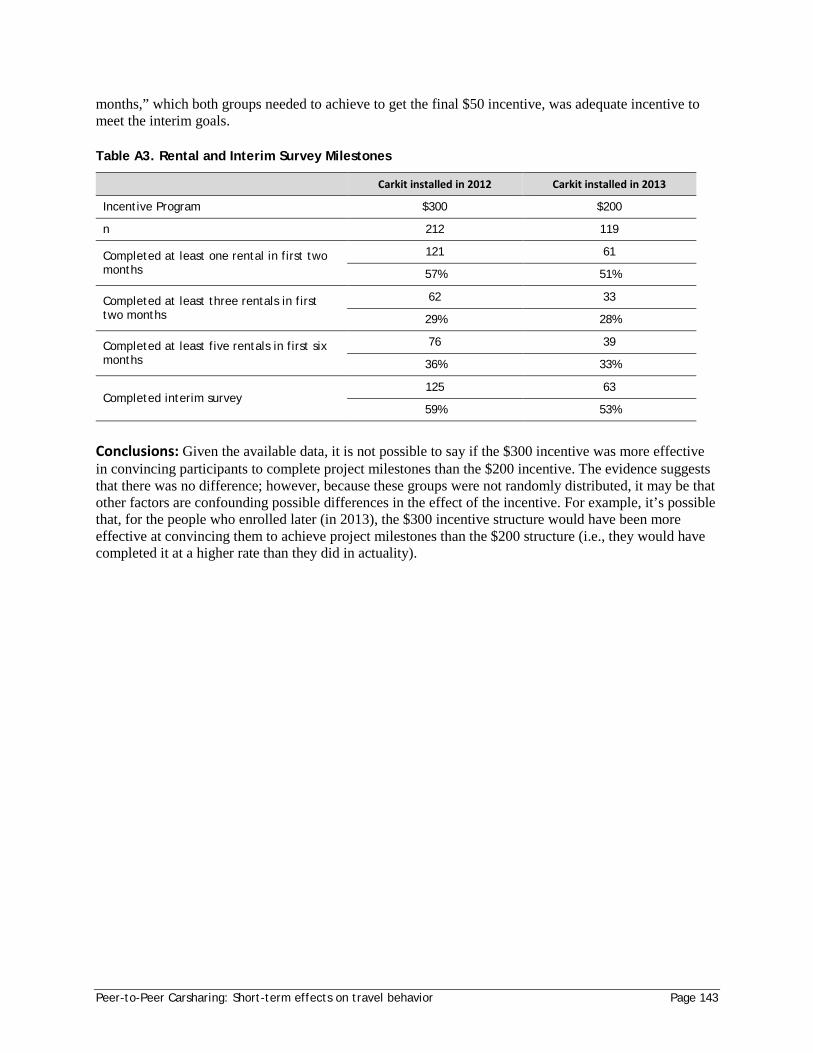
Peer-to-Peer Carsharing: Short-term effects on travel behavior Page 143
months,” which both groups needed to achieve to get the final $50 incentive, was adequate incentive to meet the interim goals. Table A3. Rental and Interim Survey Milestones
Carkit installed in 2012 Carkit installed in 2013
Incentive Program $300 $200
n 212 119
Completed at least one rental in first two months
121 61
57% 51%
Completed at least three rentals in first two months
62 33
29% 28%
Completed at least five rentals in first six months
76 39
36% 33%
Completed interim survey 125 63
59% 53%
Conclusions: Given the available data, it is not possible to say if the $300 incentive was more effective in convincing participants to complete project milestones than the $200 incentive. The evidence suggests that there was no difference; however, because these groups were not randomly distributed, it may be that other factors are confounding possible differences in the effect of the incentive. For example, it’s possible that, for the people who enrolled later (in 2013), the $300 incentive structure would have been more effective at convincing them to achieve project milestones than the $200 structure (i.e., they would have completed it at a higher rate than they did in actuality).
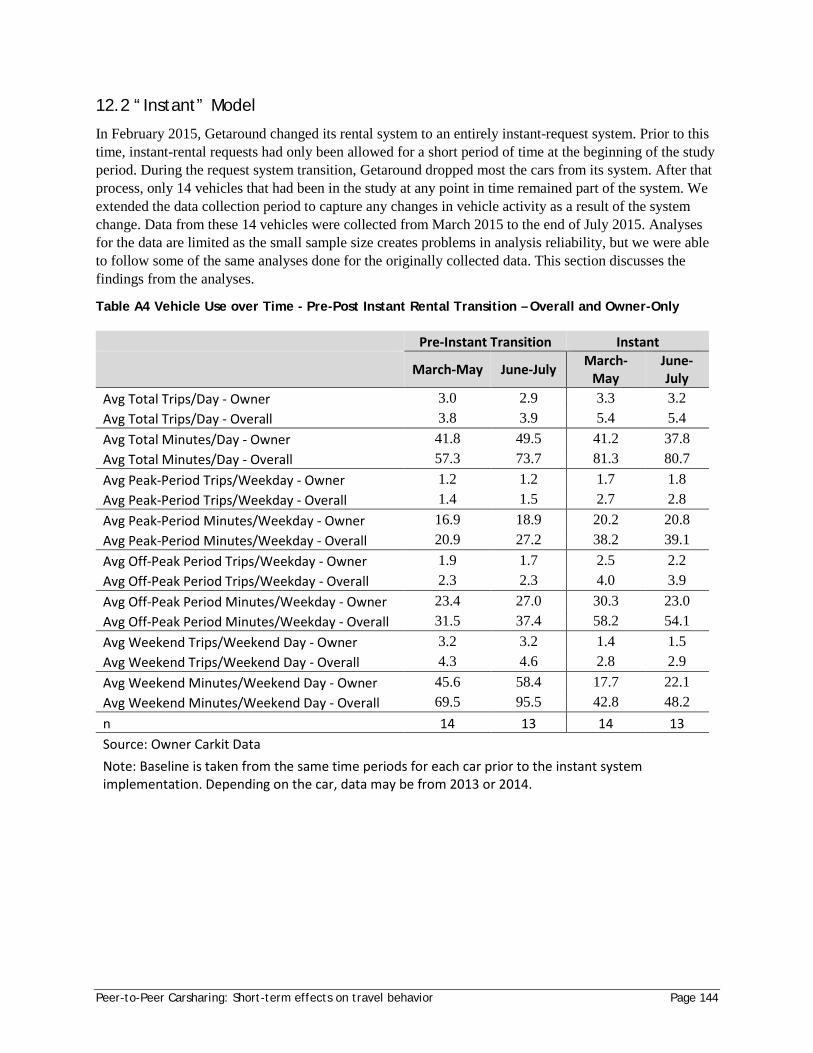
Peer-to-Peer Carsharing: Short-term effects on travel behavior Page 144
12.2 “Instant” Model
In February 2015, Getaround changed its rental system to an entirely instant-request system. Prior to this time, instant-rental requests had only been allowed for a short period of time at the beginning of the study period. During the request system transition, Getaround dropped most the cars from its system. After that process, only 14 vehicles that had been in the study at any point in time remained part of the system. We extended the data collection period to capture any changes in vehicle activity as a result of the system change. Data from these 14 vehicles were collected from March 2015 to the end of July 2015. Analyses for the data are limited as the small sample size creates problems in analysis reliability, but we were able to follow some of the same analyses done for the originally collected data. This section discusses the findings from the analyses.
Table A4 Vehicle Use over Time - Pre-Post Instant Rental Transition – Overall and Owner-Only
Pre-Instant Transition Instant
March-May June-July March-May
June-July
Avg Total Trips/Day - Owner 3.0 2.9 3.3 3.2 Avg Total Trips/Day - Overall 3.8 3.9 5.4 5.4 Avg Total Minutes/Day - Owner 41.8 49.5 41.2 37.8 Avg Total Minutes/Day - Overall 57.3 73.7 81.3 80.7 Avg Peak-Period Trips/Weekday - Owner 1.2 1.2 1.7 1.8 Avg Peak-Period Trips/Weekday - Overall 1.4 1.5 2.7 2.8 Avg Peak-Period Minutes/Weekday - Owner 16.9 18.9 20.2 20.8 Avg Peak-Period Minutes/Weekday - Overall 20.9 27.2 38.2 39.1 Avg Off-Peak Period Trips/Weekday - Owner 1.9 1.7 2.5 2.2 Avg Off-Peak Period Trips/Weekday - Overall 2.3 2.3 4.0 3.9 Avg Off-Peak Period Minutes/Weekday - Owner 23.4 27.0 30.3 23.0 Avg Off-Peak Period Minutes/Weekday - Overall 31.5 37.4 58.2 54.1 Avg Weekend Trips/Weekend Day - Owner 3.2 3.2 1.4 1.5 Avg Weekend Trips/Weekend Day - Overall 4.3 4.6 2.8 2.9 Avg Weekend Minutes/Weekend Day - Owner 45.6 58.4 17.7 22.1 Avg Weekend Minutes/Weekend Day - Overall 69.5 95.5 42.8 48.2 n 14 13 14 13 Source: Owner Carkit Data Note: Baseline is taken from the same time periods for each car prior to the instant system implementation. Depending on the car, data may be from 2013 or 2014.
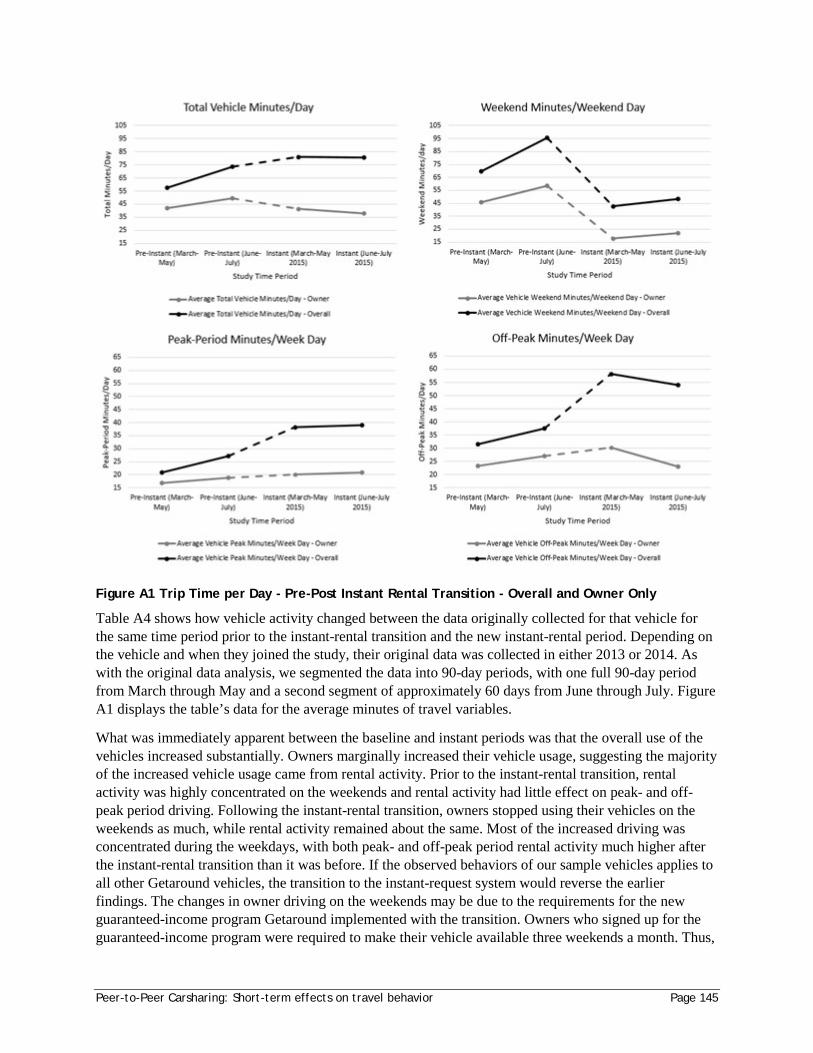
Peer-to-Peer Carsharing: Short-term effects on travel behavior Page 145
Figure A1 Trip Time per Day - Pre-Post Instant Rental Transition - Overall and Owner Only
Table A4 shows how vehicle activity changed between the data originally collected for that vehicle for the same time period prior to the instant-rental transition and the new instant-rental period. Depending on the vehicle and when they joined the study, their original data was collected in either 2013 or 2014. As with the original data analysis, we segmented the data into 90-day periods, with one full 90-day period from March through May and a second segment of approximately 60 days from June through July. Figure A1 displays the table’s data for the average minutes of travel variables.
What was immediately apparent between the baseline and instant periods was that the overall use of the vehicles increased substantially. Owners marginally increased their vehicle usage, suggesting the majority of the increased vehicle usage came from rental activity. Prior to the instant-rental transition, rental activity was highly concentrated on the weekends and rental activity had little effect on peak- and off-peak period driving. Following the instant-rental transition, owners stopped using their vehicles on the weekends as much, while rental activity remained about the same. Most of the increased driving was concentrated during the weekdays, with both peak- and off-peak period rental activity much higher after the instant-rental transition than it was before. If the observed behaviors of our sample vehicles applies to all other Getaround vehicles, the transition to the instant-request system would reverse the earlier findings. The changes in owner driving on the weekends may be due to the requirements for the new guaranteed-income program Getaround implemented with the transition. Owners who signed up for the guaranteed-income program were required to make their vehicle available three weekends a month. Thus,
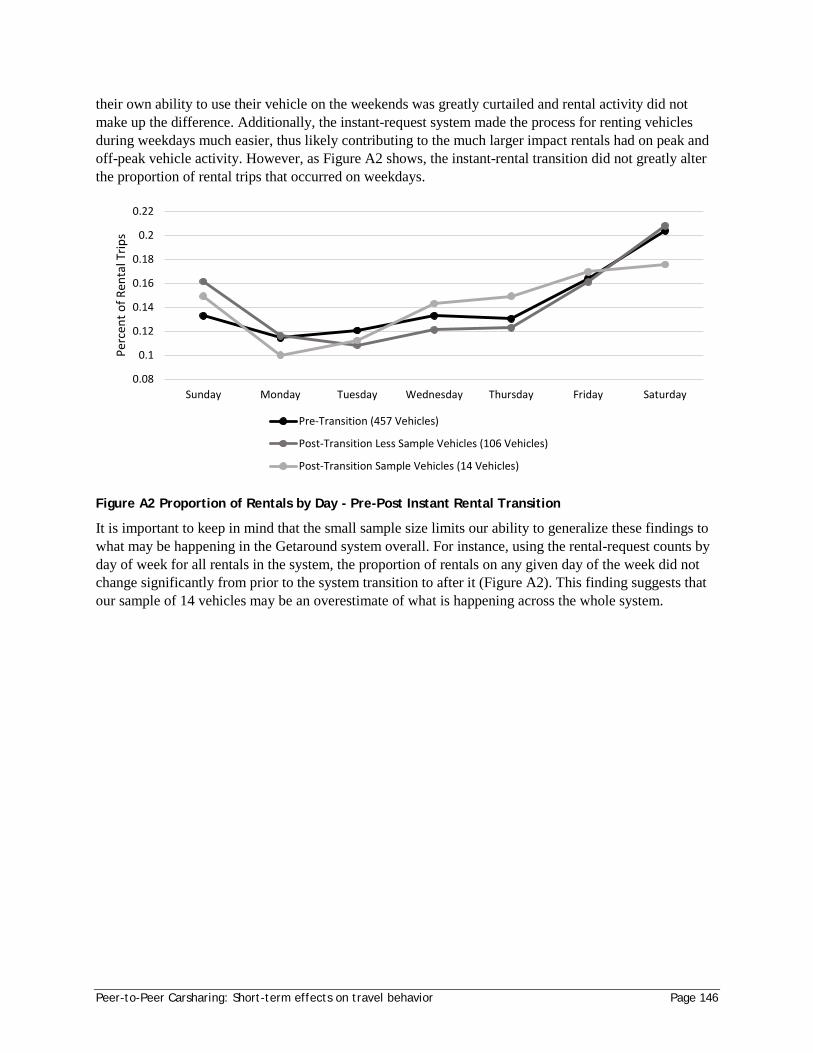
Peer-to-Peer Carsharing: Short-term effects on travel behavior Page 146
their own ability to use their vehicle on the weekends was greatly curtailed and rental activity did not make up the difference. Additionally, the instant-request system made the process for renting vehicles during weekdays much easier, thus likely contributing to the much larger impact rentals had on peak and off-peak vehicle activity. However, as Figure A2 shows, the instant-rental transition did not greatly alter the proportion of rental trips that occurred on weekdays.
Figure A2 Proportion of Rentals by Day - Pre-Post Instant Rental Transition
It is important to keep in mind that the small sample size limits our ability to generalize these findings to what may be happening in the Getaround system overall. For instance, using the rental-request counts by day of week for all rentals in the system, the proportion of rentals on any given day of the week did not change significantly from prior to the system transition to after it (Figure A2). This finding suggests that our sample of 14 vehicles may be an overestimate of what is happening across the whole system.
0.08
0.1
0.12
0.14
0.16
0.18
0.2
0.22
Sunday Monday Tuesday Wednesday Thursday Friday Saturday
Perc
ent o
f Ren
tal T
rips
Pre-Transition (457 Vehicles)
Post-Transition Less Sample Vehicles (106 Vehicles)
Post-Transition Sample Vehicles (14 Vehicles)
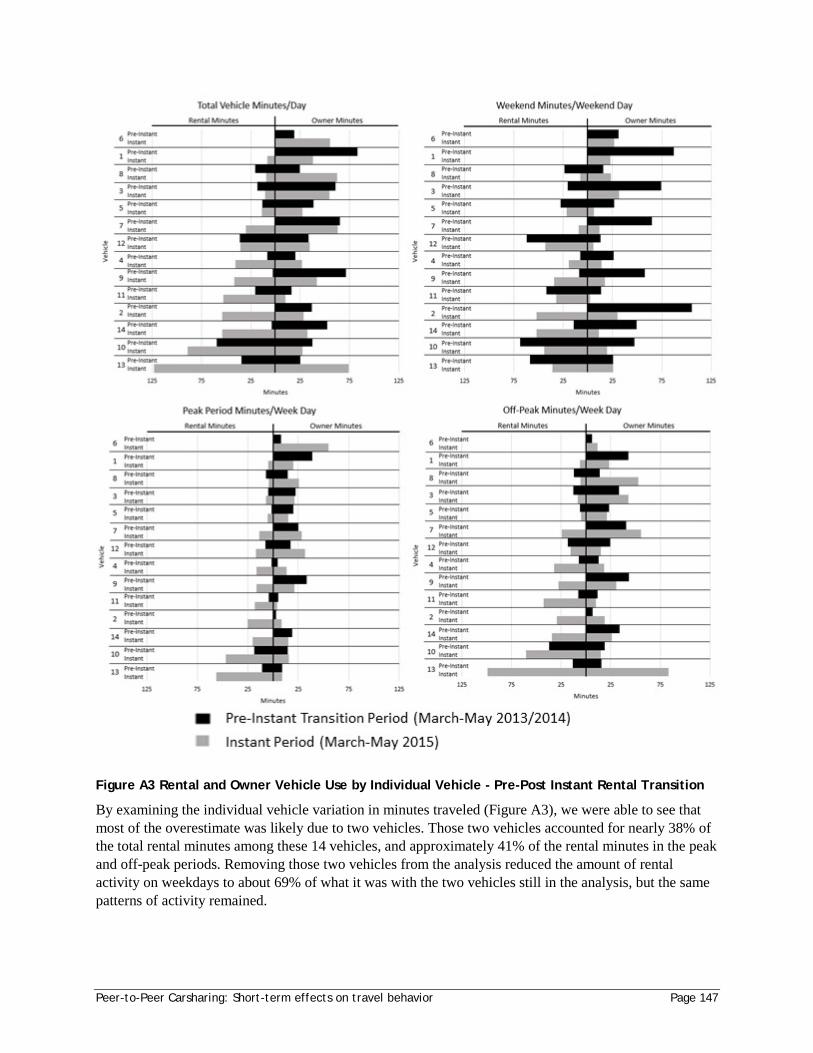
Peer-to-Peer Carsharing: Short-term effects on travel behavior Page 147
Figure A3 Rental and Owner Vehicle Use by Individual Vehicle - Pre-Post Instant Rental Transition
By examining the individual vehicle variation in minutes traveled (Figure A3), we were able to see that most of the overestimate was likely due to two vehicles. Those two vehicles accounted for nearly 38% of the total rental minutes among these 14 vehicles, and approximately 41% of the rental minutes in the peak and off-peak periods. Removing those two vehicles from the analysis reduced the amount of rental activity on weekdays to about 69% of what it was with the two vehicles still in the analysis, but the same patterns of activity remained.