patient satisfaction with care provided by physician
TRANSCRIPT

Olivet Nazarene UniversityDigital Commons @ Olivet
Ed.D. Dissertations School of Graduate and Continuing Studies
5-2016
Patient Satisfaction with Care Provided ByPhysician Assistants in an Orthopedic ClinicJoshua Richard JohnsonOlivet Nazarene University
Follow this and additional works at: https://digitalcommons.olivet.edu/edd_diss
Part of the Orthopedics Commons
This Dissertation is brought to you for free and open access by the School of Graduate and Continuing Studies at Digital Commons @ Olivet. It hasbeen accepted for inclusion in Ed.D. Dissertations by an authorized administrator of Digital Commons @ Olivet. For more information, please [email protected].
Recommended CitationJohnson, Joshua Richard, "Patient Satisfaction with Care Provided By Physician Assistants in an Orthopedic Clinic" (2016). Ed.D.Dissertations. 101.https://digitalcommons.olivet.edu/edd_diss/101

PATIENT SATISFACTION WITH CARE PROVIDED BY PHYSICIAN
ASSISTANTS IN AN ORTHOPEDIC CLINIC
by
Joshua R. Johnson
Dissertation
Submitted to the Faculty of
Olivet Nazarene University
School of Graduate and Continuing Studies
in Partial Fulfillment of the Requirements for
the Degree of
Doctor of Education
in
Ethical Leadership
May 2016


i
© 2016
Joshua R. Johnson
All Rights Reserved

ii
ACKNOWLEDGMENTS
The process of completing my dissertation could not have been completed
without the enormous help, encouragement, and prayers from so many people. To begin
with, I would like to thank my cohort VIII and IX members; it has been a joy and
privilege to go through this program with you all. The memories and friendships I have
made in this program will last a lifetime.
I was blessed to have been provided with the best dissertation advisor of all time:
Dr. Stanton Tuttle. Dr. Tuttle constantly provided encouragement and guidance
throughout the doctoral program and dissertation process. It is a process after all. I would
not have completed this program without his instruction. Dr. Ray Bower was my
dissertation reader and professor in the program. I am thankful for his input, particularly
in helping shape my statistical analysis.
Numerous individuals contributed to helping me accomplish my data collection
and provide insight into the research process. Thank you to Kristin Fields, PA-C, and
Michael Holmes, PA-C, for being such outstanding PAs; the data reflects how strongly
patients appreciate you. Thank you Dr. Michael Corcoran for allowing me to collect data
in your clinic. Dr. Milton Smit, my attending physician, thank you for allowing me time
off to complete the program; I am greatly indebted to you. Melissa McCormack, thanks
for your insights into survey design, and thank you Dr. Roderick Hooker for taking the
time to discuss PA research with me. Dr. Francis Counselman allowed me to modify the

iii
patient satisfaction survey he and his fellow researchers used several years ago; thank
you for help in this process.
Finally, I am certain that I could not have gone through a doctoral program or a
dissertation process without the constant support from my family and friends. Angel,
Mom, Dad, Amy, Houston, Jason, and Heather, thank you for your love, your prayers,
your support, hugs when I needed them, and continuing to tell me I could accomplish
this. You all have been a huge blessing to me throughout this process, I love you all, and
I am forever grateful to you all. A special thanks to my crew, Jay Runyan, Jordan
Ravellette, Brian Johnson, Jonathan Bell, and Brent Peadro, for their friendship and
continued support.

iv
DEDICATION
This dissertation is dedicated to my parents, Chuck and Mary Johnson. You have
encouraged me, supported my goals, prayed for me, loved me unconditionally, and have
always pointed me towards Christ. There are no words to describe how thankful I am for
the sacrifices you have made on my behalf; they did not go unnoticed. I am blessed
beyond measure to have been raised by you. I love you both!
I also dedicate this to my sister, Amy, and my brothers, Houston and Jason. You
are my allies and closest friends. Having you as siblings has truly been the highlight of
my life. Each of you are close to my heart and I am so grateful for the friendships we
have together. You enrich my life and I am blessed to be a part of yours. I love you!
Last but certainly not least, I dedicate this dissertation to my fiancé, Angel. You
are my best friend and I could not have finished this without your support. Thank God I
am yours!
v
ABSTRACT
Patient satisfaction is an important part of a patient’s healthcare experience and has been
researched extensively. Physician Assistants (PAs) have become a resource to provide
healthcare services to patients in the United States and internationally. The purpose of the
current study was to measure patient satisfaction levels with care provided by PAs in an
orthopedic clinic, in order to find ways of improving patient satisfaction levels. A patient
satisfaction survey was distributed to patients receiving care from PAs in a Midwestern
orthopedic clinic. Data analyses determined levels of patient satisfaction for patients
receiving care from PAs. The results from the study indicated a high level of overall
patient satisfaction for patients receiving care from PAs in an orthopedic clinic. The time
patients spend waiting to receive care from a PA, the technical quality of the PA, and the
interpersonal manner of the PA all positively influenced the overall level of patient
satisfaction. Patients who were middle age (age 45-64) and older (age 65 and older) were
most satisfied with the care provided by PAs in an orthopedic clinic. The majority of
patients (n = 60) were not willing to wait a longer period of time in order to receive care
from a physician, rather than a PA.

vi
TABLE OF CONTENTS
Chapter Page
I. INTRODUCTION ………………………………………………………………..1
Statement of the Problem …………………………………………………………2
Background ……………………………………………………………………….3
Research Questions ……………………………………………………………….5
Description of Terms ……………………………………………………………..5
Significance of the Study …………………………………………………………6
Process to Accomplish ……………………………………………………………7
Summary ………………………………………………………………………...12
II. REVIEW OF THE LITERATURE ……………………………………………..14
Introduction ……………………………………………………………………...14
History and Role of PAs ………………………………………………………...14
PA Demographics ……………………………………………………………….20
Patient Perception of PAs ……………………………………………………….25
Importance of Patient Satisfaction ………………………………………………26
Determinants of Patient Satisfaction …………………………………………….29
How to Measure Patient Satisfaction ……………………………………………32
Patient Satisfaction With PAs …………………………………………………...35
Conclusion ………………………………………………………………………38
Summary ………………………………………………………………………..38

vii
Chapter Page
III. METHODOLOGY ……………………………………………………………...39
Introduction …………………………………………………………………......39
Research Design ...………………………………………………………………40
Population ……………………………………………………………………….41
Data Collection ………………………………………………………………….43
Analytical Methods ……………………………………………………………..46
Limitations ………………………………………………………………………47
Conclusion ………………………………………………………………………48
IV. FINDINGS AND CONCLUSIONS …………………………………………….49
Introduction ……………………………………………………………………..49
Findings …………………………………………………………………………50
Conclusions ……………………………………………………………………..58
Implications and Recommendations.…………………………………………….60
REFERENCES ………………………………………………………………….62
APPENDICES
A. The Patient Satisfaction Questionnaire (PSQ) ……………………………….75
B. The Patient Satisfaction Questionnaire (PSQ) Pilot ………………………….79
C. Participant Remarks ………………………………………………………….83

viii
LIST OF TABLES
Table Page
1. Overall Satisfaction Ratings for Gender and Age Group………………………..51
2. ANOVA Summary for Overall Satisfaction Ratings as a Function of Age and
Gender……………………………………………………………………52
3. Mean and Standard Deviation of Satisfaction Component Ratings……………...53
4. Pearson Product-Moment Correlations Between Overall Satisfaction and
Satisfaction Component Ratings………………………………………....54
5. Willingness to Wait Longer by Age Group………………………………….......55
6. Willingness to Wait Longer by Gender …………………………………………55
7. Gender and Willingness to Wait Longer Chi-Square Test of Independence…….56
8. Patient Age and Willingness to Wait Longer Chi-Square Test of Independence..56
9. Time Patients Were Willing to Wait by Gender ………………………………...57
10. Time Patients Were Willing to Wait by Age Group……….…………………….58
1
CHAPTER 1
INTRODUCTION
Patient satisfaction with healthcare experiences is a topic that has been researched
extensively (Cleary & McNeil, 1988). Specifically, patient satisfaction has been
measured as an outcome of the care provided by physicians, physician assistants (PAs),
medical students, and other healthcare providers (Ellett, Campbell, & Gonsalves, 2010;
Hooker, Cipher, & Sekscenski, 2005). Donabedian (1988) suggested that patient
satisfaction was an important part of a patient’s healthcare experience because patient
satisfaction was a patient’s judgment of the quality of care they had received. Satisfied
patients are more likely to seek medical advice, keep their follow up appointments, and
follow through with treatment recommendations (Levesque, Bogoch, Cooney, Johnston,
& Wright, 2000). Bodenheimer (1999) suggested that satisfied patients were less likely to
leave their healthcare plan.
One component of patient satisfaction that has received much attention in
previous research was the concept of a patient’s waiting time. Patient waiting time was
considered the elapsed time between check-in time and when the provider called for the
patient (McMullen & Netland, 2013). Multiple studies indicated that patients were least
satisfied with their healthcare experience when they had to wait longer than expected to
receive care (Anderson, Camacho, & Balkrishnan, 2007; Thompson, Yarnold, Williams,
& Adams, 1996).
2
Patient satisfaction research has involved various types of healthcare providers,
such as physicians, PAs, and nurse practitioners (NPs), as well as various areas of
medicine, including emergency medicine, primary care medicine, and trauma (Berg,
Crowe, Nyberg, & Burdsal, 2012; Counselman, Graffeo, & Hill, 2000; Hill, Bird,
Hopkins, Lawton, & Wright, 1992). Hooker, Potts, and Ray (1997) concluded that
patients were satisfied with their care from nurse practitioners, physicians, and PAs.
Hooker et al. (2005) indicated that Medicare patients were as satisfied with the care
provided by PAs as they were with the care provided by physicians. Hooker et al. (1997)
also reported that PAs who practice orthopedics scored slightly higher in overall patient
satisfaction compared to physicians.
Counselman et al. (2000) reported that the majority of patients treated by a PA in
an emergency department fast track were satisfied with their care. Also, Counselman et
al. concluded that the majority of patients in an emergency department fast track were not
willing to wait longer to receive care from a physician rather than a PA. As a result of the
study by Counselman et al., the current study addressed whether patients were satisfied
with the care they receive from a PA in an orthopedic clinic.
Statement of the Problem
Previous research indicated that patients were satisfied with the care they received
from PAs (Berg et al., 2012; Counselman et al., 2000; Hooker et al., 2005). One area of
healthcare that has caused the greatest amount of patient dissatisfaction was waiting time
(Hill et al., 1992). Thompson and Yarnold (1995) suggested that patients were most
satisfied with their experience in the emergency department (ED) when their waiting time
was less than expected. Few studies in the literature have examined patient satisfaction
3
with care provided by PAs at an orthopedic clinic. Thus, the purpose of this study was to
determine patient satisfaction levels when patients had seen a PA in an orthopedic clinic,
in order to find ways to improve patient satisfaction. And, because research has pointed
to waiting time as a very important factor in patient satisfaction levels, this variable was a
key variable investigated in the current study.
Background
Physician Assistants
A PA is someone who has been qualified by education, experience, personal
character, and training to practice medicine under the supervision of a licensed physician
(Hooker, 2003). Dr. Eugene Stead developed the first PA program in 1965 at Duke
University (Cawley, Cawthon, & Hooker, 2012). The PA program at Duke was two years
long and graduated its first class in 1967. The concept of a physician extender, or what is
now known as a PA, was developed to create a new type of healthcare provider who
could perform routine and less complex tasks of medicine that were usually reserved for a
licensed physician (Larson & Hart, 2007). Physician assistants were employed to play a
collaborative role with physicians as part of the healthcare team (Bal & Brenner, 2013).
PAs became certified to practice medicine after they had passed a national
certification examination (Pedersen, 2003). The National Commission on Certification of
Physician Assistants (NCCPA) was developed in 1974 in order to ensure that PAs were
receiving quality education from PA programs (Ballweg, 2003; Pedersen, 2003). The
NCCPA examined new graduates with a certification exam, and then required PAs to
take a recertification exam every six years. After a PA had passed a certification exam,
they were designated PA-C, indicating they had been certified (Pedersen). As of 2013,

4
PAs were required to take a recertification exam every 10 years (American Academy of
Physician Assistants, 2014).
As of 2010, there were 83,466 PAs practicing medicine in the United States
(American Academy of Physician Assistants, 2010). Orthopedics was the third most
common subspecialty area of medicine where PAs practiced in 2011 (Larson, Coerver,
Wick, & Ballweg, 2011). The number of PAs who practiced in the field of orthopedics
was estimated to be 8,688, or roughly 10.4% of all practicing PAs in 2010.
Patient Satisfaction
Kane, Maciejewski, and Finch (1997) indicated that patients’ satisfaction with
their healthcare experience was an important component in measuring the quality of the
provider’s care. The findings by Kane et al. were consistent with the findings of
Donabedian (1988) in that patient satisfaction was considered a component of the quality
of care a patient had received. There were numerous measures by which patients based
their overall satisfaction with their healthcare experience, including the technical quality,
interpersonal manner, and availability of their healthcare provider (Ware, Snyder, Wright,
& Davies, 1983). Berg et al. (2012) suggested that there was a link between patients’
perceived interpersonal care and healthcare providers’ perceived technical care. Berg et
al. suggested that increased interpersonal care from healthcare providers could predict
high technical care, as perceived by patients. Chang, Chen, and Lan (2013) suggested that
patients’ perceptions of professional skills and communication attitudes positively
influenced patient satisfaction.
Bowling, Rowe, and McKee (2013) suggested that age played a role in patients’
levels of satisfaction. Specifically, Bowling et al. suggested that older patients had higher

5
expectations concerning their healthcare experience than younger patients did. Bowling
et al. indicated that older patients were also more likely than younger patients to feel that
their expectations about their healthcare experience were being met.
Ladd (2009) suggested that patients were open to discussing their visit with their
physician and were open to taking part in satisfaction surveys. Cleary (1999) suggested
that patient surveys were both a valid and reliable source for determining quality of care
being provided. Patient surveys were commonly used in order to gain patients’ feedback.
Cleary also emphasized that patient surveys could inform healthcare providers about
ways to improve patient satisfaction.
Research Questions
The research was guided by the following questions:
1. How satisfied were patients with the care they had received from a PA in an
orthopedic clinic?
2. How many patients would be willing to wait a longer period of time to be treated by a
physician rather than a PA?
3. How much more time would patients be willing to wait to be treated by a physician
rather than a PA?
Description of Terms
Fast Track. An area of the emergency department where minor care is provided
(Counselman et al., 2000).
Interpersonal Manner. The way in which providers interact personally with
patients (Ware et al., 1983).

6
Patient Satisfaction. A patient’s judgment on the quality of care they have
received (Donabedian, 1988).
Physician Assistant. A person who is qualified by education, experience, personal
character, and training to practice medicine under the supervision of a licensed physician
(Hooker, 2003).
Orthopedics. The surgical specialty involving musculoskeletal disorders and
trauma (Auth, 2003).
Technical Quality. The competence of providers and adherence to high standards
of diagnosis and treatment (Ware et al., 1983).
Waiting Time. The elapsed time between check-in time and the time the patient
was first called by the provider (McMullen & Netland, 2013).
Significance of the Study
The measurement of patient satisfaction was important because it could indicate
how patients perceived the quality of the care they had received (Donabedian, 1988).
Druss, Marcus, Olfson, Tanielian, and Pincus (2003) explained that in 2003, more
patients were being seen and treated by PAs compared to anytime in the past. Hooker,
Cawley, and Everett (2011) projected the number of practicing PAs to increase from
74,476 PAs in 2009, to 127,821 by the year 2025. Additional research indicated that
while the quantity of PAs was increasing, PAs were also moving from primarily
practicing primary care medicine to practicing subspecialty areas of medicine, including
orthopedics (Morgan & Hooker, 2010). As previously discussed, patient satisfaction with
PAs had been measured (Berg et al., 2012; Counselman et al. 2000; Hooker et al., 2005),
but there was little research that examined whether patients were satisfied with the care

7
they received from PAs in an orthopedic clinic. Measurement of patient satisfaction
levels of patients who were treated by PAs in an orthopedic clinic could allow the PA
profession to understand if their patients were satisfied with the care provided by PAs in
this area of medicine, and could indicate if PAs practicing in orthopedics were providing
quality care. Results from this study could indicate patients’ willingness to receive care
from PAs in the field of orthopedics, and could also suggest that more PAs could begin
practicing orthopedics.
Process to Accomplish
Introduction
The purpose of this study was to measure patient satisfaction levels with care
provided by PAs in an orthopedic clinic, in order to find ways of improving patient
satisfaction levels. Would patients indicate that they were satisfied with the care provided
by PAs? Would patients be willing to wait longer for care provided by a physician rather
than a PA? The researcher used the following process to accomplish the purpose of the
study.
Participants
The population the researcher utilized to conduct the study consisted of
consenting patients over the age of 18 who had been treated by a PA in a private,
Midwestern orthopedic clinic. The researcher targeted 100 participants for the study
using quota sampling (Leedy & Ormrod, 2012). Participants were given a patient
satisfaction survey after their visit to an orthopedic clinic.

8
Measures
The researcher constructed a modified version of a patient satisfaction survey
previously used by Counselman et al. (2000) after consent was obtained from
Counselman to modify and then use the survey. The patient satisfaction survey explained
the nature of the study, the anticipated minimal risks, the right to withdraw at any time,
and the researcher’s contact information so patients could ask questions or ask for their
responses to be withdrawn from the study. The survey included the definitions of a
physician and a PA in order to ensure that the participants could distinguish between the
two types of healthcare providers they encountered, and the definitions of technical
quality and interpersonal manner in order to ensure participants understood the terms.
The first question of the survey asked participants to indicate who had provided
their care during their orthopedic visit, with the option of choosing a physician, a PA, or
both. Next, participants were asked four satisfaction questions, including how satisfied
they were with the time that they had to wait to be treated that day, how satisfied they
were with the technical quality of the care from their healthcare provider that day, how
satisfied they were with the interpersonal manner of their healthcare provider that day,
and how satisfied they were with the overall care they received from their healthcare
provider that day. Participants were informed to circle their scores for the satisfaction
questions on a Likert scale between 1 and 7, with 7 representing the highest level of
satisfaction.
Participants who indicated they had been cared for by a PA were then asked to
answer whether they were willing to wait longer to receive care from a physician by
circling a yes or no response. Participants who indicated they were willing to wait longer

9
for care from a physician were asked to indicate how much longer they were willing to
wait, given the options of 30 minutes, 60 minutes, 90 minutes, or 120 minutes and longer.
Participants were asked to indicate whether they were male or female, and their age
group from the options of ages 18-44, 45-64, and 65 and older. Finally, participants were
asked to sign their consent to participate in the study. Participants who indicated that they
had received care from an MD or both, were younger than 18 years old, or did not fully
complete the survey were excluded from the data. See Appendix A for a copy of the
survey instrument.
Melissa McCormack, an expert in the field of patient satisfaction surveys, then
evaluated the patient satisfaction survey to ensure the survey was an appropriate way to
measure patient satisfaction levels and to provide face validity (Leedy & Ormrod, 2012).
Hooker stated, “An individual in the marketing field, specifically with survey experience
in patient satisfaction in the medical field, could be considered an expert in the field of
consumer satisfaction surveys” (R. Hooker, personal communication, July 20, 2014).
McCormack has six years of experience marketing, designing, programming, and
researching healthcare surveys, including patient satisfaction surveys. McCormack stated,
“The survey is well-constructed and will indicate levels of patient satisfaction” (M.
McCormack, personal communication, July 28, 2014). The researcher used the data
collected from the survey and Cronbach’s Alpha to test for reliability (Gay, Mills, &
Airasian, 2012).
The researcher piloted the patient satisfaction survey with patients receiving care
in an orthopedic clinic not involved in the study. During the pilot test, open-ended
questions were added to examine the quality and clarity of the survey. The researcher
10
gathered information from the patients about the ease to complete the survey and the
clarity of the questions.
Procedure
The researcher received consent to conduct the study from the orthopedic clinic
through written verification from the Chief Executive Officer of the clinic. The
researcher concluded that participants were at minimal risk for the study. Patients were
informed of an educational study being conducted in the orthopedic clinic and were
offered to participate in the study. Patients were informed that participation was
completely voluntary and that refusal to participate had no impact on their visit to the
clinic or the care that they received in any way. Patients who volunteered to participate
were given the survey when they entered the orthopedic clinic. The survey explained the
expected risks of the study, the option to withdraw from the study at any time, and the
researcher’s contact information so participants could contact the researcher with any
questions or withdraw from the study. Informed consent was obtained by participant’s
signature on the survey. All participants were asked to complete the survey and return the
survey to staff members either at the checkout counter, or at the front desk of the
orthopedic office. The survey was expected to take approximately 10 minutes or less to
complete.
Research Question One. How satisfied were patients with the care they had
received from a PA in an orthopedic clinic?
Data. Using the previously described instrument, the researcher sought to
determine whether patients were satisfied with the care they had received from a PA that

11
day in an orthopedic clinic. The numerical data from the overall patient satisfaction
question was used to determine the level of patient satisfaction.
Analyses. The researcher sought to determine which gender and which patient-
age group was most satisfied with the care they received from PAs. The researcher cast
the data in the form of a 2 (gender of participant) X 3 (age of participant) between-groups
factorial design. The researcher then conducted a 2X3 factorial between-groups analysis
of variance (ANOVA) to determine if there was a relationship between overall patient
satisfaction, the dependent variable, and either of the independent variables of patient age
or gender (Robson, 2011). The 2x3 factorial between-groups ANOVA also permitted the
researcher to examine the possibility that age and gender might interact in a unique way
to relate to patient satisfaction. Pearson product-moment correlations were conducted to
determine if relationships existed between waiting time satisfaction and overall patient
satisfaction, technical quality satisfaction and overall patient satisfaction, and
interpersonal manner satisfaction and overall patient satisfaction. Mean overall
satisfaction scores of each gender and age group were reported in tabular form. The mean
and standard deviation for the four satisfaction measures were also reported in tabular
form.
Research Question Two. How many patients would be willing to wait a longer
period of time to be treated by a physician rather than a PA?
Data. Using the previously described instrument, the researcher sought to
determine the number of patients that were willing to wait longer to receive care from a
physician rather than a PA.
12
Analyses. The researcher used a chi-square test of independence to determine
whether willingness to wait longer to receive care from a physician rather than a PA was
related to gender. The researcher also used a chi-square test of independence to determine
whether willingness to wait longer to receive care from a physician rather than a PA was
related to patient age. Frequency counts by gender and age showing the total numbers of
yes respondents and no respondents were displayed in tabular form.
Research Question Three. How much more time would patients be willing to wait
to be treated by a physician rather than a PA?
Data. Using the previously described instrument, the researcher sought to
determine the number of patients that would wait 30 minutes, 60 minutes, 90 minutes, or
120 minutes and longer to receive care from a physician. Numerical data, taking the form
of frequency counts for each category were collected.
Analyses. The researcher sought to determine the number of patients who
responded to each waiting time option in the third research question. Frequency counts by
gender and age for each time category were displayed in tabular form.
Summary
Patient satisfaction is an important component of the healthcare experience
because patient satisfaction can be considered a desired outcome of care (Donabedian,
1988). Previous research indicated that patients were satisfied with care provided by PAs
(Berg et al., 2012; Counselman et al., 2000; Hooker et al., 2005). The purpose of this
study was to determine patient satisfaction levels when patients had been treated by a PA
in an orthopedic clinic, in order to find ways to improve patient satisfaction. The next

13
chapter will provide an in-depth literature review of the current research about patient
satisfaction with care provide by PAs in an orthopedic clinic.

14
CHAPTER II
REVIEW OF THE LITERATURE
Introduction
Patient satisfaction is a complex issue and the factors that determine patient
satisfaction are multidimensional in nature (Nielsen, Gill, & Ricketts, 2005; Ware et al.,
1983). Knowing whether patients are satisfied is important because satisfied patients are
more likely to seek medical advice, follow through with treatment recommendations,
keep their follow up appointments, and maintain a solid patient-physician relationship
(Levesque et al., 2000). Many methods are available to evaluate and measure patient
satisfaction (Batchelor, Owens, Read, & Bloor, 1994; Cleary, 1999; Nitse & Rushing,
1996; Quintana et al., 2006; White, 1999); however, Hooker et al. (2005) argued that the
studies to evaluate patient satisfaction with PAs have been few. As part of the current
study, the following areas were reviewed, in order to provide a thorough background of
the field and also to establish a research-based foundation for the study: the history and
role of PAs, the demographics of PAs, patient perception of PAs, the importance of
patient satisfaction, determinants of patient satisfaction, how to measure patient
satisfaction, and patient satisfaction with PAs.
History and Role of PAs
As of 2013, the United States confronted many uncertainties involving healthcare,
including how healthcare will be paid for, who will provide healthcare, and who will

15
receive healthcare (Sargen, Hooker, & Cooper, 2011). Laws such as the Patient
Protection and Affordable Care Act (2010) will require an increased demand for
healthcare services due to an increased population of individuals with insurance, a
growing population, an aging population, an increased demand for technology in
healthcare, and the management of chronic diseases, according to Hooker and Muchow
(2014a). Morgan, Strand de Oliveira, and Short (2011) suggested that PAs and NPs could
be effectively utilized to offset the projected shortage of physicians and the increased cost
of health care.
Brock, Wick, Evans, and Gianola (2011) explained that the PA profession began
when medical programs noticed an opportunity for former military medics and corpsmen
to transition into providing health care to a civilian population. Mittman, Cawley, and
Fenn (2002) pointed out that PAs were created in the 1960s to offset a shortage of
physicians in the United States. Cawley et al. (2012) indicated that in order to address the
shortage of physicians, the concept of a physician extender (PE), or someone who could
perform medical tasks previously only done by a physician, was created. Jones (2007)
described the creation of the PA profession as a social and health workforce experiment.
According to Cawley et al. (2012), Charles Hudson suggested the idea of externs
to help physicians with medical tasks in 1961.The first PA program started at Duke
University in 1965, begun by Eugene Stead, MD and E. Harvey Estes, MD. The PA
program trained individuals in medical care with the goal that those trained individuals
would assist and report to physicians. Stead was credited with creating the title of
physician assistant. Other physicians who were credited with helping in the creation of
PAs were Richard Smith, MD, Hu Myers, MD, and Henry Silver, MD (Cawley, 2007;

16
Cawley et al.). The American Medical Association (AMA) gave its approval of PAs in
1969 (Cawley et al.).
Cawley (2007) suggested that PA programs were designed to be educationally
efficient. PA programs were different from medical programs because they were shorter
in duration, lasting an average of 26 months. Alderson Broaddus College was the first PA
program to award an academic degree, awarding a bachelors degree in 1970. Cawley
noted, that unlike other health professions, PA education programs awarded various
degrees, with the most popular being a master of physician assistant studies (MPAS), a
master of health science (MHS), the master of medical science (MMS), and the master of
science (MS).
Cawley (2007) reported that three trends existed in PA education. Cawley
suggested that the first trend in PA education was a rapid expansion in the early 1970s,
the second trend was a decrease in the number of PA programs in the 1980s, and the third
trend was a rapid expansion of PA programs in the mid and late 1990s. Larson and Hart
(2007) also confirmed that the PA profession grew rapidly in the 1970s and 1990s. One
of the reasons that PAs expanded so rapidly in the 1970s was because of the increased
use of PAs in Alaska (Marzucco, Hooker, & Ballweg, 2013). In 1974, PAs were recruited
to provide medical care to workers on and other employees involved in building and
operating the Trans-Alaska Pipeline system. By 1977, Alaska had 200 PAs providing
healthcare for the state. Jones (2007) suggested another reason that the expansion of the
PA profession occurred in the 1970s was because of federal funding from the
Comprehensive Health Manpower Act of 1972. Druss et al. (2003) suggested that
changes in healthcare during the 1990s allowed for a shift in the delivery of medical care

17
from physicians to nonphysician clinicians, which included PAs, NPs, and other
healthcare providers.
Hooker et al. (2011) predicted that the number of PA programs would increase
from 154 in 2009, to 218 in 2025. The number of PA programs increased to a total of 181
in 2013, with 146 of the PA programs having graduates in 2013, and the other 35
programs having graduating students in the following years (Hooker & Muchow, 2014a).
In 2014, new projections suggested that by 2026, the number of PA programs would
increase to 256. Hooker and Muchow noted that 5,971 individuals graduated from PA
programs in 2013 and each PA class averaged 40.9 graduates per year.
PAs can also pursue postgraduate education in various fields of medicine
(Hooker, Klocko, & Larkin, 2010). Hooker et al. indicated that PA postgraduate
education programs were not a required part of PA education. Wiemiller, Somers, and
Adams (2008) indicated that the first postgraduate training programs for PAs began more
than 35 years ago. Eighteen postgraduate PA programs train PAs in orthopedics,
anesthesiology, cardiothoracic, critical care, dermatology, emergency medicine,
hospitalist medicine, neonatology, neurology, neurosurgery, obstetrics and gynecology,
oncology, otolaryngology, psychiatry, rheumatology, sleep medicine, surgery, and trauma
and critical care. Postgraduate PA programs last from 6 months to 24 months long, and
the number of postgraduate PA programs was expected to increase.
Graduating from an accredited PA program is the first step to becoming a PA
(Hooker, Carter, & Cawley, 2004). The Accreditation Review Commission on Education
for the Physician Assistant, ARC-PA, was established in order to ensure PA programs
were providing quality education (Hooker et al., 2010; Jones, 2007). Jones stated that

18
ARC-PA did not determine the curriculum length for programs, but established
requirements that PA students must complete, including preclinical and clinical education
involving the training of interpersonal and communication skills. ARC-PA also requires
PAs to train in outpatient, inpatient, long-term care facilities, and emergency departments
(Jones). Each PA student is also required to train in emergency medicine, surgery,
women’s health, pediatrics, geriatrics, family medicine, and internal medicine before they
can graduate from a PA program (Hooker, Klocko, & Larkin; Jones).
Another important regulatory organization for PAs is the National Commission on
Certification of Physician Assistants (NCCPA), which was created in 1974 to credential
PAs (Hooker et al., 2004; Pedersen, 2003). The NCCPA also ensures that PA programs
are providing quality education for PA students (Ballweg, 2003). The NCCPA evaluates
whether PAs receive education that meets the standards of knowledge to practice
medicine (Hooker et al.).
Upon graduation from an ARC-PA accredited program, PAs are required to pass
the Physician Assistant National Certifying Examination (PANCE) (Pedersen, 2003).
Pedersen indicated that after successfully passing the PANCE, a PA becomes certified.
The letter ‘C’ after PA indicates that a PA has been certified. Until 2013, PAs had to pass
the Physician Assistant National Re-certifying Examination (PANRE) every six years in
order to maintain their certification. In 2012, the NCCPA revealed that starting in 2014,
PAs would transition into the process of passing a recertification exam every 10 years
(National Commission on Certification of Physician Assistants, 2012).
In order to maintain certification, PAs must complete 100 hours of continuing
medical education (CME) every two years (Hooker et al., 2004). Beginning in 2014, 20

19
of the required 100 CME hours must be obtained from self-assessment CME or
performance improvement CME (National Commission on Certification of Physician
Assistants, 2012). Danielsen, Lathrop, and Arbet (2012) indicated that since its
establishment, the NCCPA has certified over 97,500 PAs.
After becoming certified, PAs are employed to assist physicians in a collaborative
role to provide patient healthcare (Bal & Brenner, 2013). PAs are required to work under
the direct supervision of physicians (Larson & Hart, 2007). Van Atta (2012b) suggested
that supervising physicians had the responsibility and privilege to delegate the
responsibilities of the PA within a PA’s scope of practice. Van Atta explained that PAs
were integral pieces of physician-led teams that provide medical care. Physicians can
benefit from employing PAs because physicians can work fewer hours and can delegate
many tasks to PAs (Mittman et al., 2002). The use of PAs allows physicians to see the
more complex cases while still being available for consultation if necessary. Hooker,
Nicholson, and Le (2009) indicated that PAs may reduce medical liability, and that
medical liability had not increased due to the employment of PAs.
Danielsen et al. (2012) indicated that certified PAs were addressing a wide range
of healthcare needs in many settings. Everett, Schumacher, Wright, and Smith (2009)
suggested that some PAs were the usual provider of healthcare services in underserved
patient populations, including those patients who live in rural locations and have no
insurance or public insurance other than Medicare. Preventative care services increased
from 1987 to 1997 due to healthcare provided by PAs and other healthcare providers
(Druss et al., 2003). Freeborn and Hooker (1995) stated, “PAs tend to have certain
specialty skills (often procedure-oriented), and patients are directed to them for these
20
skills and procedures” (p. 716). Hooker and Muchow (2014a) noted that PAs had
accounted for 10% of available healthcare providers in 2013. PAs see an average of 70
patients per week and work an average of 40.57 hours per week (National Commission
on Certification of Physician Assistants, 2014).
Cawley (2005) suggested that the demand for PAs remained strong. Cawley
(2007) suggested that PA jobs were plentiful, and that there was no apparent PA
unemployment. Hooker et al. (2011) suggested that the demand for PAs would continue
to be strong in the future due to the projected shortage of physicians. Sargen et al. (2011)
confirmed that PAs had a secure future and were in a growth phase. In 2014, over 78% of
PA graduates had multiple job offers (National Commission on Certification of Physician
Assistants, 2014). Sargen et al. also suggested that advanced healthcare providers, such as
PAs, needed to be expanded maximally. Bourne, Daher, Javaherian, Hewitt, and Wilson
(2012) suggested that the time to complete a PA program, perceived increase in quality of
life, and professional satisfaction were all motivating factors for individuals to choose a
career as a PA.
PA Demographics
The PA profession is composed of more females than males, and the number of
female PAs continues to increase (Hooker et al., 2011; Hooker & Muchow, 2014b;
Hooker, Robie, Coombs, & Cawley, 2013). PAs have reported that they feel that their
profession is dominated by a female presence (Bourne et al., 2012). In 2010, 61%, or
50,914 of the 83,466 PAs in practice were female (American Academy of Physician
Assistants, 2010). In 2014, Hooker and Muchow determined that 75%, or 63,042 of
21
84,504 of licensed PAs were women. Hooker and Muchow revealed that the mean age of
licensed PAs was 42 years old.
Several studies predicted that the number of PAs was expected to increase in the
future (Hooker et al., 2011; Hooker et al., 2013; Hooker & Muchow, 2014a). Hooker et
al. (2011) indicated that the number of practicing PAs was likely to increase 72%, from
74,476 PAs in 2009, to 127,821 PAs in 2025. Hooker et al. (2013) predicted that 100,000
PAs would be clinically active by the year 2016, and Hooker and Muchow estimated that
there would be 125,847 licensed PAs in the U.S. by 2026. The NCCPA (2014) reported
that the PA profession had grown 291%, from 43,500 certified PAs in 2003, to 95,583
certified PAs in 2013.
PAs practice medicine in all 50 states, the District of Columbia, and some United
States territories (Hooker & Muchow, 2014b). Hooker and Muchow indicated that the
national average of licensed PAs per capita was 26.8 PAs per 100,000 U.S. residents. The
highest distribution of PAs per population was in Alaska where 60 PAs practice medicine
for every 100,000 residents of Alaska. Marzucco et al. (2013) suggested that the ratio of
PAs per capita in Alaska was as high as 75 practicing PAs to every 100,000 residents in
2013. The lowest ratio of PAs per population was Mississippi where the ratio was 3.9
PAs per 100,000 residents of that state (Hooker & Muchow).
The role of PAs practicing medicine in international settings has been extensively
evaluated (Bohm, Dunbar, Pitman, Rhule, & Araneta, 2010; Doan et al., 2012; Hooker,
Harrison, & Pashen, 2010; Mittman et al., 2002). Mittman et al. indicated that PAs had
been used internationally since 1992. The concept of PAs has expanded globally and the
recruitment and use of PAs who currently practice in the U.S. has been a useful strategy

22
in showing how PAs are capable of providing health care (Hooker, Hogan, & Leeker,
2007). The global expansion of the PA profession has been taking place since the year
2000. In England, General Practitioners (GPs) who employed PAs were interviewed to
determine whether it was advantageous to employ a PA (Drennan, Levenson, Halter, &
Tye, 2011). The interviewed GPs indicated that PAs were beneficial to their practices and
that they perceived PAs as capable of accomplishing a high volume of work while
requiring a low level of supervision.
Hooker et al. (2007) determined that Australia, Canada, the United Kingdom, the
Netherlands, Scotland, South Africa, and Taiwan had PA programs or were exploring the
use of the PA concept as a health care provider. In Canada, PAs were successfully
utilized in a Canadian orthopedic practice (Bohm et al., 2010) although Doan et al.
(2012) indicated that the use of PAs in Canada had been debated since the early 1990s.
Australian patients also indicated that they were willing to receive care from PAs
(Hooker et al., 2010). Two universities in Australia have established PA programs in
order to increase the number of healthcare providers in that country (Murray & O’Kane,
2014).
Kuilman, Nieweg, van der Schans, Strijbos, and Hooker (2012) indicated that
after PA programs were introduced to the Netherlands in 2001, the number of practicing
PAs had increased from three in 2002, to 650 in 2012. PAs were reported as practicing
medicine in American Samoa, Guam, the Virgin Islands, the Northern Marianas Islands,
Puerto Rico, Africa, and the Pacific (Hooker & Muchow, 2014b). In 2010, a PA program
was established in Saudi Arabia to train Saudis who were interested in healthcare
(Ahmed, 2014). The NCCPA reported that, during 2013, 475 certified PAs were

23
practicing medicine outside of the United States, but the vast majority of certified PAs
were practicing medicine in the United States (National Commission on Certification of
Physician Assistants, 2014).
One advantage of the PA profession is the ability to change clinical specialties
over the course of a career (Hooker, Cawley, & Leinweber, 2010). The ability to change
clinical specialties was one difference that distinguished PAs from NPs and physicians.
Warner, Maio, and Hudmon (2013) noted that the ability to change specialties during a
PA career was moderately important to extremely important for 77.6%, or 1,322 of the
1,703 PA respondents in their study.
Cooper (2007) noted that the PA profession saw its future in medical specialties.
Smith, Muma, Burks, and Lavoie (2012) indicated that specialty roles for PAs, or roles
other than primary care medicine, began to emerge in the 1980s and 1990s. Since 2000,
PAs began switching specialties more quickly than ever before (Hooker et al., 2010).
Larson and Hart (2007) suggested that the number of PAs who practiced medicine
in specialty care had increased. Morgan and Hooker (2010) concluded that the portion of
PAs working in primary care medicine decreased between 1996 and 2005, and that the
number of PAs practicing in surgical subspecialties rose between 1997 and 2006. Jones,
Seo, Chauhan, and Buske (2011) indicated that the trend to move to specialty medicine
was an international trend, with 25% of the Canadian PAs moving from practicing in
primary care to practicing in surgery or a medical specialty between 2009 and 2011.
Halasy, Leafman, Mathieson, Bowman, and Cannon (2012) suggested that salary and
bonuses influenced PAs to practice in specialty medicine.

24
In 2010, the estimated number of PAs who practiced in the specialty area of
orthopedics was 8,688, which represented 10.4% of the total number of practicing PAs in
the United States (American Academy of Physician Assistants, 2010). Larson et al.
(2011) explained that orthopedics was the third most common subspecialty area of
medicine for PAs to practice. Van Atta (2013a) suggested that the use of physician
assistants in an orthopedic practice was commonplace. Morgan and Hooker (2010)
indicated that the ratio of physicians who practice medicine in orthopedics and PAs who
practice medicine in orthopedics was three-to-one. Van Atta suggested that orthopedic
practices have used PAs to increase patient volume, increase professional visibility within
the community, improve the efficiency and quality of surgical services in and out of the
operating room, and improve the continuity of care within an orthopedic clinic. Larson et
al. suggested that the majority of PAs who practiced in orthopedics were white, male, had
a mean age of 41.6, and practiced in general orthopedics.
PAs who practice medicine in orthopedics provide services such as assisting in
surgery, diagnosing and treating orthopedic problems, managing wound care problems,
performing soft tissue, tendon sheath, and joint injections, applying casts, performing
rounds in the hospital, prescribing medications, performing minor procedures, and
writing hospital discharge summaries (Larson et al., 2011; Van Atta, 2012a). PAs in
orthopedics can evaluate new patients, preoperative patients, and postoperative patients
(Van Atta, 2013b). Some orthopedic PAs are allowed to perform emergency room
consultations, reduce and stabilize acute fractures, and interpret bone scans (Larson et al.)
Van Atta (2012a) suggested that a PA could see the same types of patients that their
supervising physician sees in a day, and then bill for those patient visits. PAs can bill

25
Medicare 85% of what physicians bill Medicare (Van Atta, 2012a). Cawley and Hooker
(2003) suggested that the role of PAs continues to expand. Coerver, Larson, Wick, and
Ballweg (2008) confirmed that the roles of PAs in general and subspecialty orthopedics
have also continued to expand.
Patient Perception of PAs
Patients are familiar with the concept of PAs as healthcare providers, are willing
to see PAs for medical care, and enjoy the care provided by PAs (Dill, Pankow, Erikson,
& Shipman, 2013; Doan et al., 2012; Hooker et al., 2010; Kuilman et al., 2012; Larkin &
Hooker, 2010; Van Atta, 2013b). Dill et al. determined that 82.5%, or 1,694 of 2,053
patients surveyed, knew who PAs and NPs were, and what services PAs and NPs
provided. Dill et al. also determined that 81.4%, or 1,671 of 2,053 patients surveyed, had
been treated by PAs or NPs in the past.
Several studies were conducted in order to determine whether patients were
willing to receive care from PAs (Dill et al., 2013; Doan et al., 2012; Hooker et al., 2010;
Kuilman et al., 2012). When given a scenario of seeing a PA or NP that day for a cough,
or seeing a physician the next day for a cough, 60%, or 1,232 of 2,053 patients surveyed,
preferred to see a PA or NP that day, and only 25%, or 513 of 2,053 patients surveyed,
preferred to wait a day to see a physician (Dill et al.). In a similar study, Doan et al.
concluded that 99%, or 226 of the 229 Canadian patients who were surveyed, were
willing to see PAs for care rather than waiting longer to see a physician. Hooker et al.
concluded that 99%, or 224 of the 225 Australian patients who were surveyed, were
willing to see a PA instead of waiting longer to see a physician. In a similar scenario, 450
Dutch patients were given three injury scenarios and options to wait a shorter amount of
26
time to receive care from a PA, or wait a longer amount of time to receive care from a
physician (Kuilman et al.). Kuilman et al. determined that four percent, or 17 of the 450
patients surveyed, were willing to wait longer to receive care from a physician rather than
a PA. Kuilman et al. concluded that Dutch patients appeared to prefer shorter wait times
to see PAs instead of longer wait times to see physicians. In the United States, Larkin and
Hooker (2010) evaluated whether patients in an emergency department were willing to
receive care from NPs, PAs, or medical residents. Larkin and Hooker suggested that the
majority of patients were willing to see NPs and PAs for minor injuries and illnesses.
Importance of Patient Satisfaction
Patients have indicated that they are satisfied with care provided by PAs (Oliver,
Conboy, Donahue, Daniels, & McKelvey, 1986; Counselman et al., 2000; Hooker et al.,
1997). Patient satisfaction is an important component of healthcare because satisfied
patients are more likely to comply with their provider’s prescribed medical care and are
more likely to return to that provider for future health care needs (Bell, Krivich, & Boyd,
1997). Satisfied patients are also less likely to leave their healthcare plan (Bodenheimer,
1999). Knudtson (2000) noted that if patients were satisfied with their visit, they were
more likely to recommend the health care provider to other patients.
Patient satisfaction is also an important component of healthcare because satisfied
patients are more likely to seek medical advice, follow through with treatment
recommendations, keep their follow up appointments, and maintain a solid patient-
physician relationship (Levesque et al., 2000). Satisfied patients are also less likely to
look for a new physician or healthcare provider (Otani, Waterman, & Dunagan, 2012).
Patients are more likely to participate and follow through with health-care decisions if

27
they are satisfied with the care they have received (Hooker et al., 1997). Verbeek, van
Dijk, Rasanen, Piirainen, Kankaanpaa, and Hulshof (2001) indicated that dissatisfied
patients were more likely to leave a physician’s practice and to change health plans.
Otani et al. (2012) noted that physicians had placed an increased emphasis on
understanding patient satisfaction. Patient satisfaction has become an important aspect of
the medical profession and physicians have begun working hard to make and keep
patients happy (Ladd, 2009). Thomas (1998) indicated that patient satisfaction was a goal
for all physicians, and that patient satisfaction could not or should not be ignored. Nitse
and Rushing (1996) suggested that patient satisfaction was gaining attention because
patient satisfaction was considered customer satisfaction, and customer satisfaction was a
key determinant of an organization’s ability to survive. Understanding patients’
satisfaction with experiences at physicians’ offices is a substantial way to understanding
patients’ future satisfaction with their future health care needs.
Health care facilities have begun focusing on improving how patients experience
their healthcare visits because meeting customer expectations is an essential part of
patient satisfaction (Nitse & Rushing, 1996). The Centers for Medicare & Medicine
Services (CMS) have begun to make value-based incentive payments to acute care
hospitals partly based on patient satisfaction surveys (Morris, Jahangir, & Sethi, 2013).
Satisfied patients bring business to healthcare companies (Nitse & Rushing) and higher
customer satisfaction correlates with increased revenue (Taylor, 2012). Verbeek et al.
(2001) suggested that healthcare providers should put an effort into increasing patient
satisfaction.

28
Donabedian (1988) suggested patient satisfaction was a patient’s judgment on the
quality of care they had received. Measuring patient satisfaction has become a way to
measure the quality of care that had been delivered by a health care provider (Knudtson,
2000). Bell et al. (1997) suggested that patient satisfaction was a primary determinant of
patients’ evaluations of the quality of care they had received. Patient satisfaction most
importantly can be viewed as an indicator of the overall quality of care provided by a
healthcare institution (Bell et al.; Kane et al., 1997; Levesque et al., 2000; Morris et al.,
2013; Thomas, 1998). Physicians and patients can benefit from taking time to measure
patient satisfaction (Ladd, 2009).
Campbell, Roland, and Buetow (2000) and Bodenheimer (1999) suggested that
there was a movement to improve the quality of healthcare in the U.S. Healthcare has
begun to be scrutinized for the quality of care that has been provided and also for the
satisfaction of those who have received care (Thayaparan, & Mahdi, 2013). Physicians
view quality healthcare as the application of evidence-based medical knowledge to the
needs of patients (Bodenheimer). Physicians have begun to examine patient satisfaction
measures as part of a renewed focus on value and quality in healthcare (Thomas, 1998).
The National Committee for Quality Assurance includes patient satisfaction as a
component of performance with health plans (Bodenheimer). Thomas suggested that
patient satisfaction was ready for future research.
29
Determinants of Patient Satisfaction
Patient satisfaction could be considered a desired outcome of care (Donabedian,
1988). Kane et al. (1997) indicated that patient satisfaction included judgments on the
technical, interpersonal, social and moral aspects of care. Thayaparan and Mahdi (2013)
suggested that dimensions of patient satisfaction include the technical quality of the
provider, interpersonal manner, communication, financial aspects, time spent with the
provider, and accessibility and convenience of the health care facility. Patient satisfaction
may be influenced by a healthcare provider’s affective behavior, or bedside manner
(Kane et al., Otani et al., 2012).
Donabedian (1988) suggested that the art of medicine consisted of technical care
and also the management of the interpersonal process. The interpersonal aspect of
healthcare was the way by which the technical aspect of care was implemented by
healthcare practitioners. Donabedian suggested that the interpersonal relationship of
healthcare practitioners and their patients was vitally important and that the interpersonal
process of practitioners influenced the care for the patient. Berg et al. (2012) stated,
“Patients’ perceptions of how the PA treated them as a person influence their beliefs
about the PA’s ability to provide quality care” (p. 49). Effective communication between
healthcare providers and patients is key to patients feeling satisfied (Nielsen et al., 2005).
Bodenheimer (1999) suggested that patients may place more importance on how
long they are kept waiting for appointments or how healthcare providers communicate
with the patients, rather than the technical aspect of care from healthcare providers. Hill
et al. (1992) contended that patients were most satisfied with the technical quality and
competence of their healthcare provider. Chang et al. (2013) concluded that patients’

30
perceptions of professional skills and communication attitudes positively influenced
patient satisfaction. Thompson et al. (1996) determined that patients who perceived that
tests and procedures were clearly explained, identified as the information delivery in their
study, were more satisfied with their encounter at an emergency department. Hill et al.
indicated that patient dissatisfaction usually stemmed from issues related to
communication, time spent with patients, empathy, accessibility, and the attitudes of
healthcare providers towards their patients.
The factors that determine patient satisfaction are complex (Nielsen et al., 2005;
Ware et al., 1983). Nielsen et al. suggested that the majority of patient satisfaction
research focused on waiting times. Hill et al. (1992) determined that the one area that
caused the greatest amount of patient dissatisfaction was the time the patient spent in the
waiting area. Bodenheimer (1999) suggested that patients consider how long they are
kept waiting for healthcare appointments an important issue. McMullen and Netland
(2013) suggested that little information existed about whether the objective measurement
of patient waiting time was associated with patient satisfaction. However, Anderson et al.
(2007) and Ware et al. indicated that the length of time a patient had to wait to see a
physician was a substantial patient satisfaction measure and patients found waiting time
an important issue.
Anderson et al. (2007) hypothesized that longer patient waiting times and shorter
visits with physicians would lead to lower patient satisfaction scores. Anderson et al.
determined that 24.5%, or 1,227 of the 5,003 respondents, had a perceived waiting time
of longer than 30 minutes to see their physician. Anderson et al. indicated that the
combination of a short time spent with a physician and a long waiting time produced the
31
lowest level of patient satisfaction. Long waiting time to receive care from a physician
received low patient satisfaction scores in primary care clinics (Knudtson, 2000), a
student-run free medical clinic (Ellett et al., 2010), an ophthalmology clinic (McMullen
& Netland, 2013), and an ED (Thompson et al., 1996).
McMullen and Netland (2013) reported that a linear relationship existed between
patient satisfaction and time spent waiting to see a physician, with patients who waited
less time to see a physician having higher patient satisfaction scores, and patients who
waited longer to see a physician having lower patient satisfaction scores. Thompson et al.
(1996) determined the patients who thought their waiting time was shorter than expected
to see a physician were more satisfied with their visit compared to patients who thought
their waiting time was as expected or longer than expected to see a physician. Hill et al.
(1992) suggested that when patients were going to be delayed to their visit with their
health care provider, they should be given an explanation and possible estimate of their
appointment time.
Sociodemographic factors associated with patient satisfaction reveal conflicting
results about who is more satisfied with their healthcare services (Bowling et al., 2013;
Knudtson, 2000; Nielsen et al., 2005). Bowling et al. concluded that older patients’
expectations were higher than those of younger patients and that older patients were more
likely to believe their expectations were being met compared to younger patients.
Knudtson determined that older patients were less satisfied with care provided by NPs
than younger patients. Knudtson also determined that patients with higher education
levels were more likely to be satisfied with the care provided by NPs. However, Quintana
et al. (2006) concluded that older patients scored higher in all areas of patient satisfaction

32
than younger patients. Quintana et al. suggested that patients with no education or only
primary education were more satisfied than patients with higher education.
Patients have also indicated that they were satisfied in various healthcare
environments. Ellett et al. (2010) concluded that 98%, or 51 of 52 patients surveyed, were
satisfied overall with the care they received at a free, student-run clinic. Eighty-six
percent, or 60 of 70 patients questioned, indicated that they were either satisfied or highly
satisfied with their care at a rheumatology clinic (Hill et al., 1992). Nielsen et al. (2005)
concluded that satisfaction was generally high among the patients visiting an outpatient
orthopedic clinic. Patients have indicated that they are satisfied with care provided at an
ED (Counselman et al., 2000; Thompson et al., 1996).
Thompson and Yarnold (1995) suggested that in order to achieve high levels of
patient satisfaction, the healthcare services must meet or exceed patient expectations.
Levesque et al. (2000) indicated that patient satisfaction could be improved by changing
the patients’ expectations of their time in the clinic and by decreasing the patients’ overall
time in the clinic. Healthcare providers need to remain focused on effective
communication, adequate information, and good patient outcomes in order for patients to
feel satisfied (Bowling et al., 2013).
How to Measure Patient Satisfaction
Bell et al. (1997) suggested that much attention had been given to the value of
measuring patient satisfaction. Patient satisfaction is a valuable measure because it can be
viewed as a positive outcome of the medical care administered by healthcare providers.
Ware et al. (1983) indicated that patient satisfaction was a personal evaluation of health
care services and a measure of care. Cleary and McNeil (1988) noted that patient

33
satisfaction with medical care was commonly measured and that research in the area of
patient satisfaction had increased since the 1980s. Bell et al. indicated that patient
satisfaction was measurable, changeable, controllable, manageable, and should be an
ongoing focus of any healthcare organization. Patient satisfaction measures provide
health care managers with useful information about the structure, processes, and
outcomes of care administered by healthcare providers.
Bell et al. (1997) suggested that patient satisfaction measures could alert
administrators to positive and negative aspects of their institution. As the health care
industry continues to move from price competition to competition based on quality and
performance, patient satisfaction is likely to increase in importance relative to an
organization’s financial success. Low levels of patient satisfaction could lead to customer
loss. Assessing patient satisfaction is one way to find out which areas of service needed
improvement (Verbeek et al., 2001).
Patient satisfaction has been evaluated and measured by questionnaires, written
surveys, phone surveys, face-to-face interviews, phone interviews, focus groups, self-
reports, and online surveys (Batchelor et al., 1994; Cleary, 1999; Nitse & Rushing, 1996;
Quintana et al., 2006; White, 1999). Data to measure patient satisfaction are easy to
collect and can be collected at a low cost (Verbeek et al., 2001). Batchelor et al.
suggested that many researchers have developed their own questionnaires to evaluate
patient satisfaction.
Verbeek et al. (2001) indicated that patient interviews generally yielded lower
patient satisfaction scores compared to patient questionnaires. Most practices are
encouraged to use written surveys to test for patient satisfaction because written surveys

34
are the most reliable and most cost-effective way to receive patient feedback (White,
1999). Ware et al. (1983) suggested that patient satisfaction ratings were more subjective
than patient satisfaction reports. For example, Ware et al. described surveys that asked
patients to report how much time they spent with their healthcare provider as opposed to
rating whether they were given enough time with their healthcare provider. According to
Ware et al., patient satisfaction reports are more factual and objective, while satisfaction
ratings allow patients to personally evaluate the level of care they have received. Cleary
(1999) explained that patient satisfaction surveys were both valid and reliable. White
suggested that practices should seek to address interpersonal issues, such as whether
providers treated patients with courtesy and respect, with their surveys.
Many physicians have begun using patient satisfaction surveys in their offices
(Nitse & Rushing, 1996). Physicians who have conducted patient satisfaction surveys
found that patients are willing to talk about their visits and experiences (Ladd, 2009).
Cleary (1999) suggested that patients would like their voices to be heard concerning the
quality of care they had received. Tremlett (1977) indicated that some patients expressed
gratitude for allowing their views of the care they had received to be discussed. The
continued use of patient satisfaction surveys could ensure that patient concerns were
being addressed (Ellett et al., 2010).
Using surveys to determine levels of patient satisfaction can help medical
practices find ways to improve (White, 1999). The results of patient satisfaction surveys
could ultimately lead to better care for patients and overall happier patients. Cleary
(1999) acknowledged that patient surveys could provide suggested areas for quality
improvement.

35
Patient Satisfaction with PAs
Hooker et al. (2005) acknowledged that the studies to evaluate patient satisfaction
with PAs and NPs compared to physicians had been few. Berg et al. (2012) suggested
that PAs must acknowledge the impact of their care on patients’ perceptions of
satisfaction. Berg et al. stated, “Patients’ perceptions of how the PA treated them as a
person influence their beliefs about the PA’s ability to provide quality care” (p. 49). PAs
must be aware of the impact of their interpersonal skills and how their interpersonal care
affects overall patient satisfaction.
Oliver et al. (1986) examined whether patients in rural and semirural communities
were satisfied with services provided by PAs. Oliver et al. also sought to analyze patient
satisfaction based on variables including patient age, gender, education, marital status,
the number of times a patient had seen a PA, and severity of illness. Oliver et al. noted
that previous studies that had analyzed patient satisfaction with services provided by PAs
were conducted in urban settings, health maintenance organizations, or multispecialty
clinics. Questionnaires were distributed to patients at seven family practice clinics and
two satellite offices in Midwestern rural or semirural communities.
Oliver et al. (1986) concluded that PAs provided a high level of patient
satisfaction for patients receiving health care services in rural, office-based medical
practices. Oliver et al. indicated that patients reported the greatest satisfaction with PA
interpersonal skills. Patients expressed high satisfaction with the time the PA spent with
the patient and the length of time the patient had to wait to see the PA. Oliver et al.
determined that women had higher levels of satisfaction with PAs than men did.

36
Hooker et al. (1997) investigated whether patients were as satisfied with the care
they received from PAs and NPs as with the care they received from physicians.
Validated surveys were sent to patients who received care from healthcare providers in
the Kaiser Permanente Northwest Division. The survey consisted of eight questions that
addressed the effectiveness of communication and degree of satisfaction patients received
from PAs, NPs and physicians.
Hooker et al. (1997) concluded that PAs in orthopedics and NPs in obstetrics and
gynecology scored slightly higher than physicians in overall satisfaction. Hooker et al.
suggested that patient satisfaction was more dependent on communication style rather
than who provided care. Hooker et al. concluded that patients were satisfied with their
care regardless of who provided the care. Seventeen years later, Hooker stated, “Most
patients are satisfied with their healthcare provider, regardless of who provided the care”
(R. Hooker, personal communication, July 20, 2014).
In another study, Hooker et al. (2005) examined whether Medicare beneficiaries
were as satisfied with the treatment they received from PAs and NPs as they were with
treatment they received from physicians. Hooker et al. acknowledged that patients might
think as highly of PAs and NPs as they do of physicians. A national, cross-sectional
survey was sent to Medicare beneficiaries who were enrolled in the Medicare fee-for-
service program for six months. The survey consisted of 92 questions that addressed
patient satisfaction. The survey instrument addressed how often healthcare providers
listened carefully, showed respect, spent time, and explained things in an understandable
way to patients. The survey also sought information on age, gender, race, residence,
37
supplemental health insurance, and self-reported health status so that the researchers
could determine whether there were differences among the different healthcare providers.
Hooker et al. (2005) concluded that 139,536, or approximately 95% of all
Medicare beneficiaries surveyed, were satisfied with their healthcare provider. Further,
Hooker et al. suggested that patients were as satisfied with the care they received from
PAs and NPs as they were with the care they received from physicians. Additionally,
Hooker et al. also suggested that there were no differences in patient satisfaction levels
between healthcare providers regarding patients’ sociodemographic characteristics and
health status.
Counselman et al. (2000) explored whether patients were satisfied with the care
they received from PAs in an ED FT. An additional objective of this particular study was
established to determine whether patients would be willing to wait longer to be seen
primarily by an emergency physician (EP), rather than a PA. The authors acknowledged
that there were few studies concerning patients’ perceptions of medical care provided by
PEs, such as PAs and NPs.
Counselman et al. (2000) distributed surveys to patients at the time of the
patient’s discharge from the ED FT. A total of 1,010 surveys were distributed to patients
in the ED FT. One-hundred-and-eleven of the 1,010 surveys were analyzed, for a
response rate of 11%. Patients were asked to rate their degree of satisfaction by marking
an X on a 100-millimeter visual analog scale. Patients answered yes or no if they were
willing to wait a longer period of time to receive care from an EP rather than a PA. If
patients responded yes to waiting longer to receive care from an EP, they had to answer if

38
they were willing to wait 30, 60, 90, or 120 minutes longer. Counselman et al. also
sought age, gender, insurance type, and the time patients waited in the ED.
Counselman et al. (2000) determined that the mean patient satisfaction score was
93 out of 100. Thirteen patients responded that they would be willing to wait a longer
amount of time to receive care from an EP. Counselman et al. determined that patients
seen in an ED FT were very satisfied with the care they received from PAs.
Conclusion
A thorough review of the literature suggested that few studies had evaluated
whether patients were satisfied with the care provided by PAs in an orthopedic clinic. In
addition, few studies in the literature had evaluated whether patients would wait a longer
period of time to receive care from a physician, rather than a PA, in an orthopedic clinic.
Research to determine levels of patient satisfaction with care provided by a PA in an
orthopedic clinic is supported after a thorough review of the literature.
Summary
The history and role of PAs, the demographics of PAs, patient perception of PAs,
the importance of patient satisfaction, determinants of patient satisfaction, how to
measure patient satisfaction, and patient satisfaction with PAs were reviewed in order to
provide a thorough background of the field and also to establish a research-based
foundation for the study. The next chapter will provide a step-by-step plan of the research
methodology and will explain how the research questions were answered.

39
CHAPTER III
METHODOLOGY
Introduction
In the previous chapter, the researcher reviewed the literature related to patient
satisfaction with care provided by PAs in an orthopedic clinic. The review of literature
included the history and role of PAs, the demographics of PAs, patient perception of PAs,
the importance of patient satisfaction, determinants of patient satisfaction, how to
measure patient satisfaction, and patient satisfaction with PAs. This chapter will describe
the study’s methodology. This chapter will include a description of the research design,
population, data collection process, methods used to analyze the data, and limitations of
the current study. The purpose of this study was to determine whether patients were
satisfied with the care provided by PAs in an orthopedic clinic, in order to find ways to
improve patient satisfaction.
The research was guided by the following questions:
1. How satisfied were patients with the care they had received from a PA in an
orthopedic clinic?
2. How many patients would be willing to wait a longer period of time to be treated by a
physician rather than a PA?
3. How much more time would patients be willing to wait to be treated by a physician
rather than a PA?

40
Research Design
As stated, the purpose of this study was to determine whether patients were
satisfied with the care provided by PAs in an orthopedic clinic, in order to find ways to
improve patient satisfaction. A quantitative research design was developed to analyze
whether patients were satisfied with their care from PAs in an orthopedic clinic.
According to Gay et al. (2012), a quantitative research design uses numerical data to
explain a subject matter of interest. Robson (2011) indicated that quantitative research
follows a specific set of procedures so that the study could be replicated. Leedy and
Ormrod (2012) indicated that quantitative research seeks to provide explanations that are
generalizable to a population.
One type of quantitative research can be referred to as survey research (Leedy &
Ormrod, 2012). Leedy and Ormrod stated, “Survey research involves acquiring
information about one or more groups of people – perhaps about their characteristics,
opinions, attitudes, or previous experiences – by asking them questions and tabulating
their answers” (p. 189). Survey research allows for data that have been collected at one
time to be generalized to a larger period of time. As discussed in Chapter I and Chapter
II, patient satisfaction has been evaluated and measured by questionnaires, written
surveys, phone surveys, face-to-face interviews, phone interviews, focus groups, self-
reports, and online surveys (Batchelor et al., 1994; Cleary, 1999; Nitse & Rushing, 1996;
Quintana et al., 2006; White, 1999). White suggested that medical offices use written
surveys to evaluate patient satisfaction because written surveys are the most cost-
effective and reliable way to receive patient feedback. Leedy and Ormrod suggested that
participants might be more truthful with their responses on a questionnaire than they

41
would be during a personal interview. For the current study, a previously used cross-
sectional patient satisfaction survey was modified, with permission, and developed into a
questionnaire for the current study.
The current study was both quasi-experimental and correlational in nature. Gay et
al. (2012) stated, “Correlational research involves collecting data to determine whether,
and to what degree, a relation exists between two or more quantifiable variables” (p. 9).
Salkind (2011) stated, “In quasi-experimental research, participants are preassigned to
groups based on some predetermined characteristic or quality” (p. 14). In the current
study, participants were placed into groups based on gender and age group. Quasi-
experimental designs were used in the current study due to the lack of random assignment
of the participants (Gay et al., 2012).
Population
The population for the current study was patients who had received care from a
PA in an orthopedic clinic. Gay et al. (2012) indicated that researchers could apply some
guidelines to determine whether a sample size is large enough. Gay et al. stated, “The
larger the population size, the smaller the percentage of the population required to get a
representative sample (p. 139).
The orthopedic clinic was located in the Midwest region of the United States.
Participants were patients who had been cared for only by a PA during their visit that day
to the orthopedic clinic. The pilot study was conducted in October, 2014. The data from
the current research were collected between November, 2014, and January, 2015. The
researcher distributed questionnaires to 139 patients; 98 questionnaires were returned,
and 11 questionnaires were excluded because the participants did not receive care only
42
from a PA. The response rate for included questionnaires was 62.6%, or 87 out of 139
questionnaires.
Demographic data collected from participants indicated that 52.9%, or 46 out of
the 87 participants were female, while 47.1%, or 41 out of the 87 participants were male.
In terms of age, 9.2% of the participants indicated they were between the age of 18 and
44 (n = 8), 50.6% of the participants indicated they were between the ages of 45 and 64
(n = 44), and 40.2% of the participants indicated they were 65 years or older (n = 35).
When separated into gender and age group, 4.6% of participants indicated they were male
and between the ages of 18 and 44 (n =4), and 4.6% of participants indicated they were
female and between the ages of 18 and 44 (n = 4). In addition, 26.4% of the 87
participants indicated that they were both male and in the age range of 45-64 (n=23),
while 24.1% of participants indicated that they were female and fell in this age range
(n=21). Finally, 16.1% of participants indicated that they were age 65 or older and male
(n=14) as opposed to 24.1% who fell in this age group and also indicated that they were
female (n=21).
As discussed in Chapter II, a patient’s age may influence their satisfaction with
their healthcare provider. Quintana et al. (2006) concluded that older patients scored
higher in all areas of patient satisfaction compared to younger patients. Hooker et al.
(2005) also suggested that older patients were satisfied with their healthcare providers,
which included physicians, PAs and NPs. However, Knudtson (2000) suggested that
older patients were less satisfied with care provided by NPs than younger patients. Data
involving the influence of gender on a patient’s satisfaction have been sparse.

43
Data Collection
The current study utilized a modified version of a patient satisfaction survey
previously used by Counselman et al. (2000). Counselman gave written consent to
modify the survey and utilize it for the current study. According to Batchelor et al.
(1994), many researchers develop their own questionnaires to evaluate patient
satisfaction. As discussed in Chapter I, Melissa McCormack, who is an expert in the field
of patient satisfaction surveys, evaluated and approved the Patient Satisfaction
Questionnaire for content validity. According to Salkind (2011), “The simplest, most
straightforward type of validity is content validity. Content validity indicates the extent to
which a test represents the universe of items from which it is drawn . . .” (p. 124).
Reliability of the PSQ was calculated post hoc, as well as in a pilot study. See Appendix
A for a copy of the PSQ.
The PSQ consisted of four definitions and 10 questions. The definitions of
physician, physician assistant, interpersonal manner, and technical quality were included
so that participants fully understood the terminology of the questions. First, participants
were asked to indicate who had provided their care with choices of a physician, PA, or
both. Data from participants who had received care from a PA only were included in the
study. Next, participants were instructed to rate their level of satisfaction for how long
they had to wait to receive care from their healthcare provider, how satisfied they were
with their healthcare provider’s interpersonal manner, how satisfied they were with their
healthcare provider’s technical quality of care, and how satisfied they were overall with
their visit. Each satisfaction question was evaluated on a 7-point Likert scale to assess
satisfaction. An answer of one indicated very dissatisfied, and an answer of seven

44
indicated very satisfied. Participants were then asked to indicate whether they were
willing to wait longer to receive care from a physician rather than a PA, given options of
yes or no. If participants were willing to wait longer, they were asked to indicate how
much longer they would wait to receive care from a physician rather than a PA by
choosing from time options of 30 minutes, 60 minutes, 90 minutes, or 120 minutes and
longer. Participants were asked to indicate their gender, given options of male or female,
and to indicate which age group they belonged to given the options of 18-44, 45-64, and
65 and older. The final question was an open-ended question that asked what could be
done to improve the participant’s level of satisfaction. See Appendix C for participant
remarks to the open-ended question that asked what could be done to improve the
participant’s level of satisfaction.
The researcher obtained written permission from the CEO of the orthopedic group
to collect data. The PSQ survey was distributed to patients receiving care from PAs at an
orthopedic clinic in the Midwest region of the United States. Gay et al. (2012) explained
that researchers could not always gather a random sample due to practical constraints,
and therefore researchers could use nonrandom sampling to gather data. Nonrandom
sampling includes convenience sampling, which uses volunteers to participate in the
study. Convenience sampling was utilized to distribute surveys to willing participants in
the orthopedic clinic. Robson (2011) indicated that convenience sampling was one of the
most widely used methods of sampling.
The PSQ questionnaire was piloted to 16 participants. All 16 participants of the
pilot study indicated that the questions were clear and easy to understand, and that the
participants did not have any difficulty completing the questionnaire. The Statistical

45
Package for the Social Sciences (SPSS) was then utilized to calculate internal consistency
reliability using Cronbach’s alpha (Gay et al., 2012). Cronbach’s alpha was determined to
be .75 for the PSQ pilot study. See Appendix B for the PSQ pilot questionnaire.
After the PSQ questionnaire was piloted and reliability was demonstrated, written
questionnaires were distributed to patients receiving care from a PA at an orthopedic
clinic in the Midwest region of the United States. Participants were patients who had
been cared for only by a PA that day during their visit to the clinic. Participation in the
study was voluntary and all participants received an informed consent document
explaining the nature of the study and the risks involved with participation. The informed
consent document also included the researcher’s contact information in order to allow the
participants to communicate any questions or concerns they had, and informed them that
they had the right to withdraw from the study at any time. The researcher distributed
questionnaires to PAs and clinic staff to hand out to patients entering the orthopedic
clinic. Each participant was asked to return the completed questionnaire to any staff
member of the clinic.
Nominal scale data collected from the PSQ questionnaire included healthcare
provider, whether the participant would be willing to wait longer to be seen primarily by
a physician rather than a PA, age group, participant gender, and time willing to wait
category to receive care from a physician. Interval scale data included patient satisfaction
ratings regarding waiting time satisfaction, technical quality satisfaction, interpersonal
manner satisfaction, and overall satisfaction.

46
Analytical Methods
The researcher used SPSS for data analysis of the research questions. For
Research Question 1, mean overall satisfaction scores of each gender and age group were
reported in tabular form. The mean and standard deviation for the four satisfaction
measures were also reported in tabular form. Next, the researcher sought to determine
which gender and which patient-age group was most satisfied with the care they received
from PAs. Finally, the researcher sought to determine whether relationships existed
between interpersonal manner satisfaction and overall satisfaction, waiting time
satisfaction and overall satisfaction, and technical quality satisfaction and overall
satisfaction.
The first research question was both correlational and a quasi-experiment. For the
quasi-experiment, the dependent variable was the overall patient satisfaction rating, and
the independent variables were patient age group, and patient gender. The patient age
group had three levels (18-44, 45-64, 65+) and the patient gender had two levels (male
and female). The researcher cast the data in the form of a 2 (gender of participant) X 3
(age of participant) between-subjects factorial design, using the data from the overall
satisfaction question. The researcher then conducted a 2X3 factorial between-subjects
ANOVA in order to determine if a relationship existed between overall patient
satisfaction scores, the dependent variable, and either of the independent variables of
patient age or gender (Robson, 2011). The 2x3 factorial between-subjects ANOVA also
permitted the researcher to examine the possibility that age and gender might interact in a
unique way to relate to patient satisfaction. Pearson product-moment correlations were
conducted to determine if relationships existed between technical quality satisfaction (X)

47
and overall patient satisfaction (Y), waiting time satisfaction (X) and overall patient
satisfaction (Y), and interpersonal manner satisfaction (X) and overall patient satisfaction
(Y).
For Research Question 2, which asked participants if they were willing to wait
longer to see a physician rather than a PA, frequency counts by gender and age showing
the total numbers of yes respondents and no respondents were displayed in tabular form.
The second research question is also correlational because it examines the relationship
between variable X and variable Y. The researcher used a chi-square test of independence
to determine whether willingness to wait longer to receive care (X) from a physician
rather than a PA was related to gender (Y). The researcher also used a chi-square test of
independence to determine whether willingness to wait longer to receive care (X) from a
physician rather than a PA was related to patient age group (Y). Chi-square tests of
independence allowed for variables of categorical data, including gender (male or
female), willingness to wait (yes or no), and age group (18-44, 45-64, 65 and older), to be
compared.
For Research Question 3, the researcher sought to determine the number of
patients who responded to each waiting time option. Frequency counts by gender and age
for each time category were displayed in tabular form.
Limitations
There were several limitations to the current study. To begin with, the overall
sample size was small and could be considered a limitation to generalizability. In
addition, the significant findings in the factorial ANOVA should be interpreted with
some caution because the sample size across conditions was unequal. Finally, the data

48
were gathered in the Midwest region of the United States and may not reflect the views of
patients being cared for by PAs in other regions of the United States or elsewhere.
Conclusion
This chapter explained the detailed methodology of the current study. The
research design, population of the study, data collection process, methods for statistical
analysis, and limitations of the current study were all described in specific detail. The
next chapter will discuss the findings of the current study and recommendations for
future studies.

49
CHAPTER IV
FINDINGS AND CONCLUSIONS
Introduction
In the previous chapter, the researcher explained the methodology for the current
study. The methodology of the current study included a description of the research
design, population, data collection process, methods used to analyze the data, and
limitations of the current study. This chapter will report the findings of the data collection
and analyses, as well as the conclusions, implications, and recommendations for future
studies. The purpose of this study was to determine whether patients were satisfied with
the care provided by PAs in an orthopedic clinic, in order to find ways to improve patient
satisfaction.
The research was guided by the following questions:
1. How satisfied were patients with the care they had received from a PA in an
orthopedic clinic?
2. How many patients would be willing to wait a longer period of time to be treated by a
physician rather than a PA?
3. How much more time would patients be willing to wait to be treated by a physician
rather than a PA?

50
Findings
Survey Results
The PSQ, which evaluated patient satisfaction measures on a 7-point Likert scale,
was tested for reliability by calculating Cronbach’s Alpha (Gay et al., 2012). Analysis of
the four satisfaction measures yielded a Cronbach’s Alpha of .66. According to Yockey
(2011), a Cronbach’s Alpha level of .60-.69 represented a marginal adequacy of
reliability, suggesting that the survey was adequately reliable to test for patient
satisfaction. The results from the current study indicated that 47.1%, or 41 of the 87
participants were male, while 52.9%, or 46 of the 87 participants were female. The results
of the current study revealed that 9.2%, or eight of the 87 participants, were between the
ages of 18-44, 50.6%, or 44 of the 87 participants, were between the ages of 44-65, and
40.2%, or 35 of the 87 participants, were 65 years and older. The response rate of the
survey was 68%, with 87 out of 128 surveys returned.
Research Question One
Mean overall satisfaction ratings of each gender and age group are represented in
Table 1. Females ages 45-64 and males ages 65 and older had the highest mean overall
satisfaction ratings, while females ages 18-44 had the lowest mean overall satisfaction
ratings. The mean satisfaction ratings for all participants (n = 87), was high.

51
Table 1
Overall Satisfaction Ratings for Gender and Age Group
Age Gender N Mean Std. Deviation
18-44 Male 4 6.50 .58
Female 4 6.25 .50
Total 8 6.38 .52
45-64 Male 23 6.87 .34
Female 21 7.00 .00
Total 44 6.93 .25
65+ Male 14 7.00 .00
Female 21 6.95 .22
Total 35 6.97 .17
Total Male 41 6.88 .33
Female 46 6.91 .28
Total 87 6.90 .31
Finally, as indicated by Table 2, there was no main effect of the gender variable
nor did the interaction between the age group and gender variables reach statistical
significance. However, there was a significant main effect of the patient age variable,
indicating a statistically significant relationship between patient age (the independent
variable) and overall satisfaction (the dependent variable). The results indicated that
patients ages 18-44 had statistically significant lower satisfaction levels than patients ages
45 and older. The findings should be interpreted with caution because sample sizes across
the patient age conditions were quite different.

52
Table 2
ANOVA Summary for Overall Satisfaction Ratings as a Function of Age and Gender
Source df Mean Square
F
Sig. Eta2
Age 2 1.22 18.71 .00* .316
Gender 1 .04 .60 .44 .007
Age x
Gender
2 .16 2.42 .10 .056
Error 81 .066 .621
Total 86
* p < .05
The mean and standard deviation for the four satisfaction components rated are
represented in Table 3. As indicated by Table 3, the interpersonal manner had the highest
mean satisfaction rating, while the waiting time had the lowest mean satisfaction rating.
Overall, all components rated received a strong satisfaction rating.

53
Table 3
Mean and Standard Deviation of Satisfaction Component Ratings
Waiting
Time
Satisfaction
Technical
Quality
Satisfaction
Interpersonal
Manner
Satisfaction
Overall
Satisfaction
N Valid 87 87 87 87
Missing 0 0 0 0
Mean 6.68 6.85 6.91 6.90
Standard
Deviation
.84 .42 .29 .31
In order to determine if there was a significant relationship between the overall
patient satisfaction ratings and each of the satisfaction components rated, a Pearson-
product moment correlational analysis was conducted. Table 4 displays the results of that
analysis. The results of Pearson product-moment correlations between overall satisfaction
and waiting time satisfaction, overall satisfaction and technical quality satisfaction, and
overall satisfaction and interpersonal manner satisfaction were statistically significant at
the p < .05 level. The strongest correlation existed between overall satisfaction and
technical quality satisfaction and the weakest correlation existed between overall
satisfaction and waiting time satisfaction. Statistically significant positive relationships
existed between waiting time satisfaction and overall satisfaction, technical quality
satisfaction and overall satisfaction, and interpersonal manner satisfaction and overall
satisfaction. As indicated by Table 4, technical satisfaction had the highest coefficient of

54
determination, while waiting time satisfaction only accounts for less than half of the
correlation to overall patient satisfaction.
Table 4
Pearson Product-Moment Correlations Between Overall Satisfaction and Satisfaction
Component Ratings
Waiting
Satisfaction
Technical
Satisfaction
Interpersonal
Satisfaction
Overall
Satisfaction
Pearson
Correlation
(r)
.48* .69* .68*
Sig. (2-
tailed)
.00 .00 .00
N 87 87 87
r2 .23 .47 .46
*p < .01 (2-tailed)
Research Question 2
Research question 2 explored whether patients were willing to wait longer to
receive care from a physician rather than a PA. Frequency counts of participants by
gender and age showing the total numbers of yes respondents and no respondents are
displayed in Table 5 and Table 6. Most of the participants, regardless of age group, were
not willing to wait longer to see a physician, rather than a PA. When considering whether
gender plays a role in willingness to wait longer, male patients were slightly more willing
to wait longer than females.

55
Table 5
Willingness to Wait Longer by Age Group
Age
18-44 45-64 65+ Total
Willing to
Wait Longer
Yes 3 10 6 19
No 5 28 27 60
Total 8 38 33 79
Table 6
Willingness to Wait Longer by Gender
Gender
Male Female Total
Willing to Wait
Longer
Yes 10 9 19
No 26 34 60
Total 36 43 79
The results relating to whether willingness to wait longer to receive care from a
physician rather than a PA was related to gender or age did not demonstrate statistical
significance. The researcher used a chi-square test of independence to determine whether
willingness to wait longer to receive care from a physician rather than a PA was related to
gender. The chi-square test of independence revealed that no statistically significant
relationship existed between gender and willingness to wait longer to receive care from a

56
physician rather than a PA. Results of the chi-square test of independence between gender
and willingness to wait longer are represented in Table 7.
Table 7
Gender and Willingness to Wait Longer Chi-Square Test of Independence
Value df Asymp. Sig. (2-sided)
Pearson Chi-Square .50 1 .48
________________________________________________________________________
*p < .05
The chi-square test of independence revealed that no statistically significant
relationship existed between patient age and willingness to wait longer to receive care
from a physician rather than a PA. Results of the chi-square test of independence between
patient age and willingness to wait longer are represented in Table 8.
Table 8
Patient Age and Willingness to Wait Longer Chi-Square Test of Independence
Value df Asymp. Sig. (2-sided)
Pearson Chi-Square 1.52 2 .47
________________________________________________________________________
*p < .05
Research Question Three
Research question 3 examined the amount of time patients were willing to wait to
receive care from a physician rather than a PA. The results indicated that no patients were
willing to wait longer than 60 minutes to be treated by a physician, rather than a PA.
Overall, more males and more patients ages 45-64 were more willing to wait to receive
care from a physician rather than a PA. Frequency counts for patient gender and each

57
time category are shown in Table 9. Frequency counts for patient age group and each
time category are shown in Table 10.
Table 9
Time Patients Were Willing to Wait by Gender
Gender
Male Female Total
Time 30 Minutes 13 7 20
60 Minutes 1 2 3
90 Minutes 0 0 0
120 Minutes + 0 0 0
Total 14 9 23
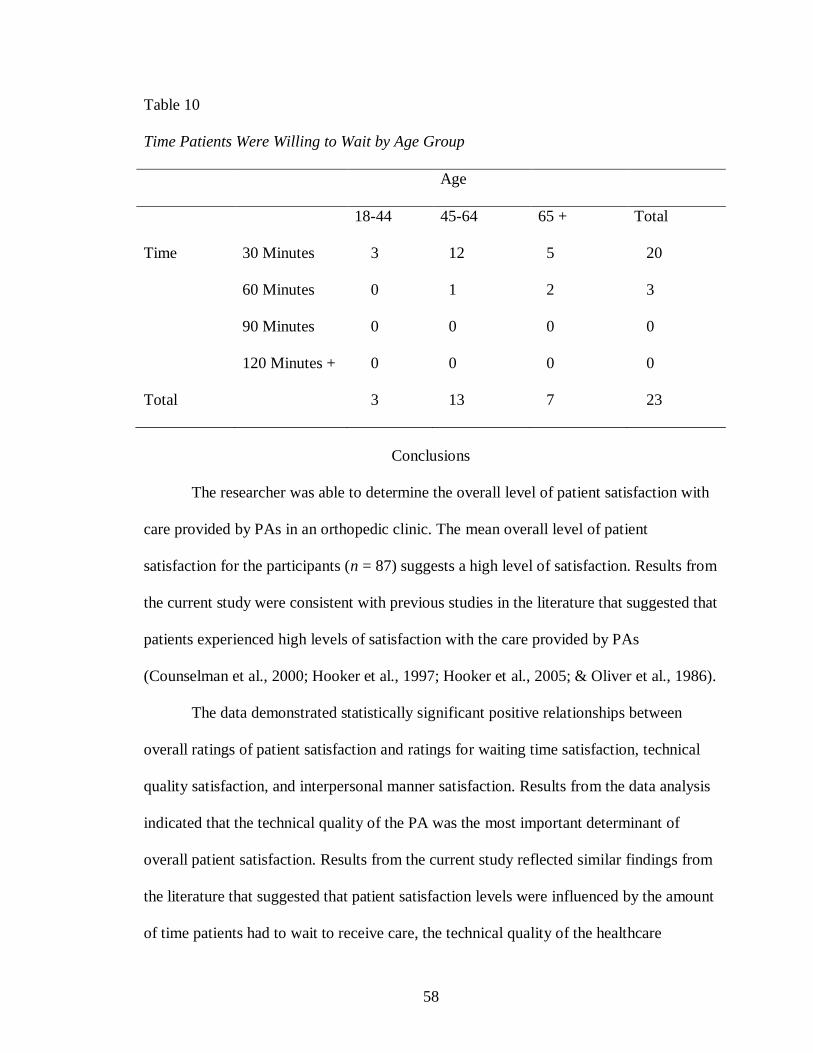
58
Table 10
Time Patients Were Willing to Wait by Age Group
Age
18-44 45-64 65 + Total
Time 30 Minutes 3 12 5 20
60 Minutes 0 1 2 3
90 Minutes 0 0 0 0
120 Minutes + 0 0 0 0
Total 3 13 7 23
Conclusions
The researcher was able to determine the overall level of patient satisfaction with
care provided by PAs in an orthopedic clinic. The mean overall level of patient
satisfaction for the participants (n = 87) suggests a high level of satisfaction. Results from
the current study were consistent with previous studies in the literature that suggested that
patients experienced high levels of satisfaction with the care provided by PAs
(Counselman et al., 2000; Hooker et al., 1997; Hooker et al., 2005; & Oliver et al., 1986).
The data demonstrated statistically significant positive relationships between
overall ratings of patient satisfaction and ratings for waiting time satisfaction, technical
quality satisfaction, and interpersonal manner satisfaction. Results from the data analysis
indicated that the technical quality of the PA was the most important determinant of
overall patient satisfaction. Results from the current study reflected similar findings from
the literature that suggested that patient satisfaction levels were influenced by the amount
of time patients had to wait to receive care, the technical quality of the healthcare

59
provider, and the interpersonal manner of the healthcare provider (Anderson et al., 2007;
Berg et al., 2012; Bodenheimer, 1999; Donabedian, 1988; Hill et al., 1992; Kane et al.,
1997; Knudtson, 2000; McMullen & Netland, 2013; Otani et al., 2012; Thayaparan &
Mahdi, 2013; Thompson et al., 1996; Ware et al., 1983).
Results from the current study indicated statistically significant lower levels of
patient satisfaction for younger patients, ages 18-44, compared to middle age patients,
ages 45-64, and older patients, ages 65 and older. Previous research suggested conflicting
results about which aged patients were more satisfied with their healthcare services
(Bowling et al., 2013; Knudtson, 2000; Nielsen et al., 2005). The results from the current
study were similar to the results of Bowling et al., and Quintana et al. (2006), that
suggested that older patients were more satisfied with the care they had received from
their healthcare provider, than younger patients. The results of the current study
suggested that there was no effect of gender on the overall satisfaction ratings.
The results of the current study were similar to the results of previous studies in
the literature, which suggested that the majority of patients were not willing to wait
longer to receive care from a physician rather than a PA (Counselman et al., 2000; Dill et
al., 2013; Doan et al., 2012; Hooker et. al., 2010; Kuilman et al., 2012). Analysis of the
data from the current study indicated that no statistically significant relationships existed
between willingness to wait longer to receive care from a physician, rather than a PA, and
patient gender or patient age group. The results from the current study indicated no
patients were willing to wait longer than 60 minutes to receive care from a physician
rather than a PA, independent of their gender or age group.
60
Implications and Recommendations
The purpose of the current study was to measure patient satisfaction levels with
care provided by PAs in an orthopedic clinic, in order to find ways of improving patient
satisfaction levels. The results of the current study add to the literature in the field of
patient satisfaction with care provided by PAs, specifically in the medical specialty of
orthopedics, in an orthopedic clinic setting. The current study analyzed the relationships
between overall patient satisfaction levels and waiting time satisfaction, technical quality
satisfaction, and interpersonal manner satisfaction.
An important finding of the study indicated that waiting time, the technical
quality of the healthcare provider, and the interpersonal manner of the healthcare
provider, all influenced the overall satisfaction level of patients. In addition, of these
three satisfaction components, technical quality satisfaction was the most important
component of overall satisfaction. Healthcare providers should understand the importance
of contributing factors to patient satisfaction and strive to provide a high level of
technical quality, a high level of interpersonal manner, and shorter waiting times, in order
to keep patients satisfied with the healthcare experience. The findings from the current
study also indicated that middle age patients, ages 45-64, and older patients, ages 65 and
older, were more satisfied with the care provided by PAs in an orthopedic clinic,
compared to younger patients, ages 18-44. PAs should continue to focus on providing a
highly satisfactory healthcare experience with the goal of increasing satisfaction levels
for younger patients.
Future research on patient satisfaction with care provided by PAs in an orthopedic
clinic could focus on satisfaction levels among the various types of patients that receive

61
care, including new patients, established patients, or post-operative patients. Future
research on patient satisfaction with care provided by PAs in an orthopedic clinic could
also evaluate whether patient satisfaction levels improve over a period of time. Finally,
future research could evaluate levels of patient satisfaction with care provided by PAs in
an orthopedic clinic for patients who were receiving care from a PA for the first time.
The important findings from the current study suggest a high level of patient
satisfaction with care provided by PAs in an orthopedic clinic. Physician Assistants
should understand that patient waiting time, the technical quality of healthcare providers,
and the interpersonal manner of healthcare providers, all positively influence the overall
level of patient satisfaction. Physician Assistants should continue to strive for achieving
high levels of patient satisfaction.

62
REFERENCES
Ahmed, N. (2014). Physician assistants in Saudi Arabia. The Journal of the American
Academy of Physician Assistants, 27(8), 11.
doi:10.1097/01.JAA.0000451861.25577.53
American Academy of Physician Assistants. (2010). 2010 AAPA physician assistant
census. Alexandria, VA: Author.
American Academy of Physician Assistants. (2014). 2013 AAPA salary report. National
findings. Alexandria, VA: Author.
Anderson, R. T., Camacho, F. T., & Balkrishnan, R. (2007). Willing to wait: The
influence of patient wait time on satisfaction with primary care. BMC Health
Services Research, 7(31), 1-5. doi:10.1186/1472-6963-7-31
Auth, P. (2003). Orthopedics. In R. Ballweg, S. Stolberg, & E. Sullivan (Eds.), Physician
assistant: A guide to clinical practice (3rd
ed., pp. 745-763). Philadelphia, PA:
Elsevier.
Bal, B. S., & Brenner, L. H. (2013). Employing a mid-level provider differs from
entering a collaborative agreement. Orthopedics Today, 33(9), 24-26.
Ballweg, R. (2003). History of the profession. In R. Ballweg, S. Stolberg, & E. Sullivan
(Eds.), Physician assistant: A guide to clinical practice (3rd
ed., pp. 1-22).
Philadelphia, PA: Elsevier.

63
Batchelor, C., Owens, D. J., Read, M., & Bloor, M. (1994). Patient satisfaction studies:
Methodology, management, and consumer evaluation. International Journal of
Health Care Quality Assurance, 7(7), 22-30.
Bell, R., Krivich, M. J., & Boyd, M. S. (1997). Charting patient satisfaction: Tracking the
effects of patient satisfaction efforts with control charts will add value to your
business strategy. Marketing Health Services, 17(2), 22-29.
Berg, G. M., Crowe, R. E., Nyberg, S., & Burdsal, C. (2012). Trauma patient satisfaction
with physician assistants: Testing a structural equation model. Journal of the
American Academy of Physician Assistants, 25(5), 42-43, 49-52.
Bodenheimer, T. (1999). The American health care system. The movement for improved
quality in health care. The New England Journal of Medicine, 340(6), 488-492.
Bohm, E. R., Dunbar, M., Pitman, D., Rhule, C., & Araneta, J. (2010). Experience with
physician assistants in a Canadian arthroplasty program. Canadian Journal of
Surgery, 53(2), 103-108.
Bourne, K., Daher, N., Javaherian, H., Hewitt, L., & Wilson, C. (2012). Physician
assistant: Motivations and perceptions of the profession. Journal of Allied Health,
41(2), 70-76.
Bowling, A., Rowe, G., & McKee, M. (2013). Patients’ experiences of their healthcare in
relation to their expectations and satisfaction: A population survey. Journal of the
Royal Society of Medicine, 106(4), 143-149. doi:10.1258/jrsm.2012.120147
Brock, D. M., Wick, K. H., Evans, T. C., & Gianola, F. J. (2011). The physician assistant
profession and military veterans. Military Medicine, 176(2), 197-203.
64
Campbell, S. M., Roland, M. O., & Buetow, S. A. (2000). Defining quality of care. Social
Science & Medicine, 51(11), 1611-1625. doi:10.1016/S0277-9536(00)00057-5
Cawley, J. F. (2005). Physician assistant supply and demand. Journal of the American
Academy of Physician Assistants, 18(8), 11-12.
Cawley, J. F. (2007). Physician assistant education: An abbreviated history. The Journal
of Physician Assistant Education, 18(3), 6-15.
Cawley, J. F., Cawthon, E., & Hooker, R. F. (2012). Origins of the physician assistant
movement in the United States. Journal of the American Academy of Physician
Assistants, 25(12), 36-42.
Cawley, J. F., & Hooker, R. S. (2003). Physician assistants: Does the US experience have
anything to offer other countries? Journal of Health Services Research & Policy,
8(2), 65-67. doi:10.1258/135581903321466012
Chang, C. S., Chen, S. Y., & Lan, Y. T. (2013). Service quality, trust, and patient
satisfaction in interpersonal-based medical service encounters. BMC Health
Services Research, 13(22). doi:10.1186/1472-6963-13-22
Cleary, P. D. (1999). The increasing importance of patient surveys. British Medical
Journal, 319(7212), 720-721. doi:10.1136/bmj.319.7212.720
Cleary, P. D., & McNeil, B. J. (1988). Patient satisfaction as an indicator of quality care.
Inquiry, 25(1), 25-36.
Coerver, D., Larson, E., Wick, K., & Ballweg, R. (2008). PAs in orthopedic practice:
Preliminary survey results. The Journal of Physician Assistant Education, 19(4),
41.

65
Cooper, R. A. (2007). New directions for nurse practitioners and physician assistants in
the era of physician shortages. Academic Medicine, 82(9), 827-828.
Counselman, F. L., Graffeo, C. A., & Hill, J. T. (2000). Patient satisfaction with
physician assistants (PAs) in an ED fast track. The American Journal of
Emergency Medicine, 18(6), 661-665. doi:10.1053/ajem.2000.16301
Danielsen, R. D., Lathrop, J., & Arbet, S. (2012). The certified physician assistant in the
United States: A 2011 snapshot. The Journal of the American Academy of
Physician Assistants, 25(4), 58.
Dill, M. J., Pankow, S., Erikson, C., & Shipman, S. (2013). Survey shows consumers
open to a greater role for physician assistants and nurse practitioners. Health
Affairs, 32(6), 1135-1142. doi:10.1377/hlthaff.2012.1150
Doan, Q., Hooker, R. S., Wong, H., Singer, J., Sheps, S., Kissoon, N., & Johnson, D.
(2012). Canadians’ willingness to receive care from physician assistants.
Canadian Family Physician, 58(8), e459-464.
Donabedian, A. (1988). The quality of care: How can it be assessed? Journal of the
American Medical Association, 260(12), 1743-1748.
Drennan, V., Levenson, R., Halter, M., & Tye, C. (2011). Physician assistants in English
general practice: A qualitative study of employers’ viewpoints. Journal of Health
Services Research & Policy, 16(2), 75-80. doi:10.1258/jhsrp.2010.010061
Druss, B. G., Marcus, S. C., Olfson, M., Tanielian, T., & Pincus, H. A. (2003). Trends in
care by nonphysician clinicians in the United States. The New England Journal of
Medicine, 348(2), 130-137.

66
Ellett, J. D., Campbell, J. A., & Gonsalves, W. C. (2010). Patient satisfaction in a
student-run free medical clinic. Family Medicine, 42(1), 16-18.
Everett, C. M., Schumacher, J. R., Wright, A., & Smith, M. A. (2009). Physician
assistants and nurse practitioners as a usual source of care. The Journal of Rural
Health, 25(4), 407-414. doi:10.1111/j.1748-0361.2009.00252.x
Freeborn, D. K., & Hooker, R. S. (1995). Satisfaction of physician assistants and other
nonphysician providers in a managed care setting. Public Health Reports, 110(6),
714-719.
Gay, L. R., Mills, G. E., & Airasian, P. (2012). Educational research: Competencies for
analysis and application (10th ed.). Boston, MA: Pearson.
Hill, J., Bird, A., Hopkins, R., Lawton, C., & Wright, V. (1992). Survey of satisfaction
with care in a rheumatology outpatient clinic. Annals of the Rheumatic Diseases,
51(2), 195-197. doi:10.1136/ard.51.2.195
Halasy, M. P., Leafman, J., Mathieson, K., Bowman, R., & Cannon, J. (2012). A
descriptive analysis of factors influencing physician assistant specialty selection.
Journal of the American Academy of Physician Assistants, 25(7), E52-E55.
Hooker, R. S. (2003). Ambulatory services. In R. Ballweg, S. Stolberg, & E. Sullivan
(Eds.), Physician assistant: A guide to clinical practice (3rd
ed., pp. 488-511).
Philadelphia, PA: Elsevier.
Hooker, R. S., Carter, R., & Cawley, J. F. (2004). The national commission on
certification of physician assistants: History and role. Perspective on Physician
Assistant Education, 15(1), 8-15.
67
Hooker, R. S., Cawley, J. F., & Everett, C. M. (2011). Predictive modeling the physician
assistant supply: 2010-2025. Public Health Reports, 126(5), 708-716.
Hooker, R. S., Cawley, J. F., & Leinweber, W. (2010). Career flexibility of physician
assistants and the potential for more primary care. Health Affairs, 29(5), 880-886.
doi:10.1377/hlthaff.2009.0884
Hooker, R. S., Cipher, D. J., & Sekscenski, E. (2005). Patient satisfaction with physician
assistant, nurse practitioner, and physician care: A national survey of Medicare
beneficiaries. The Journal of Clinical Outcomes Management, 12(2), 88-92.
Hooker, R. S., Harrison, K., & Pashen, D. (2010). Are Australians willing to be treated
by a physician assistant? Australasian Medical Journal, 3(7), 407-413.
doi:10.4066/amj.2010.325
Hooker, R. S., Hogan, K., & Leeker, E. (2007). The globalization of the physician
assistant profession. The Journal of Physician Assistant Education, 18(3), 76-85.
Hooker, R. S., Klocko, D. J., & Larkin, G. L. (2010). Physician assistants in emergency
medicine: The impact of their role. Academic Emergency Medicine, 18(1), 72-77.
doi:10.1111/j.1553-2712.2010.00953.x
Hooker, R. S., & Muchow, A. N. (2014a). Supply of physician assistants: 2013-2026. The
Journal of the American Academy of Physician Assistants, 27(3), 39-45.
doi:10.1097/01.JAA.0000443969.69352.4a
Hooker, R. S., & Muchow, A. N. (2014b). The 2013 census of licensed physician
assistants. The Journal of the American Academy of Physician Assistants, 27(7),
35-39. doi:10.1097/01.JAA.0000450807.90835.49

68
Hooker, R. S., Nicholson, J. G., & Le, T. (2009). Does the employment of physician
assistants and nurse practitioners increase liability? The Journal of Medical
Licensure and Discipline, 95(2), 6-16.
Hooker, R. S., Potts, R., & Ray, W. (1997). Patient satisfaction: Comparing physician
assistants, nurse practitioners, and physicians. The Permanente Journal, 1(1), 38-
42.
Hooker, R. S., Robie, S. P., Coombs, J. M., & Cawley, J. F. (2013). The changing
physician assistant profession: A gender shift. The Journal of the American
Academy of Physician Assistants, 26(9), 36-43.
doi:10.1097/01.JAA.0000433914.54617.a0
Jones, I. W., Seo, B., Chauhan, T. S., & Buske, L. (2011). The results of the first
Canadian national physician assistant survey. Journal of the American Academy
of Physician Assistants, 24(10), 63.
Jones, P. E. (2007). Physician assistant education in the United States. Academic
Medicine, 82(9), 882- 886.
Kane, R. L., Maciejewski, M., & Finch, M. (1997). The relationship of patient
satisfaction with care and clinical outcomes. Medical Care, 35(7), 714-730.
Knudtson, N. (2000). Patient satisfaction with nurse practitioner service in a rural setting.
Journal of the American Academy of Nurse Practitioners, 12(10), 405-412.
Kuilman, L., Nieweg, R. M., van der Schans, C. P., Strijbos, J. H., & Hooker, R. S.
(2012). Are Dutch patients willing to be seen by a physician assistant instead of a
medical doctor? Human Resources for Health, 10(28). doi:10.1186/1478-4491-
10-28
69
Ladd, P. (2009). Measuring patient satisfaction. Tennessee Medicine, 102(3), 19-21, 26.
Larkin, G. L., & Hooker, R. S. (2010). Patient willingness to be seen by physician
assistants, nurse practitioners, and residents in the emergency department: Does
the presumption of assent have an empirical basis? The American Journal of
Bioethics, 10(8), 1-10. doi:10.1080/15265161.2010.494216
Larson, E. H., Coerver, D. A., Wick, K. H., & Ballweg, R. A. (2011). Physician assistants
in orthopedic practice: A national study. Journal of Allied Health, 40(4), 174-180.
Larson, E. H., & Hart, G. L. (2007). Growth and change in the physician assistant
workforce in the United States, 1967-2000. Journal of Allied Health, 36(3), 121-
130.
Leedy, P. D., & Ormrod, J. E. (2012). Practical research: Planning and design (10th ed.).
Upper Saddle River, NJ: Pearson Merrill Prentice Hall.
Levesque, J., Bogoch, E. R., Cooney, B., Johnston, B., & Wright, J. G. (2000). Improving
patient satisfaction with time spent in an orthopedic outpatient clinic. Canadian
Journal of Surgery, 43(6), 431-436.
Marzucco, J., Hooker, R. S., & Ballweg, R. M. (2013). A history of the Alaska physician
assistant, 1970-1980. The Journal of the American Academy of Physician
Assistants, 26(12), 45-51. doi:10.1097/01.JAA.0000437822.61279.bb
McMullen, M., & Netland, P.A. (2013). Wait time as a driver of overall patient
satisfaction in an ophthalmology clinic. Clinical Ophthalmology, 7, 1655-1660.
doi:10.2147/OPTH.S49382
Mittman, D. E., Cawley, J. F., & Fenn, W. H. (2002). Physician assistants in the United
States. British Medical Journal, 325, 485-487. doi:10.1136/bmj.325.7362.485

70
Morgan, P. A., & Hooker, R. S. (2010). Choice of specialties among physician assistants
in the United States. Health Affairs, 29(5), 887-892.
doi:10.1377/hlthaff.2008.0835
Morgan, P., Strand de Oliveira, J., & Short, N. M. (2011). Physician assistants and nurse
practitioners: A missing component in state workforce assessments. Journal of
Interprofessional Care, 25(4), 252-257. doi:10.3109/13561820.2010.501917
Morris, B. J., Jahangir, A. A., & Sethi, M. K. (2013). Patient satisfaction: An emerging
health policy issue. What the orthopaedic surgeon needs to know. AAOS Now,
7(6), 26.
Murray, R. B., & O’Kane, D. A. (2014). Physician assistants in Australia. The Journal of
the American Academy of Physician Assistants, 27(7), 9-10.
doi:10.1097/01.JAA.0000450808.28954.7a
National Commission on Certification of Physician Assistants (2012). 10-year
certification maintenance cycle and new cme requirements coming soon. Johns
Creek, GA: Author. Retrieved from
http://www.nccpa.net/NewsArticles/NewsArticlesNewsBlastMar2012
National Commission on Certification of Physician Assistants (2014). 2013 statistical
profile of certified physician assistants. An annual report of the national
commission on certification of physician assistants. Johns Creek, GA: Author.
Retrieved from
http://www.nccpa.net/Upload/PDFs/2013StatisticalProfileofCertifiedPhysicianAs
sistants-AnAnnualReportoftheNCCPA.pdf

71
Nielsen, D. M., Gill, K., & Ricketts, D. M. (2005). Satisfaction levels in orthopaedic out-
patients. Annals of The Royal College of Surgeons of England, 87(2), 106-108.
doi:10.1308/1478708051739
Nitse, P. S., & Rushing, V. (1996). Patient satisfaction: The new area of focus for the
physician’s office. Health Marketing Quarterly, 14(2), 73-84.
Oliver, D. R., Conboy, J. E., Donahue, W. J., Daniels, M. A., & McKelvey, P. A. (1986).
Patients’ satisfaction with physician assistant services. Physician Assistant, 10(7),
51-54, 57-60.
Otani, K., Waterman, B., & Dunagan, W. C. (2012). Patient satisfaction: How patient
health conditions influence their satisfaction. Journal of Healthcare Management,
57(4), 276-292.
Patient Protection and Affordable Care Act (PPACA), 111-148 U.S.C. (2010). Retrieved
from www.gpo.gov/fdsys/pkg/PLAW-111publ148/pdf/PLAW-111publ148.pdf
Pedersen, D. M. (2003). Credentialing: Accreditation, certification, and licensing. In R.
Ballweg, S. Stolberg, & E. Sullivan (Eds.), Physician assistant: A guide to
clinical practice (3rd
ed., pp. 38-49). Philadelphia, PA: Elsevier.
Quintana, J. M., Gonzalez, N., Bilbao, A., Aizuru, F., Escobar, A., Esteban, C., San-
Sebastian, J. A., De-La-Sierra, E., & Thompson, A. (2006). Predictors of patient
satisfaction with hospital health care. BMC Health Services Research, 6(102), 1-9.
doi:10.1186/1472-6963-6-102
Robson, C. (2011). Real world research (3rd
ed.). Chichester, England: Wiley.
Salkind, N. J. (2011). Exploring research (8th ed.). Upper Saddle River, NJ: Pearson
Merrill Prentice Hall.
72
Sargen, M., Hooker, R. S., & Cooper, R. A. (2011). Gaps in the supply of physicians,
advance practice nurses, and physician assistants. The Journal of the American
College of Surgeons, 212(6), 991-999. doi:10.1016/j.jamcollsurg.2011.03.005
Smith, B., Muma, R. D., Burks, L., & Lavoie, M. M. (2012). Factors that influence
physician assistant choice of practice location. The Journal of the American
Academy of Physician Assistants, 25(3), 46-51.
Taylor, J. H. (2012). Ways to improve patient satisfaction. Radiologic Technology, 83(6),
618-619.
Thayaparan, A. J., & Mahdi, E. (2013). The patient satisfaction questionnaire short form
(PSQ-18) as an adaptable, reliable, and validated tool for use in various settings.
Medical Education Online, 18, 1-2. doi:10.3402/meo.v18i0.21747
Thomas, A. M. (1998). Patient satisfaction: Measuring the art of medicine. The Journal
of the American Medical Association, 280(24), 2127.
doi:10.1001/jama.280.24.2127
Thompson, D. A., & Yarnold, P. R. (1995). Relating patient satisfaction to waiting time
perceptions and expectations: The disconfirmation paradigm. Academic
Emergency Medicine, 2(12), 1057-1062.
Thompson, D. A., Yarnold, P. R., Williams, D. R., & Adams, S. L. (1996). Effects of
actual waiting time, perceived waiting time, information delivery, and expressive
quality on patient satisfaction in the emergency department. Annals of Emergency
Medicine, 29(6), 657-665.
Tremlett, G. (1977). Patient satisfaction in an orthopaedic ward. Nursing Times, 73(46),
1801-1804.

73
Van Atta, J. (2012a). A physician assistant is an investment of your time, money, and
reputation. Orthopedics Today, 32(5), 34.
Van Atta, J. (2012b). Scope of practice for physician assistants determined by a number
of factors. Orthopedics Today, 32(11), 30-31.
Van Atta, J. (2013a). How to get the most out of your physician assistant. Orthopedics
Today, 33(3), 26.
Van Atta, J. (2013b). Physician and PA teamwork: How to determine the best role for
your PA. Orthopedics Today, 33(6), 27.
Verbeek, J., van Dijk, F., Rasanen, K., Piirainen, H., Kankaanpaa, E., & Hulshof, C.
(2001). Consumer satisfaction with occupational health services: Should it be
measured? Occupational and Environmental Medicine, 58(4), 272-278.
Ware, J. E., Snyder, M. K., Wright, W. R., & Davies, A. R. (1983). Defining and
measuring patient satisfaction with medical care. Evaluation and Program
Planning, 6(3), 247-263. doi:10.1016/0149-7189(83)90005-8
Warner, M. L., Maio, C., & Hudmon, K., S. (2013). Career patterns of physician
assistants: A retrospective longitudinal study. Journal of the American Academy
of Physician Assistants, 26(6), 44-48. doi:10.1097/01.JAA.0000430342.95024.13
White, B. (1999). Measuring patient satisfaction: How to do it and why to bother. Family
Practice Management, 6(1), 40-44.
Wiemiller, M. P., Somers, K. K., & Adams, M. B. (2008). Postgraduate physician
assistant training programs in the United States: Emerging trends and
opportunities. The Journal of Physician Assistant Education, 19(4), 58-63.

74
Yockey, R. D. (2011). SPSS Demystified: A step by step guide to successful data analysis
(2nd
ed.). Boston, MA: Prentice Hall

75
Appendix A
The Patient Satisfaction Questionnaire (PSQ)

76
Patient Satisfaction Questionnaire
A Physician (MD) is a person who is legally qualified to practice medicine.
A Physician Assistant (PA) is a person who is qualified to practice medicine under the
supervision of a licensed physician.
Interpersonal manner is the way in which providers interact personally with patients.
Technical quality is the competence of providers and adherence to high standards of
diagnosis and treatment.
Please circle the letter or number of your response for the following questions
1. Today I received care primarily from:
A. Physician (MD)
B. Physician Assistant (PA)
C. Both
2. How would you rate your satisfaction with the time you had to wait to be treated today
by your healthcare provider (i.e., MD or PA)?
1 2 3 4 5 6 7
(Very Dissatisfied) (Very Satisfied)
3. How would you rate your satisfaction with the technical quality of care you received
today from your primary care giver (i.e., MD or PA)?
1 2 3 4 5 6 7
(Very Dissatisfied) (Very Satisfied)

77
4. How would you rate your satisfaction with the interpersonal manner of your primary
care giver (i.e., MD or PA)?
1 2 3 4 5 6 7
(Very Dissatisfied) (Very Satisfied)
5. How would you rate your overall satisfaction with the care you received today by your
primary care giver (i.e., MD or PA)?
1 2 3 4 5 6 7
(Very Dissatisfied) (Very Satisfied)
6. Would you be willing to wait longer in the orthopedic clinic to be seen primarily by a
Physician, rather than a Physician Assistant (PA)?
A. Yes
B. No
7. If you answered, “Yes” to the above question, how much longer would you have been
willing to wait to be seen primarily by a Physician?
A. 30 Minutes
B. 60 Minutes
C. 90 Minutes
D. 120 Minutes and longer
8. Which age group do you belong to?
A. 18-44
B. 45-64
C. 65 and older

78
9. What is your gender?
A. Female
B. Male
10. What can be done to improve your level of satisfaction?

79
Appendix B
The Patient Satisfaction Questionnaire (PSQ) Pilot

80
Patient Satisfaction Questionnaire
A Physician (MD) is a person who is legally qualified to practice medicine.
A Physician Assistant (PA) is a person who is qualified to practice medicine under the
supervision of a licensed physician.
Interpersonal manner is the way in which providers interact personally with patients.
Technical quality is the competence of providers and adherence to high standards of
diagnosis and treatment.
Please circle the letter or number of your response for the following questions
1. Today I received care primarily from:
A. Physician (MD)
B. Physician Assistant (PA)
C. Both
2. How would you rate your satisfaction with the time you had to wait to be treated today
by your healthcare provider (i.e., MD or PA)?
1 2 3 4 5 6 7
(Very Dissatisfied) (Very Satisfied)
3. How would you rate your satisfaction with the technical quality of care you received
today from your primary care giver (i.e., MD or PA)?
1 2 3 4 5 6 7
(Very Dissatisfied) (Very Satisfied)

81
4. How would you rate your satisfaction with the interpersonal manner of your primary
care giver (i.e., MD or PA)?
1 2 3 4 5 6 7
(Very Dissatisfied) (Very Satisfied)
5. How would you rate your overall satisfaction with the care you received today by your
primary care giver (i.e., MD or PA)?
1 2 3 4 5 6 7
(Very Dissatisfied) (Very Satisfied)
6. Would you be willing to wait longer in the orthopedic clinic to be seen primarily by a
Physician, rather than a Physician Assistant (PA)?
A. Yes
B. No
7. If you answered, “Yes” to the above question, how much longer would you have been
willing to wait to be seen primarily by a Physician?
A. 30 Minutes
B. 60 Minutes
C. 90 Minutes
D. 120 Minutes and longer
8. Which age group do you belong to?
A. 18-44
B. 45-64
C. 65 and older

82
9. What is your gender?
A. Female
B. Male
10. Were the questions clear and easy to understand? If not, please explain why.
A. Yes
B. No
11. Did you have difficulty completing the survey? If yes, please explain why.
A. Yes
B. No

83
Appendix C
Participant Remarks

84
Participant Remarks
1. Quick and thorough. Good job!
2. Nothing
3. My first experience, it was great
4. Always good job. This is what I love about (the name of the orthopedic clinic). If
I was a pro athlete or just me, I get the same care, respect, and attention from the
staff. Everything (the name of the orthopedic clinic) does to give dignity to its
patients is always first class
5. 100% is hard to beat
6. More information on the surgery and recovery beforehand.
7. Nothing/great
8. Nothing. Satisfied with the PA (name of the PA) as he is!
9. Everything was fine
10. Improve waiting time
11. Have snacks
12. Very satisfied
13. None, love (the name of the orthopedic clinic)
14. I have been completely satisfied. Even when I see a PA, if I need to talk to my
physician I’ve been able to
15. Everything went well
16. Not much. I’ve been very happy with the services I’ve been provided with
17. I’m quite satisfied with (the name of the physician’s) staff and PAs
18. I am always satisfied when coming to (the name of the orthopedic clinic)

85
19. Nothing! I’m satisfied! Thanks!
20. Nothing. Very friendly and answered all my questions
21. Very satisfied
22. Not have to need treatment at all
23. Be sure to listen to the patient. Each pain or surgery is new to us so must be
explained in detail
24. Just need more backwards motion!
25. ?
26. never had any problem with this facility. Always friendly people, courteous
27. Nothing! (the name of the orthopedic clinic) and (the name of the PA) are great!!
28. Everything went well and I’m satisfied how things are going
29. The physician and the PA were very good and I am completely satisfied
30. Very satisfied
31. I could not be happier with my care from my physician and physician assistant
32. Not much. Thank you
33. Nothing. Everything was fully explained and treated promptly
34. Did a great job. Answered questions thoroughly
35. Not a thing
36. I can’t think of anything. Awesome quality care
37. Was very satisfied. Everyone was great!
38. I am totally satisfied. Thank you
39. Not much. Excellent
40. Have appointments later in the afternoon

86
41. I can see nothing to improve on the care I have received from personnel and
doctors. Hooray!
42. Satisfied
43. Nothing. I am very happy with (the name of the orthopedic clinic).
44. I am happy with using a PA for just getting a shot
45. (Name of professional sports team) posters in the room!
46. I am very satisfied with my care here
47. Completely satisfied with the services. (Name of physician) and (name of the PA)
are the best!