patient and physician attitudes and behaviors associated ... · amie c. braman, ph.d. ... gathered...
TRANSCRIPT

Patient and Physician Attitudes and Behaviors Associated With
DTC Promotion of Prescription Drugs —
Summary of FDA Survey Research Results
Final Report November 19, 2004
Kathryn J. Aikin, Ph.D. Division of Drug Marketing, Advertising, and Communications Center for Drug Evaluation and Research Food and Drug Administration John L. Swasy, Ph.D. Kogod School of Business American University Amie C. Braman, Ph.D. Division of Drug Marketing, Advertising, and Communications Center for Drug Evaluation and Research Food and Drug Administration
U.S. Department of Health and Human Services Food and Drug Administration
Center for Drug Evaluation and Research

i
TABLE OF CONTENTS
ACKNOWLEDGEMENTS ......................................................................................................... 3
EXECUTIVE SUMMARY .......................................................................................................... 1
INTRODUCTION......................................................................................................................... 9
METHODOLOGY ..................................................................................................................... 12 Patient Surveys ..................................................................................................................................... 12
Patient Sample.................................................................................................................................... 12 Procedures for Collecting Information............................................................................................... 14 Response Rate .................................................................................................................................... 15 Asking about Cipro ............................................................................................................................ 16
Physician Survey................................................................................................................................... 16 Physician Sample ............................................................................................................................... 16 Procedures for Collecting Information............................................................................................... 18 Response Rate .................................................................................................................................... 18
PATIENT RESULTS.................................................................................................................. 20 Awareness and Exposure to DTC Advertising .................................................................................. 20 Patient Reactions to the Brief Summary in Print DTC Advertisements ......................................... 24 Ad - Evoked Information Seeking Behaviors..................................................................................... 26
Searching for Additional Information ................................................................................................ 26 Information Sources ........................................................................................................................... 26 Type of Information Sought ............................................................................................................... 31 Consulting the Doctor about a New Medical Condition .................................................................... 31
Interaction with the Doctor ................................................................................................................. 32 Reasons for Visiting Doctor ............................................................................................................... 32 Sources Prompting Questions for the Doctor..................................................................................... 33 Patient Expectations about Receiving a Prescription ......................................................................... 34 Asking about Prescription Treatment and about Specific Brands...................................................... 36 Doctor Reaction to Questions............................................................................................................. 37
Cost-of-Treatment Discussions between Patients and Doctors ........................................................ 41 Patient Opinions of DTC Advertising................................................................................................. 45
Other Opinion Questions Asked in 2002 ........................................................................................... 51 Beliefs about DTC Advertising and the Doctor-Patient Interaction................................................... 52
PHYSICIAN RESULTS............................................................................................................. 55 Patient-Initiated Questions about Treatment .................................................................................... 55 Patient-Initiated Questions about Cost............................................................................................... 58 Influence of DTC Advertising on a Specific Patient Interaction...................................................... 59
Perceived Benefits and Problems of DTC Exposure in a Specific Patient Interaction ...................... 59 Patient Drug Requests and Physician Prescribing Behavior .............................................................. 63 Perceived Patient Influence on the Interaction................................................................................... 67
Physicians’ Opinions about the General Influence of DTC Advertising......................................... 69 Beliefs about Patient Understanding of Prescription Drugs............................................................... 70

ii
Potential Negative Effects of DTC Advertising................................................................................. 72 Potential Positive Effects of DTC Advertising .................................................................................. 78
Overall Influence of DTC Advertising................................................................................................ 81
GENERAL DISCUSSION ......................................................................................................... 85 Does DTC Advertising Increase Awareness?..................................................................................... 85 What actions does DTC advertising foster?....................................................................................... 86
Information-Seeking........................................................................................................................... 86 Question Generation........................................................................................................................... 88
Does DTC affect the doctor-patient interaction and, if so, how? ..................................................... 89 Magnitude of DTC-Motivated Doctor Visit....................................................................................... 90 Feelings about DTC in a Specific Doctor-Patient Interaction............................................................ 90 Requesting Behaviors and Pressure to Prescribe................................................................................ 91
What are patients’ and physicians’ general opinions about DTC? ................................................. 92 Limitations and Future Research ....................................................................................................... 94
REFERENCES............................................................................................................................ 97
APPENDIX A: GUIDANCE FOR INDUSTRY ON CONSUMER-DIRECTED BROADCAST ADVERTISEMENTS..................................................................................... 101
APPENDIX B.1: PATIENT QUESTIONNAIRE MATERIALS........................................ 102
APPENDIX B.2: PATIENT QUESTIONNAIRE MATERIALS........................................ 103
APPENDIX B.3: PHYSICIAN QUESTIONNAIRE MATERIALS ................................... 104
APPENDIX C: SUPPLEMENTAL ANALYSES ................................................................. 105
END NOTES ............................................................................................................................. 106

ACKNOWLEDGEMENTS We thank Nancy Ostrove for her leadership in the field of direct-to-consumer advertising and her valuable input into this project. We also thank the American Medical Association for their assistance, and Market Facts, Inc., for their careful collection of the data. Finally, we thank Ellen Tabak for her work on the first questionnaire.

Attitudes and Behaviors Associated with DTC Promotion of Prescription Drugs
EXECUTIVE SUMMARY Historically, prescription drug advertising in the United States was directed primarily toward health professionals, rather than consumers. Direct-to-consumer (DTC) prescription drug advertising, however, began to appear in print as early as the 1980s and spread increasingly to broadcast formats after the publication in 1997 of the FDA guidance for industry, Consumer-Directed Broadcast Advertisements.1 As the amount and visibility of DTC promotion increased, calls for research investigating the role of DTC advertising in either creating benefits or causing problems for consumers and the healthcare system intensified. To evaluate the effects of the guidance and DTC broadcast advertising, in general, on the public health and on doctor-patient interaction, FDA conducted two surveys of patients and one survey of physicians. These surveys explored patient and physician perspectives on DTC advertising as it relates to the healthcare experience. Findings indicate that DTC advertising has important positive and negative effects. The following summary provides a brief overview of the major findings from the three surveys. PATIENT SURVEYS Because DTC advertising for prescription drugs targets consumers, particularly those who might have a condition the drug treats, FDA surveyed samples of adults to assess their exposure to, perceptions of, and attitudes toward DTC advertising. FDA limited the sample to consumers (patients) who had visited a healthcare provider within the last 3 months because these individuals could also provide insight on how DTC advertising influenced their relationship and interactions with their health professionals. Two national telephone surveys were conducted in 1999 (response rate: 65%; sample size = 960) and 2002 (response rate: 53%; sample size = 944). The two surveys were designed to be comparable; minor modifications were made in 2002 for clarity or general improvement. The main objective of the patient studies was to assess the variety of ways DTC advertising could influence the doctor-patient interaction. Both the 1999 and 2002 patient surveys queried respondents about:
• Their awareness of DTC advertising
• The processes used in seeking more information and asking questions about advertised drugs
• Specific behavior in raising questions and conversing with their healthcare professional
• Their general opinions of DTC advertising
1 FDA, guidance for industry, Consumer-Directed Broadcast Advertisements (August 9, 1999; 64 FR 43197; see also Appendix A.
1
Attitudes and Behaviors Associated with DTC Promotion of Prescription Drugs Findings The patient studies revealed a nearly universal awareness of DTC advertising, with 81 percent reporting exposure to broadcast or print promotion in 2002, an increase from 72 percent in 1999 (all differences reported are statistically significant at the 5 percent level). Although television was the most common vehicle of exposure, with print advertisements a close second, patient awareness of advertisements on the Internet increased from 1999 to 2002. Patients also reported substantial exposure to advertisements in grocery stores and pharmacies. Regardless of whether they understood the content, most patients knew that DTC advertisements typically contain both benefit and risk information.
Seeking Information DTC advertisements prompted a sizable percentage of patients to seek additional information about the drug, the condition it treats, or health in general. In 2002, 43 percent of respondents reported that an advertisement caused them to look for more information, either about the drug or about their health. The most commonly reported sources of this additional information were healthcare providers. Eighty-nine percent (89%) of respondents reported obtaining information from their doctors, and 51 percent obtained information from their pharmacists. A sizable proportion of respondents also gathered information from reference books (40%) and from friends, relatives, and neighbors (38%). The number of people searching the Internet for drug or health information jumped considerably—from 18 percent in 1999 to 38 percent in 2002—with information about risks being most commonly sought. Far more people looked for information about side effects than about benefits (61% vs. 10%). Few people spontaneously reported that they search for information about cost (4%). DTC advertisements also prompted some people to seek information about new or previously untreated conditions, although the number of people who said that a DTC advertisement caused them to talk to a doctor about such conditions decreased from 27 percent in 1999 to 18 percent in 2002.
Visits to the Healthcare Provider
• Visit prompting Our data show that people do not report DTC advertising as a primary reason for initiating a visit to the doctor. Only 4 percent of patients said they visited their doctor because of a DTC advertisement. Instead, health-related problems, such as previous conditions and check-ups, were the most common reasons given.
• Question generation DTC advertising and other sources did appear to play a role in generating questions for the doctor. About one third of respondents indicated that a DTC advertisement had generated a question for their doctor, similar to the number that reported friends and family members as a source of questions. Approximately 20 percent reported that a reference book sparked a question. 2

Attitudes and Behaviors Associated with DTC Promotion of Prescription Drugs
• Expectations about receiving prescription drugs There have been concerns that DTC advertising has the potential to create general expectations about receiving prescriptions. Our research does not provide strong support for this concern. Approximately 42 percent of patients expected a prescription at their most recent visit with their physicians. Of these patients, the greatest percentage (63%) said this was because they expected a refill for a current prescription. Another 17 percent said that they expected a prescription because they were sick and thought or knew they had a condition that required treatment. Only 6 percent said that they expected a prescription because of an advertisement they saw on television, and 5 percent said their expectations stemmed from an advertisement in a magazine. Note that these reasons are not mutually exclusive; patients may have had more than one reason for expecting a prescription (e.g., respondents could have seen an advertisement for a drug they were currently taking).
• Asking behaviors In both 1999 and 2002, the percentage of patients asking their doctor whether a prescription was available to treat their conditions remained constant at about 32 percent. Of these respondents, 39 percent asked about a specific brand. Patients described their physicians’ reactions as nearly uniformly positive when they asked about a prescription drug. Over 90 percent reported that their doctor welcomed their questions, and 83 percent reported that the doctor responded as if their questions were a normal part of the visit.
• Prescribing response About half of the patients reported that the doctor prescribed the drug they had asked about. Another 41 percent of patients were told to change their behavior or diet, and about a third received a recommendation for a different prescription drug. Although all patients were equally likely to receive a recommendation to make lifestyle changes or to use over the counter (OTC) or generic drugs, patients who asked specifically about a particular brand were more likely to receive a prescription for the requested drug than those who simply asked whether there was a prescription treatment available for them.
Patient Opinions about DTC Advertising The surveys also measured patients’ opinions about various positive and negative effects of DTC advertising. Because the data are most recent, the 2002 percentages are reported in this summary, but in some cases there were substantial differences between the 1999 and 2002 data. These differences are noted below. None of the differences were moderated by demographic characteristics or health conditions.
• Information Patient perceptions of the type, quantity, and implications of the information they glean from advertisements are important considerations when assessing the effects of DTC advertising. Generally, about three out of four respondents (77%) agreed that DTC advertisements increase awareness of new drugs (a decline from 86% in 1999). Fifty-eight percent (58%) felt the ads provide enough information to make a decision about whether to discuss the drug with a doctor (a decline from 3

Attitudes and Behaviors Associated with DTC Promotion of Prescription Drugs 70%). In terms of specific content within the ads, 60 percent felt the ads do not provide enough information about risks, and 44 percent believed the ads lack adequate benefit information. Finally, 39 percent of respondents thought that DTC advertisements encourage patients to look for more information about potentially serious medical conditions (this question was asked only in 2002).
• Influence on relationship with healthcare provider Seventy-three percent (73%) of patients agreed that the ads do not minimize the role of the physician in product decisions. Forty-three percent (43%) felt the ads help them have better discussions with their doctor (a decline from 62%). Moreover, 10 percent of patients were reluctant to talk to their doctors about an advertised drug for fear of implying a distrust of the doctor (an increase from 7%).
• Overstatement of benefits Two questions in the 2002 survey addressed the issue of accuracy in DTC advertisements, particularly with regard to claims that sponsors make. A little more than half (58%) believed the ads make the products seem better than they really are. Forty-two percent (42%) felt the advertisements make it seem like the drug will work for everyone.
• Effects on own health Finally, patients were asked about how DTC influences their own health. Thirty-two percent (32%) felt the ads help them make better health decisions (a decline from 47%). Eighteen percent (18%) of respondents agreed that DTC advertisements remind them to take their medications, whereas 17 percent reported that the advertisements cause anxiety about their health. These last two questions were not asked in 1999.
• General attitudes About a third of respondents (32%) indicated that they “like seeing” DTC advertisements in 2002, a substantial decline from 1999, when 52 percent reported that they "liked seeing" DTC advertisements.
Other Important Findings
• Brief summary The brief summary, a section of medical information that accompanies the main display portion of all print DTC advertisements, is designed to provide detailed risk information in a publicly accessible, yet anonymous, environment. Overall, patients in the 2002 survey expressed an interest in the information provided in all parts of a print advertisement when they had a reason to consider the drug. About 78 percent of respondents reported reading all or almost all of the main body of the advertisement when interested, and 45 percent of patients reported reading all or almost all of the brief summary when they were interested in the drug. Despite this desire for information, half of those who read at least some of the brief summary described it as difficult to read.
• Cost issues 4

Attitudes and Behaviors Associated with DTC Promotion of Prescription Drugs Finally, respondents in our surveys reported rarely talking to their doctor about the cost of prescription drugs. Forty percent (40%) of respondents indicated that they never discuss this issue with their healthcare provider, whereas only 16 percent reported discussing it frequently. Patients who were female, in poor health, taking one or more prescription drugs, and lacking a prescription drug insurance plan were most likely to ask their doctors about the cost of treatment. PHYSICIAN SURVEY The third survey, conducted in 2002, questioned office-based physicians (response rate: 46%; sample size = 500) about the role of DTC in influencing physicians’ practices and relationships with their patients. The 250 primary care physicians (including internists, general practitioners, family practitioners, and obstetricians/gynecologists) and 250 specialists (including dermatologists, endocrinologists, allergists/pulmonologists, and psychiatrists) in this survey were chosen randomly from the American Medical Association’s Physician Masterfile, which contains a listing of all physicians who have graduated from medical school in the United States. Specialties were selected to reflect those areas of therapy in which DTC advertising was most prominent at the time of the study. The 2002 physician questionnaire (Appendix B) asked for information regarding the frequency of questions physicians received from patients, physicians’ responses to questions regarding patient questions, and prescribing behaviors involved in a recent, specific encounter in which a DTC-advertised drug was discussed. Finally, general questions were asked about physicians’ opinions regarding DTC advertising. Findings Physicians reported an increase in the frequency of patient questions about healthcare topics during the last 5 years in all areas except OTC drugs. The most frequently asked questions were about drug treatments, with 85 percent of physicians reporting that their patients asked about prescription drugs frequently ("often/all the time") and 62 percent reporting that their patients asked about generic drugs frequently. Primary care physicians were significantly more likely than specialists to report an increase in patient questions about prescription drugs.
Specific Patient Encounters Physicians were asked to focus on a specific, recent patient encounter in which a patient had initiated discussion about a prescription drug the patient had seen advertised. Physicians were then asked to describe in their own words specific benefits and problems that arose because of this exposure.
• Benefits and problems of patient DTC exposure Forty-one percent of physicians reported that DTC exposure led to benefits, whereas 18 percent reported that the exposure led to problems. Benefits included better discussions, greater awareness of treatments, and DTC as a source for informing and educating patients. Problems included the time needed to correct misconceptions, requests for unnecessary drugs, and requests for one prescription treatment when another treatment was effective. Overall, 73 percent of physicians indicated that their patient in this encounter asked thoughtful questions because of the DTC exposure. However, 41 5
Attitudes and Behaviors Associated with DTC Promotion of Prescription Drugs percent of all physicians indicated that their patient was confused about the effectiveness of the drug because of the DTC advertisement.
• Patient drug requesting behavior The physician survey distinguished between patients asking if there was a prescription drug to treat their problem and those asking for a particular prescription drug. Eighty-six percent (86%) of physicians recalled patients asking about a prescription drug, and 88 percent of these physicians reported that patients had the condition the drug treats. Although primary care physicians received more requests for a prescription treatment in general than did specialists (60% vs. 44%), the likelihood of prescribing the requested drug was similar (77% vs. 74%). When asked for a specific brand name drug, however, primary care physicians were both more likely to receive requests than specialists (65% vs. 52%) and also more likely to prescribe the drug (64% vs. 46%).
• Denial of requests Physicians gave many reasons for not prescribing a requested drug. Among all physicians, the most frequently mentioned reasons were that the drug was not right for the patient and that another drug was more appropriate. Primary care physicians and specialists differed, however, in their primary reasons for not prescribing the requested drug. Primary care physicians reported not prescribing primarily because of the availability of a less expensive drug, the patient did not require a prescription drug, or the patient could engage in behavioral and diet changes. Specialists tended to decline the request because a different drug was more appropriate, the drug was not right for the patient, or the drug had side effects unknown to the patient.
• Pressure to prescribe About half of all physicians reported no pressure to prescribe, and 91 percent of physicians reported that the particular patient they recalled did not attempt to influence their treatment in a manner that would have been harmful to the patient. Primary care physicians did report more pressure to prescribe than did specialists, however, with 22 percent of primary care physicians feeling "somewhat" or "very pressured" to prescribe a drug, compared with 13 percent of specialists. Approximately 73 percent of primary care physicians reported that they thought patients came to the appointment expecting a prescription, whereas 63 percent of specialists felt the same way. Primary care physicians were more likely to say that this expectation influenced their decision to prescribe.
General Opinions about DTC Advertising In addition to examining physicians’ recall of recent, specific patient encounters, the study also investigated physicians’ general opinions of the influence of DTC advertising on their patients and practices.
• Opinions about patient understanding Doctors perceived differing levels of patient understanding about DTC advertised drugs. On one hand, more than 75 percent believed that their patients understood that these drugs are available only by prescription (92%), that only a doctor can make the decision about the appropriateness of the drugs 6

Attitudes and Behaviors Associated with DTC Promotion of Prescription Drugs (82%), and that patients understood the benefits of the drugs (78%). On the other hand, fewer than half believed that patients understood the risks and possible negative effects of the drugs (40%), the limitations of drug efficacy (30%), and the type of person who should avoid the drugs (25%).
• Opinions about problems Physicians were also asked their perceptions of general problems arising from their patients’ exposure to DTC advertising. A majority of all physicians felt that patients confuse the relative risks and benefits of DTC-advertised drugs (65%) and that these advertisements lead patients to overestimate the efficacy of the drugs (75%). Smaller percentages of physicians believed that DTC advertising causes patients to question their diagnoses (38%) and that the advertising led to tension in the doctor-patient relationship (28%). In general, primary care physicians were more likely than specialists to indicate that DTC advertising causes problems for their patients and practice.
• Opinions about benefits With regard to general benefits of DTC advertising, 72 percent of physicians agreed that DTC advertising increases awareness of possible treatments, and 44 percent of physicians believed that it facilitates earlier awareness of health conditions. About a third of physicians thought that DTC advertising increases the likelihood of proper medication usage, and a third believed it helps patients maintain their treatment over time.
• Overall impressions At the end of the interview, physicians were asked to give their general impressions of the influence of DTC advertising on their patients and practice. Responses were evenly divided, with about one-third each indicating that it had a positive effect, a negative effect, or no effect at all. Primary care physicians (38%) were more likely than specialists (27%) to rate the overall influence of DTC advertising as having a somewhat or very negative effect on their patients and practice. CONCLUSIONS The opinions and experiences of patients and physicians are critical to an evaluation of how DTC advertising affects public health. DTC advertising may potentially affect this interaction by motivating information seeking, healthcare visits, questions, and/or requests. Ultimately, such motivation can have both positive and negative effects. The three surveys conducted by FDA found both positive and negative effects of DTC advertising on doctor-patient interaction. By and large, DTC advertising seems to increase awareness of conditions and treatments, motivate questions for the healthcare provider, and help patients ask better questions. Our data provided no evidence of increased visits as a result of DTC advertising, and few patients reported that DTC advertising motivated physician visits. On the contrary, most people reported that health reasons prompted their visits. It is clear, however, that DTC advertising also has effects that can be troubling. Although few physicians report excessive pressure to prescribe requested drugs from patients who have seen DTC 7

Attitudes and Behaviors Associated with DTC Promotion of Prescription Drugs advertisements, nearly half report feeling at least a little pressure to prescribe. Both patients and doctors indicate that DTC advertisements overstate drug efficacy and do not present a fair balance of benefit and risk information. Patients gave only modest ratings to the understandability of the brief summary included in print advertisements, information that is meant to provide a more complete picture of the advertised product’s risks. They also expressed some negative opinions about DTC advertising. Perhaps more important, fewer patients in the 2002 survey than in the survey conducted 3 years earlier indicated that DTC advertising was useful in terms of their interaction with their doctor and their healthcare decision making. We continue to encourage research on all aspects of potential DTC influence on the interaction between patients and their physicians. The relationship between patients and physicians is essential for the proper dissemination of prescription drugs. Any influence that DTC advertising has on this special relationship may have broader implications for healthcare in general.
8

Attitudes and Behaviors Associated with DTC Promotion of Prescription Drugs
INTRODUCTION Under the Federal Food, Drug, and Cosmetic Act (the FD&C Act), the Food and Drug Administration (FDA) has responsibility to assure proper labeling and promotion of prescription (Rx) drugs. FDA regulations (21 CFR 202.1) require that prescription drug advertisements sponsored by a product’s manufacturer:
• Cannot be false or misleading (as determined by consistency with approved product labeling)
• Must present a fair balance between the risks and benefits of the product
• Must reveal “facts material” in light of representations made by the advertisement, or in light of the consequences of using the product as advertised
• Must, depending on the medium in which the advertisement appears, either disclose all the risks in the product’s approved labeling, or make “adequate provision” for disseminating the product’s labeling to the audience.
The FDA is responsible for enforcing the FD&C Act and implementing regulations. The regulations distinguish two types of prescription drug advertisements: product claim and reminder.2 Product claim advertisements may disclose the indications and benefits of a drug product and are subject to the fair balance and risk disclosure requirements stated above. Advertisements that draw attention to the name of a particular prescription drug, but do not reveal indications or dosage recommendations for use of the drug product, are called reminder advertisements. Reminder ads may mention the proprietary and established name of the drug product and (optionally) contain information about the ingredients, dosage form, quantity, price, or manufacturer (21 CFR 202.1(e)(2)(i)). Graphic presentation and information is not prohibited in reminder advertisements as long as that information does not make a representation or suggestion relating to the product beyond those permitted. The regulations governing prescription drug advertising do not distinguish between health professional and consumer audiences. The regulatory focus is on the content of the materials, not their general audience. Nevertheless, until relatively recently, the majority of prescription drug advertising was directed primarily toward healthcare professionals, rather than consumers. In the early 1980s, sponsors began experimenting with direct-to-consumer (DTC) print advertisements for prescription drugs. On September 2, 1983, FDA issued a policy statement requesting a voluntary moratorium on DTC advertisements. After consulting with consumers, healthcare professionals, and industry, FDA concluded that there were sufficient safeguards to protect consumers and lifted the moratorium. Industry primarily relied on print advertisements until the mid-1990s when they started experimenting with broadcast DTC in the form of reminder and help-seeking advertisements.
9
2 Advertisements designed to inform and/or alert consumers to a health condition are not considered to be drug advertisements and are therefore not regulated under 21 CFR 202.1. These unbranded (or help-seeking) ads may discuss, among other things, the symptoms of a given medical condition, the availability of treatment, and the benefits of treatment, and may encourage consumers to seek information from their healthcare professional. Help-seeking advertisements are not regarded as advertisements for drug products and are not subject to the same regulatory requirements for fair balance and risk disclosure as product claim advertisements (for a discussion of help-seeking and reminder advertisements, see FDA’s guidance for industry Help-Seeking and Other Disease Awareness Communications by or on Behalf of Drug and Device Firms, available at www.fda.gov/cder/ddmac/lawsregs.htm#Guidances)

Attitudes and Behaviors Associated with DTC Promotion of Prescription Drugs
In the Federal Register of August 12, 1997 (62 FR 43171), FDA announced a draft guidance which described how sponsors could disseminate, within the requirements of the regulations, television and radio product claim advertisements for prescription drug and biological products.3 In this draft guidance, FDA specified one possible mechanism that would satisfactorily fulfill the requirement that broadcast advertisements make adequate provision for getting the full product labeling to viewers or listeners of the advertisement (see Appendix A). This mechanism included referring viewers to their healthcare providers, providing a telephone number and website, and mentioning a concurrently running print advertisement that contained more complete information. FDA suggested these methods to serve different types of viewers, including those with privacy concerns and those who do not have access to computers. The guidance was finalized on August 9, 1999 (64 FR 43197; see Appendix A).4 In the years since the draft guidance was issued, the number and frequency of DTC broadcast product claim advertisements has significantly increased. Sponsors continue to focus the majority of their promotional efforts toward health professionals, spending nearly $23 billion dollars on promotion to physicians in 2003. However, promotional dollars expended for advertising prescription drugs to consumers has continued to grow during the last 5 years, exceeding $3.2 billion dollars in 2003 (IMS Health 2003). DTC advertising has raised many issues about its ultimate effect on the public. Advocates have held that DTC advertising will more fully inform consumers about promoted products, improve interactions between patients and healthcare professionals, improve adherence to therapeutic regimens, decrease drug costs, and generally satisfy consumer interest in obtaining desired drug information (see Allison-Ottey, Ruffin, Allison, & Ottey, 2003; Allison-Ottey, Ruffin, & Allison, 2003; Calfee, 2002; Calfee, Winston & Stempski, 2002; Dubois, 2003; Golodner, 2003). Critics, on the other hand, have maintained that DTC promotion will confuse consumers, interfere with health professional-patient relationships, increase demand for unnecessary medication, increase inappropriate prescribing and misprescribing, increase drug costs, and generally pollute the information stream by barraging consumers with one-sided promotional information (see Bell, Wilkes & Kravitz, 1999; Gardner, Mintzes & Ostry, 2003; Mintzes et al., 2002; 2003). In October 1995, FDA sponsored a public hearing concerning DTC promotion (60 FR 42581). Presentations were made by representatives from the pharmaceutical industry, consumer groups, academics, and health professional associations. Although many industry and advertising/marketing groups encouraged FDA to make DTC advertising more accessible to consumers by reducing requirements for the distribution of labeling information, serious doubts about the effects of DTC promotion were expressed by consumer and healthcare professional groups. The agency requested further information and called for data on the extent to which DTC advertising influenced consumer knowledge, judgment and behavior.5 As emphasized at an academic conference sponsored by the Department of Health and Human Services’ Office of the Assistant Secretary for Planning and
3 A similar draft guidance on broadcast product claim advertisements for restricted medical devices was published on February 4, 2004, and is available at www.fda.gov/cder/ddmac/lawsregs.htm#Guidances. 4 FDA, guidance for industry, Consumer-Directed Broadcast Advertisements. 5 Federal Register, vol. 61, p. 24314, and vol. 62, p. 43171.
10

Attitudes and Behaviors Associated with DTC Promotion of Prescription Drugs
Evaluation (ASPE), research on the effects of DTC advertising on the physician-patient relationship was sorely needed (Bero & Lipton, 2001). In the notice announcing availability of the final guidance,6 FDA reiterated its intent to evaluate the effects of the guidance and consumer-directed broadcast advertising on the public health within 2 years of publication. As part of this evaluation, the agency conducted two surveys with patients (in 1999 and 2002) and one survey with physicians (in 2002) on the effects of DTC advertising on the relationship between consumers and their healthcare providers. (OMB Control Nos. 0910-0399 and 0910-0479; see Appendices B.1, B.2 and B.3). This report summarizes the findings from these three surveys.
6 Federal Register , vol. 64, p. 43197.
11

Attitudes and Behaviors Associated with DTC Promotion of Prescription Drugs
METHODOLOGY
Patient Surveys
Patient Sample Patient surveys were conducted through randomized telephone interviews with a national probability sample of adults 18 years of age or older who had visited a healthcare provider within the last 3 months for a health condition of their own. Nine hundred sixty (960) adults were interviewed for the 1999 survey, and 944 adults were interviewed for the 2002 survey.7 All respondents were able to speak and read English. A Spanish-language questionnaire was not developed for this study because virtually all DTC advertising, especially broadcast DTC advertising, was in English at the time the surveys were fielded. Data collection was conducted by a contract research firm, Market Facts, Inc.8 Table 1 outlines the complete demographic profile for the survey samples. Sixty-five percent (65%) of the survey respondents were female, and a high proportion of respondents reported ethnicity as non-Hispanic white (77% in 1999, 79% in 2002). The two survey samples were similar in terms of education (about 37% with high school degree or less), marital status (57% reported being married), income,9 health status, and health knowledge. The 2002 sample was slightly older, although not statistically significantly so (χ2 [5 df] = 10.54, p = .061; M = 49.5 [2002] vs. M = 48.2 [1999]) with 38 percent 55 years or older in 2002 versus 34 percent in 1999. Possibly associated with a slightly older sample, a larger percentage of respondents in the 2002 survey reported prescription drug use at the time of the interview (76% in 2002 versus 67% in 1999; χ2
[1 df] = 19.19, p < .001). Also, the percentage of respondents who reported taking five or more (different) prescription drugs in the last 6 months was higher in the 2002 survey (18% in 1999 versus 24% in 2002; χ2 [5 df] = 20.5, p < .001).
7 An additional 181 adults who had not been to the doctor in the last 3 months were interviewed for the 1999 survey. Results for those individuals are not summarized here. 8 Market Facts, Inc. is now known as Synovate. 9 The profile of those reporting household income differed in the two surveys (χ 2 [5 df] = 36.9, p < .001). The difference appears to stem from a higher reporting rate among higher income respondents in the 2002 survey. This may have resulted from a slight change in the question wording in 2002 (i.e., a phrase was added which may have lessened the intrusiveness of the probe, specifically “tell me which category represents your household income...” Instead of “tell me what your total household income was last year…”). The 2002 sample included fewer refusal and “don’t know” responses (18% in 1999 versus 9% in 2002), which resulted in more reporting in the higher income categories (i.e., $50,000 plus). The distributions across lower income categories were not dissimilar for the two samples (e.g., 53% were less than $50,000). Thus, we believe the samples are similar with respect to household income.
12

Attitudes and Behaviors Associated with DTC Promotion of Prescription Drugs Table 1: Respondent Demographics by Survey Year 1999
percent (n) 2002 percent (n)
Total Number of Respondents 960 944 Age 18-24 7% (69) 7% (65) 25-34 16% (155) 15% (140) 35-44 23% (218) 18% (171) 45-54 20% (196) 22% (208) 55-64 14% (131) 17% (164) 65+ 20% (191) 21% (196) Gender Male 35% (334) 35% (327) Female 65% (626) 65% (616) Ethnicity (multiple responses permitted) American Indian/Alaska Native 4% (34) 4% (34) Asian/Pacific Islander 3% (25) 2% (23) Black/African American 12% (116) 10% (99) Hispanic/Latino 4% (43) 4% (36) White 77% (742) 79% (747) Income Less than $20,000 20% (189) 19% (185) $20,000 – less than $35,000 17% (162) 17% (161) $35,000 – less than $50,000 16% (153) 17% (158) $50,000 – less than $75,000 14% (132) 18% (166) $75,000 or more 16% (155) 20% (191) Education Completed high school or less 36% (341) 39% (366) Some college 24% (226) 21% (201) Completed college or more 40% (388) 40% (375) Marital Status Married 56% (534) 58% (550) Single 22% (212) 21% (197) Widowed 10% (100) 9% (83) Divorced 9% (84) 10% (95) Separated 3% (27) 2% (16) Health Status Excellent/Very Good 56% (536) 51% (481) Good/Fair/Poor 44% (421) 49% (463)
13

Attitudes and Behaviors Associated with DTC Promotion of Prescription Drugs Table 1, con’t. 1999
percent (n) 2002 percent (n)
Health Knowledge Extremely/Very knowledgeable 37% (354) 41% (391) Somewhat/Not at all knowledgeable 62% (597) 59% (553) Currently Taking One or More Prescription Drugs Yes 67% (644) 76% (720) No 33% (314) 24% (224) Number of Prescription Drugs Used in Last Six Months
Zero 12% (111) 10% (92) 1 21% (206) 19% (177) 2 22% (213) 19% (181) 3 16% (151) 14% (132) 4 10% (99) 14% (131) 5 or more 18% (169) 24% (226) How Recently Visited Healthcare Professional Within the last week 20% (191) 27% (252) 1 to 4 weeks ago 46% (446) 39% (364) 5 weeks ago to 3 months ago 34% (323) 35% (328) Note: Percentages may not add to 100% due to rounding, don’t know/refused response, or missing data. As noted above, to qualify for the survey, a respondent had to have seen a healthcare professional (in a nonemergency room visit) within the last 3 months. A higher percentage of respondents in 2002 reported having seen a healthcare professional more recently than in 1999 (χ2 [2 df] = 16.60, p < .001). Specifically, respondents in 2002 were more likely than those in 1999 to have seen a doctor "within the last week." The two samples were similar in the percentage whose last visit was "5 weeks to 3 months ago" (34% in 1999 vs. 35% in 2002). The majority of the 2002 sample reported they had health insurance (93%) and that their health insurance provided coverage for prescription drugs (83%). These questions were not asked in the 1999 survey.
Procedures for Collecting Information The surveys were conducted by telephone using a nationally representative sample of telephone numbers generated from a sampling system from GENESYS, the in-house sampling system Market Facts, Inc. leases from MSG, Inc. The sample generated is one in which all telephone numbers, whether listed or unlisted, have an equal probability of selection, resulting in broader coverage and less bias to the study than using listed telephone numbers only. Sampling continues by matching the generated sample against a file of all published business numbers in the United States to remove known business numbers from the sample. Computer assisted telephone interviewing (CATI) was used to ensure that skip patterns were automatically followed and to reduce error attributable to response entry. 14
Attitudes and Behaviors Associated with DTC Promotion of Prescription Drugs
Response Rate Because of resource constraints and other concerns, participants in the patient surveys were not offered a monetary incentive.10 However, several other procedures were used to achieve the maximum possible response rate:
• Selection of respondent within household Within each household, an eligible respondent was identified. If there was more than one eligible respondent in the household, the first eligible respondent to come to the telephone was interviewed. This method, unlike the traditionally employed most-recent-birthday method, boosted the response rate without affecting the resulting data.
• Callbacks Every telephone number in the sample that can potentially reach a respondent (excluding disconnects, faxes, modems, and business numbers) received an unlimited number of callbacks. The experience of other agencies has shown that this is the single most useful factor in increasing response rates. Callbacks were scheduled during different times of the day and days of the week, including weekends. Follow-up calls were made by interviewers specially trained and experienced in refusal conversion.11
• Wording of the introductory statement Participants were told the research would help the Food and Drug Administration investigate how people get information about medicines. Some research on response rates has found that referencing a respected organization in the introductory statement increases survey participation (Fox et al. 1988; Kasprzyk et al. 2001).
• Conversion letters Respondents who initially refused to participate or who terminated the interview before completion were mailed personalized letters acknowledging an attempted contact for survey participation and describing the nature and purpose of the survey. These letters were mailed approximately 2 weeks after the initial telephone contact.
• Telephone follow-up
10 The public’s expectation of incentives for survey participation has increased. Several recent public opinion surveys (e.g., Singer, Van Hoewyk & Maher 1998; Singer, Groves & Corning 1999) have found that most respondents believe they should get paid for participating in surveys. 11 Although there is evidence that prenotification letters increase response rates (e.g., Singer, Van Hoewyk & Maher, 2000), this method introduces a serious bias in the sample by being able to contact only people with listed telephone numbers. Research has found that response rates and attitudes are different for households with listed, as opposed to unlisted, telephone numbers (Traugott, Groves & Lepkowski, 1987). For this survey of the effects of DTC advertising on the public, it was vital to obtain the broadest possible representation of the American public; therefore, making unlimited callbacks was chosen as the best method for this study.
15
Attitudes and Behaviors Associated with DTC Promotion of Prescription Drugs Respondents who initially refused to participate or who terminated the interview before completion were recontacted by telephone approximately 1 week following expected receipt of the conversion letter to request their participation. These follow-up contacts were conducted by experienced interviewers trained in refusal conversion techniques. The response rate for the 1999 survey was 65 percent, and the response rate for the 2002 survey was 53 percent.12
Asking about Cipro The 2002 patient survey was fielded during a time when national attention was focused on the risk of contracting anthrax through the U.S. Postal Service or other sources. One question was included in the 2002 survey to measure the number of respondents who had talked with their doctor about prophylactic treatments for anthrax, such as Cipro (ciprofloxacin). Because this was an unusual environmental condition, respondents who indicated they had talked with their doctor about Cipro or other antibiotic treatments were asked not to consider Cipro when giving their answers about prescription drugs. The vast majority of respondents, 96 percent, reported they had not talked with their doctor about Cipro.
Physician Survey
Physician Sample The physician survey was conducted through telephone interviews with a national probability sample of 500 office-based physicians who engaged in patient care at least half-time. The sampling frame consisted of names drawn from American Medical Association’s (AMA) Physician Masterfile, which contains a listing of all physicians who have graduated from medical school in the United States. Two-hundred fifty (250) primary care physicians (internal medicine, family practice, general practice, and OB/GYN) and 250 specialists in medical conditions heavily targeted by DTC advertising (dermatologists, endocrinologists, allergists/pulmonologists, and psychiatrists) were interviewed. Table 2 outlines the demographic profile for the physician survey sample. The majority of the physicians were male (83%). The two physician subgroups (primary care physicians and specialists) did not differ in age (M = 53, SD = 10.59; Mdn = 53), years in practice (M = 22, SD = 10.72; Mdn = 21), number of prescriptions written in an average week (M = 149, SD = 113.76; Mdn = 100), or in
12 The response rate was calculated using the following formula:
Completed interviews + Screened but not qualifieda RR = Block of available numbers – (Bad numbersb + Unresolved numbersc) a = Includes language barrier (non-English speaking) b = Bad numbers consist of disconnects, circuit problems, unassigned numbers, businesses, faxes and modems,
caller ID block, and privacy manager c = Unresolved numbers consist of respondent not available, callbacks, no answer, busy, answering machine, other
communication problems (besides language barrier), respondent not available permanently, and unavailable by deadline.
16

Attitudes and Behaviors Associated with DTC Promotion of Prescription Drugs type of practice. Primary care physicians did, however, report seeing significantly more patients in an average week (M = 106.13, SD = 39.38; Mdn = 100) than did specialists (M = 97.49, SD = 51.67, Mdn = 100; t[465.27] = 2.10, p < .05). Table 2: Physician Respondent Demographics by Specialty Subgroup Primary Care
Physician percent (n)
Specialist percent (n)
Total number of respondents 250 250 Age 25 – 34 6% (14) 1% (2) 35 – 44 18% (44) 17% (43) 45 – 54 38% (95) 36% (91) 55 – 64 23% (58) 31% (77) 65+ 16% (39) 15% (37) Gender Male 83% (208) 84% (209) Female 17% (42) 16% (41) Years in Practice Less than 10 years 14% (36) 9% (22) 10 – 14 years 14% (34) 15% (37) 15 – 19 years 15% (38) 14% (34) 20 – 24 years 21% (52) 22% (56) 25 – 30 years 18% (45) 22% (55) 31 – 50 years 16% (41) 18% (46) 51 or more years 2% (4) 0 Type of Practice (multiple responses permitted) Solo practice 43% (107) 55% (137) Small group practice or partnership 44% (111) 33% (82) Multispecialty group practice 23% (57) 16% (40) Health maintenance organization or HMO 52% (131) 48% (121) Preferred provider list or network of physicians 78% (194) 74% (186) Percentage of time spent on direct patient care, per week (inpatient or outpatient)
50% – 66% 9% (22) 8% (21) 67% – 84% 14% (36) 16% (39) 85% – 100% 77% (192) 76% (190) Number of Patients seen, per week 1 – 50 10% (24) 26% (66) 51 – 100 46% (115) 35% (88) 101 – 150 37% (93) 26% (66) 151 – 200 7% (18) 12% (30)
17

Attitudes and Behaviors Associated with DTC Promotion of Prescription Drugs Table 2, con’t. Primary Care
Physician percent (n)
Specialist percent (n)
Number of Prescriptions Written, per week (including hospital and institutional orders)
1 – 50 18% (46) 22% (55) 51 – 100 34% (84) 29% (73) 101 – 150 14% (34) 12% (30) 151 – 200 16% (40) 16% (39) 201 – 250 6% (16) 4% (11) 251 – 300 6% (14) 8% (21) 301 or more 6% (16) 8% (21) Note: percentages may not add to 100% due to rounding, multiple responses, or missing data.
Procedures for Collecting Information Computer assisted telephone interviewing (CATI) was used to ensure that skip patterns were automatically followed and to reduce error attributable to response entry.
Response Rate Physicians are exceptionally busy professionals who generally employ receptionists, office managers, or nurses as gatekeepers to screen mail and telephone contacts. In an effort to maximize the response rate for physicians, several techniques were employed.
• Prenotification letters Prenotification letters were mailed to all potential physician respondents. Literature has shown that cold-calling for participation has an extremely low chance of success (Martin, Duncan, & Sawyer, 1984; Spry, Hovell, Sallis, Hofsteter, Elder, & Molgaard, 1989). The prenotification package contained an FDA-prepared letter outlining the goals of the survey. This letter described the purpose of the research and was signed by the Director of the Center for Drug Evaluation and Research. One half of the sample was also randomly selected to receive a letter of support from the Deputy Executive Vice President of the American Medical Association.13
• Callbacks 13 Physician respondents were chosen randomly from existing AMA physician lists, which track all physicians regardless of AMA affiliation. Thus, this prenotification technique carries with it a slightly different bias than that described above in the patient sample. Prenotification of physicians is less likely than a general population sample to be biased by the number of physicians whose phone numbers are unlisted; rather, by notifying the physician in advance of the survey, it presupposes that the physician’s responses are not truly anonymous (i.e., the physician’s address and name are known to the interviewer). In our estimation, however, the potential increase in response rate outweighed the risks of refusal on the basis of nonanonymity. To correct for this possibility, extra steps were taken to reassure the physician respondents that their answers would be kept confidential.
18

Attitudes and Behaviors Associated with DTC Promotion of Prescription Drugs
After the initial contact, four additional callbacks were employed in an attempt to reach the physician. A negative response from the gatekeeper was not accepted as a termination. Callbacks were scheduled during different times of the day and days of the week. If the respondent was not available, an appointment for a callback was made with the gatekeeper, and the respondent was contacted at the designated appointment time. If it was not possible to schedule an appointment, the interviewer left a telephone number for the respondent to schedule an appointment to conduct the interview. Follow-up calls were made by interviewers specially trained and experienced in refusal conversion.
• Incentives Research on the effects of incentives on physician response rates has demonstrated that physician surveys with incentives can yield response rates up to 50 percent higher than surveys without incentives (e.g., Berry & Kanouse, 1987; Donaldson et al., 1999; Gunn & Rhodes, 1981; Kasprzyk et al., 2001; Kellerman & Herold, 2001; Tambor et al., 1993). Therefore, physicians are routinely paid an incentive for their participation in surveys (e.g., Kasprzyk et al., 2001; Tambor et al., 1993) and we continued this protocol here.14
• A fax-back letter The prenotification package contained a fax-back form allowing the sampled respondent to indicate his/her willingness to participate, and, if he/she wished, to indicate the best time to set up an interview. This substantially reduced the number of fruitless calls to physicians who were not interested in participating in the survey. Response rate was calculated in the same manner as described in the patient survey section. The response rate for the physician survey was 46 percent.
14 Details of the incentives are summarized in a working paper by Aikin, Swasy, Amsbary, & Seaver (2003).
19

Attitudes and Behaviors Associated with DTC Promotion of Prescription Drugs
PATIENT RESULTS
Awareness and Exposure to DTC Advertising Quick Look • Awareness of DTC advertisements increased from 72 percent in 1999 to 81 percent in 2002.
• In 2002, respondents reported seeing advertisements primarily on television (97%), in magazines (75%), and in grocery stores or pharmacies (41%).
• Patients recognized that DTC advertisements contain information about benefits, uses, risks, and contraindications.
Awareness of prescription drug advertising increased from 1999 to 2002. More respondents in 2002 than in 1999 reported having heard or seen advertisements for prescription drugs (81% vs. 72%; χ 2 [1 df] = 21.48, p < .001). Also, patients recognized an increase in the variety of drugs advertised. Participants were asked how many different prescription drugs they recalled seeing advertised. Because of a difference in the time reference used for the 1999 and 2002 questions (in the last 3 months vs. in the last month), a direct statistical comparison is not possible between surveys. However, an inspection of the patterns in Figures 1 and 2 indicates that in 2002 participants had seen advertisements for more (different) drugs than in 1999, even with the shorter time frame (i.e., in the last month). Specifically, in 1999 about 59 percent had seen four or more drugs advertised in the last 3 months, whereas in 2002 about 71 percent had seen four or more drugs advertised in the last month.
20

Attitudes and Behaviors Associated with DTC Promotion of Prescription Drugs Figure 1: Percentage of Respondents Reporting Different Prescription Drugs Seen Advertised in the Last 3 Months (1999) Percent Number of Ads Seen 17
16
12
1
91213
21
41
0
5
10
15
20
25
30
0 1 2 3 4 5 6 7 8 9 10+
1999 Figure 2: Percentage of Respondents Reporting Different Prescription Drugs Seen Advertised in the Last Month (2002) Percent Number of Ads Seen
1618 18 18
13
910
23
00
5
10
15
20
25
30
0 1 2 3 4 5 6 7 8 9 10+
2002 Respondents continue to report television as the media in which they are most likely to have seen prescription drug advertising (94% in 1999, 97% in 2002), followed by magazines, newspapers, point-of-purchase in grocery stores (2002 only), and radio (see Table 3). The number of respondents indicating that they saw advertising on the Internet increased from 9 percent in 1999 to 16 percent in 2002. When asked about the type of information contained in DTC broadcast ads (a recognition task), participants showed similar responses across the two surveys for most types of information. As shown in Table 4, risks, benefits, contraindications, and sources for more information about the drug tend to be recalled at about the same levels in 1999 and 2002. It is important to note that this is a recall task,
21

Attitudes and Behaviors Associated with DTC Promotion of Prescription Drugs not a comprehension task. These numbers do not provide us with information about how much, if anything, patients actually understood about each of these topics. Table 3: Sources of Exposure to DTC Advertising Survey Year Have you seen or heard ads for prescription drugs in any of the following ways? (multiple responses permitted)
1999 percent (n)
2002 percent (n)
On television 94% (646) 97% (737) On the radio 28% (193) 31% (236) In a magazine 66% (456) 75% (569) In a newspaper 29% (201) 32% (240) On the Internet 9% (61) 16% (119) In a letter, flyer or announcement you got in the mail 17% (115) 22% (171) On an outdoor billboard 14% (104) In a grocery store or pharmacy 41% (310) Doctor’s office 4% (28) At work/word of mouth 1% (7) Medical/professional journal < 1% (3) Other 7% (52) 1% (7) DK/REF 0 0 Base N 688 762 Table 4: Recall of Information Topics in DTC Advertising Survey Year Have you seen TV ads that contained information about: (multiple responses permitted)
1999 percent (n)
2002 percent (n)
The benefits of the drug 87% (598) 90% (663) The condition the drug treats 90% (662) Directions for use of the drug 34% (236) 35% (256) Who could take the drug 76% (522) 74% (548) Questions to ask a doctor about the drug 63% (431) 71% (526) *What to do in case of overdose 10% (69) 12% (86) The risks or side effects of the drug 82% (562) 90% (664) Who should not take the drug 81% (558) 89% (657) How to get more information about the drug or the condition it treats
86% (632)
DK/REF 1% (10) 0 Base N 688 737 *False positive check Like many aided recall questions, there may be an upward bias in terms of estimation here. The extent of overstatement can be determined in part by including a false positive question (i.e., information that
22

Attitudes and Behaviors Associated with DTC Promotion of Prescription Drugs does not appear). The level of recognition reported by participants for the false positive is an indication of yea-saying. In other words, how often have participants in the surveys responded in the affirmative for reasons other than their actual feelings, such as habit, carelessness, or desire to please the researcher. In our surveys, we included “what to do in case of an overdose” as a false positive. Based on responses, it appears there may be a 10 to 12 percent overstatement of recognition.
23

Attitudes and Behaviors Associated with DTC Promotion of Prescription Drugs
Patient Reactions to the Brief Summary in Print DTC Advertisements Quick Look • The percentage of respondents who reported they do not usually read any of the brief summary in
DTC print advertisements has risen from 31 percent in 1999 to 41 percent in 2002.
• In 2002, among respondents who had seen a DTC print advertisement they were interested in, 45 percent read all or almost all of the brief summary, and 78 percent read all or almost all of the main ad.
• Fifty-five percent (55%) of respondents in 2002 described the brief summary as very or somewhat hard to read
In 1999 and 2002, respondents who had seen a prescription drug advertisement in a magazine or newspaper were asked to indicate how much of the brief summary (the small print portion of the advertisement) they usually read. The percentage of those reading half or more of the brief summary declined from about 39 percent in 1999 to about 27 percent in 2002 (χ2 [4 df] = 26.43, p < .001). The percentage of those usually reading none of the brief summary rose from 31 percent in 1999 to 41 percent in 2002. In 1999, respondents were asked to estimate how much of the brief summary they would read if they were especially interested in the advertised drug. In that scenario, about 85 percent indicated they would read "almost all" or "all" of the brief summary. The large difference between this percentage and the 24 percent of respondents in 1999 who say they "usually read all" or "almost all" of the brief summary (see Table 5) led us to believe that when asked to project their behavior, respondents likely overestimated how much of the brief summary they would actually read. Table 5: Amount of Brief Summary Usually Read in DTC Print Advertising How much small print information you usually read
1999 percent (n)
2002 percent (n)
Read all of the information 12% (56) 10% (59) Read almost all of the information 12% (56) 6% (34) Read about half of the information 15% (71) 11% (63) Read only a little of the information 30% (139) 32% (193) Read none of the information 31% (141) 41% (243) Didn’t even notice the information was there 2% (11) < 1% (2) DK/REF 1% (6) < 1% (1) Base N 480 595 Therefore, the question was reworded in 2002. We asked respondents who said they had seen a print ad they were especially interested in what proportion of the brief summary of that ad they read. Of the 46 percent of participants in 2002 who indicated that they had seen an advertisement in a magazine or 24

Attitudes and Behaviors Associated with DTC Promotion of Prescription Drugs newspaper for a drug they were especially interested in, 45 percent reported reading "all" or "almost all" of the brief summary. About 39 percent reported reading "a little" or "none." When asked how much of the “main” ad they read, about 78 percent read "all" or "almost all" of the main body portion part of the prescription drug ad (see Table 6). Table 6: Amount of Brief Summary and Main Ad Read in Print DTC Advertising: Respondents Who Saw An Ad They Were Interested In How much small print information did you read? (among those who saw an ad they were especially interested in)
2002 percent (n)
Read all of the information 27% (74) Read almost all of the information 18% (49) Read about half of the information 15% (41) Read only a little of the information 24% (66) Read none of the information 15% (40) DK/REF 1% (2) Base N 272 How much of main advertisement did you read? (among those who saw an ad they were especially interested in)
Read all of the information 56% (152) Read almost all of the information 22% (60) Read about half of the information 15% (41) Read only a little of the information 7% (19) Read none of the information 0 Base N 272 Note: asked only of those respondents who saw an advertisement in newspaper or magazine. In 2002, respondents who had read at least some of the brief summary were asked how easy or hard it was to understand the information presented in it. About 55 percent described it as "hard" (24% "very hard"; 31% "somewhat hard"), whereas 40 percent described it as "easy" (30% "somewhat easy"; 10% "very easy"). The likelihood of reading the brief summary for a product of special interest varied by ethnicity (χ2 [1 df] = 4.48, p < .05). Self-described nonwhite respondents were more likely than whites to report reading "all" or "almost all" of the brief summary (59% vs. 43%). Health knowledge also made a difference (χ2 [1 df] = 8.93, p < .01). Respondents who were more knowledgeable regarding medicines and health issues were more likely to read either "all" or "almost all" of the brief summary if the drug was of special interest to them (about 54% of those who are extremely or very knowledgeable versus 36% of those who are somewhat or not at all knowledgeable). No other demographic and condition characteristics (age, income, education, health status, current usage of prescription drugs, gender and marital status) were related to reported reading of the brief summary.
25

Attitudes and Behaviors Associated with DTC Promotion of Prescription Drugs
Ad - Evoked Information Seeking Behaviors Quick Look • In 2002, 43 percent of respondents reported that a DTC ad caused them to look for more
information about the drug or their health. This is a decline from 53 percent in 1999.
• Among respondents who said a DTC ad caused them to look for more information, the most commonly used sources were healthcare providers, reference books, and friends, relatives, or neighbors. The number of people using the Internet as a source of additional information increased from 18 percent to 38 percent.
• Sixty-one percent (61%) of respondents reported looking for information about side effects, whereas 10 percent looked for information about benefits.
• The percentage of respondents reporting that a DTC ad caused them to talk to a doctor about a new medical condition declined from 27 percent in 1999 to 18 percent in 2002.
Searching for Additional Information
Respondents who had seen DTC advertising on television and in a magazine or newspaper were asked if a drug advertisement had ever caused them to look for more information about the drug or their health. The percentage of respondents indicating that an ad evoked information search declined from about 53 percent in 1999 to about 43 percent in 2002 (χ2 [1 df ] = 9.12, p < .005). 15,16
Information Sources As Table 7 shows, respondents who looked for more information in response to a prescription drug ad mentioned doctors, pharmacists, nurses and reference books as their most used sources. A friend,
15 There was a slight change in the wording of the question from 1999 to 2002:
2002: Thinking about the ads you have seen both in print and on television (emphasis added), has an advertisement for a prescription drug ever caused you to look for more information, for example, about the drug or about your health? (if asked, “we mean broadcast or print ads.”) 1999: Has an advertisement for a prescription drug ever caused you to look for more information, for example, about the drug or about your health? (if asked, “we mean broadcast or print ads.”)
Although it is possible that respondents might interpret the phrase, "seen both in print and on television," as a restriction (and thus an exclusion of ads seen on just one of the two media), it seems unlikely this change alone could account for the entire observed decrease from 1999 to 2002, since this additional instruction seems minor in comparison to the subsequent, longer portion of the question.
26
16 Although none of the demographic characteristics we examined moderated the change from 1999 to 2002, some of the demographic characteristics were related to the responses. These analyses are shown in Appendix C.1.

Attitudes and Behaviors Associated with DTC Promotion of Prescription Drugs relative, or neighbor was also a frequently mentioned source of information. These percentages did not differ between 1999 and 2002. The most dramatic increase was in use of the Internet. Thirty-eight percent (38%) of respondents in 2002 reported using the Internet to look for more information, compared to 18 percent in 1999 (χ2 [1 df] = 24.5, p < .001). This jump is consistent with reports citing large numbers of people going online to search for health information (Diaz, Griffith, Ng, Reinert, Friedmann, & Moulton, 2002; Fox & Fallow, 2003). Table 7: Sources of Information Used After Seeing DTC Ad Survey Year Did you look for more information: (multiple responses permitted)
1999 percent (n)
2002 percent (n)
In a reference book 39% (92) 40% (99) In a magazine 17% (37) 18% (44) In a newspaper 8% (19) 7% (17) On the Internet 18% (42) 38% (94) By asking a friend, relative or neighbor 31% (76) 38% (93) (follow up) does this person have any medical training [YES] 44% (41) By calling the 1-800 number in the ad 19% (47) 15% (36) By talking to a pharmacist 50% (123) 51% (126) By talking to your doctor 83% (200) 89% (220) By talking to a nurse 33% (81) 40% (98) By talking to a doctor other than your own doctor 24% (61) 25% (63) Physician’s Desk Reference 1% (2) Something else 3% (8) DK/REF 0 2% (4) Base N 236 248 Note: This question was asked of respondents who reported having seen a DTC ad on television and also in either a magazine or newspaper, and reported that an ad had caused them to look for more information about the drug or their health. Regression analyses were performed to assess whether the nature and extent of information search varied significantly by demographic and condition characteristics. We computed the number of personal and nonpersonal sources used. Personal sources consisted of healthcare professionals (pharmacist, "own" doctor, nurse, and “other” doctor); nonpersonal sources consisted of reference books, magazines, newspapers, Internet, and toll free (1-800) phone numbers. The response option of “friend, relative or neighbor” was excluded because only the 2002 survey provided the opportunity for the respondent to identify these individuals as healthcare professionals. The Physician’s Desk Reference (PDR) was also excluded because it as only given as an option in the 2002 survey. About two-thirds (66%) of respondents consulted two or more healthcare professionals, with one-third consulting three or more (see Figure 3). The number of professionals consulted appears to be related, although weakly, to several demographic and condition characteristics. Consultation with more
27

Attitudes and Behaviors Associated with DTC Promotion of Prescription Drugs personal sources is associated with higher levels of healthcare knowledge, current use of a prescription drug, younger age, and lower income. Figure 3a: Distribution of the Number of Healthcare Professionals Mentioned as Information Sources
7
28
33
23
10
0
5
10
15
20
25
30
35
0 1 2 3 4
Number of Healthcare Professionals
Perc
ent
Base n= 483 (1999 and 2002)
28

Attitudes and Behaviors Associated with DTC Promotion of Prescription Drugs Figure 3b: Demographic and Condition Predictors of the Number of Healthcare Professionals Consulted by Consumers in Response to a Prescription Drug Advertisement
Parameter B Std. Err Beta t prob. Intercept 3.23 0.38 8.45 0.00 Age -0.01 0.00 -.164 -3.27 0.00 Gender -0.14 0.11 -.058 -1.20 0.23 Education -0.11 0.07 -.086 -1.67 0.10 Income -0.10 0.04 -.143 -2.44 0.01 Ethnicity 0.13 0.12 .049 1.04 0.30 Marital Status 0.21 0.12 .096 1.78 0.08 Health Status 0.02 0.05 .015 0.30 0.77 Prescription Use 0.34 0.15 .116 2.31 0.02 Health Knowledge -0.22 0.08 -.138 -2.87 0.00 Effects based on Type III SSQS. R2 = .085 (Adjusted R2 = .065)
About two-ththe Internet oabout 30 pershealth knowlmore nonpers
KEY: Dependent variable: number of healthcare professionals mentioned as information sources (0-4). Predictor variables: age (years), gender (dummy variable, 1 = male), education (3 level index (1= high school or less, 2 = some college or post high school, 3 = college), income (6 level index), ethnicity (dummy, 1 = white), marital status (dummy, 1 = married), health status (5 level index (1 = excellent, 5 = poor), current prescription drug use (dummy, 1 = yes), health knowledge (4 level index (1 = extremely knowledgeable, 4 = not at all).
irds (62%) of respondents used one or more nonpersonal sources of information, such as r a publication (see Figure 4). About a third (37%) used one nonpersonal source and onal used two or more. The number of sources consulted appears to be related to only edge. Respondents with greater health knowledge were more likely to consult one or onal information sources than those with less health knowledge.
29

Attitudes and Behaviors Associated with DTC Promotion of Prescription Drugs Figure 4a: Distribution of the Number of Nonpersonal Information Sources Mentioned
3337
19
8
1 105
10152025303540
0 1 2 3 4 5
Number of Non Personal Sources
Perc
ent
Base n = 483 (1999 and 2002) Figure 4b: Demographic and Condition Predictors of the Number of Non-Personal Sources Consulted by Consumers In Response to A Prescription Drug Advertisement
B Std. Error
Beta t prob.
Intercept 1.35 0.38 3.58 0.00 Age 0.00 0.00 .022 0.43 0.67 Gender 0.05 0.11 .020 0.40 0.69 Education 0.12 0.07 .099 1.86 0.06 Income 0.00 0.04 .002 0.04 0.97 Ethnicity -0.11 0.12 -.046 -0.94 0.35 Marital Status -0.12 0.12 -.056 -1.02 0.31 Health Status 0.05 0.05 .054 1.02 0.31 Prescription Use -0.07 0.14 -.024 -0.47 0.64 Health Knowledge -0.21 0.08 -.137 -2.79 0.01 Effects based on Type III SSQS. R2 = .040 (Adjusted R2 = .020)
KEY: Dependent variable: number of nonpersonal information sources mentioned (0-5). Predictor variables: age (years), gender (dummy variable, 1 = male), education (3 level index (1= high school or less, 2 = some college or post high school, 3 = college), income (6 level index), ethnicity (dummy, 1 = white), marital status (dummy, 1 = married), health status (5 level index (1 = excellent, 5 = poor), current prescription drug use (dummy, 1 = yes), health knowledge (4 level index (1 = extremely knowledgeable, 4 = not at all).
30

Attitudes and Behaviors Associated with DTC Promotion of Prescription Drugs
Type of Information Sought In 2002, we asked an open-ended follow-up question about the type of information sought. As Table 8 shows, respondents who indicated a DTC ad had caused them to look for more information were primarily searching for information about side effects, drug interactions, and other risks. Table 8: Types of Information Sought as a Result of a DTC Advertisement Survey Year What information did you look for? (multiple responses permitted)
2002 percent (n)
Side effects 61% (152) Interactions with other drugs/medicines 17% (42) Dangers of the drug 13% (32) Work for me/help me 11% (27) Effectiveness 10% (25) Appropriate for me 10% (25) Benefits 10% (25) Indications/uses 10% (24) Dosing/dosage/treatment 9% (22) Cost of the drug 4% (11) Information (unspecified) 3% (7) Research/studies 2% (5) Recommendations 1% (3) Alternatives 1% (3) Something else 6% (16) DK/REF 4% (9) Base N 248 Note: This question was asked of respondents who reported having seen a DTC ad on television and also in either a magazine or newspaper and reported that an ad had caused them to look for more information about the drug or their health.
Consulting the Doctor about a New Medical Condition As noted in the introduction, a potential benefit of DTC advertising is the extent to which such advertising prompts individuals to seek out medical treatment for previously undiagnosed or untreated conditions. Hence, we asked whether a DTC ad had caused the respondents to talk to their doctor about a medical condition or illness they had not previously discussed. Significantly fewer respondents in 2002 than 1999 indicated that a DTC advertisement caused them to discuss a new condition (18% versus 27%; χ2 [1 df] = 18.45, p < .001). In 2002, of those respondents who said a DTC ad had caused them to talk to a doctor about a new medical condition, we asked an open-ended follow-up question: “What was it about the advertisement that caused you to ask a doctor about a medical condition or illness?” About 32 percent of respondents thought they "might have the condition/illness described in the advertisement," 22 percent wanted to "ask about side effects," 20 percent wanted to "ask if the drug would help them," 19 percent wanted "more information about the drug," and 12 percent wanted to "know how the drug might affect their illness/condition." 31

Attitudes and Behaviors Associated with DTC Promotion of Prescription Drugs
Interaction with the Doctor
Quick Look • The most common reasons for visiting a doctor were health-related. In 2002, 63 percent of
respondents said that they visited their healthcare professional because they had a previous condition; 59 percent said it was time for a checkup. Only 4 percent said the visit was because they wanted a prescription for a drug they saw advertised.
• However, advertising had an influence in generating questions at the visit. In 2002, 33 percent of respondents said that a television or radio ad they had seen was the source of their question(s). Thirty-six percent (36%) said that something said by a friend, relative, or neighbor prompted question(s).
• In 2002, of those who went to their doctor expecting to get a prescription, 63 percent said they expected a refill for a current medication. Only 6 percent said their expectation for a prescription was because of an ad on television or radio and only 5 percent said it was because of a magazine ad.
• The rate of asking about prescription treatment in general has remained constant across the three years at about 32 percent. Of this 32 percent, approximately 29 percent asked about a specific brand.
• Of the patients who asked about the existence of a prescription drug for their problem, 49 percent were prescribed that drug. Forty-one percent (41%) received recommendations to change their behavior or lifestyle.
• Ninety-three percent (93%) said the doctor welcomed their question when they asked about prescription treatment.
• The majority of respondents were happy with their doctor’s decision to prescribe or not prescribe (76%). However, about 1 in 10 respondents thought about switching doctors or had doubts about their doctor’s judgment.
In this part of the survey, we asked respondents to recall their most recent visit with their physician.
Reasons for Visiting Doctor
Respondents gave similar reasons in 1999 and 2002 for their doctor visits. Table 9 shows that having a previous condition (in 2002) and it being time for a checkup were the most frequently mentioned reasons, followed by having a sudden symptom or illness, needing a prescription refill, suggestion of friend or family, and present medication not working. Very few people visited the doctor because they had seen a prescription drug ad (about 5% in 2002).
32
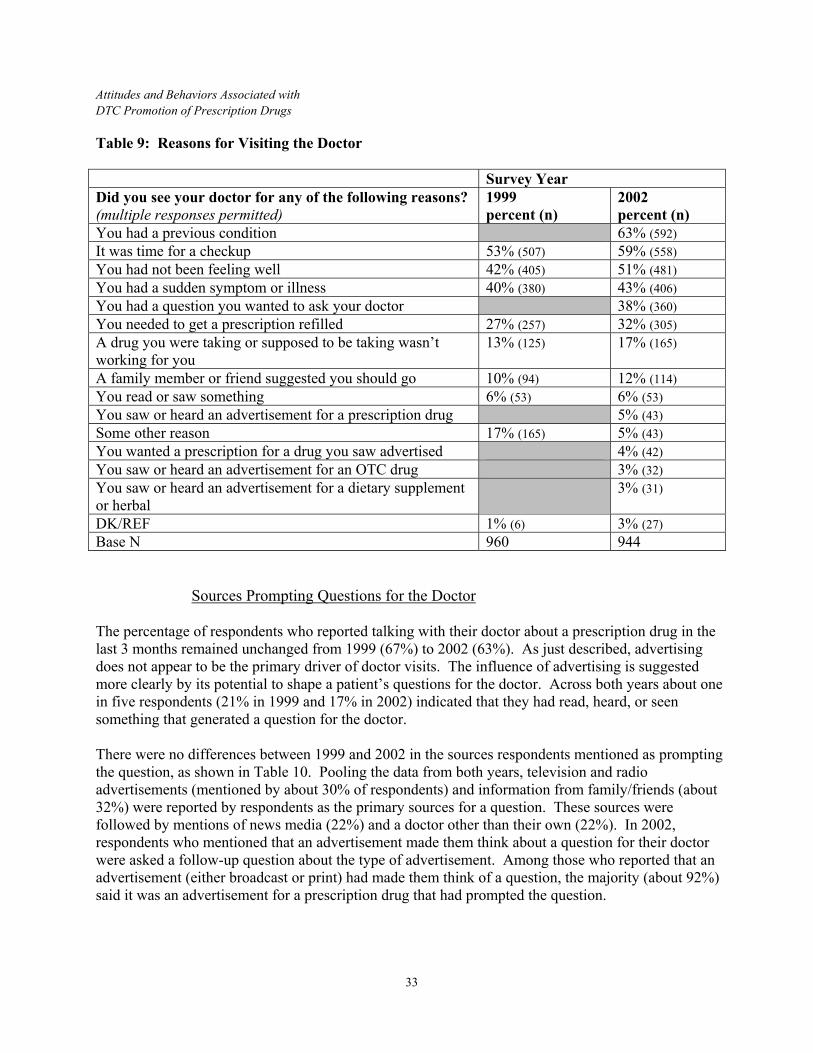
Attitudes and Behaviors Associated with DTC Promotion of Prescription Drugs Table 9: Reasons for Visiting the Doctor Survey Year Did you see your doctor for any of the following reasons? (multiple responses permitted)
1999 percent (n)
2002 percent (n)
You had a previous condition 63% (592) It was time for a checkup 53% (507) 59% (558) You had not been feeling well 42% (405) 51% (481) You had a sudden symptom or illness 40% (380) 43% (406) You had a question you wanted to ask your doctor 38% (360) You needed to get a prescription refilled 27% (257) 32% (305) A drug you were taking or supposed to be taking wasn’t working for you
13% (125) 17% (165)
A family member or friend suggested you should go 10% (94) 12% (114) You read or saw something 6% (53) 6% (53) You saw or heard an advertisement for a prescription drug 5% (43) Some other reason 17% (165) 5% (43) You wanted a prescription for a drug you saw advertised 4% (42) You saw or heard an advertisement for an OTC drug 3% (32) You saw or heard an advertisement for a dietary supplement or herbal
3% (31)
DK/REF 1% (6) 3% (27) Base N 960 944
Sources Prompting Questions for the Doctor The percentage of respondents who reported talking with their doctor about a prescription drug in the last 3 months remained unchanged from 1999 (67%) to 2002 (63%). As just described, advertising does not appear to be the primary driver of doctor visits. The influence of advertising is suggested more clearly by its potential to shape a patient’s questions for the doctor. Across both years about one in five respondents (21% in 1999 and 17% in 2002) indicated that they had read, heard, or seen something that generated a question for the doctor. There were no differences between 1999 and 2002 in the sources respondents mentioned as prompting the question, as shown in Table 10. Pooling the data from both years, television and radio advertisements (mentioned by about 30% of respondents) and information from family/friends (about 32%) were reported by respondents as the primary sources for a question. These sources were followed by mentions of news media (22%) and a doctor other than their own (22%). In 2002, respondents who mentioned that an advertisement made them think about a question for their doctor were asked a follow-up question about the type of advertisement. Among those who reported that an advertisement (either broadcast or print) had made them think of a question, the majority (about 92%) said it was an advertisement for a prescription drug that had prompted the question.
33

Attitudes and Behaviors Associated with DTC Promotion of Prescription Drugs Table 10: Sources Mentioned by Respondents Who Had a Question for Doctor Survey Year What did you read, hear or see that made you think about that question? (multiple responses permitted)
1999 percent (n)
2002 percent (n)
Something in a reference book 18% (29) An advertisement on TV or radio 28% (57) 33% (53) (follow up) Was this an ad for: A food 2% (1) An OTC drug 13% (7) An herbal or dietary supplement 11% (6) A prescription drug 92% (49) An advertisement in a magazine 26% (52) 19% (30) (follow up) Was this an ad for: A food 3% (1) An OTC drug 20% (6) An herbal or dietary supplement 10% (3) A prescription drug 93% (28) A news or educational program on TV or radio, or a mention in a talk show
23% (47) 22% (35)
Something you received in the mail 10% (20) 8% (12) Something a friend, relative or neighbor said 28% (57) 36% (57) (follow up) Does this person have medical training? [Yes] 28% (16) A talk you had with a doctor other than your own doctor 23% (46) 21% (33) Something you read on the Internet 10% (20) 14% (22) Side effects/safety 16% (9) Article in a magazine/newspaper 32% (65)
14% (8)
Medical condition/problem 11% (6) Have symptoms described 7% (4) Personal experience 5% (3) Family history 4%(2) Something else 21% (43) 12% (19) DK/REF 4% (7) 1% (2) Base N 202 159 Note: This question was asked of respondents who reported they read, heard, or saw something that made them think about a question to ask their doctor.
Patient Expectations about Receiving a Prescription In 2002, several questions addressed patient expectations about getting a prescription at their recent visit. About 42 percent of the respondents (398/944) went to this visit expecting their doctor to prescribe a drug for them. About half (53%; 211/409) expected to have an existing prescription filled whereas 38 percent (153/409) expected a prescription for a new condition (see Table 11).
34

Attitudes and Behaviors Associated with DTC Promotion of Prescription Drugs Table 11: Patient Expectations about Doctor Behavior Survey Year Did you expect your doctor to do any of the following things? (multiple responses permitted)
2002 percent (n)
Add a new drug to your current treatment 34% (141) (follow up) did you get a prescription for a new drug at this visit? [Yes] 86% (120) Switch you from a drug you were taking to a different drug 25% (104) (follow up) Were you switched to a different drug at this visit? [Yes] 75% (77) Prescribe a new drug for a new condition 38% (153) (follow up) Did you get a prescription for a new drug at this visit? [Yes] 88% (134) Prescribe a refill for a drug you were already taking 53% (211) (follow up) Did you get a prescription for a refill at this visit? [Yes] 92% (194) Prescribe a different form of a drug you were already taking 22% (90) (follow up) Did you get a prescription for a different form of drug at this visit? [Yes]
71% (64)
Keep you on your current drug 0 DK/REF 2% (9) Base N 409 Patient expectations do not appear to be shaped by advertisements, rather by having received a previous prescription for the same condition. Expectations were secondarily shaped by family, friends, and other doctors (see Table 12). Table 12: Reasons for Expecting a Prescription Survey Year What was it that made you expect your doctor to prescribe a drug? (multiple responses permitted)
2002 percent (n)
Something in a reference book 4% (14) An advertisement on TV or radio 6% (24) An advertisement in a magazine 4% (15) A news or educational program on TV or radio, or mention in a talk show 4% (16) A previous prescription for the same condition 63% (239) An article in a magazine or newspaper 4% (16) Something you received in the mail 2% (6) Something a friend, relative or neighbor said 10% (40) A talk you had with a doctor other than your own doctor 11% (43) Something you read on the Internet 2% (7) Sick/had condition 17% (66) Previous drug not working 3% (13) Some other reason 7% (25) DK/REF 1% (5) Base N 282
35

Attitudes and Behaviors Associated with DTC Promotion of Prescription Drugs Note: This question was asked of respondents who indicated they expected their doctor to give them a prescription at this visit.
Asking about Prescription Treatment and about Specific Brands
We next asked about patient-initiated inquiries regarding prescription drugs. Direct comparison of the 1999 and 2002 responses is not appropriate because the questionnaire skip pattern sequence for the two years is different.17 To provide meaningful comparisons between 1999 and 2002, four similar subgroups were identified based on question sequences common to both years. Technical descriptions of the subgroups and the percentages asking whether there was a prescription treatment for them in each group are provided below.18 The reader may skip to the next paragraph to find the outcome of these comparisons. (1) Those not currently taking a prescription and who did not expect the doctor to put them on a new
prescription. In 1999, 15 percent (37/248) of this group asked about a treatment versus 13 percent (20/152) in 2002.
(2) Those not currently taking a drug and who expected the doctor might put them on a new prescription drug. In 1999, 42 percent (24/57) of this group asked about a treatment versus 33 percent (23/70) in 2002.
(3) Those currently taking a prescription drug and who expected to get a new drug for a new condition. In 1999, 49% (48/98) of this group asked about a treatment versus 39% (34/88) in 2002.
(4) Those currently taking a prescription drug and who expected to be switched from their current drug to a new drug. In 1999, 53 percent (66/124) of this group asked about a treatment versus 53 percent (51/97) in 2002.
Across these four subgroups, 33 percent (175/527) asked whether there might be a prescription treatment in 1999. This is virtually identical to the 2002 rate of 31 percent (128/407; χ2 [1 df] < 1, ns). Thus, the total over both years across these four matched groups indicates that about 32 percent (303/934) of respondents asked their doctor whether there might be a prescription treatment for them.
Approximately 13 percent of respondents in 1999 and 29 percent of respondents in 2002 who reported asking their doctor about prescription treatment also reported asking their doctor about a specific brand of drug. Again, because of changes in the question sequence preceding this question in the 2002 interview, a direct comparison of 1999 and 2002 responses is not appropriate.19 To provide a partial comparison, the same four subgroups were created. However, they were based on only those
17 In 1999, patients who thought their doctor would keep them on their current drug and who did not expect a switch from current drug and did not expect a new drug for a different condition were not asked this question (960-328 = 632). In 1999, 32 percent (202/632) said “yes” to the question, “Did you ask whether there might be a prescription drug to treat you?”; in 2002, 23 percent (219/944) said “yes.” 18 Questions #20, #21 and #22 of the 1999 questionnaire and questions #57, #25 and #26 of the 2002 questionnaire were used to create the matching groups. 19 The 1999 data do not include patients who thought their doctor would keep them on their current drug (960 - 328 = 632) and who did not expect a switch from current drug and did not expect a new drug for a different condition.
36

Attitudes and Behaviors Associated with DTC Promotion of Prescription Drugs respondents who said they had asked their healthcare provider whether there might be a prescription drug to treat them. Therefore, the bases for the analyses were much smaller. Technical descriptions of the subgroups and the percentages of asking about a specific brand in each group follow.20 The reader may skip to the next paragraph to find the outcome of these comparisons. (1) Those not currently taking a prescription and who did not expect the doctor to put them on a new
prescription. In 1999, 19 percent (7/37) of this group asked about a specific brand of prescription drug versus 25 percent (5/20) in 2002.
(2) Those not currently taking a drug and who expected the doctor might put them on a new prescription drug. In 1999, 17 percent (4/24) of this group asked about a specific brand of prescription drug versus 22 percent (5/23) in 2002.
(3) Those currently taking a prescription drug and who expected to get a new drug for a new condition. In 1999, 27 percent (13/48) of this group asked about a specific brand of prescription drug versus 32 percent (11/34) in 2002.
(4) Those currently taking a prescription drug and who expected to be switched from their current drug to a new drug. In 1999, 35 percent (23/66) of this group asked about a specific brand of prescription drug versus 35 percent (18/51) in 2002.
Across these four subgroups, 27 percent (47/175) asked about a specific brand in 1999. This compares with the 2002 rate of 33 percent (39/128; χ2 [1 df] < 1, ns). Thus, aggregating over both years indicates that about 29 percent (86/303) of those who asked whether there might be a prescription treatment for their condition also asked about a specific brand.
Doctor Reaction to Questions
Respondents in 2002 reported that their doctor did not react negatively to their questions about advertised drugs.21 Most respondents said their doctor welcomed their question (93%), discussed the drug with them (86%), and reacted to the question like it was “an ordinary part of the visit” (83%). Only 3 percent of respondents reported that their doctor seemed angry or upset. When respondents asked about a drug, nearly half (49%) said that their doctor prescribed that drug. About 41 percent of patients reported that their doctor suggested behavioral and lifestyle changes, and 34 percent reported they received a recommendation for a different prescription drug. To further examine the influence of patient requests, respondents who had asked about a specific brand of prescription drug were compared with respondents who had simply asked if there might be a prescription treatment available. Respondents who asked about a specific brand of drug were more likely to get the drug they asked about and less likely to get no drug (see Table 13). All respondents were equally likely to receive a recommendation to change their behavior or lifestyle. Doctors also
20 Questions #20, #21 and #22 of the 1999 questionnaire and questions #57, #25 and #26 of the 2002 questionnaire were used to create the matching groups.
37
21 Comparisons were conducted between 1999 and 2002 with a set of respondents who matched exactly on selection variables (see previous section Asking about Prescription Treatment and about Specific Brands). Because analyses indicated no differences between 1999 and 2002 on this question, the results from 2002 will be discussed.
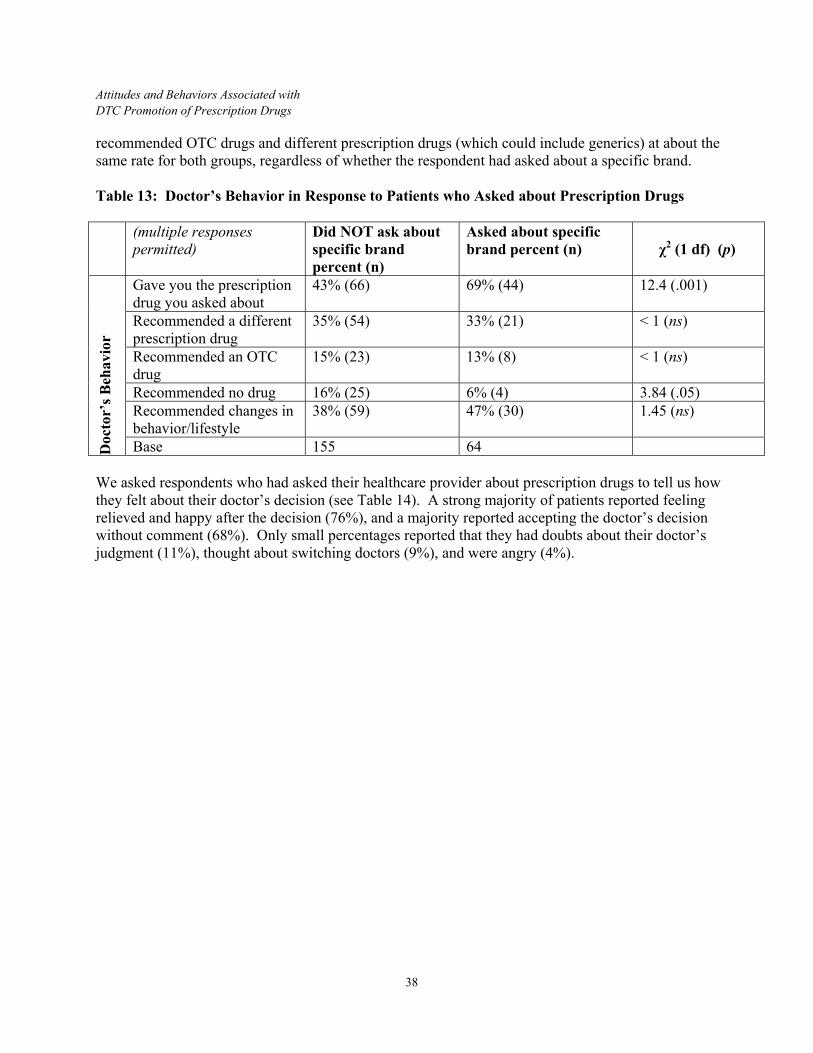
Attitudes and Behaviors Associated with DTC Promotion of Prescription Drugs recommended OTC drugs and different prescription drugs (which could include generics) at about the same rate for both groups, regardless of whether the respondent had asked about a specific brand. Table 13: Doctor’s Behavior in Response to Patients who Asked about Prescription Drugs (multiple responses
permitted) Did NOT ask about specific brand percent (n)
Asked about specific brand percent (n)
χ2 (1 df) (p)
Gave you the prescription drug you asked about
43% (66) 69% (44) 12.4 (.001)
Recommended a different prescription drug
35% (54) 33% (21) < 1 (ns)
Recommended an OTC drug
15% (23) 13% (8) < 1 (ns)
Recommended no drug 16% (25) 6% (4) 3.84 (.05) Recommended changes in behavior/lifestyle
38% (59) 47% (30) 1.45 (ns)
Doc
tor’
s Beh
avio
r
Base 155 64 We asked respondents who had asked their healthcare provider about prescription drugs to tell us how they felt about their doctor’s decision (see Table 14). A strong majority of patients reported feeling relieved and happy after the decision (76%), and a majority reported accepting the doctor’s decision without comment (68%). Only small percentages reported that they had doubts about their doctor’s judgment (11%), thought about switching doctors (9%), and were angry (4%).
38

Attitudes and Behaviors Associated with DTC Promotion of Prescription Drugs Table 14: Patient Reactions to Doctor’s Prescribing Decision (multiple responses permitted) Survey Year 2002 I was angry and upset 4% (9) I was relieved and happy 76% (169) I accepted my doctor’s decision without comment 68% (151) I thought about switching doctors 9% (19) I had doubts about my doctor’s judgment 11% (25) I felt I was being mistreated 4% (8) I accepted the doctor’s decision after discussion 2% (4) I was disappointed 1% (3) Some other reaction 4% (9) DK/REF 0 Base N 223 We also asked some hypothetical questions of people who had not asked their doctor about a prescription treatment to assess their opinions. Of respondents who did not ask their doctor about a prescription treatment, most said they would be "somewhat" (41%) or "very likely" (32%) to talk to their doctor about a drug if they saw an ad for one that treats a bothersome condition (see Table 15). Seventeen percent (17%) of these respondents said they would be "somewhat" or "very likely" to look for a different doctor if their doctor refused to prescribe a brand name drug they requested (see Table 16). Table 15: Hypothetical Discussion with Doctor about Treatment Survey Year If you saw an advertisement for a drug that treats a condition that was bothering you, how likely would you be to talk to your doctor about the drug?
1999 percent (n)
2002 percent (n)
Very likely 54% (327) 41% (297) Somewhat likely 26% (160) 32% (229) Neither likely nor unlikely 2% (14) 2% (12) Somewhat unlikely 5% (29) 8% (61) Very unlikely 11% (69) 16% (119) DK/REF 1% (8) 1% (7) Base N 607 725
39

Attitudes and Behaviors Associated with DTC Promotion of Prescription Drugs Table 16: Likelihood of Switching Doctors If Requested Brand is not Prescribed Survey Year If a doctor refused to prescribe a brand name drug you asked for, how likely would you be to look for a different doctor?
2002 percent (n)
Very likely 6% (52) Somewhat likely 11% (101) Neither likely nor unlikely 8% (72) Somewhat unlikely 18% (170) Very unlikely 57% (536) DK/REF 1% (13) Base N 944
40

Attitudes and Behaviors Associated with DTC Promotion of Prescription Drugs
Cost-of-Treatment Discussions between Patients and Doctors Quick Look • Sixty-three percent (63%) of respondents reported they rarely or never talk with their doctor
about the cost of prescription drugs or other treatments.
• More frequent conversations about the cost of treatment with their healthcare providers were reported by females, those in poorer health, those currently taking one or more prescription drugs, and those whose health insurance did not cover the cost of prescription drugs.
In 2002, respondents were asked how frequently they discussed the cost of prescription drugs or other treatments with their doctor. About 16 percent indicated they had frequent discussions (8% "always" and 8% "almost always") while 21 percent indicated they "sometimes" discussed it, and about 63 percent indicated they talked about cost either "rarely" (23%) or "never" (40%). We examined how these responses varied among different subgroups. The likelihood of a discussion about cost of treatment was not associated with age, income, education, ethnicity, or marital status. Gender and several health characteristics, however, were related.
• Gender Females were slightly more likely to discuss cost issues (χ2 [4 df] =12.1, p < .05). About 17 percent of female respondents talked frequently with their doctor about cost (9% "always" and 8% "almost always"), whereas 59 percent did not talk much about this issue (22% "rarely" and 37% "never"). In contrast, about 13 percent of male respondents talked frequently with their doctor about cost (6% "always" and 7% "almost always") whereas 70 percent did not talk much about this issue (25% "rarely" and 45% "never").
• Health Status Cost discussions with a doctor were more likely for those in poorer health (χ2 [12 df] = 48.2, p < .001; see Table 17). For example, 13 percent of those describing their health as "excellent" talked frequently with their doctor about cost (5% "always" and 8% "almost always"), whereas 72 percent did not talk much about cost (17% "rarely" and 55% "never"). In contrast, about 24 percent of those describing their health as "poor" or "fair" talked frequently about cost (14% "always" and 10% "almost always") whereas 50 percent did not speak much about the cost issue (17% "rarely" and 33% "never").
41

Attitudes and Behaviors Associated with DTC Promotion of Prescription Drugs Table 17: Frequency of Cost Discussion with Doctor by Health Status Overall, would you say your health is:
percent (n) Discuss Cost Excellent Very Good Good Fair +
Poor Total
Always 5% (9) 6% (17) 9% (25) 14% (26) 8% (77) Almost always
8% (14) 8% (25) 5% (14) 10% (19) 8% (72)
Sometimes 15% (25) 19% (58) 24% (66) 26% (49) 21% (198) Rarely 17% (28) 28% (86) 26% (72) 17% (31) 23% (217) Never 55% (94) 40% (124) 35% (97) 33% (62) 40% (377)
How
oft
en d
o yo
u di
scus
s co
st w
ith
doct
or
DK/REF < 1% (1) < 1% (1) < 1% (1) < 1% (3)
Base 170 312 276 188 944 Note: Fair (n=141) and poor (n=47) health status groups were combined to achieve expected cell sizes of greater than 5.
• Current Prescription Use Respondents currently taking a prescription drug were slightly more likely than respondents who were not currently taking prescriptions to discuss cost with their doctor (χ2 [4 df] = 23.1, p < .001; see Table 18). Specifically, 17 percent of those taking a medication talked frequently about cost (9% "always" and 8% "almost always"), whereas 59 percent did not talk much about cost (22% "rarely" and 37% "never"). In contrast, 12 percent of those not currently taking a medication talked frequently about cost of treatment (6% "always" and 6% "almost always"), whereas 76 percent did not talk much about cost issues (26% "rarely" and 50% "never"). Table 18: Frequency of Cost Discussion with Doctor by Current Prescription Drug Use (Y/N) Are you currently taking one or more prescription
drugs? percent (n)
Discuss Cost Yes No Total Always 9% (63) 6% (14) 8% (77) Almost always 8% (59) 6% (13) 8% (72) Sometimes 24% (172) 12% (26) 21% (198) Rarely 22% (158) 26% (59) 23% (217) Never 37% (266) 50% (111) 40% (377) DK/REF < 1% (2) < 1% (1) < 1% (3)
How
oft
en d
o yo
u di
scus
s cos
t with
do
ctor
Base 720 224 944
• Number of prescription drugs used in the last six months
42

Attitudes and Behaviors Associated with DTC Promotion of Prescription Drugs Patients who use more prescription drugs are somewhat more likely to discuss the cost of drugs with their doctors (see Table 19). The correlation coefficient of 0.185 (p < .001 [n =941]), however, indicates that the relationship is only modest. Table 19: Frequency of Cost Discussion with Doctor by Number of Prescription Drugs Used in Last 6 Months
How many prescription drugs have you used in the last six months? percent (n)
Discuss Cost
0 1 2 3 4 5 or more
Total
Always 4% (4) 9% (15) 6% (10) 7% (9) 10% (13) 12% (26) 8% (77) Almost always
1% (1) 5% (9) 9% (16) 12% (16) 9% (11) 8% (18) 16% (148)
Sometimes 9% (8) 15% (26) 23% (41) 22% (22) 27% (35) 26% (58) 21% (197) Rarely 23% (21) 28% (49) 22% (39) 17% (23) 25% (32) 23% (52) 23% (216) Never 63% (57) 44% (78) 41% (75) 42% (55) 30% (39) 32% (71) 40% (375)
How
oft
en d
o yo
u di
scus
s cos
t w
ith
doct
or
Base 91 177 181 132 130 225 936
• Type of Doctor Practice Respondents characterized their doctor’s type of practice (solo practice, small group or partnership, multispecialty group, health maintenance organization (HMO), and preferred provider list/network of physicians). The likelihood of cost discussions varied for respondents whose doctors were part of a multispecialty group (χ2 [4 df] = 14.2, p < .01; see Table 20). No other comparisons were significant. Table 20: Frequency of Cost Discussion with Doctor by Type of Doctor Practice Is your doctor part of a multi-specialty group practice?
percent (n) Discuss Cost Yes No Total
Always 11% (40) 7% (37) 8% (77) Almost always 10% (38) 6% (34) 8% (72) Sometimes 21% (77) 21% (121) 21% (198) Rarely 19% (72) 25% (145) 23% (217) Never 39% (144) 41% (233) 40% (377)
How
oft
en d
o yo
u di
scus
s cos
t w
ith d
octo
r
Base 371 570 941 Note: Respondents were permitted to use more than one descriptor.
• Insurance Plan and Prescription Drug Coverage The frequency of cost discussions was not related to coverage by an insurance or health plan (χ2 [4 df] = 2.5, ns). However, for those with insurance coverage, cost discussion was related to whether the plan covered prescription drugs (χ2 [4 df] = 10.8, p < .05; see Table 21). Twenty-six percent (26%) without prescription drug coverage reported either "always" (16%) or "almost always" 43

Attitudes and Behaviors Associated with DTC Promotion of Prescription Drugs (10%) discussing the cost of treatment with their doctor, compared with 14 percent of those with prescription drug coverage (7% "always" and 7% "almost always"). Table 21: Frequency of Cost Discussion with Doctor by Prescription Drug Coverage Does your current insurance plan help pay for
prescription drugs, or not? percent (n)
Discuss Cost Yes No DK/REF Total Always 7% (54) 16% (16) 8% (70) Almost always 7% (57) 10% (10) 8% (67) Sometimes 20% (155) 28% (28) 21% (183) Rarely 24% (186) 18% (18) < 1% (3) 23% (207) Never 41% (317) 29% (30) < 1% (7) 40% (354) DK/REF < 1% (2) < 1% (2)
How
oft
en d
o yo
u di
scus
s cos
t with
do
ctor
Base 771 102 10 883
• Income The data suggest a tendency for more discussion among lower income consumers, although the difference was not significant (χ [4 df] = 9.32, p < .1). For example about 19 percent of respondents with a household income less than $50,000 talked frequently with their doctor about cost (10% "always" and 9% "almost always"), whereas 60 percent did not talk much with their doctor about cost (23% "rarely" and 37% "never"). In contrast, about 12 percent of respondents with a household income equal to or greater than $50,000 talked frequently with their doctor about cost (6% "always" and 6% "almost always"), whereas 69 percent did not talk often with their doctors about cost (25% "rarely" and 44% "never").
2
The likelihood of a discussion about cost of treatment was not associated with age, education, ethnicity, or marital status.
44

Attitudes and Behaviors Associated with DTC Promotion of Prescription Drugs
Patient Opinions of DTC Advertising Quick Look • Overall, opinions about DTC advertising became less positive between 1999 and 2002. The
percentage of respondents reporting they “like seeing advertisements for prescription drugs” dropped from 52 percent in 1999 to 32 percent in 2002.
• There was a significant decline in the percentage of respondents who agreed that DTC ads for prescription drugs:
o help make them aware of new drugs (86% vs. 77%) o provide enough information to decide whether to visit a physician (70% vs. 58%) o help them have better discussions with their doctors (62% vs. 43%) o help them make better decisions about their health (47% vs. 32%).
• A number of demographic variables were related to patient opinions toward DTC advertising, but none account for the shift in opinions from 1999 to 2002.
• There was no change in respondents’ agreement that DTC ads:
o provide enough information about benefits (50% vs. 44%) o provide enough information about risks (61% vs. 60%) o make the product seem better than it is (59% vs. 58%) o make it seem as though a doctor is not needed to make decisions about prescription drugs
(25% vs. 23%).
Respondents who saw or heard a prescription drug advertisement in the previous 3-month period were asked their level of agreement or disagreement with a series of opinion statements about DTC advertising. These eleven items appeared in both the 1999 and 2002 surveys and provide the basis for examining patient opinions of DTC advertising over time.22 Compared with 1999, respondents’ opinions about DTC advertising in 2002 were generally less positive. The percentage of individuals agreeing with a statement that they liked seeing these ads declined from 52 percent (21% "agree strongly" and 31% "agree somewhat") to 32 percent (13% "agree strongly" and 19% "agree somewhat") in 2002 (χ2
[4 df] = 62.1, p < .001; see Figure 5a).23 The other two-thirds of respondents in 2002 were either indifferent (25%) or disagreed that they liked seeing the ads (43%; 17% "disagree strongly" and 26% "disagree somewhat"). There was a similar negative shift for several other items that addressed more specific aspects of DTC advertising. For example, 77 percent of respondents in 2002 agreed (35% "strongly" and 42%
22 Four additional opinion items were included in the 2002 patient survey. The results of these questions can be found in the following section.
4523 For responses by demographic groups, please see Appendix C.
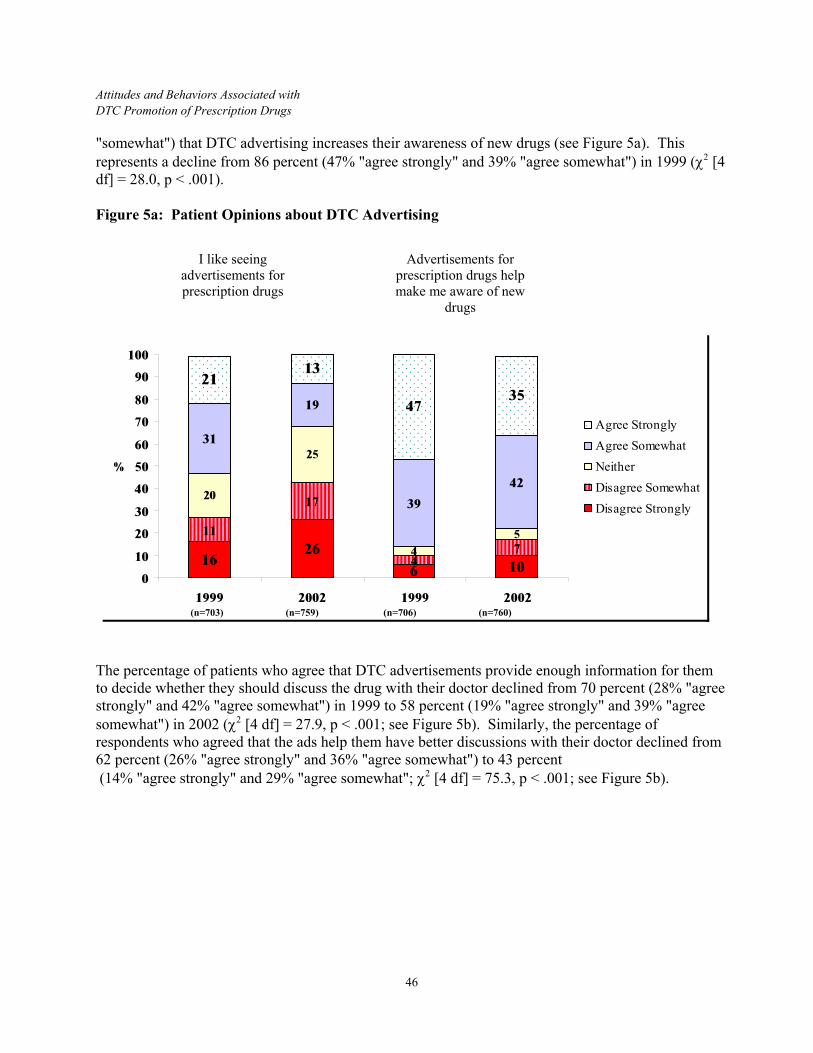
Attitudes and Behaviors Associated with DTC Promotion of Prescription Drugs "somewhat") that DTC advertising increases their awareness of new drugs (see Figure 5a). This represents a decline from 86 percent (47% "agree strongly" and 39% "agree somewhat") in 1999 (χ2 [4 df] = 28.0, p < .001). Figure 5a: Patient Opinions about DTC Advertising I like seeing
advertisements for prescription drugs
Advertisements for prescription drugs help make me aware of new
drugs
1626
6 10
11
47
20
25
45
31
19
39
42
2113
4735
17
0
10
20
30
40
50
60
70
80
90
100
1999 2002 1999 2002
%
Agree StronglyAgree SomewhatNeitherDisagree SomewhatDisagree Strongly
(n=703) (n=759) (n=706) (n=760)
The percentage of patients who agree that DTC advertisements provide enough information for them to decide whether they should discuss the drug with their doctor declined from 70 percent (28% "agree strongly" and 42% "agree somewhat") in 1999 to 58 percent (19% "agree strongly" and 39% "agree somewhat") in 2002 (χ2 [4 df] = 27.9, p < .001; see Figure 5b). Similarly, the percentage of respondents who agreed that the ads help them have better discussions with their doctor declined from 62 percent (26% "agree strongly" and 36% "agree somewhat") to 43 percent (14% "agree strongly" and 29% "agree somewhat"; χ2 [4 df] = 75.3, p < .001; see Figure 5b).
46

Attitudes and Behaviors Associated with DTC Promotion of Prescription Drugs Figure 5b: Patient Opinions about DTC Advertising
Advertisements for prescription drugs give
enough information for me to decide whether I should discuss the drug with my
doctor
Advertisements for prescription drugs help me
have better discussions with my doctor
11 14 1023
13 13
166
1015
1742
3936
29
28 19 2614
17
0
10
20
30
40
50
60
70
80
90
100
1999 2002 1999 2002
%
Agree StronglyAgree SomewhatNeitherDisagree SomewhatDisagree Strongly
(n=706) (n=759) (n=704) (n=761)
The proportion of patients who agreed that DTC advertising helped them make better health decisions declined from 47 percent (18% "agree strongly" and 29% "agree somewhat") in 1999 to 32 percent (11% "agree strongly" and 21% "agree somewhat") in 2002 (χ2 [4 df] = 37.5, p < .001; see Figure 5c).
47

Attitudes and Behaviors Associated with DTC Promotion of Prescription Drugs Figure 5c: Patient Opinions about DTC Advertising Advertisements for
prescription drugs help me make better decisions about
my health
2129
15
16
21
29
21
1811
18
0
10
20
30
40
50
60
70
80
90
100
1999 2002
%
Agree StronglyAgree SomewhatNeitherDisagree SomewhatDisagree Strongly
(n=706) (n=760)
Other items showed either no change or a less dramatic change. The percentage of respondents agreeing that DTC advertisements do not provide enough information about possible risks remained stable (χ2 [4 df] = 1.1, ns) with about 61 percent agreement (32% "strongly" and 29% "somewhat") in both years; in each year, this level is about twice those who disagree (see Figure 5d). There was a slight shift in the percentage of patients agreeing that the ads did not provide enough benefit information. In 2002, 44 percent of respondents agreed (19% "strongly" and 25% "somewhat") that the ads did not have enough benefit information, down from 50% agreement (22% "strongly" and 28% "somewhat") in 1999. Although small, this difference was statistically significant (χ2 [4 df] = 10.7, p < .05).
48

Attitudes and Behaviors Associated with DTC Promotion of Prescription Drugs Figure 5d: Patient Opinions about DTC Advertising Advertisements for
prescription drugs do not give enough information
about the possible risks and negative effects of using the
drug
Advertisements for prescription drugs do not give enough information about the possible benefits and positive
effects of using the drug
10 11 16 14
2123 27
9 911
1529 28
2825
32 3222 19
21
0
10
20
30
40
50
60
70
80
90
100
1999 2002 1999 2002
%
Agree StronglyAgree SomewhatNeitherDisagree SomewhatDisagree Strongly
(n=700) (n=759) (n=697) (n=752)
Note: Emphasis added. In 2002, 58 percent of respondents agreed (28% "strongly" and 30% "somewhat") that DTC advertisements make the drug seem better than it really is (Figure 5e). These opinions did not differ from those in 1999 (χ2 [4 df] = 8.16, ns). Also, the same were beliefs that advertisements do not make it seem that a doctor is unnecessary to decide whether a drug is appropriate: 70 percent disagreed (49% "strongly" and 21% "somewhat") in 1999 and 73% disagreed (56% "strongly" and 17% "somewhat") in 2002 (χ2 [4 df] = 6.94, ns; see Figure 5e).
49
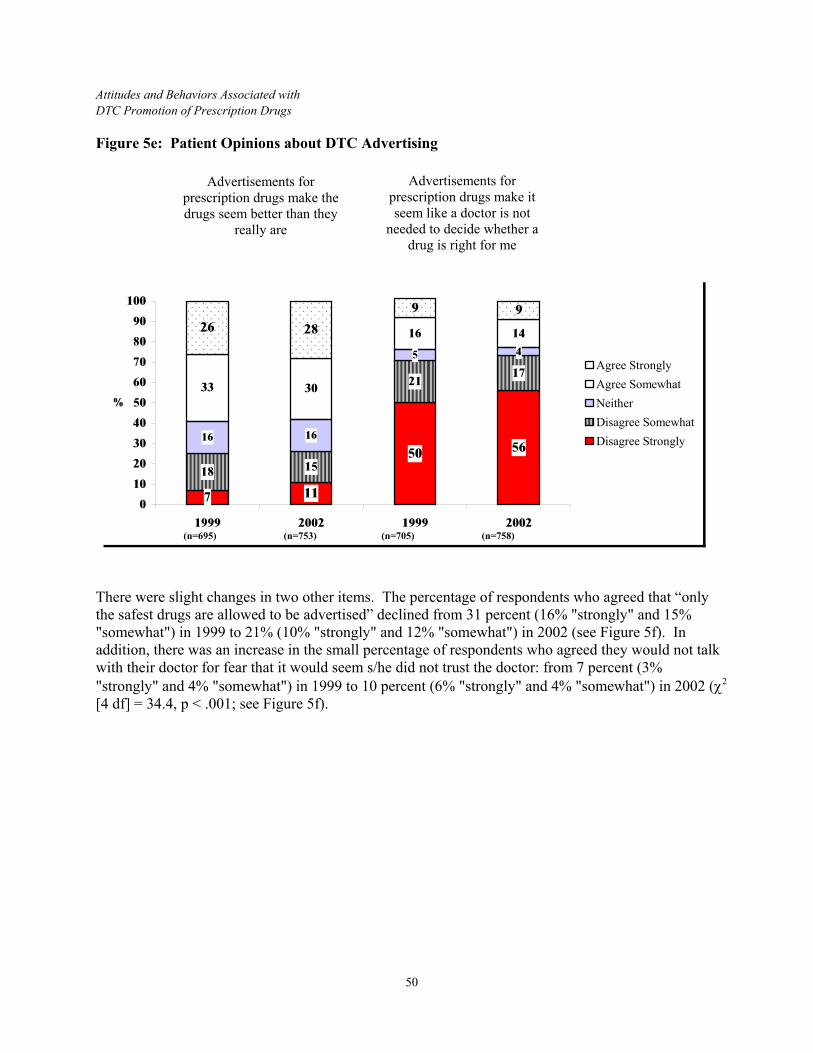
Attitudes and Behaviors Associated with DTC Promotion of Prescription Drugs Figure 5e: Patient Opinions about DTC Advertising Advertisements for
prescription drugs make it seem like a doctor is not
needed to decide whether a drug is right for me
Advertisements for prescription drugs make the drugs seem better than they
really are
7 11
50 56
18
2117
16 16
4
33 30
16 1426 28
9 9
15
5
0
10
20
30
40
50
60
70
80
90
100
1999 2002 1999 2002
%
Agree StronglyAgree SomewhatNeitherDisagree SomewhatDisagree Strongly
(n=695) (n=753) (n=705) (n=758)
There were slight changes in two other items. The percentage of respondents who agreed that “only the safest drugs are allowed to be advertised” declined from 31 percent (16% "strongly" and 15% "somewhat") in 1999 to 21% (10% "strongly" and 12% "somewhat") in 2002 (see Figure 5f). In addition, there was an increase in the small percentage of respondents who agreed they would not talk with their doctor for fear that it would seem s/he did not trust the doctor: from 7 percent (3% "strongly" and 4% "somewhat") in 1999 to 10 percent (6% "strongly" and 4% "somewhat") in 2002 (χ2 [4 df] = 34.4, p < .001; see Figure 5f).
50

Attitudes and Behaviors Associated with DTC Promotion of Prescription Drugs Figure 5f: Patient Opinions about DTC Advertising Only the safest prescription
drugs are allowed to be advertised to the public
I would not talk with my doctor about an advertisement for a prescription drug because it
would seem like I did not trust my doctor
3241
7360
22
15
2216
14
48
1512
4 416 10 3 6
24
0
10
20
30
40
50
60
70
80
90
100
1999 2002 1999 2002
%
Agree StronglyAgree SomewhatNeitherDisagree SomewhatDisagree Strongly
(n=682) (n=741) (n=702) (n=756)
Other Opinion Questions Asked in 2002
The 2002 survey added four new opinion questions. As shown in Table 22, respondents were fairly evenly divided in their responses to the question of whether DTC advertisements encourage them to look for information about potentially serious medical conditions. Whereas 39 percent agreed (15% "strongly" and 24% "somewhat"), 48 percent disagreed (29% "strongly" and 19% "somewhat") with this statement. Respondents also revealed mixed feelings about whether DTC advertisements make it seem as if the drug will work for everyone, with 42 percent (18% "strongly" and 24% "somewhat") agreeing and 52 percent disagreeing (27% "strongly" and 25% "somewhat"). Two other questions revealed stronger respondent preferences. Some respondents believed that DTC advertisements made them worry about their health (17%; 5% "strongly agree" and 12% "somewhat agree"), but most did not have this concern (73%; 54% "strongly disagree" and 19% "somewhat disagree"). In addition, only 18 percent of respondents agreed (7% "strongly" and 11% "somewhat") that advertisements remind them to take their medications. The majority of respondents (66%; 51% "strongly" and 15% "somewhat") disagreed with this statement.
51

Attitudes and Behaviors Associated with DTC Promotion of Prescription Drugs Table 22: Patient Responses to Additional Opinion Items Item 2002 % (n)
Agree strongly 15% (112) Agree somewhat 24% (183) Neither agree nor disagree 14% (103) Disagree somewhat 19% (142) Disagree strongly 29% (219)
Advertisements for prescription drugs encourage me to look for information about potentially serious medical conditions I might be at risk of developing
DK/REF < 1% (3) Agree strongly 18% (140) Agree somewhat 24% (181) Neither agree nor disagree 6% (45) Disagree somewhat 25% (190) Disagree strongly 27% (204)
Advertisements for prescription drugs make it seem like the drug will work for everyone
DK/REF < 1% (2) Agree strongly 5% (36) Agree somewhat 12% (89) Neither agree nor disagree 10% (75) Disagree somewhat 19% (148) Disagree strongly 54% (414)
Advertisements for prescription drugs make me worry about my health
DK/REF 0 Agree strongly 7% (54) Agree somewhat 11% (82) Neither agree nor disagree 15% (116) Disagree somewhat 15% (117) Disagree strongly 51% (390)
Advertisements for prescription drugs help remind me to take my medicines
DK/REF < 1% (3) Base N 762
Beliefs about DTC Advertising and the Doctor-Patient Interaction
This section looks more closely at how patient beliefs regarding the usefulness of DTC advertising are related both to their interaction with a doctor and to their healthcare decision making. As detailed above, in 2002 fewer patients than in 1999 indicated that DTC advertising: (1) helps them have better discussions with their doctor; (2) provides them with enough information to decide whether they should discuss the drug with their doctor; and (3) helps them make better decisions about their healthcare. Using the 2002 data, we performed a regression analysis to assess which patient beliefs about DTC advertising predicted these three beliefs about DTC and the doctor-patient interaction. We used as a dependent measure of the usefulness of DTC to the doctor visit a scale composed of the three doctor-patient items (α = .71).24 We used the other belief items as predictors. Correlations among the
52
24 Reliability (as measured in this study by Cronbach’s alpha) is an estimate of the amount of error variance in a particular set of items. Higher reliabilities (i.e., those that approach a score of 1.00) indicate lower variance and a higher correlation between items. Scale reliabilities of 0.70 and above are usually considered good.

Attitudes and Behaviors Associated with DTC Promotion of Prescription Drugs predictor beliefs were modest, with the highest being 0.42 between question 39 of the survey (“I like seeing advertisements”) and question 40 (“ads make me aware of new drugs;” see Table 23). Table 23: Correlation Matrix for Predictors
Q39 Q40 Q41 Q42 Q43 Q44 Q48 Q49 Q50 Q51 Q52 Q53 Q39 I like seeing ads 1 .42 .04 -.15 -.09 -.19 .26 .39 -.15 -.18 .15 .28
Q40 Ads make me aware new drugs
1 -.05 -.02 -.09 -.07 .15 .27 -.16 -.03 .11 .19
Q41 Ads don't give enough info on benefits
1 .10 .31 .08 .10 .13 .14 .14 .09 .13
Q42 Ads make drug seem better than really are
1 .37 .29 -.10 .03 .06 .38 .16 -.02
Q43 Ads don't give enough info on possible risks
1 .20 -.08 .03 .14 .25 .12 -.02
Q44 Ads make it seem like dr not needed
1 -.05 .02 .20 .35 .19 .01
Q48 Only the safest drugs are advertised
1 .15 .06 -.08 .12 .23
Q49 Ads encourage me to search for info about condition
1 -05 .02 .32 .30
Q50 I wouldn't talk to dr b/c it would seem I didn't trust dr
1 .08 .08 .03
Q51 Ads make it seem drugs work for everyone
1 .11 -.01
Q52 Ads make me worry about my health
1 .21
Q53 Ads remind me to take my medicine
1
53

Attitudes and Behaviors Associated with DTC Promotion of Prescription Drugs The regression results indicate a significant model fit (R2= .50, F(12, 701) = 59.4, p < .001; see Table 24). As expected, patient beliefs about the usefulness of DTC advertising for their doctor visit exhibited a positive relationship with their overall liking for the ads. Respondents who had a more favorable opinion about DTC advertisements also felt these ads had a positive effect on the doctor-patient relationship. Beyond that and more important, patient belief about the usefulness of DTC for their doctor visit was significantly and directly related with agreement that DTC advertising: (a) increased their awareness of new drugs, (b) encouraged them to search for information about potentially serious conditions, (c) reminded them to take their medicines, (d) provided enough risk information, and (e) did not make them think that talking about an advertised drug meant they distrusted their doctor. Also, patient belief about the usefulness of DTC advertising for their doctor visit was directly related to whether the advertising induced worry about their health. Note that there was no association with whether enough information was provided about benefits. Table 24: Predictors of Patient Beliefs about the Usefulness of DTC Advertising for the Doctor-Patient Interaction Predictors * β t Pr. I like seeing ads .297 9.09 <.001 Ads make me aware of new drugs .249 8.33 <.001 Ads encourage search for information about condition
.224 7.23 <.001
Ads help remind me to take my medicine .129 4.45 <.001 Ads don’t give enough about possible risks -.089 -2.92 <.01 Would not talk to doctor about advertised drug because it would seem I didn’t trust doctor
-.083 -2.96 <.01
Ads make me worry about my health .059 2.03 <.05 Ads don’t give enough information about benefits -.054 -1.06 n s Ads make it seem drug works for everyone -.054 -1.78 n s Only the safest drugs are advertised .050 1.75 n s Ads make drug appear better than really are -.015 -0.48 n s Ads make it seem that doctor is not needed .010 .32 n s * Dependent variable is average of three items about whether DTC advertising helps have better discussions with the doctor, provides enough information to decide whether to discuss the drug with the doctor, and helps healthcare decisions.
54

Attitudes and Behaviors Associated with DTC Promotion of Prescription Drugs
PHYSICIAN RESULTS
Patient-Initiated Questions about Treatment Quick Look • Physicians indicated that when patients asked questions, they most frequently asked about
prescription drugs and generic drugs rather than about OTC drugs, herbal, or dietary supplements.
• Primary care physicians were more likely than specialists to hear frequent questions about OTC drugs and herbal and dietary supplements.
• The majority of physicians reported that the frequency of questions has increased over the last 5 years for all categories except OTC drugs.
We asked physicians to estimate how often (from "never" to "all the time") patients in their practice initiated questions about over-the-counter (OTC) drugs, herbal remedies or dietary supplements, generic drugs, and prescription drugs. Because so few physicians (less than 2%) reported they were "never" asked questions about these healthcare topics, responses were combined into "never/seldom". We also combined responses of "often" and "all the time" because of the low percentages of physicians who responded with the more extreme answer. Eighty-five percent (85%) of physicians reported that their patients asked about prescription drugs frequently and 62 percent reported that their patients asked about generic drugs frequently. As Figure 6 shows, primary care physicians were more likely than specialists to get questions "often/all the time" about OTC drugs (χ2 [1 df] = 13.46, p < .001) and herbal remedies or dietary supplements (χ2 [1 df] = 20.11, p < .001).
55

Attitudes and Behaviors Associated with DTC Promotion of Prescription Drugs Figure 6: Frequency of Patient-Initiated Questions about Treatments by Physician Specialty
4 1 4 1 5 3
2026
53
3946
29
57 59
6360
42
5850
66
37 36
17 142 2 1 4 1 2 0 0
0%
10%
20%
30%
40%
50%
60%
70%
80%
90%
100%
OTC PR
OTC SP
HerbalPR
Herbal SP
Generic PR
Generic SP
Rx PR
Rx SP
NeverSeldomOftenAll the time
We next asked physicians whether the frequency of questions in each of these topic areas had increased, decreased, or stayed the same over the previous 5 years. We chose this period of time because it was approximately the length of time since publication of the DTC broadcast guidance. Figure 7 shows the percentage of physicians reporting an increase in the rate of questions about each of these treatment topics over the last 5 years. Most physicians reported an increase in questions across all categories, except for OTC drugs. Primary care physicians were significantly more likely than specialists to report an increase in patient questions about prescription drugs (PR: 76% vs. SP: 66%; χ2 [1 df] = 5.61, p < 0.05). There were no significant differences between physician categories in the reported rate of patient-initiated questions about generic drugs (PR: 66% vs. SP: 62%; χ2 [1 df] = 1.05, p > 0.05) or herbal remedies and dietary supplements (PR: 77% vs. SP: 70%,χ2 [1 df] = 1.05, p > 0.05).
56

Attitudes and Behaviors Associated with DTC Promotion of Prescription Drugs Figure 7: Frequency of Physician-Indicated Change in Patient-Initiated Questions about Treatment
3629
7770 66 62
7666
6266
2128 32 36
2434
2 5 2 2 2 2 1 0
0%
10%
20%
30%
40%
50%
60%
70%
80%
90%
100%
OTC PR
OTC SP
HerbalPR
Herbal SP
Generic PR
Generic SP
Rx PR
Rx SP
DecreaseStay sameIncrease
57
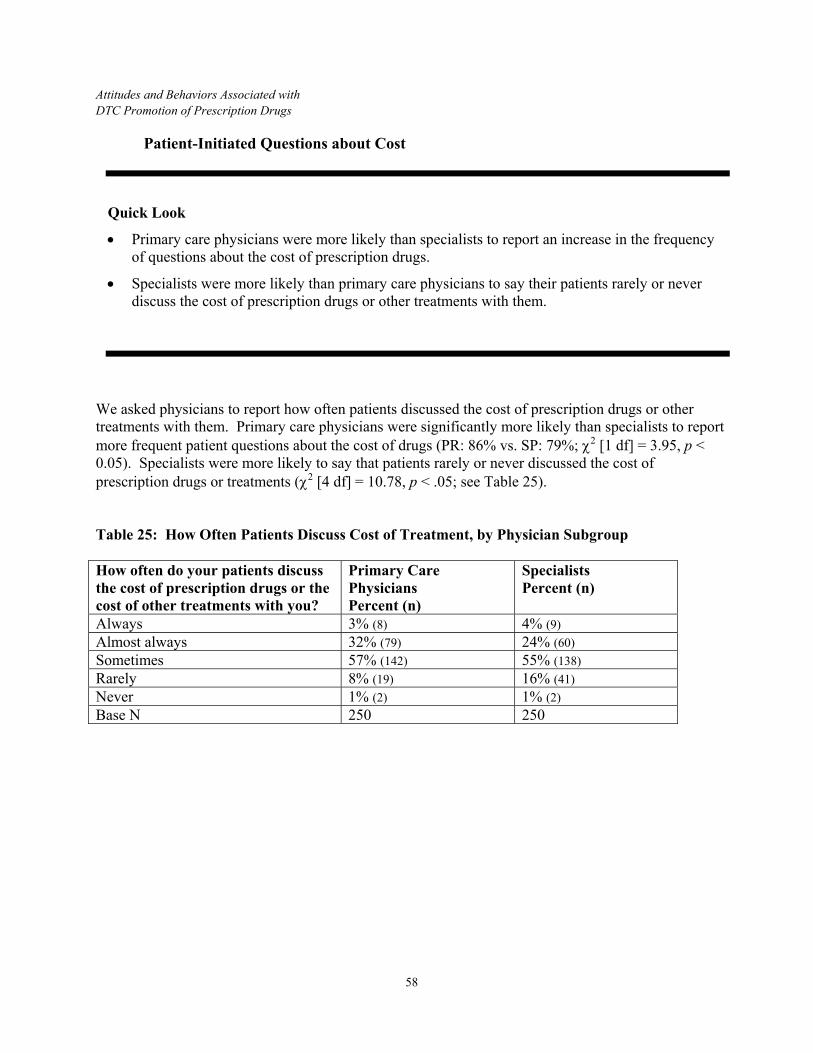
Attitudes and Behaviors Associated with DTC Promotion of Prescription Drugs
Patient-Initiated Questions about Cost
Quick Look
• Primary care physicians were more likely than specialists to report an increase in the frequency of questions about the cost of prescription drugs.
• Specialists were more likely than primary care physicians to say their patients rarely or never discuss the cost of prescription drugs or other treatments with them.
We asked physicians to report how often patients discussed the cost of prescription drugs or other treatments with them. Primary care physicians were significantly more likely than specialists to report more frequent patient questions about the cost of drugs (PR: 86% vs. SP: 79%; χ2 [1 df] = 3.95, p < 0.05). Specialists were more likely to say that patients rarely or never discussed the cost of prescription drugs or treatments (χ2 [4 df] = 10.78, p < .05; see Table 25). Table 25: How Often Patients Discuss Cost of Treatment, by Physician Subgroup How often do your patients discuss the cost of prescription drugs or the cost of other treatments with you?
Primary Care Physicians Percent (n)
Specialists Percent (n)
Always 3% (8) 4% (9) Almost always 32% (79) 24% (60) Sometimes 57% (142) 55% (138) Rarely 8% (19) 16% (41) Never 1% (2) 1% (2) Base N 250 250
58

Attitudes and Behaviors Associated with DTC Promotion of Prescription Drugs
Influence of DTC Advertising on a Specific Patient Interaction In this section of the survey, physicians were asked to think of a patient who had initiated a conversation about a prescription drug the patient had seen advertised. A variety of questions were asked to assess the representativeness of this patient interaction. See Appendix C.4 for further details.
Perceived Benefits and Problems of DTC Exposure in a Specific Patient Interaction
Quick Look • A greater percentage of physicians reported that the patient’s exposure to a DTC advertisement
had benefits for their interaction with the patient (41%), than that it created problems (18%).
• Of the 41 percent of physicians reporting a benefit, the most frequent freely-elicited benefits mentioned were:
o better discussions with the patient (53%) o patient more aware of treatments (42%) o DTC informs/educates patient (10%).
• Of the 18% of physicians reporting problems, the most frequent freely-elicited problems mentioned were:
o time correcting misconceptions (41%) o patient asked for drug they did not need/did not have condition (26%) o patient wanted a prescription drug rather than other treatment (9%)
• The majority of physicians (73%) agreed strongly or somewhat that their patient asked thoughtful questions because he/she saw a DTC advertisement.
• Forty-one percent of physicians agreed strongly or somewhat that their patient was confused about the effectiveness of the drug because he/she saw a DTC advertisement.
We asked physicians recalling an interaction with a patient who had initiated a conversation about a DTC-advertised prescription drug whether this patient having seen an advertisement created any beneficial effects or problems for their interaction. Forty-one percent (41%; 186/459) of physicians reported a beneficial effect on their interaction because the patient had seen an advertisement for the drug they discussed. About two-thirds of these physicians (124/186) reported one benefit whereas a third (62/186) mentioned two, three, or four beneficial effects. There was no difference in the number of benefits mentioned by primary care physicians versus specialists (M PRs = 1.30; M SPs = 1.43 (F = 1.97, ns). Eighteen percent (18%; 82/459) of physicians said that because the patient had seen an advertisement a problem was created. Ninety-one percent (91%; 75/82) of these physicians reported one problem and the remaining 9 percent (7/82) mentioned two problems. There was no difference in the number 59

Attitudes and Behaviors Associated with DTC Promotion of Prescription Drugs mentioned by primary care physicians versus specialists (M PRs = 1.07; M SPs = 1.09, F < 1, ns). Overall, 46 percent (209/459) of physicians did not mention either a benefit or a problem, and only 4 percent (18/459) indicated both a benefit (or benefits) and a problem (or problems). We asked open-ended follow up questions of those physicians who said that there were either beneficial effects or problems. As shown in Table 26, physicians who said there were benefits were most likely to mention "better discussions with the patient" (53%), "patient more aware of treatments" (42%), and "DTC informs/educates patient" (10%). Primary care physicians and specialists differed only in their tendency to mention "patient more likely to take prescribed drug" as a benefit (PRs: 4% vs. SPs: 14%). Table 26: Benefits and Problems Created by Patient Seeing an Advertisement for a Prescription Drug
60
What beneficial effects did it have? (open-ended, multiple responses accepted)
Primary Care Physicians percent (n)
Specialists percent (n)
All Percent (n)
Better discussion with patient 52% (48) 55% (51) 53% (99) Patient more aware of treatments 41% (36) 45% (42) 42% (78) Informs/educates 10% (8) 13% (11) 10% (19) Patient more likely to take prescribed drug
11% (11) 8% (8) 10% (19)
Patient more likely to consider using prescription drugs
4% (4) 14% (13) 9% (17)
New condition was discovered 5% (5) 6% (6) 6% (11) Patient sought treatment for serious condition
3% (3) 0 2% (3)
Other 4% (4) 2% (2) 3% (6) DK/REF 1% (1) 0 1% (1) Base N (among physicians who said the fact the patient saw an ad had benefits for the interaction)
94 93 187
What problems did it cause? (open-ended, multiple responses accepted)
Primary Care Physicians percent (n)
Specialists percent (n)
All percent (n)
Spent time correcting patient’s misconceptions/correcting wrong information
34% (14) 49% (20) 41% (34)
Patient asked for drug they did not need/did not have condition
29% (12) 22% (9) 26% (21)
Patient wanted prescription drug rather than other treatment
12% (5) 7% (2) 9% (7)
Required more visit time 2% (1) 5% (3) 5% (4) Created pressure to prescribe drug 2% (1) 7% (3) 5% (4) Prefer they listen to physician rather than ad
2% (1) 5% (2) 4% (3)

Attitudes and Behaviors Associated with DTC Promotion of Prescription Drugs Concerns about insurance coverage 5% (2) 2% (1) 4% (3) Concerns about side effects 0 5% (2) 2% (2) Unrealistic expectations 0 5% (2) 2% (2) Thought we would have samples 5% (2) 0 2% (2) Other 15% (6) 2% (1) 9% (7) DK/REF 0 0 Base N (among physicians who said the fact the patient saw an ad created problems for the interaction)
41 41 82
Physicians who said there were problems were most likely to mention "time correcting misconceptions" (41%), "patient asked for drug they did not need/did not have condition" (26%), "patient wanted a prescription drug rather than other treatment" (9%) as most common. In addition, we asked all physicians closed-ended attitude questions about the impact on the interaction of the patient’s exposure to a DTC advertisement (see Figure 8). More physicians agreed than disagreed that the patient asked thoughtful questions (73% vs. 17%) and that the usefulness of time was increased (45% vs. 35%). More physicians disagreed than agreed that the patient was more aware of potential side effects (50% vs. 30%), that the patient was confused about the effectiveness of the drug (49% vs. 41%), that the patient was confused about the appropriate treatment (51% vs. 37%) and that the patient had unnecessary worries about his or her health (63% vs. 24%). Primary care physicians and specialists did not differ in their attitudes about the effects of DTC advertising on the patient encounter when recalling their last relevant appointment.
61

Attitudes and Behaviors Associated with DTC Promotion of Prescription Drugs Figure 8: Responses of physicians to the question, “Because this patient saw the advertisement….”
62

Attitudes and Behaviors Associated with DTC Promotion of Prescription Drugs
Patient Drug Requests and Physician Prescribing Behavior Quick Look • Eighty-six percent (86%) of physicians recalled patients asking about a prescription drug and
88% of physicians reported that these patients had the condition the drug treats.
• Primary care physicians were more likely to be asked for a prescription drug in general than were specialists (60% vs. 44%); they were equally likely to give a prescription when asked (77% vs. 74%).
• Primary care physicians were also more likely to be asked for a specific brand name drug than were specialists (65% vs. 52%), and they were more likely to prescribe when asked (64% vs. 46%).
• When giving reasons for not prescribing a requested drug, physicians were most likely to state that a different drug was more appropriate (71%) or that the drug was not right for the patient (61%). Specialists were more likely than primary care physicians to say that the drug was not right for the patient, a different drug was more appropriate, or the drug had side effects the patient was not aware of. Primary care physicians were more likely than specialists to say that: the patient did not need a prescription drug, the requested brand was not on the formulary, or the patient could use an OTC drug.
We asked specific questions about what transpired during this particular patient interaction. Here we made a distinction between asking about a prescription drug versus asking for a particular drug in an attempt to differentiate the influence of patients’ asking general questions about a drug from the influence of direct requests for a prescription. Among all physicians recalling a patient-initiated question about a DTC-advertised drug, 86 percent (390/452) reported the patient asking about a specific brand. Of this group, 88 percent (343/390) reported that this patient had the condition the drug treats. Primary care physicians and specialists reported the same level of inquiry and proportion of patients who actually had the condition treated by the drug they asked about (see Figure 9).
63

Attitudes and Behaviors Associated with DTC Promotion of Prescription Drugs Figure 9: Physicians’ Reports of Patients’ Brand Prescription Inquiries and Condition
In examining interactions in which patients asked for a prescription drug, primary care physicians (60%; 138/232) were more likely than specialists (44%; 99/227) to have had their patient asked them for a prescription (χ2 [2 df] = 15.62, p < .001). Physicians in both subgroups who said their patient asked for a prescription were equally likely to report giving a prescription at that visit (PR: 77% vs. SP 74%; χ2 [1 df] < 1, ns). Primary care physicians (65%; 136/194) were also more likely than specialists (52%; 85/165) to report their patient had asked for a specific brand name drug (χ2 [1 df] = 6.64, p < .01). As Figure 10 shows, when this happened, primary care physicians (64%; 81/126) were more likely than specialists (46%; 39/85) to report prescribing the brand name drug the patient requested (χ2 [1 df] = 7.01, p < .01).
64

Attitudes and Behaviors Associated with DTC Promotion of Prescription Drugs Figure 10: Physicians’ Reports of Patients’ Brand Prescription Requests and Physician Prescribing
To capture physicians’ reasons for not prescribing a requested drug, we asked them to explain their refusal. Primary care physicians and specialists gave different reasons for not prescribing the drug requested by their patient. As Table 27 shows, specialists were more likely than primary care physicians to say the drug was not right for the patient, a different drug was more appropriate, or the drug had side effects the patient was not aware of. Primary care physicians, on the other hand, were more likely than specialists to say the patient did not need a prescription drug, the requested brand was not on the formulary, or the patient could use an OTC drug. Overall, the strongest reasons were that the drug was not right for the patient or that a different drug was more appropriate.
65

Attitudes and Behaviors Associated with DTC Promotion of Prescription Drugs Table 27: Reasons Physician Did Not Prescribe Requested Drug Why didn’t you prescribe the drug the patient requested? (open-ended, multiple responses permitted)
Primary Care Physicians Percent (n)
Specialists percent (n)
χ2[1 df], sig
A less expensive drug was available 51% (26) 32% (15) 3.65, ns The brand was not on the patient’s formulary
22% (11) 6% (3) 4.61, < .05
The drug was not right for the patient 43% (22) 81% (38) 14.6, < .001 A different drug was more appropriate for the patient
61% (31) 83% (39) 5.90, < .05
The drug had side effects the patient was not aware of
37% (19) 60% (28) 4.88, < .05
The patient did not need a prescription drug
33% (17) 11% (5) 7.23, < .01
The patient needed to change his/her behavior or lifestyle
25% (13) 19% (9) < 1, ns
The patient could use an OTC drug 24% (12) 0 12.6, < .001 Some other reason 29% (15) 19% (9) 1.39, ns Base N (among physicians who said they did not prescribe the drug the patient requested OR the brand name drug the patient requested)
51 47
66

Attitudes and Behaviors Associated with DTC Promotion of Prescription Drugs
Perceived Patient Influence on the Interaction Quick Look • Ninety-one percent (91%) of physicians reported that their patient did not try to influence the
course of treatment in a way that would have been harmful to the patient.
• Primary care physicians (73%) were more likely than specialists (63%) to report they believed their patient came to the visit expecting to get a prescription and to report that their patient’s expectations influenced their decision to prescribe.
• Primary care physicians felt more pressure to prescribe than specialists.
We examined physicians’ perceptions of patient influences on the interaction. The majority of physicians (91%) said the patient did not try to influence the course of treatment in a way that would have been harmful to the patient. Primary care physicians and specialists did not differ in this assessment (χ2 [1 df] = 1.08, ns). They did differ, however, in their sense of patients’ expectations about the visit. Primary care physicians (73%) were slightly more likely than specialists (63%) to believe the patient came to the visit expecting to get a prescription (χ2 [2 df] = 5.89, p = .05) and to report that the patient’s expectation influenced their decision to prescribe (χ2 [3 df] = 16.87, p < .01; see Table 28). Table 28: Influence of Patient Expectations on Decision to Prescribe To what extent did the patient’s expectation influence your decision to prescribe or not prescribe?
Primary Care Physicians percent (n)
Specialists percent (n)
No influence at all 34% (78) 51% (115) Influenced a little bit 31% (72) 28% (64) Influenced somewhat 28% (66) 18% (41) Influenced a great deal 7% (16) 3% (7) Base N (among physicians who could remember a patient who had initiated a discussion about a prescription drug he/she had seen advertised)
232 227
Fifty-three percent (53%; 243/459) of all physicians reported no pressure to prescribe. Nevertheless, primary care physicians reported more pressure to prescribe compared with specialists (χ2 [3 df] = 14.50, p < .01). Specifically, specialists were more likely than primary care physicians to report they felt "not at all pressured" to prescribe a drug for the patient at this visit (58% vs. 48%). Conversely, 22 percent of primary care physicians felt "somewhat" or "very pressured" to prescribe, compared with 13 percent of specialists (see Table 29).
67

Attitudes and Behaviors Associated with DTC Promotion of Prescription Drugs Table 29: Reported Pressure to Prescribe To what extent did you feel pressured to prescribe a drug for the patient at this visit?
Primary Care Physicians percent (n)
Specialists percent (n)
Not at all pressured 48% (111) 58% (132) A little pressured 30% (69) 29% (66) Somewhat pressured 15% (34) 12% (27) Very pressured 7% (17) 1% (2) DK/REF < 1% (1) 0 Base N(among physicians who could remember a patient who had initiated a discussion about a prescription drug he/she had seen advertised)
232 227
68

Attitudes and Behaviors Associated with DTC Promotion of Prescription Drugs
Physicians’ Opinions about the General Influence of DTC Advertising Quick Look • Most physicians believed patients understand either somewhat or very well: that DTC
advertised drugs are available only by prescription (92%); that only a doctor can decide if the drug is right for the patient (82%); the condition the drug treats (80%) and the benefits of the drugs (78%).
• Fewer physicians believed that patients understand: the possible risks and negative effects of DTC advertised drugs (40%); the limitations of the drug’s efficacy (30%); or who should not use the drug (25%).
• Overall, primary care physicians were more likely than specialists to agree that DTC advertising causes problems for their patients and practice.
• Among possible problems, 70 percent of primary care physicians and 60 percent of specialists felt that DTC confuses patients about the relative risks and benefits of drugs. Seventy-five percent (75%) of all physicians agreed that DTC causes patients to think drugs work better than they really do. In contrast, only 28 percent of all physicians agreed that DTC advertising causes tension between them and their patients. Thirty-eight percent (38%) of all physicians agreed that it causes their patients to question or second guess their diagnosis.
• Among possible benefits, 72 percent of physicians agreed that DTC increases awareness of possible treatments in general, and 44 percent agreed that DTC advertising increases patient awareness of problems earlier. However, only 34 percent of physicians agreed that DTC increased the likelihood patients would use their medications properly, and 32 percent agreed it would help patients adhere to their treatment regimen.
In addition to asking physicians to recall the details of a recent patient encounter in which a DTC-advertised drug was discussed, respondents were asked a series of questions to assess their opinions about the general influence of DTC advertising on their patients and practice. Three different aspects of physician attitudes toward DTC advertising were assessed: (1) the influence of DTC on their patients’ understanding of prescription drugs, (2) the negative influence of DTC advertising on their patients and practice, and (3) the positive influence of DTC advertising on their patients and practice. Multiple questions were administered to assess the same type of attitude to achieve more reliable responses.
69

Attitudes and Behaviors Associated with DTC Promotion of Prescription Drugs
Beliefs about Patient Understanding of Prescription Drugs The next series of questions asked physicians the extent to which they felt that their patients understand prescription drugs.25 Primary care physicians and specialists had similar perceptions about how well their patients understand DTC advertised prescription drugs (see Figure 11). Ninety-two percent (92%) of physicians believed patients understand somewhat or very well that the drug is available only by prescription. Eighty-two percent (82%) of physicians believed that patients understand somewhat or very well that only a doctor can decide if the drug is right for the patient, whereas 80 percent believed patients understand what condition the drug treats, and 78 percent believed patients understand the possible benefits and positive effects of using the drug. On the other hand, however, only 40 percent of physicians believed that patients understand somewhat or very well the possible risks and negative effects of using the drug. Overall then, physicians believed that patients have a better understanding of the benefits of DTC-advertised drugs compared to the risks. Further supporting this contention, only 30 percent of physicians believed that patients understand the limitations of the drug’s efficacy, and only 25 percent believed that patients understand who should not use the drug.
25 For both primary care physicians and specialists, factor analyses revealed one cohesive factor labeled understanding. This pattern was very clear in specialists, with all questions loading on the one factor, which was respectably reliable (α = .80). The pattern was less clear in primary care physicians although the resulting factor structure was similar. For primary care physicians, the items “the drug is available only by prescription” and “a doctor or other healthcare provider can decide if the drug is right for the patient” did not load on this factor. These two items did not load on either factor when a two-factor solution was attempted. Nevertheless, the acceptable reliability of the scale (α = .74) did not increase when these two items were removed, so all nine items were included in the understanding composite for primary care physicians as well as specialists. Results showed that primary care physicians and specialists did not differ significantly on understanding (t[497] = -.90, ns).
70

AtDT FiD
titudes and Behaviors Associated with C Promotion of Prescription Drugs
gure 11: Physicians’ Opinions of How Well Patients Understand Advertised Prescription rugs
71

Attitudes and Behaviors Associated with DTC Promotion of Prescription Drugs
Potential Negative Effects of DTC Advertising The next set of questions was designed to assess doctor perceptions of the extent to which DTC advertising created problems for their patients and practice.26 On the whole, primary care physicians were more likely than specialists to indicate that DTC advertising had caused problems (t[498] = 3.38, p < .01).27 For the purpose of presentation, we created five categories of convenience to display the differences of opinion between primary care physicians and specialists, where differences existed. Note that we did not use these categories for analysis.
• Exaggerates benefits Primary care physicians and specialists responded differently to the question of confusion of risks and benefits (χ2 [3 df] = 7.89, p < .05), but similarly to the question of overestimation of efficacy (χ2 [3 df] = 6.22, ns; see Figure 12).
26 Factor analyses revealed that the questions combined into one factor for both primary care physicians and specialists with excellent reliability (PR α = .88; SP α = .90). Therefore, further analyses for both primary care physicians and specialists were conducted on the whole potential problems composite.
72
27 The scale ranged from 1 ("Not at all") to 4 ("A great deal"). For example, “To what extent is DTC advertising for prescription drugs confusing your patients about the relative risks and benefits of prescription drugs?”

Attitudes and Behaviors Associated with DTC Promotion of Prescription Drugs Figure 12: Physicians’ Perceived Problems DTC Creates for Their Patients and Practice: Exaggerates Benefits
Seventy percent (70%) of primary care physicians said that DTC advertising confuses their patients either "a great deal" (28%) or "somewhat" (42%) about the relative risks and benefits of prescription drugs, whereas about 60 percent of specialists rated the confusion as either "a great deal" (24%) or "somewhat" (36%). Seventy-five percent (75%) of physicians of both categories indicated that DTC advertising causes patients to believe either "a great deal" (32%) or "somewhat" (43%) that drugs works better than they actually do.
• Seek advertised drugs Primary care physicians and specialists responded differently to the question of whether advertising caused patients to want advertised drugs over others (χ2 [3 df] = 12.10, p < .01) and to the question of whether advertising caused patients to want advertised drugs over less expensive treatments (χ2 [3 df] = 17.08, p < .01; see Figure 13).
73

Attitudes and Behaviors Associated with DTC Promotion of Prescription Drugs Figure 13: Physicians’ Perceived Problems DTC Creates for Their Patients and Practice: Seek Advertised Drugs.
Specifically, 63 percent of primary care physicians indicated that DTC advertising causes patients to want advertised drugs over any others, however effective, either "a great deal" (21%) or "somewhat" (42%), whereas 58 percent of specialists thought this ("a great deal" [18%] or "somewhat" [40%]). Moreover, 70 percent of primary care physicians said that DTC advertising causes patients to want advertised drugs over less expensive drugs either "a great deal" (26%) or "somewhat" (44%), whereas 57 percent of specialists thought it caused this problem either "a great deal" (15%) or "somewhat" (42%).
• Seek unnecessary prescriptions Although primary care physicians and specialists responded differently to the question of DTC advertising’s role in causing patients to ask for unnecessary prescriptions (χ2 [3 df] = 11.11, p < .05), they responded similarly to the question of DTC’s role in causing patient expectations of a prescription for every condition (χ2 [3 df] = 5.36, ns; see Figure 14).
74

Attitudes and Behaviors Associated with DTC Promotion of Prescription Drugs Figure 14: Physicians’ Perceived Problems DTC Creates for Their Patients and Practice: Seek Unnecessary Prescriptions
Sixty-two percent (62%) of primary care physicians indicated that DTC advertising causes patients to ask for unnecessary prescriptions either "a great deal" (17%) or "somewhat" (45%), whereas 52 percent of specialists thought this either "a great deal" (13%) or "somewhat" (39%). Fifty-eight percent (58%) of physicians overall agreed either "a great deal" (21%) or "somewhat" (37%) that DTC advertising causes patients to expect to receive a prescription for every condition.
• Creates anxiety Primary care physicians responded differently than specialists on the issue of whether DTC advertising causes unnecessary anxiety about potential diseases (χ2 [3 df] = 19.56, p < .01), but responded similarly to the question of whether it creates unnecessary anxiety about potential side effects (χ2 [3 df] = 5.67, ns; see Figure 15).
75

Attitudes and Behaviors Associated with DTC Promotion of Prescription Drugs Figure 15: Physicians’ Perceived Problems DTC Creates for Their Patients and Practice: Creates Anxiety.
Specifically, 51 percent of primary care physicians indicated that DTC advertising causes anxiety about potential diseases either "a great deal" (16%) or "somewhat" (35%), whereas 41 percent of specialists thought it created these anxieties either "a great deal" (8%) or "somewhat" (33%). Approximately 44.2 percent of physicians of both categories indicated that DTC advertising causes unnecessary anxieties about side effects either "a great deal" (14.6%) or "somewhat" (29.6%).
• Increases doctor-patient tensions Primary care physicians and specialists responded similarly to the question of whether DTC advertising causes tension between themselves and their patients (χ2 [3 df] = 4.43, ns), but responded differently to the question of whether DTC advertising causes patients to second-guess their diagnoses (χ2 [3 df] = 8.96, p < .05; see Figure 16).
76

Attitudes and Behaviors Associated with DTC Promotion of Prescription Drugs Figure 16: Physicians’ Perceived Problems DTC Creates for Their Patients and Practice: Doctor-Patient Tensions
About 28 percent of physicians of both categories indicated that DTC advertising caused tension between themselves and their patients either "a great deal" (5%) or "somewhat" (23%). Forty-three percent (43%) of primary care physicians indicated that DTC advertising increased patient second-guessing either "a great deal" (11%) or "somewhat" (32%), whereas 38 percent of specialists indicated that DTC advertising caused more second-guessing either "a great deal" (8%) or "somewhat" (30%).i Supplemental analyses involving demographic and condition variables are shown in Appendix C.
77

Attitudes and Behaviors Associated with DTC Promotion of Prescription Drugs
Potential Positive Effects of DTC Advertising Finally, we asked physicians to respond to a series of attitude questions concerning the potential benefits of DTC. The results were virtually identical for primary care physicians and specialists.28 As with potential problems, we organized potential benefits into five categories to facilitate presentation. Each category included two questionnaire items. The Increase Awareness category contained the items “causing your patients to become aware of problems earlier” and “causing your patients to become aware of possible treatments.” The Increase Involvement category includes the items “causing your patients to be more involved in their healthcare” and “causing the average patients more concerned about his or her health.” The Increase Compliance category contains the items “improving the likelihood that your patients will use their medications properly” and “causing your patients to adhere to their treatment regimen.” The Extend Reach category contains the items “causing patients to come in who are otherwise ‘hard-to-reach’” and “causing your patients to seek treatment for potentially serious conditions.” Finally, the Doctor-Patient Interaction category contains the items “causing your patients to ask better questions” and “causing you and your patients to have better discussions about their health.” Analysis of physician subgroups showed that primary care physicians and specialists did not differ significantly in their attitudes about the potential benefits of DTC advertising (t[498] = .50, ns). Figure 17 shows the frequency breakdown for each of the five conceptual categories and their corresponding items.
7828 In both cases, all ten items loaded cleanly on one factor, revealing excellent reliability (α = .90).

Attitudes and Behaviors Associated with DTC Promotion of Prescription Drugs Figure 17: Physicians’ Perceived Benefits DTC Creates for Their Patients and Practice
• Increase Awareness Seventy-two percent (72%) of physicians believe a “great deal” or “somewhat” that DTC makes patients aware of possible treatments. Of all the questions about potential benefits, this item engendered the greatest agreement from physicians. Forty-four percent (44%) of physicians believed that DTC advertising caused patients to become aware of problems earlier.
• Increase involvement Approximately equal numbers of physicians believed "a great deal" or "somewhat" DTC advertising causes patients to be more involved in their healthcare (58%) and causes the average patient more concerned about his or her health (54%).
79
Attitudes and Behaviors Associated with DTC Promotion of Prescription Drugs
• Increase compliance Only a third of physicians believed “a great deal” or “somewhat” DTC advertising causes patients to be more likely to adhere to their treatment regimen (32%) or more likely to use their medications properly (34%).
• Extend reach Thirty percent (30%) of physicians believed “a great deal” or “somewhat” DTC advertising encourages hard-to-reach patients to come in, and 44 percent believed it causes patients to seek treatment for potentially serious conditions.
• Doctor-patient interaction Slightly over half of physicians (56%) believed “a great deal” or “somewhat” DTC advertising makes patients ask better questions, and 51 percent believed it leads to better discussions about the patient’s health.ii Supplemental analyses involving demographic and condition variables are shown in Appendix C.
80

Attitudes and Behaviors Associated with DTC Promotion of Prescription Drugs
Overall Influence of DTC Advertising Quick Look • Physicians were evenly distributed in their ratings of the overall influence of DTC advertising on
their patients and practice. About one-third believed DTC advertising has had a positive influence, one-third believed it has had a negative influence, and about one-third believed it has not had any influence at all.
• Primary care physicians (38%) were more likely than specialists (27%) to rate the overall influence of DTC as somewhat or very negative.
Finally, physicians were asked to rate the overall impact of DTC advertising on their patients and practice. Primary care physicians were more likely to rate the impact as somewhat or very negative, compared to specialists (χ2 [4 df] = 9.75, p < .05; see Figure 18). Figure 18: Overall Influence of DTC Advertising on Patients and Practice by Physician Subgroup
3
36
23
32
62
3833
23
4
05
10152025303540
VeryPositively
SomewhatPositively
No Effect SomewhatNegatively
Verynegatively
Perc
ent
PRSP
Note that physicians tended to fall into three almost equally divided groups on this question. Approximately one-third (n=196) believed DTC has had a very or somewhat positive effect (POS), about one-third (n=163) believed it has had a very or somewhat negative effect (NEG), and about one-third (n=141) believed it has not affected their patients and practice at all (NEU). Physicians in the NEG group were slightly more likely to be primary care physicians (58% vs. 42% specialists); this split was reversed in the NEU group while the POS group was evenly split between primary care physicians and specialists. The three groups did not differ in terms of gender, type of practice, number of patients seen per week, years in practice and number of prescriptions written per week. 81

Attitudes and Behaviors Associated with DTC Promotion of Prescription Drugs Physicians’ overall evaluation of the influence of DTC advertising on their patients and practice was consistent with their answers regarding a recent interaction with a patient (see section, Perceived Benefits and Problems of DTC Exposure in a Specific Patient Interaction). Specifically, in response to the question of whether a DTC advertisement had caused any problems or created any benefits, about one-third of those in NEG (versus about 8% in POS) mentioned one or more problems. In contrast, about 62 percent of the physicians in the POS group (versus 17% in the NEG) mentioned one or more benefits. Physicians’ overall evaluation of the influence of DTC advertising was also consistent with their opinions of the specific benefits and problems created by DTC advertising (see section, Perceived Benefits and Problems of DTC Exposure in a Specific Patient Interaction). For example, physicians who have a negative view of DTC are four times more likely than those with a positive view to say that DTC advertising confuses their patients about the relative risks and benefits of prescription drugs "a great deal "(48% vs. 11%; χ2 [6 df] = 96.07, p < .01; see Figure 19). Figure 19 : Belief That DTC Confuses Patients about Relative Risks and Benefits by Overall Evaluation of DTC Advertising
48
2111
41
40
37
2843
11 1092
0%
10%
20%
30%
40%
50%
60%
70%
80%
90%
100%
Negative Neutral Positive
Physician Overall Evaluation of DTC Advertising
Perc
enta
ge
Not At All
A Little
Spmewhat
A Great Deal
Similarly, those with a negative view are about three times more likely than those with a positive view to feel that DTC advertising causes patients to think drugs work better than they actually do "a great deal" (54% vs. 18%; χ2 [6 df] = 75.09, p < .01; see Figure 20). Difference between physicians in the POS and NEG groups are also evidenced by their responses to other potential problems and benefits created by DTC advertising (see Table 30).29
82
29 Responses for physicians in the NEU group tended to fall between the POS and NEG groups and therefore were not included in the table.

Attitudes and Behaviors Associated with DTC Promotion of Prescription Drugs Figure 20 : Belief That DTC Causes Patients to Think Drugs Work Better than They Actually Do by Overall Evaluation of DTC Advertising
54
2518
36
4349
1927
135
92
0%
10%
20%
30%
40%
50%
60%
70%
80%
90%
100%
Negative Neutral Positive
Physician Overall Evaluation of DTC Advertising
Perc
enta
ge
Not At All
A Little
Spmewhat
A Great Deal
83
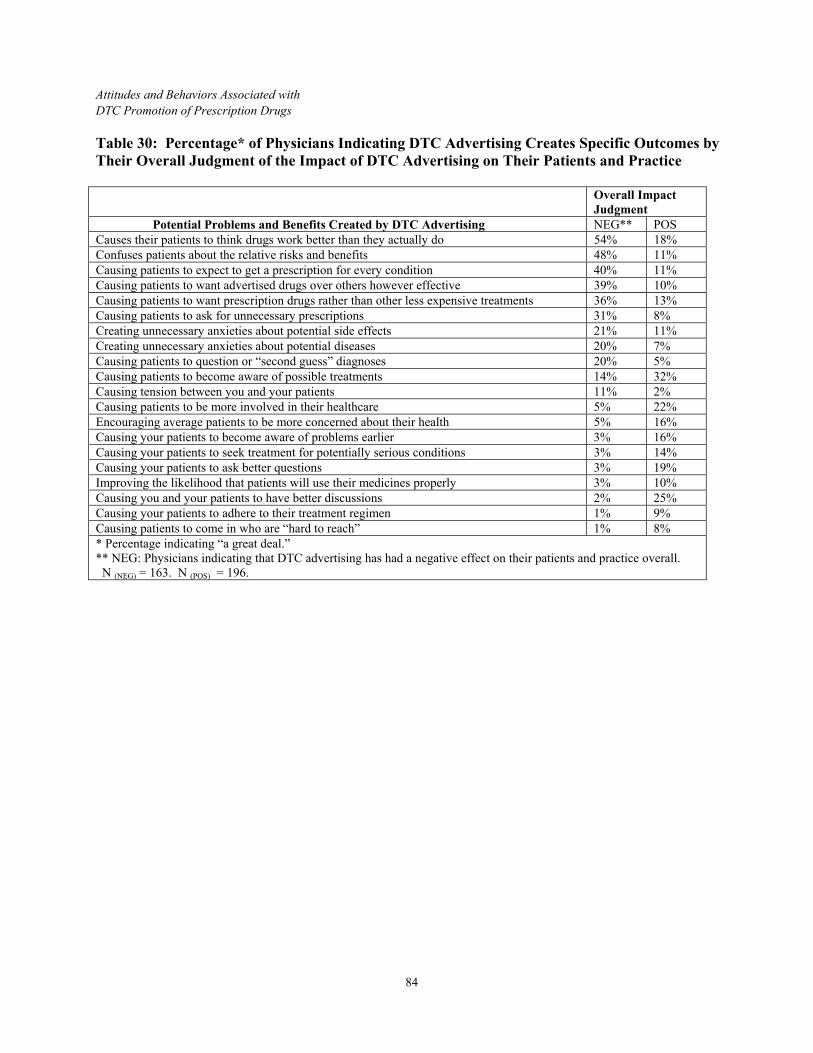
Attitudes and Behaviors Associated with DTC Promotion of Prescription Drugs Table 30: Percentage* of Physicians Indicating DTC Advertising Creates Specific Outcomes by Their Overall Judgment of the Impact of DTC Advertising on Their Patients and Practice Overall Impact
Judgment Potential Problems and Benefits Created by DTC Advertising NEG** POS Causes their patients to think drugs work better than they actually do 54% 18% Confuses patients about the relative risks and benefits 48% 11% Causing patients to expect to get a prescription for every condition 40% 11% Causing patients to want advertised drugs over others however effective 39% 10% Causing patients to want prescription drugs rather than other less expensive treatments 36% 13% Causing patients to ask for unnecessary prescriptions 31% 8% Creating unnecessary anxieties about potential side effects 21% 11% Creating unnecessary anxieties about potential diseases 20% 7% Causing patients to question or “second guess” diagnoses 20% 5% Causing patients to become aware of possible treatments 14% 32% Causing tension between you and your patients 11% 2% Causing patients to be more involved in their healthcare 5% 22% Encouraging average patients to be more concerned about their health 5% 16% Causing your patients to become aware of problems earlier 3% 16% Causing your patients to seek treatment for potentially serious conditions 3% 14% Causing your patients to ask better questions 3% 19% Improving the likelihood that patients will use their medicines properly 3% 10% Causing you and your patients to have better discussions 2% 25% Causing your patients to adhere to their treatment regimen 1% 9% Causing patients to come in who are “hard to reach” 1% 8% * Percentage indicating “a great deal.” ** NEG: Physicians indicating that DTC advertising has had a negative effect on their patients and practice overall. N (NEG) = 163. N (POS) = 196.
84
Attitudes and Behaviors Associated with DTC Promotion of Prescription Drugs
GENERAL DISCUSSION The opinions and experiences of patients and physicians provide valuable input into the evaluation of how DTC advertising may affect the public health. FDA’s three surveys on the effects of DTC advertising focused on the doctor-patient interaction. DTC advertising may potentially influence this interaction by motivating information-seeking, healthcare visits, questions, requests, or demands. Such behaviors and the opinions of both patients and physicians toward DTC advertising may influence both the substance and tone of healthcare interactions. The following discussion is structured to explore how our data address pertinent questions concerning the consequences of DTC advertising for the doctor-patient interaction.
Does DTC Advertising Increase Awareness? One potential consequence of DTC advertising is increased patient awareness of (1) DTC advertising itself, (2) the content or types of information provided in DTC advertisements, (3) medical conditions, and (4) new treatments. The two patient surveys revealed high levels of general awareness of DTC advertising: 72 percent of patients either heard or saw an advertisement for a prescription drug in 1999, and 81 percent had done so in 2002. People also reported having seen a greater variety of drugs advertised in 2002 than in 1999. Television continues to be the most common perceived medium of exposure: 94 percent of patients recalled seeing DTC television advertisements in 1999 and 97 percent in 2002. Magazines follow, with 66 percent reporting exposure in 1999 and 75 percent in 2002. Another considerable source of ad exposure occurs in retail stores. In 2002, 41 percent of respondents indicated exposure to DTC advertisements in the grocery store or pharmacy. Paralleling the general growth in popularity of the Internet, exposure to DTC advertisements on the Internet appears to have increased substantially, from 9 percent in 1999 to 16 percent in 2002. Patient recollection of brick-and-mortar placement of advertisements directly to consumers reveals that we should not limit our thinking to more traditional modes of DTC advertising. Although television and magazines remain the dominant source of DTC exposure, sponsors use other media options, such as Internet and point-of-sale locations. Including office pamphlets and direct mail, advertising media have been and continue to be creative and varied. Nevertheless, we believe a focus on the most widespread exposure will bring us important information about the influences of DTC advertising in general and on the doctor-patient relationship specifically. Moreover, most of our questions did not specify the source of the DTC advertisement, but instead focused on the result of that exposure. Beyond the existence of DTC advertising itself, patients appear to have a generally good idea of what components comprise a DTC advertisement. For example, over 85 percent of patients indicated that they saw DTC advertisements with information about “the benefits of the drug,” “the condition the drug treats,” “who should not take the drug,” “risks and side effects,” and “how to get more information.” These high levels suggest that people may have created schemas, or organizational guides (Fiske & Taylor, 1991) for recognizing DTC advertisements. They know the format of these advertisements and what to expect in each of them. Schemas in this context would appear to serve a positive function. For example, when viewing a quick presentation, a schema may increase the likelihood that a person could attend to desired information because they know to look for the specific information they want. However, this finding also makes the omission or minimization of certain
85

Attitudes and Behaviors Associated with DTC Promotion of Prescription Drugs information, such as risk information, especially troublesome, because if a person expects to see such information and it is not present, they are likely to believe that it does not exist or is unimportant. Although it is clear that DTC exposure is high, at least among individuals who have visited their doctor recently, the more noteworthy question is whether this advertising increases awareness of medical conditions and available treatments. In our surveys, both patients and physicians agreed that, as a whole, DTC advertising increases the public’s awareness of new drug treatments. Although fewer patients agreed with this statement in 2002 compared with 1999, 77 percent of patients in 2002 still thought this was the case. This finding is one of the clearest and strongest results from our study. The physician survey also asked physicians how they think DTC exposure has influenced awareness levels. Most doctors (72%) indicated that DTC advertisements increase patient awareness of potential treatments either "a great deal" or "somewhat." This finding is consistent with the survey findings of patient awareness. Fewer that half of doctors (44%), however, indicated "a great deal" or "somewhat" that DTC advertisements cause patients to become aware of problems earlier. Furthermore, 21 percent of doctors indicated that DTC advertisements do not increase patient awareness of problems earlier at all. Although fewer than half of doctors responded that DTC advertisements cause earlier awareness of problems, 44 percent (8% "a great deal" and 36% "somewhat") remains a substantial portion of physicians. Making patients aware of treatments earlier is a more difficult task than simply making them aware. As patients treat their conditions earlier, it is likely that further complications and larger future healthcare costs could be avoided. More detailed research on this issue is warranted to fully appreciate the meaning of this possibility. It is important to note that treatments and conditions were combined in our questions; we did not ask patients or physicians specifically whether they believe DTC advertising increases awareness about conditions, rather than treatments. One might assume that individuals learn about conditions along the way if they have a new awareness of treatments, but that may not be the case. Our questions may have been ambiguous as to the awareness of treatments in general versus branded treatments since so much of DTC advertising is branded. Nevertheless, our data show that among patients who asked about DTC advertised prescription drugs, the vast majority had the condition the drug treats. This issue is discussed in greater detail in the following section.
What actions does DTC advertising foster? In the initial stages of the healthcare decision process, information-seeking and question generation are two important activities that may be spurred by DTC advertising.
Information-Seeking In 2002 about 43 percent of patients indicated that a DTC advertisement had caused them to look for information about a drug or their condition. Although this represented a decline from 1999 (53%), it is still a substantial effect and suggests that DTC advertising is successfully reaching and motivating target audiences. Nearly 90 percent of those who sought additional information did so by consulting a doctor, consistent with DTC’s ubiquitous call-to-action of “ask your doctor.” Pharmacists were the second most frequently used source of information, mentioned by 50 percent of respondents, and nurses were mentioned by about 40 percent. Furthermore, 38 percent of patients indicated that they 86
Attitudes and Behaviors Associated with DTC Promotion of Prescription Drugs had sought drug and health information from a family member or friend. It is interesting to note that about 44% percent of these family members or friends had some degree of medical training. Finally, about a quarter sought information from a doctor other than their own doctor. Together, these data suggest that patients seek out a variety of appropriate individuals in response to DTC advertisements. As mentioned earlier, television was the leading source of exposure to DTC advertisements. FDA’s guidance on adequate provision for broadcast advertisements describes reference to a healthcare provider, a toll-free number, website, and a print advertisement (typically magazine) as one way to reach individuals seeking access to full product information. Our data indicate that about 15 percent of patients in 2002 (19% in 1999) called the toll-free telephone number in response to a DTC advertisement. Similarly, about 17 percent of patients reported looking for more information in magazines. The percentage of patients searching for more information on the Internet jumped from 18 percent (1999) to 38 percent (2002). It appears that a substantial portion of patients use these methods to gather information, consistent with the original intent of the adequate provision requirement. One of the components of a method of fulfilling the adequate provision requirement specifically addresses the concerns of consumers who value privacy and prefer to access health information through an anonymous source. Most sponsors do this by referring to a concurrently running print advertisement in a magazine, which contains the brief summary. The brief summary, the medical information listing all risks, side effects, and contraindications of the drug product located adjacent to the main body of the advertisement (21 CFR 202.1 [e][1]), has been the subject of debate regarding its usefulness to the lay public (e.g., Roberts, 2003; Schwartz, 2003; Woloshin, 2003). Patient use of the brief summary is an important issue since it represents an anonymous and relatively convenient means for consumers to acquire detailed drug information. Also, the brief summary permits the opportunity to study complex information in a self-paced manner. To assess patient use of the brief summary, it is necessary to distinguish patient use of the brief summary in general versus occasions where the brief summary is for a drug that is of particular interest to the individual. Our patient surveys found that the percentage of people reading half or more of the brief summary in general declined from 39 percent in 1999 to 27 percent in 2002, whereas the percentage of people reading none of the brief summary increased from 31 percent in 1999 to 41 percent in 2002. Thus, in 2002, more than 70 percent of patients who had visited their doctor recently read less than half of the brief summary, and many of these people read none of it at all. Considered alone, these figures might suggest that consumers do not find the brief summary useful. The picture changes, however, when we look at motivated readers. In 2002, patients were asked how much of the brief summary they read when they saw a DTC advertisement for a drug that especially interested them. About 45 percent reported that they read "all" or "almost all" of the brief summary. Patients who had seen a drug that especially interested them were also asked how easy or difficult the brief summary was to read. Over half the respondents reported that it was hard to read; 40 percent described it as easy to read. Our findings suggest that even though many people find the brief summary difficult to read, a significant portion still make an attempt to use it. Almost half read the brief summary when it is for a drug that is of interest to them. Although substantially below the level of reading for the main advertisement (78%), the percentage using the brief summary is still noteworthy. Rate of use should improve if the information is presented in consumer friendly formats and language in place of the medical and legal jargon found presently in many, if not most, brief summaries.
87

Attitudes and Behaviors Associated with DTC Promotion of Prescription Drugs In addition to knowing where people look for additional information, it is also useful to consider what they look for in response to seeing or hearing a DTC advertisement. In 2002, 61 percent of people reported looking for additional information about side effects. The topic of drug interactions was the next most often cited information sought (17%). This compares with a much smaller percentage of respondents who indicated a search for information regarding benefits of the drug (10%), whether it is appropriate for the patient (10%), and effectiveness (10%). The difference in patient information-seeking regarding risks and benefits may reflect differences in how these topics are described in DTC broadcast advertising. For example, the clarity of the benefit and risk information presented in a 30-second time frame may differ. In many instances, benefit information may be simply and easily presented whereas risk information may be described in a more complex manner. A list of easily understood negative consequences may seem to contradict the sponsor’s attempt to advertise the product in a manner that is most likely to generate sales. Another difference intrinsic to the information itself could also explain the risk/benefit information-seeking discrepancy. It is possible that benefits and side effects may be conveyed differently due to realistic differences, independent of sponsor intentions. For example, the content of benefit and risk information may be fundamentally different. Benefits may be conveyed simply because this information is easy to communicate. Warnings and side effects, on the other hand, may be intrinsically difficult to convey because they generally contain probability information, with which people have demonstrated difficulty (e.g., Halpern, Blackman, & Salzman, 1989). It has been argued that benefit information could also be presented in terms of probability (Woloshin, Schwartz, & Welch, 2004). Although we do not have data to test these explanations for the observed differences in search behavior, we do have data on consumer and doctor perceptions regarding how adequately risks and benefits are conveyed. Both patients and doctors reported their opinions that DTC advertisements overstate drug efficacy and do not present a fair balance of benefit and risk information. Further research should investigate the role of information communication in the presentation of DTC advertised drugs. Without this information, however, our patient and physician opinion questions suggest that the presentation of benefit and risk information is perceived to be unbalanced.
Question Generation The previous section described the information-seeking behaviors patients report in response to a DTC advertisement. As noted, when motivated to look for additional information, most people seek information from their primary care physicians, although very few (4%) indicated that a DTC advertisement caused them to initiate a separate doctor visit in response to the advertisement. The influence of DTC advertising may be more evident in its ability to shape patient discussions with the physician. About a third of patients reported that a DTC broadcast advertisement was the source of a question for the doctor. This percentage is about the same as those who reported friends or relatives as sources of questions and greater than the percentage who reported television news, print news articles, or personal experience as sources of questions. Generating questions may be viewed positively or negatively. Prior research has established that greater patient involvement in healthcare may lead to better health outcomes (e.g., Golin, DiMatteo, Duan, Leake, & Gelberg, 2002; Say & Thomson, 2003). It is reasonable to assume that question generation is an important part of patient involvement. From the patient viewpoint, therefore, it is difficult to imagine how question generation could be a negative result of DTC advertising. It seems 88

Attitudes and Behaviors Associated with DTC Promotion of Prescription Drugs
that any outside influence that encourages patient interaction and involvement in healthcare has positive implications. On the other hand, physicians might assert that additional question generation wastes time, particularly if they must answer questions about drugs unrelated to presenting conditions. If this were the case, DTC advertising would likely frustrate doctors, possibly affecting the doctor-patient relationship. Doctor and patient opinions about their interactions, therefore, become key assessments of whether this aspect of DTC advertising is good or bad. We do not see strong evidence that extra questions stemming from DTC advertisements have negative consequences. For example, when given the opportunity to provide open-ended responses, only about 7 percent30 of physicians overall cited as a problem the time needed to correct misunderstandings from DTC advertisements. Another potential outcome of question generation is whether DTC advertising sparks questions about new medical conditions. Although we did not ask patients what drug or condition they talked about, we did ask whether they inquired about a new medical condition as a result of DTC exposure. The percentage of people claiming that they did so dropped from 27 percent in 1999 to 18 percent in 2002. Nevertheless, this finding shows that close to one in five patients reported having asked a healthcare provider about a new medical condition because they had been exposed to a DTC advertisement. This finding is impressive when considering people’s general reluctance to admit that advertising has any affect on their behavior (e.g., Walton, 1980). Moreover, marketing research suggests that it is difficult to show a dramatic effect of a particular advertisement on behavior (e.g., Wilke, 1990). Finally, we addressed the issue of cost from both an information-seeking and question-generating perspective. We found that few people (4%) reported looking for cost information when they were motivated to search for additional information as a result of DTC exposure. Recall that 61 percent looked for side effect information and 10 percent looked for effectiveness information. We also found that 63 percent of patients reported rarely or never asking questions or having discussions with their doctor about the cost of treatment. This suggests that other factors may mediate the issue of cost in the doctor-patient relationship. A number of alternative explanations could explain our findings, including that (1) DTC advertising does not prompt respondents to look for cost information, (2) healthcare providers are not viewed by respondents as sources for this type of information, (3) issues of diagnosis take precedence in the limited time patients have with their doctors, (4) respondents have a sense of fatalism about cost (i.e., not aware of available lower cost alternatives, therefore cost is not a controllable variable), (5) cost is not an issue at the point of information search or information acquisition, or (6) possible embarrassment. Also, note that our data were collected before the re-importation of drugs became a newsworthy topic. More detailed follow-up research is necessary to investigate these possible alternatives.
Does DTC affect the doctor-patient interaction and, if so, how? DTC advertising is different from other forms of advertising because although these advertisements are aimed at patients, only the physician can prescribe the drug, thereby making it possible for patients to buy the product. The learned intermediary is not only a source of information but also a product source. As a result of this unique situation, DTC advertising has the potential to alter the doctor-patient relationship. The present section explores how our data address several aspects of DTC advertising’s influence on the doctor-patient interaction.
89
30 This percentage is 41 percent of the 18 percent of physicians who indicated that the patient’s exposure to DTC advertising created problems.
Attitudes and Behaviors Associated with DTC Promotion of Prescription Drugs
Magnitude of DTC-Motivated Doctor Visit Some people have expressed concern that DTC advertising may increase the number of unnecessary doctor visits, thus potentially increasing healthcare costs (e.g., Mintzes, et al., 2003). We saw no evidence of increased visits as a result of DTC advertising in our data. Few patients (only 4%) reported that DTC advertising motivated their physician visits. On the contrary, most people reported that health reasons prompted their visits. For example, they reported that they saw a doctor because they had a previous condition, they had not been feeling well, or they had a sudden symptom or illness. These are normal health reasons that would be expected to prompt physician visits.
Feelings about DTC in a Specific Doctor-Patient Interaction In both the patient and physician surveys, respondents were asked questions about a specific recent interaction as well as questions about their general opinions of DTC advertising. The questions in the current section address patients’ and physicians’ recall of a specific medical encounter and how they felt DTC advertising influenced these encounters. Later sections will address more global opinions. Our research shows that, for the most part, patients feel comfortable asking questions about DTC-advertised drugs. We asked in 2002 how likely they would be to talk to their doctor about a prescription drug if they saw an advertisement for one that treats a condition that they had. Seventy-five percent reported that they would be very or somewhat likely to discuss the drug, whereas 25 percent reported that they would be unlikely to discuss this drug. This 25 percent could reflect patients who believe in the authority of the doctor and prefer that he or she direct their interaction. Conversely, this 25 percent could represent individuals who do not feel comfortable asking their doctor about advertised drugs, either because they are generally bashful, they do not trust the source of the information, they fear their doctor’s reaction, or some other reason. Further research on individual differences among patients could garner valuable findings. Regardless of this portion of the population, the majority of people indicated their willingness to discuss advertised drugs with their healthcare providers. This general comfort with asking questions is reflected in patient perceptions of the doctor’s reaction to questions about DTC advertising. Over 90 percent of those who asked such questions indicated that their doctor welcomed their questions, and a large majority reported that their doctors discussed the drug with them and reacted to the question “as if it were an ordinary part of the visit.” Only 3 percent of respondents perceived that their doctors seemed to become angry or upset in response to the question. Note that this question was answered only by a subset of the sample who asked about an advertised prescription drug. It is possible that patients who asked questions were among the more extroverted, confident, and/or knowledgeable individuals. We also asked physicians directly about their reactions to specific instances where a patient asked a question about an advertised drug. The majority of physicians agreed (73%) that because of DTC advertising, the patient asked thoughtful questions. They were more equivocal, however, when asked whether their patient’s exposure to DTC advertising increased the usefulness of their time together. In this case, 45 percent of physicians agreed, whereas 35 percent disagreed. Although these responses are more variable, a substantial portion of physicians thought that usefulness of time was increased. Moreover, note that we cannot assess whether the 35 percent who disagreed that usefulness was increased thought it decreased or simply remained the same. 90

Attitudes and Behaviors Associated with DTC Promotion of Prescription Drugs
Requesting Behaviors and Pressure to Prescribe Patient requesting behavior did not differ between 1999 and 2002, so we focus here on the most recent (2002) findings. Twenty-three percent (23%) of patients reported that they had asked their physician if there was a prescription drug in general to treat them. Of this group, approximately 29 percent asked about a specific brand. Looking at this another way, approximately 7 percent of patients who visited their doctor in the last 3 months asked about a specific brand of prescription drug. We also asked physicians to tell us whether their patients asked about prescription drugs. Eighty-five percent (85%) reported that their patients asked about prescription drugs frequently ("all the time" or "often"). In comparison, only 62 percent reported that their patients asked frequently about generic drugs. Although these figures may seem to contradict the much lower patient figures, the findings confirm our sample selection process. Recall that we selected physicians who would be likely to encounter DTC questions: general practitioners and specialists who see conditions treated by drugs frequently advertised to consumers. The patient sample had no such restrictions. Eighty-six percent of physicians reported that a recent patient who asked about a prescription treatment asked about a specific drug by brand name. Of this group, 88 percent reported that their patients had the condition that the discussed drug treats. This finding suggests an understanding of the drug’s indication among people who ask about an advertised drug. Again, we have no way of assessing such understanding of patients who did not ask about drugs. Perhaps those who are unsure about the product are more likely to refrain from discussing the drug with their physician. Fewer physicians reported that a patient asked for a prescription product. In this case, 52 percent of physicians reported that the patient had asked for a prescription in general, and 65 percent of the physicians reported providing a requested prescription. Of the patients who asked for a prescription treatment, 59 percent of them specifically requested a brand name drug. In this case, 57 percent of the physicians prescribed the requested brand. Patients who asked for prescription drugs did not always receive them. According to the patient surveys, approximately 49 percent of patients who asked about a prescription drug received it. An almost equal percentage reported advice from their physicians to change their lifestyle or behavior (41%), and a somewhat smaller percentage (34%) reported a recommendation for a different prescription drug. Primary care physicians were most likely to refuse a request for a prescription because a different drug was more appropriate for the patient, a less expensive drug was available, or the drug was not appropriate for the patient. Specialists were most likely to refuse a request because a different drug was more appropriate, the drug was not right for the patient, or the drug had side effects of which the patient was not aware. How easy is it for physicians to provide these refusals, however? We asked primary care physicians and specialists to report how much pressure they felt in the interaction with a recent patient who initiated a discussion about an advertised drug. Fifty-three percent (53%) reported no pressure at all. Of those who reported pressure, primary care physicians reported more than specialists reported. Although a little more than half of physicians did not report any pressure, primary care physicians and specialists reported more pressure to prescribe when patients asked them for a prescription drug or for a specific brand as opposed to asking about prescription treatment in general. However, the vast majority (91%) of physicians reported that the patient did not try to influence the interaction in a way that would have been harmful to the patient. Note that pressure to prescribe is a sensitive topic and doctors may not be willing to admit this kind of influence. 91

Attitudes and Behaviors Associated with DTC Promotion of Prescription Drugs These findings have positive and negative implications. First, it may be only natural for healthcare providers such as doctors to satisfy their patients’ wishes when appropriate. Remember that 88 percent of physicians said that patients who asked questions about DTC drugs actually had the condition the drug treats. If requests are logical and relevant, perhaps there is no reason for doctors to refuse such a request and this may reflect the pressure physicians report. It is important to note, however, that when asked their general opinions about DTC, substantial percentages of physicians reported that patients want advertised drugs over any others and over less expensive treatments, and that patients ask for unnecessary prescriptions. Therefore, although requests may be appropriate in terms of having the condition the drug treats, there may be other aspects of the requests that are troubling to physicians. Again, it is important to note that the findings in this section do not directly connect DTC to behaviors. To approach this connection, we limited our sample in these questions to patients who have seen a doctor recently and who have been exposed to DTC advertising. Likewise, we asked doctors to respond while thinking about patients who had initiated questions about DTC advertisements. Although this may indicate some sort of relationship to DTC advertising, we asked no direct causal questions and have no parallel data from interactions that did not involve a conversation about a drug that had been initiated by a DTC advertisement. Nevertheless, from a public health perspective, our results suggest that in the current DTC environment, physicians generally believe patients ask reasonable questions and patients believe physicians respond appropriately.
What are patients’ and physicians’ general opinions about DTC? In the previous sections, the frame for questions and analyses was a single, recent interaction between patient and physician. As such, these questions and answers provide a snapshot description of the nature and extent of the dialogue and activities occurring between patients and physicians, and, in the case of the patient data, an assessment of changes from 1999 to 2002. In the current section, the frame of reference is broader—patient and physician opinions of DTC advertising in general. These opinions provide a helpful gauge of how DTC advertising affects these two important constituencies and, in turn, how DTC advertising may affect their interactions. Compared with 1999, patients’ attitudes in 2002 are dramatically less positive. No longer do a majority have a positive opinion of DTC advertising. In 2002, 32 percent agreed with the statement “I like seeing advertisements for prescription drugs,” and 43 percent disagreed. These numbers represent a 20-point decline from the 52 percent level of agreement in 1999. This decline in overall attitude appears to carry over into other patient beliefs about DTC advertising, including beliefs about the ability of DTC advertising to build awareness of new treatments, an activity that the majority of patients (and doctors) see as a positive contribution. In 2002, about 77 percent of patients indicated that DTC advertising “helps make me aware of new drugs”; this is down from 86 percent in 1999. Note, however, that despite this drop, the absolute level remains high. Physician sentiments are similar. In 2002 most physicians (72%) expressed the belief that DTC advertising makes their patients aware of new treatments. Although not a majority, many physicians (about 44%) indicated that DTC advertising helped their patients become aware of problems earlier. Perhaps more important, fewer patients in 2002 said that DTC advertising was useful in terms of their interaction with their doctor and their healthcare decision making. Specifically, fewer patients indicated that DTC advertising (1) helps them “have better discussions with my doctor” (from 62% 92

Attitudes and Behaviors Associated with DTC Promotion of Prescription Drugs
agreement in 1999 to 43% in 2002); (2) provides them with enough information to decide “whether I should discuss the drug with my doctor” (70% agreement in 1999; 58% in 2002); and (3) helps them “make better decisions” about their healthcare (47% agreement in 1999; 32% in 2002). Although a significant number of patients still regard DTC advertising as supportive of interaction with their physician, the decline represents a potentially troublesome change.31 The physician data do not permit a determination of whether a similar decline in perceptions has occurred among physicians. Nevertheless, in 2002, 56 percent indicated that DTC advertising causes patients to ask better questions, either " great deal"(10%) or "somewhat"(46%). About 51 percent indicated that it also led to better discussion about health, either " great deal"(12%) or "somewhat"(39%), and about 58 percent indicated that DTC advertising caused their patients to be more involved in their healthcare, either "a great deal" (11%) or "somewhat" (47%). Patient views regarding the usefulness of DTC advertising may reflect their views of how well DTC advertising conveys risk more than how well it conveys benefit information. Recall from prior discussion that information concerning side effects and risks was the topic most frequently sought out by patients who looked for additional information in response to a prescription drug advertisement. This search behavior is consistent with physicians’ view that their patients understand drug benefit information better than risk information (18% rated patient understanding "very well" and 60% "somewhat" for benefits versus 5% "very well" and 35% "somewhat" for risks).32 These findings are important since physicians serve both as the primary source of information for patients and as another measure of patients’ understanding. About 60 percent of patients in both years said that advertisements do not give enough information about possible risks. In contrast, 47 percent rated DTC advertising as “not providing enough benefit information,” and those who did were less adamant. Several issues make it difficult to fully assess how well DTC advertising conveys drug benefit information. Patients search for risk more than benefit information and doctors rate patient understanding of benefits higher than risks. Yet 44 percent of patients indicate that not enough benefit information is presented in DTC advertisements. Perhaps it isn’t the extent, but the nature of the benefit information provided that is the concern here. It is possible that patients believe that DTC advertising does not provide useful comparative efficacy data, or that the data presented is not understandable, or that patients think mostly of reminder advertisements. These interpretations were not addressed specifically in the patient and physician surveys and are topics for further investigation. Another input into evaluating the adequacy of benefit information in DTC advertising is whether advertisements exaggerate drug efficacy. Over half of patients believe that DTC advertisements make drugs seem better that they are. Physicians are even stronger in this belief. About 75 percent of doctors believe at least "somewhat" that DTC makes their patients think advertised drugs work better than they actually do. Thirty percent of these doctors believe this "a great deal." A substantial portion of doctors (65%) also agreed that DTC advertisements cause patients to confuse the relative risks and benefits of the drug. This finding raises the possibility that perhaps precaution and safety concerns may be confused with benefit claims that appear in drug advertisements. Note also that about 70 percent of physicians rated their patients’ understanding of the limitations of efficacy of advertised drugs as poor (i.e., understand the limitations of the drug’s efficacy "not at all" (25%) or "only a little"
31 It is important to note that patients do not believe that DTC advertising minimizes the role of the physician. By a 3:1 majority, patients felt DTC advertising did not make it seem like a doctor is not needed to decide whether a drug was right for them.
93
32 Physicians also rated highly patient understanding of prescription status and indication.

Attitudes and Behaviors Associated with DTC Promotion of Prescription Drugs (45%)). This finding is in sharp contrast to high ratings of their patients’ understanding of “possible benefits and positive effects” (not at all (3%) or only a little (19%)). It has been suggested that consumers maintain a healthy skepticism of the benefit information presented in DTC advertisements (e.g., Calfee 2002). However, the physician data suggest that many doctors believe their patients are misled, or at least confused, by DTC advertisements. They also question how well their patients understand the limitations of drug efficacy and believe that their patients confuse basic information such as risks and benefits. Although perceptions that advertisers may exaggerate product benefits are hardly surprising given the characteristics of product advertising in general, misconceptions of benefits vis-à-vis risks may result in serious consequences in the context of prescription drug advertising. Moreover, given patient and doctor beliefs of inadequate delivery of risk information, the exaggerated portrayal of benefit information becomes more disturbing. Some have suggested that risk information scares people away from using advertised prescription drugs (e.g., Gallagher & Kunkel 2003) and may have negative consequences for hard-to-reach groups of sufferers. We have no direct data on this issue. Nevertheless, one of our questions indirectly addresses this suggestion. In 2002, we asked physicians if DTC advertising increases anxiety about side effects or diseases; about 73 percent disagreed. Only 12 percent of physicians indicated that DTC advertising creates anxiety about potential disease. and 15 percent indicated that it creates anxiety about potential side effects. Thus, risk information does not appear to cause undue alarm or anxiety about possible side effects or possible diseases. Indeed, patient data discussed previously strongly suggest that patients seek out information about risks and concerns. This finding supports the view that improved communication of risk information may increase the usefulness of DTC advertising.
Limitations and Future Research No single set of surveys can hope to answer all of the questions relevant to the influence of DTC advertising on the public health. Even investigating the narrow topic of the doctor-patient relationship is constrained by the limitations of survey research. We discuss some limitations in the current section. Although the patient surveys included questions about recognition of various aspects of the content of DTC advertising, there were no measures of comprehension. Note that recognition does not equal understanding. Simply acknowledging that DTC advertising contains risk information is not the same as understanding those risks. This is supported by the physician survey results. Whereas patients reported recognizing benefits and risks at about the same rate, physicians believe their patients understand the benefits much better than the risks. There is a paucity of data on comprehension of DTC advertising (but see Kaiser, 2001). Research on particular advertisements and patients’ comprehension of various pieces of information within those advertisements would provide a timely compliment to the data we have reported here. Specifically, knowledge tests of risk and benefit information for a variety of drugs with a variety of risk profiles would shed light on the way consumers and patients actually process these advertisements. Although no one research study could completely describe patient comprehension of DTC advertising in general, a body of data developed on various advertisements, television, print, and otherwise would gauge patient understanding of advertisements as they currently exist. By the same token, the patient surveys provide data on how much of the brief summary patients will read when interested in the drug and how easy or difficult it is to read that information, but does not 94

Attitudes and Behaviors Associated with DTC Promotion of Prescription Drugs provide information on how much of the brief summary patients actually understood. At the time the surveys were conducted, few brief summaries were written in consumer-friendly language, so it is likely that comprehension was not optimal. Additionally, we did not measure understanding in the portion of respondents who claimed to have read at least parts of it. We included questions on the brief summary as part of our comprehensive look at DTC advertising and the doctor-patient relationship and found interesting data that warrant further study. FDA will conduct research on the brief summary in the near future. Another limitation of the current surveys, albeit necessary, is their level of detail. Because these were some of the first research studies conducted on the issue of DTC and the doctor-patient interaction, we chose to ask general questions. The broad and exploratory nature of the project precluded fine discriminations. With the benefit of our relatively general surveys, we see several avenues for further exploration. First, we did not address the target of the advertisements. For example, sufferers and nonsufferers may differ in their perceptions of ads for certain conditions and the advertisements themselves may differ in important ways depending on the condition targeted. Conditions may be symptomatic or asymptomatic, drugs may be medically necessary or optional (lifestyle drugs), and the amount of risk involved may be low or high. Furthermore, implications for the doctor-patient relationship may differ depending on an interaction of the disease and the class of drug advertised. Additionally, although we found no stable demographic differences among patients, advertisements targeted at particular sexes, ethnic groups, or age groups may differ. Also, we did not establish definitively the medium of DTC exposure (e.g., television versus print) other than to ask where patients had been exposed to it at the beginning of the surveys. It is possible that broadcast ads may influence patients differently than print ads. More likely, differences may emerge between mainstream advertising sources such as television and magazines, and more targeted advertising campaigns, such as pamphlets at physician offices and point of sale locations and use of the Internet. We did not ask patients or physicians for their opinions of these specific sources. Finally, patients reported the highest levels of awareness of television advertisements, and these advertisements arguably reach the widest audiences. However, the surveys did not distinguish among product claim, reminder, and help-seeking advertisements. Given the average consumer’s unawareness of the distinctions among the types of advertisements, it is likely that they combined any and all DTC advertisements they had seen when responding to questions. It is possible, however, that consumers can distinguish between different types of advertisements. For example, they may dislike reminder advertisements because they do not know what they are for, but find product claim advertisements useful. By combining types of advertisements, our general findings may mask important differences related to different advertising forms. Research directly examining reactions to each type of DTC broadcast advertisement would fill a current void in the literature. Two methodological issues must be considered in reflecting on our data. The first is simply a reminder that surveys provide descriptive, but not explanatory, data. We used national samples that allowed us to detect attitude changes between 1999 and 2002 and areas where physicians and patients agree. We are unable, however, to delineate the causes of such attitudes or changes. The purpose of our research was to provide information about how patients and physicians feel about DTC advertising and how it influences their relationship. Experimental research can explore the causes of these findings. Furthermore, each patient survey was a cross-sectional snapshot in time. We cannot make conclusions about how specific individuals change over time. Additionally, with only two points in time, trends
95

Attitudes and Behaviors Associated with DTC Promotion of Prescription Drugs cannot be established. It is unclear from our data whether opinions about DTC advertising are on a downward swing or whether we captured two randomly divergent points that will correct themselves over time. Only a third collection of data would determine whether our data indicate a trend. Finally, we recognize that a large part of our physician survey, focusing on a recent specific encounter, contains unknown sampling biases. Remember that we asked physicians to recall the most recent patient encounter in which the patient discussed a DTC-advertised prescription drug. Because this instruction invoked a retrospective recall task, we cannot rule out biases in the content of the physicians’ memories. Especially vivid or salient patients or encounters may be recalled by physicians more readily than more mundane visits (e.g., Tversky & Kahneman, 1973). For example, a consumer who was vehemently opposed to drug advertising or one who was enthusiastically supportive may easily come to mind. Other characteristics unrelated to DTC advertising, such as obnoxious or particularly attractive patients, may also skew the recall of physicians. A prospective study could address this unknown bias. In such a design, doctors would be asked to call the researcher as soon as their next patient discussed DTC advertising (see, for example, Allison-Ottey et al., 2003; Thumma 2003). If the interview happened then, we could be relatively certain that memory selection biases would not be present. Given our constraints, however, we approached the topic as reasonably as possible and acknowledge that we have an unknown sampling bias. We encourage future research on all aspects of potential DTC influence. The relationship between patients and physicians is essential for the proper dissemination of prescription drugs. Any influence that DTC advertising has on this special interaction may have implications for healthcare on a widespread basis. Research on DTC influence in other arenas of healthcare provision is welcomed as well, such as compliance, health education, and caregiving.
96

Attitudes and Behaviors Associated with DTC Promotion of Prescription Drugs
REFERENCES Aikin, K.J., Swasy, J.L., Amsbary, T., and Seaver, W.B. (2003). The Effects of Incentive Level and
Endorsement Letter on Physician Response Rate to a Telephone Survey of Attitudes Toward Direct-to-Consumer Promotion of Prescription Drugs. Working paper.
Allison-Ottey, S.D., Ruffin, K., and Allison, K.B. (2002). “To do no harm” survey of NMA
physicians regarding perceptions on DTC advertisements. Journal of the National Medical Association, 94(4), 194- 202.
Allison-Ottey, S.D., Ruffin, K., Allison, K., and Ottey, C.C. (2003). Assessing the impact of direct-to-
consumer advertisements on the AA patient: A multisite survey of patients during the office visit. Journal of the National Medical Association, 95(2), 120-131.
Baron, R. M. and Kenny, D. A. (1986). The moderator-mediator variable distinction in social
psychological research: Conceptual, strategic, and statistical considerations. Journal of Personality and Social Psychology, 51, 1173-1182.
Bell, R.A., Wilkes, M.S., & Kravitz, R.L. (1999). Advertisement-induced prescription drug requests:
Patients’ anticipated reactions to a physician who refuses. Journal of Family Practice, 48, 446-452.
Bero, L.A. and Lipton, S. (2001, May). Methods for studying the effects of direct to consumer
pharmaceutical advertising on healthcare outcomes and health services utilization. Paper presented at Assessing the Impact of Direct-to-Consumer (DTC) Advertising on Health Care Use, Costs, and Outcomes: An Examination of Methodological Issues, Opportunities, and Strategies. Office of the Assistant Secretary for Planning and Evaluation, Department of Health and Human Services: Washington, DC.
Berry, S.H. and Kanouse, D.E. (1987). Physician response to a mailed survey: An experiment in
timing of payment. Public Opinion Quarterly, 51, 102-114. Calfee, J.E. (2002). What do we know about direct-to-consumer advertising of prescription drugs?
Health Affairs, p. W3 116-119 (web exclusive), Feb. 26. http://content.healthaffairs.org/webexclusives/index.dtl?year=2003. Last accessed January 13, 2004.
Calfee, J.E., Winston, C., & Stempski, R. (2002). Direct-to-consumer advertising and the demand for
cholesterol-reducing drugs. Journal of Law and Economics, 45, 673-690. Diaz, J.A., Griffith, R.A., Ng, J.J., Reinert, S.E., Friedmann, P.D., & Moulton, A.W. (2002).Patients’
use of the Internet for medical information. Journal of General Internal Medicine, 17(3), 180-185. Donaldson, G.W., Moinpour, C.M., Bush, N.E., Chapko M., Jocom J., Siadak M., Nielsen-Stoeck M.,
Bradshaw J.M., Bichindaritz I., and Sullivan K.M. (1999). Physician participation in research surveys: A randomized study of inducements to return mailed research questionnaires. Evaluation and the Health Professions, 22(4), 427-444.
97

Attitudes and Behaviors Associated with DTC Promotion of Prescription Drugs Dubois, R.W. (2003, September). Pharmaceutical promotion: Perhaps don’t throw the baby out with
the bath water. Paper presented at the FDA Public Meeting on DTC Advertising, Washington, DC.
Fiske, S.T., & Taylor, S.E. (1991). Social Cognition (2nd Ed.). New York: McGraw-Hill. Fox, S., & Fallow, S. (2003). Internet Health Resources: Health searches and email have become
more commonplace, but there is room for improvement in searches and overall Internet access. Washington, D.C.: Pew Internet and American Life Project. http://www.pewinternet.org/reports/pdfs/PIP_Health_Report_July_2003.pdf. Last accessed February 17, 2004.
Fox, R.J., Crask, M.R., and Kim, J. (1988). Mail survey response rate: A meta-analysis of selected
techniques for inducing response. Public Opinion Quarterly, 52, 467-491. Gardner, D.M., Mintzes, B., & Ostry, A. (2003). Direct to consumer prescription drug advertising in
Canada: Permission by default? Canadian Medical Association Journal, 169, 425-427. Gallagher, R.M., & Kunkel, R. (2003). Migraine medication attributes important for patient
compliance: Concerns about side effects may delay treatment. Headache: The Journal of Head and Face Pain, 43, 36-45.
Golin, C., DiMatteo, M.R., Duan, N., Leake, B., & Gelberg, L. (2002). Impoverished diabetic
patients whose doctors facilitate their participation in medical decision making are more satisfied with their care. Journal of General Internal Medicine, 17, 866-875.
Golodner, L.F. (2003, September). Consumer-directed promotion public meeting: Docket no. 2003N-
0344. Paper presented at the FDA Public Meeting on DTC Advertising, Washington, DC. Gunn, W.J. and Rhodes, I.N. (1981). Physician response rates to a telephone survey: Effects of
monetary incentive level. Public Opinion Quarterly, 45, 109-115. Halpern, D.F., Blackman, S., & Salzman, B. (1989). Using statistical risk information to assess oral
contraceptive safety. Applied Cognitive Psychology, 3, 251-260. IMS Health (2003). Integrated Promotional Services, U.S. Pharmaceutical Prescription Market. IMS
Health: Plymouth Meeting, PA. Kaiser Family Foundation (2001, November). Understanding the effects of direct-to-consumer drug
advertising. Menlo Park, CA. Kasprzyk, D., Montano, D.E., St. Lawrence, J.S., and Phillips, W.R. (2001). The effects of variations
in mode of delivery and monetary incentive on physicians’ responses to a mailed survey assessing STD practice patterns. Evaluation and the Health Professions, 24(1), 3-17.
Kellerman, S.E. and Herold, J. (2001). Physician response to surveys: A review of the literature.
American Journal of Preventive Medicine, 20(1), 61-67.
98

Attitudes and Behaviors Associated with DTC Promotion of Prescription Drugs Martin, W.S., Duncan, J.W., & Sawyer, J.C. (1984). The interactive effects of four response rate
inducements in mail questionnaires. College Student Journal, 18(2), 143-149. Mintzes, B., Barer, M.L., Kravitz, R.L., Bassett, K., Lexchin, J., Kazanjian, A., Evans, B., Pan, R., &
Marion, S. (2003). How does direct-to-consumer advertising (DTCA) affect prescribing? A survey in primary care environments with and without legal DTCA. Canadian Medical Association Journal, 169, 405-412.
Mintzes, B., Barer, M.L., Kravitz, R.L., Kazanjian, A., Bassett, K., Lexchin, J., Evans, R.G., Pan, R.,
& Marion, S.A. (2002). Influence of direct to consumer pharmaceutical advertising and patients’ requests on prescribing decisions: Two site cross sectional study. British Medical Journal, 324, 278-279.
Prevention Magazine (2001). International Survey on Wellness and Consumer Reaction to DTC
Advertising of Prescription Drugs. Emmaus, PA: Rodale, Inc. Roberts, M. (2003, September). Alternatives to the “brief summary.” Paper presented at the FDA
Public Meeting on DTC Advertising, Washington, DC. Say, R.E., & Thomson, R. (2003). The importance of patient preferences in treatment decisions—
challenges for doctors. BMJ: British Medical Journal, 327, 542-545. Schwartz, L. (2003, September). Effects of a prescription drug benefit box on the public’s assessment
of drug efficacy. Paper presented at the FDA Public Meeting on DTC Advertising, Washington, DC.
Singer, E., Groves, R.M., and Corning, A.D. (1999). Differential incentives: Beliefs about practices,
perceptions of equity, and effects on survey participation. Public Opinion Quarterly, 63, 251-260.
Singer, E., Van Hoewyk, J., and Maher, M.P. (1998). Does the payment of incentives create
expectation effects? Public Opinion Quarterly, 62, 152-164. Singer, E., Van Hoewyk, J., and Maher, M.P. (2000). Experiments with incentives in telephone
surveys. Public Opinion Quarterly, 64, 171-188. Spry, V.M., Hovell, M.F., Sallis, J.G., Hofsteter, C.R., Elder, J.P., & Molgaard, C.A. (1989).
Recruiting survey respondents to mailed surveys: controlled trials of incentives and prompts. American Journal of Epidemiology, 130(1), 166-172.
Tambor, E.S., Chase, G.A., Faden, R.R., Geller, G., Hofman, K.J., and Holtzman, N.A. (1993).
Improving response rates through incentive and follow-up: The effect on a survey of physicians’ knowledge of genetics. American Journal of Public Health, 83, 1599-1603.
Thumma, C. (2003, September). DTC advertising and doctor-patient interactions. Paper presented at
the FDA Public Meeting on DTC Advertising, Washington, DC. Time, Inc. (1999). Direct-to-Consumer Advertising Discussion: Advertising Trends and Research
Study. New York: Time, Inc.
99
Attitudes and Behaviors Associated with DTC Promotion of Prescription Drugs Traugott, M.W., Groves, R.M., and Lepkowski, J.M. (1987). Using dual frame designs to reduce
nonresponse in telephone surveys. Public Opinion Quarterly, 51, 48-57. Tversky, A., & Kahneman, D. (1973). Availability: A heuristic for judging frequency and probability.
Cognitive Psychology, 4, 207-232. Walton, H. (1980). Ad recognition and prescribing by physicians. Journal of Advertising Research,
20, 39-48. Wilke, W.L. (1990). Consumer behavior (2nd Ed.). New York: Wiley and Sons. Woloshin, S. (2003, September). The public’s valuation and comprehension of a proposed
prescription drug benefit box.. Paper presented at the FDA Public Meeting on DTC Advertising, Washington, DC.
Woloshin, S., Schwartz, L.M., & Welch, H.G. (2004, April 28). The value of benefit data in direct-to-
consumer drug ads. Health Affairs, special online edition, available at: http://content.healthaffairs.org/cgi/content/full/hlthaff.w4.234v1/DC1.
100

Attitudes and Behaviors Associated with DTC Promotion of Prescription Drugs
APPENDIX A: Guidance for Industry on Consumer-Directed Broadcast Advertisements
(See stand alone Appendix A)
101

Attitudes and Behaviors Associated with DTC Promotion of Prescription Drugs
APPENDIX B.1: Patient Questionnaire Materials
1999 PATIENT SURVEY Attitudinal and Behavioral Effects of Direct-To-Consumer (DTC)
Promotion of Prescription Drugs
(See stand alone Appendix B.1)
102

Attitudes and Behaviors Associated with DTC Promotion of Prescription Drugs
APPENDIX B.2: Patient Questionnaire Materials
2002 PATIENT SURVEY Assessment of Physician and Patient Attitudes
Toward Direct-to-Consumer (DTC) Promotion of Prescription Drugs
(See stand Alone Appendix B.2)
103

Attitudes and Behaviors Associated with DTC Promotion of Prescription Drugs
APPENDIX B.3: Physician Questionnaire Materials
2002 PHYSICIAN SURVEY Assessment of Physician and Patient Attitudes
Toward Direct-to-Consumer (DTC) Promotion of Prescription Drugs
(See stand alone Appendix B.3)
104

Attitudes and Behaviors Associated with DTC Promotion of Prescription Drugs
APPENDIX C: SUPPLEMENTAL ANALYSES
(See stand alone Appendix C)
105

Attitudes and Behaviors Associated with DTC Promotion of Prescription Drugs
106
END NOTES
i Comparison of Problem Categories A more detailed analysis was conducted within this topic area to investigate which particular issues physicians considered more problematic, compared to others. These analyses used the five categories of problems described above to determine which particular issues were deemed most and least problematic for primary care physicians and specialists. To determine whether or not primary care physicians and specialists felt differently about each potential problem and from each other, we conducted a mixed-design repeated measures analysis of covariance (ANCOVA). We covaried the number of patients seen per week because primary care physicians and specialists differed on this dimension. Thus any effects we found from the analysis were independent of weekly patient volume. The five different categories of problems (e.g., exaggerated benefits) comprised the within-subjects variables, meaning that each physician in the survey answered all of these questions. The between-subject factor was physician subgroup (primary care physician vs. specialist). Consistent with the previous analyses, the ANCOVA revealed a significant difference in physician subgroup after controlling for patient volume (F[1, 497] = 9.17, p < .01). Even after holding the number of patients seen per week constant, primary care physicians perceived more potential problems overall than did specialists. The ANCOVA also showed a significant difference among the five different types of problems (F[3.62, 1798.55] = 31.41, p < .001). Because the assumption of sphericity was violated, (χ2 [9df] = 114.83, p < .001), the Huynh-Feldt correction was used in the analysis.

Attitudes and Behaviors Associated with DTC Promotion of Prescription Drugs
107
Perceived Problems of DTC Ads
Potential Problems
Dr-Patient Tensions
Seek Advertised Rxs
Seek Unnecessary Rxs
Create Anxiety
Exaggerated Benefits
Pos
<--
Atti
tude
s --
> N
eg
4.0
3.0
2.0
1.0
Specialization
Specialty
General
The analyses showed that physicians felt that the most significant problem with DTC advertising was it exaggerated the benefits of the advertised drugs. After this, they felt the most pressing problem was that patients sought unnecessary and advertised drugs, followed by DTC advertising creating unnecessary anxieties. Physicians rated Seeking Unnecessary Prescriptions and Seeking Advertised Drugs as equally problematic. Physicians in this sample were least concerned with the possibility that DTC advertising might add to doctor-patient tensions. There were no significant interactions between physician subgroup and type of problem (F[1,497] = .22, n.s.). Comparison of Benefit Categories Structurally, the same ANCOVA was conducted, with the five types of potential benefits included as within subject variables instead of the five types of potential problems. As expected, there were no differences between primary care physicians and specialists after controlling for patient volume (F[1, 497] = .18, n.s.). The ANCOVA showed that there was a significant difference among the different types of benefits (F[3.85, 1914.58] = 27.86, p < .001). Because the assumption of sphericity was violated (χ2
(9) = 54.83, p < .001), the Huynh-Feldt correction was used in the analysis.

Attitudes and Behaviors Associated with DTC Promotion of Prescription Drugs
108
Perceived Benefits of DTC Ads
Potential Benefits
Dr-Patient Interact
Extend Reach
Increased Compliance
Increased Involvemt
Increased Awareness
Neg
<--
Atti
tude
s --
> P
os
4.0
3.0
2.0
1.0
Doctor Type
General
Specialty
Specifically, physicians felt similarly about the possibility that DTC advertising would increase awareness, increase involvement, and improve the doctor-patient interaction. Note that this level is at the midpoint of the scale or below, however, indicating that physicians were only moderately convinced that DTC advertising would have these effects. They were even less sure that DTC advertising would increase compliance and extend their reach to hard-to-access patient populations, although their attitudes toward these two issues did not differ.