pasture intake, milk production and grazing behaviour of dairy cows grazing low-mass pastures at...
TRANSCRIPT
Livestock Science 137 (2011) 151–160
Contents lists available at ScienceDirect
Livestock Science
j ourna l homepage: www.e lsev ie r.com/ locate / l ivsc i
Pasture intake, milk production and grazing behaviour of dairy cows grazinglow-mass pastures at three daily allowances in winter
L.A. Pérez-Prieto, J.L. Peyraud, R. Delagarde ⁎a INRA, UMR1080, Production du lait, F-35590 Saint-Gilles, Franceb Agrocampus Ouest, UMR1080, Production du lait, F-35000 Rennes, France
a r t i c l e i n f o
⁎ Corresponding author. INRA, UMR1080, ProducSaint-Gilles, France.
E-mail address: [email protected] (R.
1871-1413/$ – see front matter © 2010 Elsevier B.V.doi:10.1016/j.livsci.2010.10.013
a b s t r a c t
Article history:Received 7 September 2010Received in revised form 27 October 2010Accepted 28 October 2010
Grazing low-mass pastures is almost inevitable when extending the grazing season into latewinter to reduce feed costs, cows' performance being potentially affected. An experiment wascarried out to estimate the performance, pasture intake (PI) and behavioural adaptation ofdairy cows when grazing low-mass pastures at LOW, MEDIUM and HIGH pasture allowances(PA), corresponding to 19, 32 and 46 kg OM/cow per day above ground level, respectively. Thestudy took place in the late winter of 2008 on good quality perennial ryegrass/white cloverpastures with a mean pasture mass and a pre-grazing platemeter height of 2.3 t OM/ha aboveground level and 5.8 cm, respectively. Each cow was supplemented with 4.4 kg OM of maizesilage and 2.0 kg OM of cereal concentrate. Daily time at pasture was restricted to 9 h betweenthe am and pm milkings. Eighteen midlactation Holstein cows (twelve multiparous and sixprimiparous) were used in a 3×3 orthogonal Latin square design with three consecutiveperiods of 13 days. On average, the cows produced 25.3 kg of milk and total OM intake was14.4 kg/d. Pasture OM intake averaged 7.9 kg/d and linearly increased from LOW to HIGH(+0.04 kg/kg PA). Similarly, milk production per cow (+0.09 kg/kg PA) and milk proteinconcentration (+0.04 g/kg per kg increase in PA) linearly increased with increasing PA. Milkfat concentration, on the other hand, decreased by 0.10 g/kg per kg increase in PA. The dailygrazing time (430 min) and the proportion of time spent grazing (79%)were not affected by PA.On average, pasture intake rate was low (19 g OM/min) and linearly increased from 16.9 g OM/min in LOW to 20.7 g OM/min in HIGH. In the present study, the PI was limited even at high PAbecause of the cumulative effect of the low-mass pasture (low intake rate) and the restrictedaccess time (short grazing time). Consequently, the effect of PA on PI was low. However, themilk production response to variations in PI was high because of the low energy balancerecorded in all treatments.
© 2010 Elsevier B.V. All rights reserved.
Keywords:Dairy cowPasture intakePasture allowanceLow-mass pastureGrazing behaviourWinter
1. Introduction
Efficiently grazed pasture is widely recognized as thecheapest source of nutrients for dairy cows. The higher theproportion of grazed pasture in the annual diet of dairy cows,the greater the economic efficiency potentially achieved indairy systems (Dillon et al., 2005). Extending the grazing
tion du lait, F-35590
Delagarde).
All rights reserved.
season to late winter is therefore an interesting practice toreduce feed costs. Winter grazing, however, implies grazingcows during periods of rain, low temperature and short daylength, the pasture availability being normally reduced due tolow pasture growth rate. Grazing low-mass pastures istherefore highly probable during winter.
Studies on dairy cows grazing low-mass pastures(low pasture height) have mainly been conducted undercontinuously-stocked management, pasture intake and milkproduction being reduced with decreasing pasture mass(Rook et al., 1994). On low-mass pastures, cows are forced

Table 1Chemical composition and nutritive value of supplements (maize silage andconcentrate).
Supplements Maize silage Concentrate
DM (g/kg) 373 907OM (g/kg DM) 956 948
OM composition (g/kg)CP 64 130NDF 411 247ADF 224 101ADL 21 19Starch 389 484
Nutritive valueOM digestibility a 0.704 0.842NEL (MJ/kg OM) 6.66 8.20
ADL=acid detergent lignin.a Calculated from pepsin-cellulase digestibility (Aufrère and Michalet-Doreau,
1988).
152 L.A. Pérez-Prieto et al. / Livestock Science 137 (2011) 151–160
to graze very low strata, strongly increasing the difficulty tocatch the sward. Pasture instantaneous intake rate is stronglydecreased because of the important reduction of bite mass(Gibb et al., 1997; Pulido and Leaver, 2001). On the dailyscale, dairy cows try tomaintain PI by increasing grazing time,but in the presence of very short swards cows are unable tofully compensate the reduction of intake rate and the totaldaily intake is reduced (Hodgson et al., 1994).
In rotational grazing systems dry matter intake is primarilycontrolled by PA, described as the product between pasturemass and daily offered area (Dalley et al., 1999; Wales et al.,1999; Curran et al., 2010). The relationship is curvilinear, withPI increasing at a declining ratewith increasing PA (Poppi et al.,1987). Studies carried outwithmedium-orhigh-mass pasturesreported that PI increases by 0.10–0.20 kg/kg PA (Delagardeet al., 2001). On low-masspastures, however, the effect of PAonPI has been scarcely studied. Pasture intake increased by 0.10and by 0.16 kg/kg PA above ground level in the experimentscarriedoutwith a low-mass pasture i.e. 2.2 tDM/habyKing andStockdale (1984) and Suksombat et al. (1994), respectively.This was comparable to the 0.18 kg/kg PA above ground levelmeasured by Wales et al. (1999) in a spring experiment onryegrass–white clover pastures (3.1 t DM/ha and a pre-grazingplatemeter pasture height of 5.6 cm). The effect of PA on PIrecorded in these experiments was therefore similar to thatreported with higher pasture mass.
During winter, however, time at pasture is normallyrestricted to reduce pasture damage due to pugging, andsupplementation is required to compensate the low pastureavailability at the farm level. To our knowledge, grazing oflow-mass pastures has never been studied under such condi-tions, two of the works presented above being experimentscarried out in seasons other than winter i.e. with differentsward structural characteristics (autumn: King and Stockdale,1984; spring: Wales et al., 1999). On the other hand, althoughthe experiment of Suksombat et al. (1994) studied the effect ofPA on PI in late autumn, it waswith unsupplemented cows andunrestricted access time at pasture. Therefore, if cows grazinglow-mass pastures are given restricted access time to pasture,they will be not only limited by the low intake rate typical oflow-mass pastures, but probably by an insufficient time tocompensate this low intake rate. Under these conditions,pasture intake may be reduced even when pasture availabilityis not restrictive.
The objective of this study was to determine the effect ofPA on PI, performance and grazing behaviour of dairy cowswhen strip-grazing low-mass pastures in winter. This willallow a better understanding of PI regulation under importantrestrictions of pasture mass when extending the grazingseason.
2. Materials and methods
This experimentwas carriedout in latewinter fromFebruary8 to March 17, 2008, at the INRA experimental farm ofMéjusseaume (1.71°W, 48.11°N, Brittany, France). Pasturescomprised of 80% perennial ryegrass (Lolium perenneL., cv. ‘Ohio’), 15% white clover (Trifolium repens L., cv. ‘Alice’)and 5% others, on a fresh basis. The pastures had been sown5 years previously and were rotationally grazed by a dairy herdin the previous autumn to keep a low pasture mass in early
December 2007 (post-grazing platemeter pasture height:4.0 cm approx.).
2.1. Treatments and experimental design
Three PA levels, namely LOW, MEDIUM and HIGH (19, 32and 46 kg OM/cow above ground level, respectively) werecompared in a 3×3 orthogonal Latin square design balanced forcarry-over effects (Jones and Kenward, 1989), during 3successive 13-day periods. Each cow was offered a daily rationof 4.4 kg OM of maize silage, 2 kg OM of concentrate and 100 gof minerals (Table 1). The concentrate consisted of thefollowing ingredients on a dry matter basis: sugar beet pulp,20%; barley, 20%; cornmeal, 20%; wheat, 20%;wheat bran, 15%,molasses 3%, sodium chloride 1%, and vegetable oils, 1%.
2.2. Cows
Twelve multiparous and six primiparous Holstein-Friesiandairy cows in mid lactation were selected and turned-out onJanuary 21. The groups were balanced according to parity(1 primiparous per group; 3.0±1.9 lactations), stage of lactation(125±18 days inmilk), milk production at peak (36.9±8.1 kg),milk production (28.1±4.5 kg), milk fat concentration (41.1±5.1 g/kg), milk protein concentration (30.7±2.4 g/kg), bodyweight (613±80 kg) and body condition score (2.5±0.3, scale0–5), measured in a pre-experimental period from January 21 toFebruary 5. During this period, the cows grazednonexperimentalpasture during the day (between am and pmmilking) and werehoused at night when they received maize silage and concen-trate. These supplements were mixed and offered to the cowsafter the pm milking. Maize silage and concentrate weregradually decreased during this 15-day period from 15 to 5 kgDM/d and from 6 to 2 kg DM/d, respectively. Cows were milkedtwice daily at 06:30 h and 18:00 h.
2.3. Grazing and feeding management
Three paddocks were grazed during the experiment.Within each paddock, the three treatments groups grazedas separated herds, working in a strip-grazing system. All
153L.A. Pérez-Prieto et al. / Livestock Science 137 (2011) 151–160
herds grazed adjacent sub-paddocks, defined using tempo-rary electric fences. The area allocated daily to each treatmentwas calculated from a daily estimate of the pre-grazing pasturemass above 2.5 cm, bymultiplying the daily pre-grazing swardheight and the sward bulk density above 2.5 cm estimatedtwice per period (see section on Feed and sward measure-ments). In practice, the targeted PA values were of 8, 14 and20 kg OM/d above 2.5 cm for LOW, MEDIUM and HIGH,respectively. Pasture allowance at ground level was thencalculated after determination of the stubblemass as describedin the Feed and sward measurements section. All the results inthis study are reported considering the PA above ground level.
Cows were allowed outdoors in the daytime, having 9 h ofaccess time at pasture (from 08:00 h to 17:00 h), and keptindoors at night. Water and supplements (maize silage andconcentrate) were only available indoors from pm milking toam milking (from 18:00 h to 06:00 h).
2.4. Animal measurements
Milk production per cow was measured every day. Milk fatconcentration andmilkprotein concentrationweredeterminedduring the last 4 days of each experimental period by nearinfra-red spectrophotometry (Milkoscan, Foss Electric,Hillerød, Denmark). Body weight was recorded on the lastday of each experimental period.
Individual PI wasmeasured from d9 to d12 by the n-alkanestechnique (Mayes et al., 1986), using the ratio of pasture C33(tritriacontane) to dosed C32 (dotriacontane). Throughout theexperiment, all the cowswere dosed twice daily before milkingwith a cellulose stopper (Carl Roth, Germany) containing 310±10 mg of C32. During the 4 days of measurement, pasturerepresentative of thatgrazed (selectedpasture)was collectedasdescribed in the feed and sward measurements section. Faecalgrab samples were collected from each cow twice daily (aftermilkings) from pm milking on d9 to am milking on d13 andstored at 4 °C. On day 13, the samples were composited byperiod and cow, then freeze-dried for chemical analysis.
Net energybalancewas calculated according to INRA (2007)and expressed as the proportion of energy requirementssatisfied by energy supply. Energy requirements for mainte-nance and milk production were expressed in net energy forlactation (NEL) and were calculated from body weight and 4%-fat correctedmilk (4%FCM) recorded during each experimentalperiod.Bodyweight changewasnot considered. TheNEL supplywas calculated from intake of pasture, maize silage andconcentrate, and from net energy concentrations of selectedpasture, maize silage and concentrate, taking account ofdigestive interactions between forages and concentrates.
Grazing behaviour was determined over the last two daysof each experimental period. Trained operators continuouslyobserved the cows, every 5 min recording whether or not theanimal was in a grazing sequence. The main activity wasnoted i.e. short intra-meal intervals were not recorded. Agrazing bout was defined as a sequence of at least twoconsecutive observations marked positive at grazing. Grazingtime was calculated per day (min/d), per hour (min/h) andper 3-hour interval (min/3 h interval) by multiplying thenumber of positive observations during the period analyzedat grazing (i.e., day, hour or 3 h interval) by 5 min. Theproportion of time spent grazing was determined by dividing
grazing time (min/d) by access time at pasture (min/d). Meangrazing bout duration (min/bout) was calculated by dividingthe grazing time (min/d) by the number of bouts (bouts/d).Pasture intake rate (g OM/min) was calculated as the ratiobetween PI (kg OM/d) and grazing time (min/d).
2.5. Feed and sward measurements
The amounts of maize silage and concentrate offered wereweighed daily for each cow. Dry matter concentration wasdetermined once daily for maize silage and once weekly forconcentrate. Eachmorning, the presence of refusals in feederswas verified. If any, they were removed and weighed. Weeklysamples of maize silage and concentrate were collected andcomposited before chemical analysis.
Pre-grazing pasture mass was measured twice per period(generally d4 and d12) by cutting four quadrats per treatment(0.7×0.7 m) at random. The pasture was cut with an electricmanual shear (ElmarWolf Ltd.,Wissembourg, France) at 2.5 cmabove ground level. Pasture height was measured on eachquadrat before and after cutting (4measurements/quadrat),with an electronic platemeter (30×30 cm, 4.5 kg/m2, AGRO-Systèmes, France) to calculate the depth of cutting. Sward bulkdensity was calculated on each quadrat by dividing the pasturemass by cutting depth. A 500 g pasture subsample per quadratwas oven-dried for the determination of DM concentration. Thechemical composition of the offered pasture was determinedfrom the dry samples, composited by treatment and period.
Pre-grazing pasture mass was estimated at ground leveltwice per period (generally on d5 and d13). In two of the fourquadrats cut at 2.5 cm, stubble was cut to ground level withscissors over an area of 0.1 m2. After manual removal of soiland roots, the samples were weighed and dried to determineDM concentration. The concentration of OM was determinedfrom the dry samples, composited by treatment and period.
The chemical composition of selected pasture was deter-mined on each treatment from d9 to d12. Each day, a 500 gsample of pasture was manually collected imitating the post-grazing sward height of the previous day. For each treatment,samples were collected during the morning before grazing. Aninitial subsample was oven-dried, then composited by treat-ment and period before chemical analysis. A second subsamplewas stored at−20 °C, and composited by treatment and periodbefore n-alkanes analysis.
Pre- and post-grazing sward heights were determined dailyfrom50 randommeasurements per treatmentwith an electronicplatemeter. Pre-grazing extended tiller and highest sheathheights were measured with a ruler on 50 tillers of ryegrasstaken at random, on d8 andd10. Post-grazing extended tiller andhighest sheath heights were measured on d11 and d13, on 100tillers per treatment. From these latest measurements i.e. thoserealized ond11 andd13, the proportion of lamina-free tillerswascalculated. Lamina-free tillers were defined as those tillerspresenting the same extended tiller and extended sheath heights(i.e. main lamina totally defoliated).
Pasture harvested per hectare was calculated from the PIper m2 (PI/daily offered area). The proportion of pastureharvested, on the other hand, was calculated by dividing thepasture harvested per hectare by the pre-grazing pasturemass.
154 L.A. Pérez-Prieto et al. / Livestock Science 137 (2011) 151–160
2.6. Chemical analyses
The dried pasture, maize silage and concentrate samples,along with the freeze-dried faeces and pasture samples, wereground through a 0.8 mm screen before chemical analysis.The DM concentration of pasture, maize silage and concen-trate were measured by drying in an oven at 80 °C for 48 h.The OM concentrationwas determined by ashing at 550 °C for5 h (Association Française de Normalisation, 1997) in amuffle furnace. Due to the risk of soil contamination, allresults are expressed in g/kg OM. Nitrogen concentration wasdetermined by the Dumas method (Association Française deNormalisation, 1997) on a Leco instrument (Leco, St. Joseph,MI). Pepsin-cellulase digestibility of pasture was determinedaccording to Aufrère and Michalet-Doreau (1988). Theconcentrations of NDF, ADF and ADLweremeasured accordingto van Soest et al. (1991) on a Fibersac extraction unit (AnkonTechnology, Fairport, NY). N-alkanes were determined afterfreeze-drying according to Mayes et al. (1986) after a directsaponification (Vulich et al., 1991).
2.7. Statistical analyses
Animal and pasture data were analyzed as a 3×3 Latinsquare. The animal data (n=54), averaged per cow and period,were analyzedbyusing the followingmodel (PROCMIXED;SASInstitute, 1999):
Yijk = μ + cowi + periodj + allowancek + eijk
where Yijk, μ, cowi, periodj, allowancek, eijk represent theanalyzed variable, the overall mean, the random effect of thecow, the fixed effect of the period, the fixed effect of PA and theresidual error term, respectively. The pasture data (n=9),averagedper treatment and period,were analyzed according toa similar model which included only the effects of period andPA (PROC GLM; SAS Institute, 1999).
The least square means and standard errors of thedifference (SED) are reported for all data. The linear orquadratic effects of PA were tested by orthogonal contrasts.All animal results are expressed in a per-cow basis.
Date
-5
0
10
15
20
Tem
pera
ture
, °C
Period 1 Period
08 Feb 14 Feb 20 Feb 27 Feb-10
5
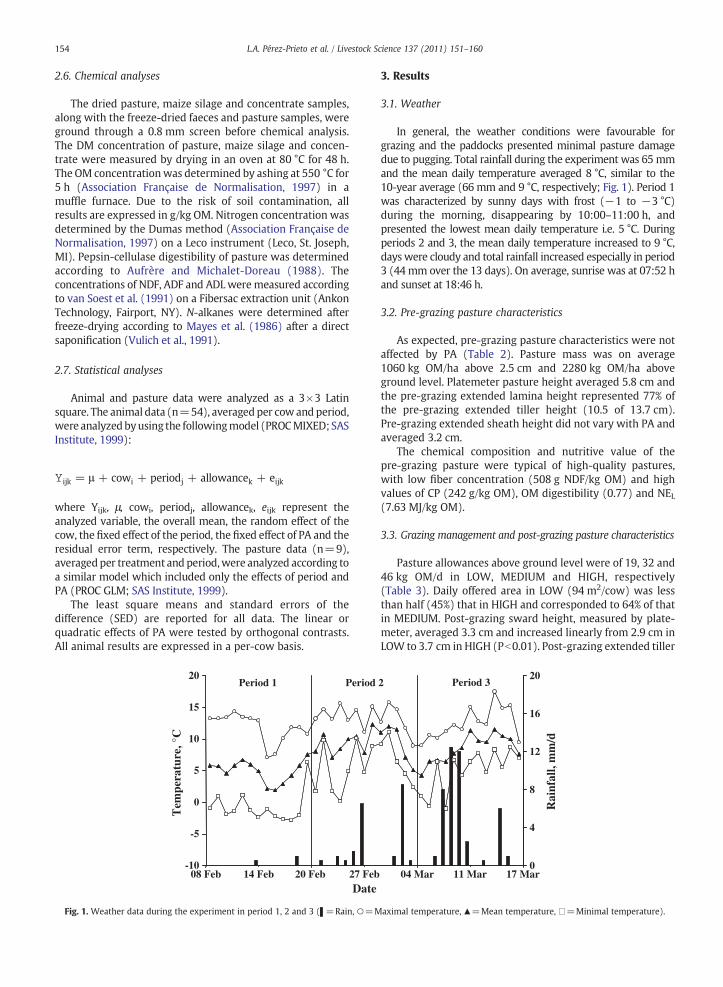
Fig. 1. Weather data during the experiment in period 1, 2 and 3 (▌=Rain, ○=M
3. Results
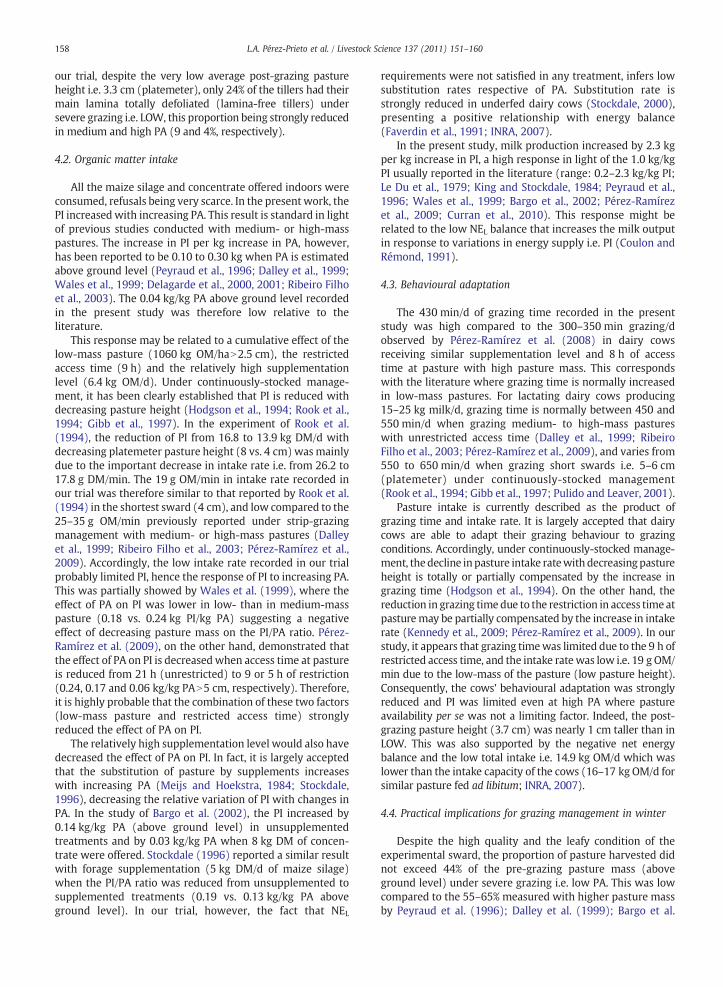
3.1. Weather
In general, the weather conditions were favourable forgrazing and the paddocks presented minimal pasture damagedue to pugging. Total rainfall during the experiment was 65 mmand the mean daily temperature averaged 8 °C, similar to the10-year average (66 mm and 9 °C, respectively; Fig. 1). Period 1was characterized by sunny days with frost (−1 to −3 °C)during the morning, disappearing by 10:00–11:00 h, andpresented the lowest mean daily temperature i.e. 5 °C. Duringperiods 2 and 3, the mean daily temperature increased to 9 °C,days were cloudy and total rainfall increased especially in period3 (44 mm over the 13 days). On average, sunrise was at 07:52 hand sunset at 18:46 h.
3.2. Pre-grazing pasture characteristics
As expected, pre-grazing pasture characteristics were notaffected by PA (Table 2). Pasture mass was on average1060 kg OM/ha above 2.5 cm and 2280 kg OM/ha aboveground level. Platemeter pasture height averaged 5.8 cm andthe pre-grazing extended lamina height represented 77% ofthe pre-grazing extended tiller height (10.5 of 13.7 cm).Pre-grazing extended sheath height did not vary with PA andaveraged 3.2 cm.
The chemical composition and nutritive value of thepre-grazing pasture were typical of high-quality pastures,with low fiber concentration (508 g NDF/kg OM) and highvalues of CP (242 g/kg OM), OM digestibility (0.77) and NEL(7.63 MJ/kg OM).
3.3. Grazing management and post-grazing pasture characteristics
Pasture allowances above ground level were of 19, 32 and46 kg OM/d in LOW, MEDIUM and HIGH, respectively(Table 3). Daily offered area in LOW (94 m2/cow) was lessthan half (45%) that in HIGH and corresponded to 64% of thatin MEDIUM. Post-grazing sward height, measured by plate-meter, averaged 3.3 cm and increased linearly from 2.9 cm inLOW to 3.7 cm in HIGH (Pb0.01). Post-grazing extended tiller
Rai
nfal
l, m
m/d
Period 3
0
4
8
12
16
202
04 Mar 11 Mar 17 Mar
aximal temperature, ▲=Mean temperature, □=Minimal temperature).
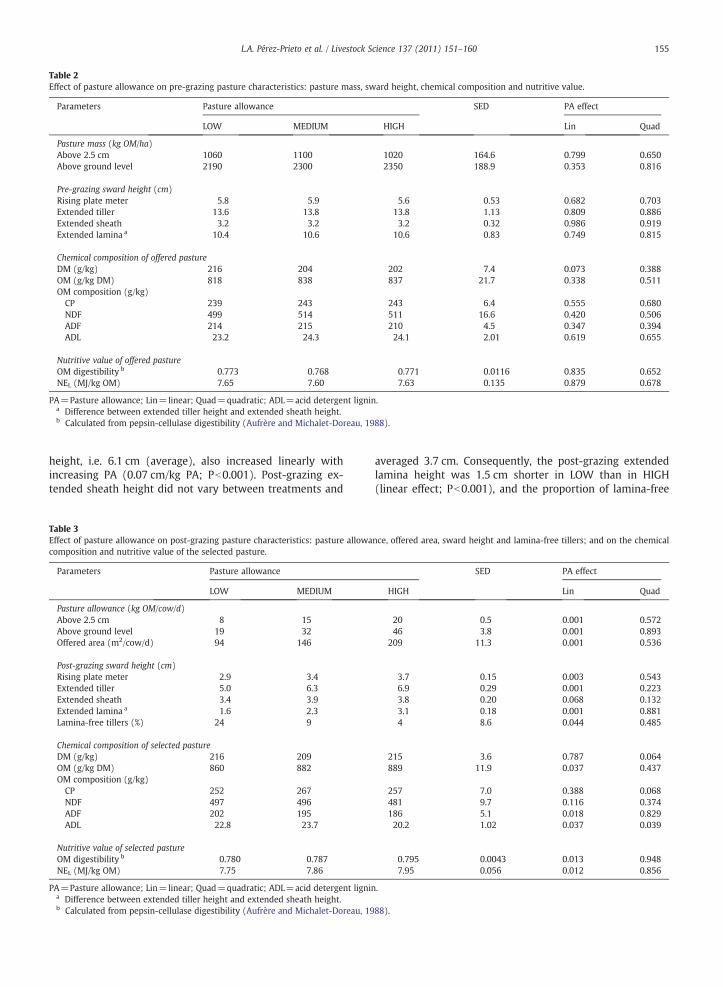
Table 2Effect of pasture allowance on pre-grazing pasture characteristics: pasture mass, sward height, chemical composition and nutritive value.
Parameters Pasture allowance SED PA effect
LOW MEDIUM HIGH Lin Quad
Pasture mass (kg OM/ha)Above 2.5 cm 1060 1100 1020 164.6 0.799 0.650Above ground level 2190 2300 2350 188.9 0.353 0.816
Pre-grazing sward height (cm)Rising plate meter 5.8 5.9 5.6 0.53 0.682 0.703Extended tiller 13.6 13.8 13.8 1.13 0.809 0.886Extended sheath 3.2 3.2 3.2 0.32 0.986 0.919Extended lamina a 10.4 10.6 10.6 0.83 0.749 0.815
Chemical composition of offered pastureDM (g/kg) 216 204 202 7.4 0.073 0.388OM (g/kg DM) 818 838 837 21.7 0.338 0.511OM composition (g/kg)CP 239 243 243 6.4 0.555 0.680NDF 499 514 511 16.6 0.420 0.506ADF 214 215 210 4.5 0.347 0.394ADL 23.2 24.3 24.1 2.01 0.619 0.655
Nutritive value of offered pastureOM digestibility b 0.773 0.768 0.771 0.0116 0.835 0.652NEL (MJ/kg OM) 7.65 7.60 7.63 0.135 0.879 0.678
PA=Pasture allowance; Lin=linear; Quad=quadratic; ADL=acid detergent lignin.a Difference between extended tiller height and extended sheath height.b Calculated from pepsin-cellulase digestibility (Aufrère and Michalet-Doreau, 1988).
155L.A. Pérez-Prieto et al. / Livestock Science 137 (2011) 151–160
height, i.e. 6.1 cm (average), also increased linearly withincreasing PA (0.07 cm/kg PA; Pb0.001). Post-grazing ex-tended sheath height did not vary between treatments and
Table 3Effect of pasture allowance on post-grazing pasture characteristics: pasture allowacomposition and nutritive value of the selected pasture.
Parameters Pasture allowance
LOW MEDIUM
Pasture allowance (kg OM/cow/d)Above 2.5 cm 8 15Above ground level 19 32Offered area (m2/cow/d) 94 146
Post-grazing sward height (cm)Rising plate meter 2.9 3.4Extended tiller 5.0 6.3Extended sheath 3.4 3.9Extended lamina a 1.6 2.3Lamina-free tillers (%) 24 9
Chemical composition of selected pastureDM (g/kg) 216 209OM (g/kg DM) 860 882OM composition (g/kg)CP 252 267NDF 497 496ADF 202 195ADL 22.8 23.7
Nutritive value of selected pastureOM digestibility b 0.780 0.787NEL (MJ/kg OM) 7.75 7.86
PA=Pasture allowance; Lin=linear; Quad=quadratic; ADL=acid detergent lignina Difference between extended tiller height and extended sheath height.b Calculated from pepsin-cellulase digestibility (Aufrère and Michalet-Doreau, 19
averaged 3.7 cm. Consequently, the post-grazing extendedlamina height was 1.5 cm shorter in LOW than in HIGH(linear effect; Pb0.001), and the proportion of lamina-free
nce, offered area, sward height and lamina-free tillers; and on the chemical
SED PA effect
HIGH Lin Quad
20 0.5 0.001 0.57246 3.8 0.001 0.893
209 11.3 0.001 0.536
3.7 0.15 0.003 0.5436.9 0.29 0.001 0.2233.8 0.20 0.068 0.1323.1 0.18 0.001 0.8814 8.6 0.044 0.485
215 3.6 0.787 0.064889 11.9 0.037 0.437
257 7.0 0.388 0.068481 9.7 0.116 0.374186 5.1 0.018 0.82920.2 1.02 0.037 0.039
0.795 0.0043 0.013 0.9487.95 0.056 0.012 0.856
.
88).
156 L.A. Pérez-Prieto et al. / Livestock Science 137 (2011) 151–160
tillers decreased linearly from 24% in LOW to 4% in HIGH(Pb0.05). The quality of the pasture selected by the cowsimproved from LOW to HIGH. The concentration of ADF andADL decreased linearly (Pb0.05), and the OM digestibilityand NEL concentration increased linearly with increasing PA(Pb0.05).
3.4. Pasture intake and energy balance
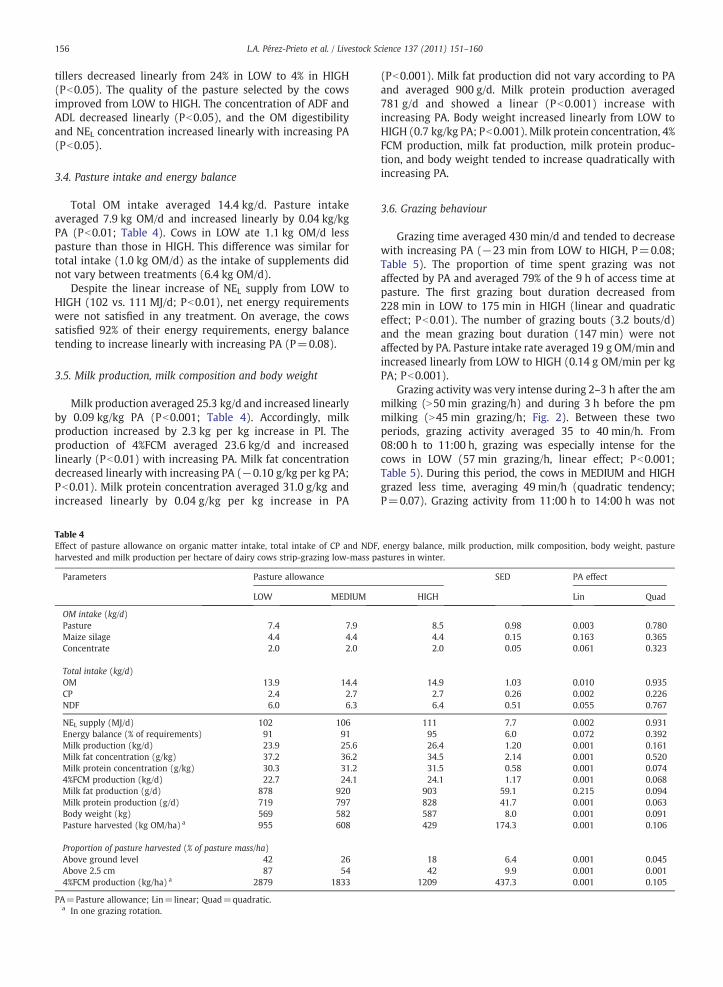
Total OM intake averaged 14.4 kg/d. Pasture intakeaveraged 7.9 kg OM/d and increased linearly by 0.04 kg/kgPA (Pb0.01; Table 4). Cows in LOW ate 1.1 kg OM/d lesspasture than those in HIGH. This difference was similar fortotal intake (1.0 kg OM/d) as the intake of supplements didnot vary between treatments (6.4 kg OM/d).
Despite the linear increase of NEL supply from LOW toHIGH (102 vs. 111 MJ/d; Pb0.01), net energy requirementswere not satisfied in any treatment. On average, the cowssatisfied 92% of their energy requirements, energy balancetending to increase linearly with increasing PA (P=0.08).
3.5. Milk production, milk composition and body weight
Milk production averaged 25.3 kg/d and increased linearlyby 0.09 kg/kg PA (Pb0.001; Table 4). Accordingly, milkproduction increased by 2.3 kg per kg increase in PI. Theproduction of 4%FCM averaged 23.6 kg/d and increasedlinearly (Pb0.01) with increasing PA. Milk fat concentrationdecreased linearly with increasing PA (−0.10 g/kg per kg PA;Pb0.01). Milk protein concentration averaged 31.0 g/kg andincreased linearly by 0.04 g/kg per kg increase in PA
Table 4Effect of pasture allowance on organic matter intake, total intake of CP and NDFharvested and milk production per hectare of dairy cows strip-grazing low-mass p
Parameters Pasture allowance
LOW MEDIUM
OM intake (kg/d)Pasture 7.4 7.9Maize silage 4.4 4.4Concentrate 2.0 2.0
Total intake (kg/d)OM 13.9 14.4CP 2.4 2.7NDF 6.0 6.3
NEL supply (MJ/d) 102 106Energy balance (% of requirements) 91 91Milk production (kg/d) 23.9 25.6Milk fat concentration (g/kg) 37.2 36.2Milk protein concentration (g/kg) 30.3 31.24%FCM production (kg/d) 22.7 24.1Milk fat production (g/d) 878 920Milk protein production (g/d) 719 797Body weight (kg) 569 582Pasture harvested (kg OM/ha) a 955 608
Proportion of pasture harvested (% of pasture mass/ha)Above ground level 42 26Above 2.5 cm 87 544%FCM production (kg/ha) a 2879 1833
PA=Pasture allowance; Lin=linear; Quad=quadratic.a In one grazing rotation.
(Pb0.001). Milk fat production did not vary according to PAand averaged 900 g/d. Milk protein production averaged781 g/d and showed a linear (Pb0.001) increase withincreasing PA. Body weight increased linearly from LOW toHIGH (0.7 kg/kg PA; Pb0.001). Milk protein concentration, 4%FCM production, milk fat production, milk protein produc-tion, and body weight tended to increase quadratically withincreasing PA.
3.6. Grazing behaviour
Grazing time averaged 430 min/d and tended to decreasewith increasing PA (−23 min from LOW to HIGH, P=0.08;Table 5). The proportion of time spent grazing was notaffected by PA and averaged 79% of the 9 h of access time atpasture. The first grazing bout duration decreased from228 min in LOW to 175 min in HIGH (linear and quadraticeffect; Pb0.01). The number of grazing bouts (3.2 bouts/d)and the mean grazing bout duration (147 min) were notaffected by PA. Pasture intake rate averaged 19 g OM/min andincreased linearly from LOW to HIGH (0.14 g OM/min per kgPA; Pb0.001).
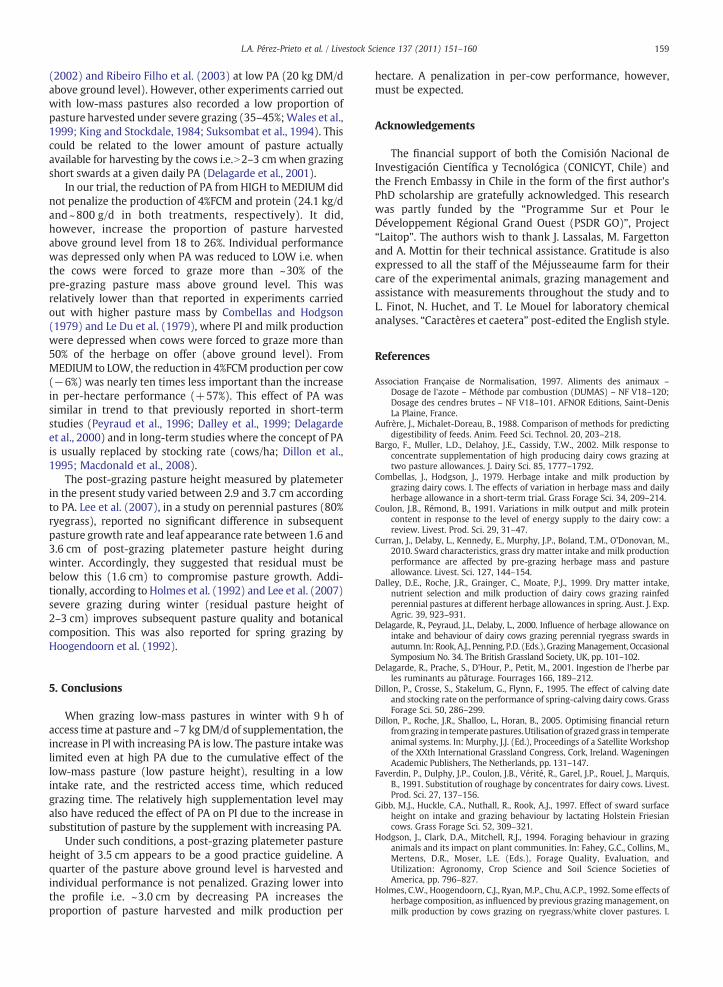
Grazing activity was very intense during 2–3 h after the ammilking (N50 min grazing/h) and during 3 h before the pmmilking (N45 min grazing/h; Fig. 2). Between these twoperiods, grazing activity averaged 35 to 40 min/h. From08:00 h to 11:00 h, grazing was especially intense for thecows in LOW (57 min grazing/h, linear effect; Pb0.001;Table 5). During this period, the cows in MEDIUM and HIGHgrazed less time, averaging 49 min/h (quadratic tendency;P=0.07). Grazing activity from 11:00 h to 14:00 h was not
, energy balance, milk production, milk composition, body weight, pastureastures in winter.
SED PA effect
HIGH Lin Quad
8.5 0.98 0.003 0.7804.4 0.15 0.163 0.3652.0 0.05 0.061 0.323
14.9 1.03 0.010 0.9352.7 0.26 0.002 0.2266.4 0.51 0.055 0.767
111 7.7 0.002 0.93195 6.0 0.072 0.39226.4 1.20 0.001 0.16134.5 2.14 0.001 0.52031.5 0.58 0.001 0.07424.1 1.17 0.001 0.068
903 59.1 0.215 0.094828 41.7 0.001 0.063587 8.0 0.001 0.091429 174.3 0.001 0.106
18 6.4 0.001 0.04542 9.9 0.001 0.001
1209 437.3 0.001 0.105
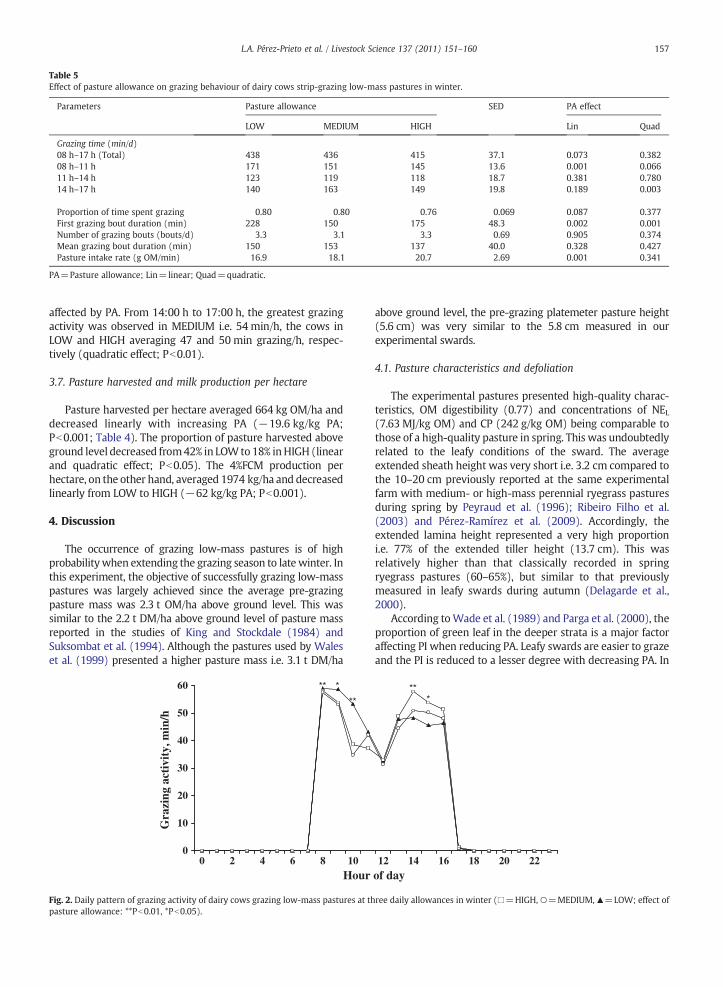
Table 5Effect of pasture allowance on grazing behaviour of dairy cows strip-grazing low-mass pastures in winter.
Parameters Pasture allowance SED PA effect
LOW MEDIUM HIGH Lin Quad
Grazing time (min/d)08 h–17 h (Total) 438 436 415 37.1 0.073 0.38208 h–11 h 171 151 145 13.6 0.001 0.06611 h–14 h 123 119 118 18.7 0.381 0.78014 h–17 h 140 163 149 19.8 0.189 0.003
Proportion of time spent grazing 0.80 0.80 0.76 0.069 0.087 0.377First grazing bout duration (min) 228 150 175 48.3 0.002 0.001Number of grazing bouts (bouts/d) 3.3 3.1 3.3 0.69 0.905 0.374Mean grazing bout duration (min) 150 153 137 40.0 0.328 0.427Pasture intake rate (g OM/min) 16.9 18.1 20.7 2.69 0.001 0.341
PA=Pasture allowance; Lin=linear; Quad=quadratic.
157L.A. Pérez-Prieto et al. / Livestock Science 137 (2011) 151–160
affected by PA. From 14:00 h to 17:00 h, the greatest grazingactivity was observed in MEDIUM i.e. 54 min/h, the cows inLOW and HIGH averaging 47 and 50 min grazing/h, respec-tively (quadratic effect; Pb0.01).
3.7. Pasture harvested and milk production per hectare
Pasture harvested per hectare averaged 664 kg OM/ha anddecreased linearly with increasing PA (−19.6 kg/kg PA;Pb0.001; Table 4). The proportion of pasture harvested aboveground level decreased from42% in LOWto18% inHIGH (linearand quadratic effect; Pb0.05). The 4%FCM production perhectare, on the other hand, averaged 1974 kg/ha and decreasedlinearly from LOW to HIGH (−62 kg/kg PA; Pb0.001).
4. Discussion
The occurrence of grazing low-mass pastures is of highprobabilitywhen extending the grazing season to late winter. Inthis experiment, the objective of successfully grazing low-masspastures was largely achieved since the average pre-grazingpasture mass was 2.3 t OM/ha above ground level. This wassimilar to the 2.2 t DM/ha above ground level of pasture massreported in the studies of King and Stockdale (1984) andSuksombat et al. (1994). Although the pastures used by Waleset al. (1999) presented a higher pasture mass i.e. 3.1 t DM/ha
Hour
0
10
20
30
40
50
60
0 2 4 6 8 10
Gra
zing
act
ivit
y, m
in/h
Fig. 2. Daily pattern of grazing activity of dairy cows grazing low-mass pastures at thpasture allowance: **Pb0.01, *Pb0.05).
above ground level, the pre-grazing platemeter pasture height(5.6 cm) was very similar to the 5.8 cm measured in ourexperimental swards.
4.1. Pasture characteristics and defoliation
The experimental pastures presented high-quality charac-teristics, OM digestibility (0.77) and concentrations of NEL(7.63 MJ/kg OM) and CP (242 g/kg OM) being comparable tothose of a high-quality pasture in spring. This was undoubtedlyrelated to the leafy conditions of the sward. The averageextended sheath height was very short i.e. 3.2 cm compared tothe 10–20 cm previously reported at the same experimentalfarm with medium- or high-mass perennial ryegrass pasturesduring spring by Peyraud et al. (1996); Ribeiro Filho et al.(2003) and Pérez-Ramírez et al. (2009). Accordingly, theextended lamina height represented a very high proportioni.e. 77% of the extended tiller height (13.7 cm). This wasrelatively higher than that classically recorded in springryegrass pastures (60–65%), but similar to that previouslymeasured in leafy swards during autumn (Delagarde et al.,2000).
According toWade et al. (1989) and Parga et al. (2000), theproportion of green leaf in the deeper strata is a major factoraffecting PI when reducing PA. Leafy swards are easier to grazeand the PI is reduced to a lesser degree with decreasing PA. In
of day12 14 16 18 20 22
ree daily allowances in winter (□=HIGH, ○=MEDIUM, ▲=LOW; effect of
158 L.A. Pérez-Prieto et al. / Livestock Science 137 (2011) 151–160
our trial, despite the very low average post-grazing pastureheight i.e. 3.3 cm (platemeter), only 24% of the tillers had theirmain lamina totally defoliated (lamina-free tillers) undersevere grazing i.e. LOW, this proportion being strongly reducedin medium and high PA (9 and 4%, respectively).
4.2. Organic matter intake
All the maize silage and concentrate offered indoors wereconsumed, refusals being very scarce. In the present work, thePI increasedwith increasing PA. This result is standard in lightof previous studies conducted with medium- or high-masspastures. The increase in PI per kg increase in PA, however,has been reported to be 0.10 to 0.30 kg when PA is estimatedabove ground level (Peyraud et al., 1996; Dalley et al., 1999;Wales et al., 1999; Delagarde et al., 2000, 2001; Ribeiro Filhoet al., 2003). The 0.04 kg/kg PA above ground level recordedin the present study was therefore low relative to theliterature.
This response may be related to a cumulative effect of thelow-mass pasture (1060 kg OM/haN2.5 cm), the restrictedaccess time (9 h) and the relatively high supplementationlevel (6.4 kg OM/d). Under continuously-stocked manage-ment, it has been clearly established that PI is reduced withdecreasing pasture height (Hodgson et al., 1994; Rook et al.,1994; Gibb et al., 1997). In the experiment of Rook et al.(1994), the reduction of PI from 16.8 to 13.9 kg DM/d withdecreasing platemeter pasture height (8 vs. 4 cm) wasmainlydue to the important decrease in intake rate i.e. from 26.2 to17.8 g DM/min. The 19 g OM/min in intake rate recorded inour trial was therefore similar to that reported by Rook et al.(1994) in the shortest sward (4 cm), and low compared to the25–35 g OM/min previously reported under strip-grazingmanagement with medium- or high-mass pastures (Dalleyet al., 1999; Ribeiro Filho et al., 2003; Pérez-Ramírez et al.,2009). Accordingly, the low intake rate recorded in our trialprobably limited PI, hence the response of PI to increasing PA.This was partially showed by Wales et al. (1999), where theeffect of PA on PI was lower in low- than in medium-masspasture (0.18 vs. 0.24 kg PI/kg PA) suggesting a negativeeffect of decreasing pasture mass on the PI/PA ratio. Pérez-Ramírez et al. (2009), on the other hand, demonstrated thatthe effect of PA on PI is decreasedwhen access time at pastureis reduced from 21 h (unrestricted) to 9 or 5 h of restriction(0.24, 0.17 and 0.06 kg/kg PAN5 cm, respectively). Therefore,it is highly probable that the combination of these two factors(low-mass pasture and restricted access time) stronglyreduced the effect of PA on PI.
The relatively high supplementation level would also havedecreased the effect of PA on PI. In fact, it is largely acceptedthat the substitution of pasture by supplements increaseswith increasing PA (Meijs and Hoekstra, 1984; Stockdale,1996), decreasing the relative variation of PI with changes inPA. In the study of Bargo et al. (2002), the PI increased by0.14 kg/kg PA (above ground level) in unsupplementedtreatments and by 0.03 kg/kg PA when 8 kg DM of concen-trate were offered. Stockdale (1996) reported a similar resultwith forage supplementation (5 kg DM/d of maize silage)when the PI/PA ratio was reduced from unsupplemented tosupplemented treatments (0.19 vs. 0.13 kg/kg PA aboveground level). In our trial, however, the fact that NEL
requirements were not satisfied in any treatment, infers lowsubstitution rates respective of PA. Substitution rate isstrongly reduced in underfed dairy cows (Stockdale, 2000),presenting a positive relationship with energy balance(Faverdin et al., 1991; INRA, 2007).
In the present study, milk production increased by 2.3 kgper kg increase in PI, a high response in light of the 1.0 kg/kgPI usually reported in the literature (range: 0.2–2.3 kg/kg PI;Le Du et al., 1979; King and Stockdale, 1984; Peyraud et al.,1996; Wales et al., 1999; Bargo et al., 2002; Pérez-Ramírezet al., 2009; Curran et al., 2010). This response might berelated to the low NEL balance that increases the milk outputin response to variations in energy supply i.e. PI (Coulon andRémond, 1991).
4.3. Behavioural adaptation
The 430 min/d of grazing time recorded in the presentstudy was high compared to the 300–350 min grazing/dobserved by Pérez-Ramírez et al. (2008) in dairy cowsreceiving similar supplementation level and 8 h of accesstime at pasture with high pasture mass. This correspondswith the literature where grazing time is normally increasedin low-mass pastures. For lactating dairy cows producing15–25 kg milk/d, grazing time is normally between 450 and550 min/d when grazing medium- to high-mass pastureswith unrestricted access time (Dalley et al., 1999; RibeiroFilho et al., 2003; Pérez-Ramírez et al., 2009), and varies from550 to 650 min/d when grazing short swards i.e. 5–6 cm(platemeter) under continuously-stocked management(Rook et al., 1994; Gibb et al., 1997; Pulido and Leaver, 2001).
Pasture intake is currently described as the product ofgrazing time and intake rate. It is largely accepted that dairycows are able to adapt their grazing behaviour to grazingconditions. Accordingly, under continuously-stocked manage-ment, thedecline inpasture intake ratewith decreasingpastureheight is totally or partially compensated by the increase ingrazing time (Hodgson et al., 1994). On the other hand, thereduction in grazing time due to the restriction in access time atpasturemay be partially compensated by the increase in intakerate (Kennedy et al., 2009; Pérez-Ramírez et al., 2009). In ourstudy, it appears that grazing timewas limited due to the 9 h ofrestricted access time, and the intake ratewas low i.e. 19 g OM/min due to the low-mass of the pasture (low pasture height).Consequently, the cows' behavioural adaptation was stronglyreduced and PI was limited even at high PA where pastureavailability per se was not a limiting factor. Indeed, the post-grazing pasture height (3.7 cm) was nearly 1 cm taller than inLOW. This was also supported by the negative net energybalance and the low total intake i.e. 14.9 kg OM/d which waslower than the intake capacity of the cows (16–17 kg OM/d forsimilar pasture fed ad libitum; INRA, 2007).
4.4. Practical implications for grazing management in winter
Despite the high quality and the leafy condition of theexperimental sward, the proportion of pasture harvested didnot exceed 44% of the pre-grazing pasture mass (aboveground level) under severe grazing i.e. low PA. This was lowcompared to the 55–65% measured with higher pasture massby Peyraud et al. (1996); Dalley et al. (1999); Bargo et al.
159L.A. Pérez-Prieto et al. / Livestock Science 137 (2011) 151–160
(2002) and Ribeiro Filho et al. (2003) at low PA (20 kg DM/dabove ground level). However, other experiments carried outwith low-mass pastures also recorded a low proportion ofpasture harvested under severe grazing (35–45%;Wales et al.,1999; King and Stockdale, 1984; Suksombat et al., 1994). Thiscould be related to the lower amount of pasture actuallyavailable for harvesting by the cows i.e.N2–3 cmwhen grazingshort swards at a given daily PA (Delagarde et al., 2001).
In our trial, the reduction of PA from HIGH to MEDIUM didnot penalize the production of 4%FCM and protein (24.1 kg/dand~800 g/d in both treatments, respectively). It did,however, increase the proportion of pasture harvestedabove ground level from 18 to 26%. Individual performancewas depressed only when PA was reduced to LOW i.e. whenthe cows were forced to graze more than ~30% of thepre-grazing pasture mass above ground level. This wasrelatively lower than that reported in experiments carriedout with higher pasture mass by Combellas and Hodgson(1979) and Le Du et al. (1979), where PI and milk productionwere depressed when cows were forced to graze more than50% of the herbage on offer (above ground level). FromMEDIUM to LOW, the reduction in 4%FCMproduction per cow(−6%) was nearly ten times less important than the increasein per-hectare performance (+57%). This effect of PA wassimilar in trend to that previously reported in short-termstudies (Peyraud et al., 1996; Dalley et al., 1999; Delagardeet al., 2000) and in long-term studies where the concept of PAis usually replaced by stocking rate (cows/ha; Dillon et al.,1995; Macdonald et al., 2008).
The post-grazing pasture height measured by platemeterin the present study varied between 2.9 and 3.7 cm accordingto PA. Lee et al. (2007), in a study on perennial pastures (80%ryegrass), reported no significant difference in subsequentpasture growth rate and leaf appearance rate between 1.6 and3.6 cm of post-grazing platemeter pasture height duringwinter. Accordingly, they suggested that residual must bebelow this (1.6 cm) to compromise pasture growth. Addi-tionally, according to Holmes et al. (1992) and Lee et al. (2007)severe grazing during winter (residual pasture height of2–3 cm) improves subsequent pasture quality and botanicalcomposition. This was also reported for spring grazing byHoogendoorn et al. (1992).
5. Conclusions
When grazing low-mass pastures in winter with 9 h ofaccess time at pasture and ~7 kgDM/d of supplementation, theincrease in PI with increasing PA is low. The pasture intake waslimited even at high PA due to the cumulative effect of thelow-mass pasture (low pasture height), resulting in a lowintake rate, and the restricted access time, which reducedgrazing time. The relatively high supplementation level mayalso have reduced the effect of PA on PI due to the increase insubstitution of pasture by the supplement with increasing PA.
Under such conditions, a post-grazing platemeter pastureheight of 3.5 cm appears to be a good practice guideline. Aquarter of the pasture above ground level is harvested andindividual performance is not penalized. Grazing lower intothe profile i.e. ~3.0 cm by decreasing PA increases theproportion of pasture harvested and milk production per
hectare. A penalization in per-cow performance, however,must be expected.
Acknowledgements
The financial support of both the Comisión Nacional deInvestigación Científica y Tecnológica (CONICYT, Chile) andthe French Embassy in Chile in the form of the first author'sPhD scholarship are gratefully acknowledged. This researchwas partly funded by the “Programme Sur et Pour leDéveloppement Régional Grand Ouest (PSDR GO)”, Project“Laitop”. The authors wish to thank J. Lassalas, M. Fargettonand A. Mottin for their technical assistance. Gratitude is alsoexpressed to all the staff of the Méjusseaume farm for theircare of the experimental animals, grazing management andassistance with measurements throughout the study and toL. Finot, N. Huchet, and T. Le Mouel for laboratory chemicalanalyses. “Caractères et caetera” post-edited the English style.
References
Association Française de Normalisation, 1997. Aliments des animaux –Dosage de l'azote – Méthode par combustion (DUMAS) – NF V18–120;Dosage des cendres brutes – NF V18–101. AFNOR Editions, Saint-DenisLa Plaine, France.
Aufrère, J., Michalet-Doreau, B., 1988. Comparison of methods for predictingdigestibility of feeds. Anim. Feed Sci. Technol. 20, 203–218.
Bargo, F., Muller, L.D., Delahoy, J.E., Cassidy, T.W., 2002. Milk response toconcentrate supplementation of high producing dairy cows grazing attwo pasture allowances. J. Dairy Sci. 85, 1777–1792.
Combellas, J., Hodgson, J., 1979. Herbage intake and milk production bygrazing dairy cows. I. The effects of variation in herbage mass and dailyherbage allowance in a short-term trial. Grass Forage Sci. 34, 209–214.
Coulon, J.B., Rémond, B., 1991. Variations in milk output and milk proteincontent in response to the level of energy supply to the dairy cow: areview. Livest. Prod. Sci. 29, 31–47.
Curran, J., Delaby, L., Kennedy, E., Murphy, J.P., Boland, T.M., O'Donovan, M.,2010. Sward characteristics, grass dry matter intake andmilk productionperformance are affected by pre-grazing herbage mass and pastureallowance. Livest. Sci. 127, 144–154.
Dalley, D.E., Roche, J.R., Grainger, C., Moate, P.J., 1999. Dry matter intake,nutrient selection and milk production of dairy cows grazing rainfedperennial pastures at different herbage allowances in spring. Aust. J. Exp.Agric. 39, 923–931.
Delagarde, R., Peyraud, J.L., Delaby, L., 2000. Influence of herbage allowance onintake and behaviour of dairy cows grazing perennial ryegrass swards inautumn. In: Rook, A.J., Penning, P.D. (Eds.), GrazingManagement, OccasionalSymposium No. 34. The British Grassland Society, UK, pp. 101–102.
Delagarde, R., Prache, S., D'Hour, P., Petit, M., 2001. Ingestion de l'herbe parles ruminants au pâturage. Fourrages 166, 189–212.
Dillon, P., Crosse, S., Stakelum, G., Flynn, F., 1995. The effect of calving dateand stocking rate on the performance of spring-calving dairy cows. GrassForage Sci. 50, 286–299.
Dillon, P., Roche, J.R., Shalloo, L., Horan, B., 2005. Optimising financial returnfromgrazing in temperatepastures. Utilisationof grazedgrass in temperateanimal systems. In: Murphy, J.J. (Ed.), Proceedings of a Satellite Workshopof the XXth International Grassland Congress, Cork, Ireland. WageningenAcademic Publishers, The Netherlands, pp. 131–147.
Faverdin, P., Dulphy, J.P., Coulon, J.B., Vérité, R., Garel, J.P., Rouel, J., Marquis,B., 1991. Substitution of roughage by concentrates for dairy cows. Livest.Prod. Sci. 27, 137–156.
Gibb, M.J., Huckle, C.A., Nuthall, R., Rook, A.J., 1997. Effect of sward surfaceheight on intake and grazing behaviour by lactating Holstein Friesiancows. Grass Forage Sci. 52, 309–321.
Hodgson, J., Clark, D.A., Mitchell, R.J., 1994. Foraging behaviour in grazinganimals and its impact on plant communities. In: Fahey, G.C., Collins, M.,Mertens, D.R., Moser, L.E. (Eds.), Forage Quality, Evaluation, andUtilization: Agronomy, Crop Science and Soil Science Societies ofAmerica, pp. 796–827.
Holmes, C.W., Hoogendoorn, C.J., Ryan, M.P., Chu, A.C.P., 1992. Some effects ofherbage composition, as influenced by previous grazingmanagement, onmilk production by cows grazing on ryegrass/white clover pastures. I.
160 L.A. Pérez-Prieto et al. / Livestock Science 137 (2011) 151–160
Milk production in early spring: effects of different regrowth intervalsduring the preceding winter period. Grass Forage Sci. 47, 309–315.
Hoogendoorn, C.J., Holmes, C.W., Chu, A.C.P., 1992. Some effects of herbagecomposition, as influenced by previous grazing management, on milkproduction by cows grazing on ryegrass/white clover pastures. II. Milkproduction in late spring/summer: effects of grazing intensity during thepreceding spring period. Grass Forage Sci. 47, 316–325.
INRA, 2007. Alimentation des bovins, ovins et caprins, Besoins des animaux –
Valeurs des aliments, éditions Quae, Versailles, France. 307 pp.Jones, B., Kenward, M.G., 1989. Design and analyses for three or more
treatments. In: Cox, D.R., Hinkley, D.V., Rubin, D., Silverman, B.W. (Eds.),Design and Analysis of Cross-over Trials. : Monographs on Statistics andApplied Probability No. 34. Chapman and Hall editions, UK, pp. 189–241.
Kennedy, E., McEvoy, M., Murphy, J.P., O'Donovan, M., 2009. Effect ofrestricted access time to pasture on dairy cow milk production, grazingbehavior, and dry matter intake. J. Dairy Sci. 92, 168–176.
King, K.R., Stockdale, C.R., 1984. Effects of pasture type and grazingmanagement in autumn on the performance of dairy cows in latelactation and on subsequent pasture productivity. Aust. J. Exp. Agric.Anim. Husb. 24, 312–321.
Le Du, Y.L.P., Combellas, J., Hodgson, J., Baker, R.D., 1979. Herbage intake andmilk production by grazing dairy cows 2. The effects of level of winterfeeding and daily herbage allowance. Grass Forage Sci. 34, 249–260.
Lee, J.M., Donaghy, D.J., Roche, J.R., 2007. The effect of grazing severity andfertiliser application during winter on herbage regrowth and quality ofperennial ryegrass (Lolium perenne L.). Aust. J. Exp. Agric. 47, 825–832.
Macdonald, K.A., Penno, J.W., Lancaster, J.A.S., Roche, J.R., 2008. Effect ofstocking rate on pasture production, milk production, and reproductionof dairy cows in pasture-based systems. J. Dairy Sci. 91, 2151–2163.
Mayes, R.W., Lamb, C.S., Colgrove, P.M., 1986. The use of dosed and herbagen-alkanes as markers for the determination of herbage intake. J. Agric.Sci. Camb. 107, 161–170.
Meijs, J.A.C., Hoekstra, J.A., 1984. Concentrate supplementation of grazingdairy cows. I. Effect of concentrate intake and herbage allowance onherbage intake. Grass Forage Sci. 39, 59–66.
Parga, J., Peyraud, J.L., Delagarde, R., 2000. Effect of sward structure and herbageallowance on herbage intake and digestion by strip-grazing dairy cows. In:Rook, A.J., Penning, P.D. (Eds.), Grazing Management, Occasional Sympo-sium No. 34. The British Grassland Society, UK, pp. 61–66.
Pérez-Ramírez, E., Delagarde, R., Delaby, L., 2008. Herbage intake andbehavioural adaptation of grazing dairy cows by restricting time atpasture under two feeding regimes. Animal 2, 1384–1392.
Pérez-Ramírez, E., Peyraud, J.L., Delagarde, R., 2009. Restricting daily time atpasture at low and high pasture allowance: effects on pasture intake andbehavioral adaptation of lactating dairy cows. J. Dairy Sci. 92, 3331–3340.
Peyraud, J.L., Comerón, E.A., Wade, M.H., Lemaire, G., 1996. The effect of dailyherbage allowance, herbage mass and animal factors upon herbageintake by grazing dairy cows. Ann. Zootech. 45, 201–217.
Poppi, D.P., Hughes, T.P., L'Huillier, P.J., 1987. Intake of pasture by grazingruminants. In: Nicol, A.M. (Ed.), Feeding Livestock on Pasture, OccasionalPublication No. 10. New Zealand Society of Animal Production, LincolnUniversity, New Zealand, pp. 55–63.
Pulido, R.G., Leaver, J.D., 2001. Quantifying the influence of sward height,concentrate level and initial milk yield on the milk production andgrazing behaviour of continuously stocked dairy cows. Grass Forage Sci.56, 57–67.
Ribeiro Filho, H.M.N., Delagarde, R., Peyraud, J.L., 2003. Inclusion of whiteclover in strip-grazed perennial ryegrass swards: herbage intake andmilk yield of dairy cows at different ages of sward regrowth. Anim. Sci.77, 499–510.
Rook, A.J., Huckle, C.A., Penning, P.D., 1994. Effects of sward height andconcentrate supplementation on the ingestive behaviour of spring-calving dairy cows grazing grass-clover swards. Appl. Anim. Behav. Sci.40, 101–112.
SAS Institute, 1999. SAS User's Guide: Statistics. SAS Institute Inc., Cary, NC.Stockdale, C.R., 1996. Substitution and production responses when lactating
dairy cows graze a white clover pasture supplemented withmaize silage.Aust. J. Exp. Agric. 36, 771–776.
Stockdale, C.R., 2000. Levels of pasture substitution when concentrates arefed to grazing dairy cows in northern Victoria. Aust. J. Exp. Agric. 40,913–921.
Suksombat, W., Holmes, C.W., Wilson, G.F., 1994. Effects of herbageallowance and a high protein supplement on performance of dairycows grazing on autumn–winter pastures. Proc. N. Z. Soc. Anim. Prod. 54,83–86.
van Soest, P.J., Roberson, J.B., Lewis, B.A., 1991. Carbohydrate methodology,metabolism, and nutritional implications in dairy cattle. J. Dairy Sci. 75,2215–2225.
Vulich, S.A., O'Riordan, E.G., Hanrahan, J.P., 1991. Effect of litter size onherbage intake at pasture by ewes and their progeny. Anim. Prod. 53,191–197.
Wade, M.H., Peyraud, J.L., Lemaire, G., Comerón, E.A., 1989. The dynamicsof daily area and depth of grazing and herbage intake of cows in a fiveday paddock system. Proc. 16th Int. Grassland Congr., Nice, France,pp. 1111–1112.
Wales, W.J., Doyle, P.T., Stockdale, C.R., Dellow, D.W., 1999. Effects ofvariations in herbage mass, allowance, and level of supplement onnutrient intake andmilk production of dairy cows in spring and summer.Aust. J. Exp. Agric. 39, 119–130.