partners for health: mdg and beyond - who | world health ... · partners for health: mdg and beyond...
TRANSCRIPT

1
Partners for Health: MDG and beyond
Jacques Baudouy
The 6th Global Conference on Health Promotion Bangkok, Thailand, 7-11 August 2005

2
Abstract The Millennium Development Goals commit the international community to an expanded vision of development-- one that vigorously promotes health and human development as key to sustaining social and economic progress in all countries, and recognizes the importance of creating a global partnership for development. The goals have been accepted as a common framework for development progress. The first seven goals are mutually reinforcing and are directed at reducing poverty in all its forms. The last goal - global partnership for development - is about the means to achieve the first seven. Achieving the targets set by the MDGs will require more focus on development outcomes. It also will require continuous monitoring of national and global progress towards meeting the MDGs, and more close engagement among partners in helping governments improve human development. All of the poorest countries will need additional monetary assistance and must collaborate with donors in developing effective frameworks through which additional resources can be delivered and performance can be measured and evaluated. For the poorest countries many of the goals seem far out of reach. Even in better-off countries, there may be regions or groups that lag behind. Countries need to set their own strategies and work, together with the global partners, to ensure that poor people are included in the benefits of development. As proposed by the Monterrey Consensus and the recent G8 summit, debt management and debt relief to countries that are poor and heavily indebted needs to be a top priority in the development agenda in order to accelerate progress towards attainment of the MDGs. This paper will set the stage for discussion by providing a very brief general overview of what the MDGs are and their importance in relation to global health. It will also review progress in regions so far, highlighting variation among countries, as well as stressing the importance of addressing the equity gap within countries. The paper will present strategies for achieving the MDG agenda, highlighting the importance of policy and institutional reforms that increase absorptive capacity within countries so that they can effectively use additional resources to improve health service delivery. The importance of cross-sectoral actions and the need for good monitoring and surveillance will also be stressed. The importance of effective partnerships will be highlighted and issues of donor harmonization and the need for NGO/Civil Society engagement and public-private partnerships will be addressed. In addition, the relationship between globalization and trade in products potentially harmful to health as well as awareness of different lifestyles, and impacts on health related behavior and NCDs will be discussed. The paper will conclude with a recommendation to

3
broaden the MDG agenda to include Non-communicable Diseases (NCDs), given that health impacts in some regions may be larger by focusing in this area.

Positioning Health in Development:Public Policies to Reach the MDGs and Beyond
Dr. Jacques Baudouy, DirectorHealth, Nutrition and PopulationHuman Development NetworkThe World Bank

Cycle of health & wealthand economic growth
Buys more health services
Improves life styles
Reduces job-related risks
Buys more education and other human capital-related services
Buys more health services
Improves life styles
Reduces job-related risks
Buys more education and other human capital-related services
Source: Salehi, 2004
HealthIncomeWealthGrowth
Improves political stability, investment climate, and productivity
Reduces medical spending
Reduces fertilityIncreases labor supply and
female labor force participationIncreases saving
Increase in the years of healthy life expectancy
Improves political stability, investment climate, and productivity
Reduces medical spending
Reduces fertilityIncreases labor supply and
female labor force participationIncreases saving
Increase in the years of healthy life expectancy

Some empirical evidence
Poor health reduces GDP per capita by reducing both labor productivity and the relative size of the labor force (Ruger, Jamison, Bloom and Canning)
10% increase in life expectancy at birth leads to 0.35% increasein the economic growth rate (CMH)
Increases in health status accounted for 17% of the increase in productivity gains (NBER)
One year increase in life expectancy raises GDP per capita by about 4% (Bloom, Canning and Sevilla)
Reductions in adult mortality explain 10-15% of the economic growth that occurred between 1960-90 (Jamison, Lau and Wang)

Ill health and povertyThe case of Vietnam (1)
0
1
2
3
4
5
6
7
8
9
10
1 500 999 1498 1997 2496 2995 3494 3993 4492 4991 5490 5989
Households ranked by expend w/out hc payments
HH e
xpen
ditu
re a
s m
ultip
le o
f PL
Pov line = VND 1.8m/year Expend w/out hc paymentsSource: World Bank

Ill health and povertyThe case of Vietnam (2)
0
1
2
3
4
5
6
7
8
9
10
1 500 999 1498 1997 2496 2995 3494 3993 4492 4991 5490 5989
Households ranked by expend w/out hc payments
HH
exp
endi
ture
as
mul
tiple
of
PL
Pov line = VND 1.8m/year Expend w/out hc paymentsHC payments
Out-of-pocket payments for health care pushed 2.6m Vietnamese into poverty in 1998.
Increased poverty gap by 25%
Source: World Bank
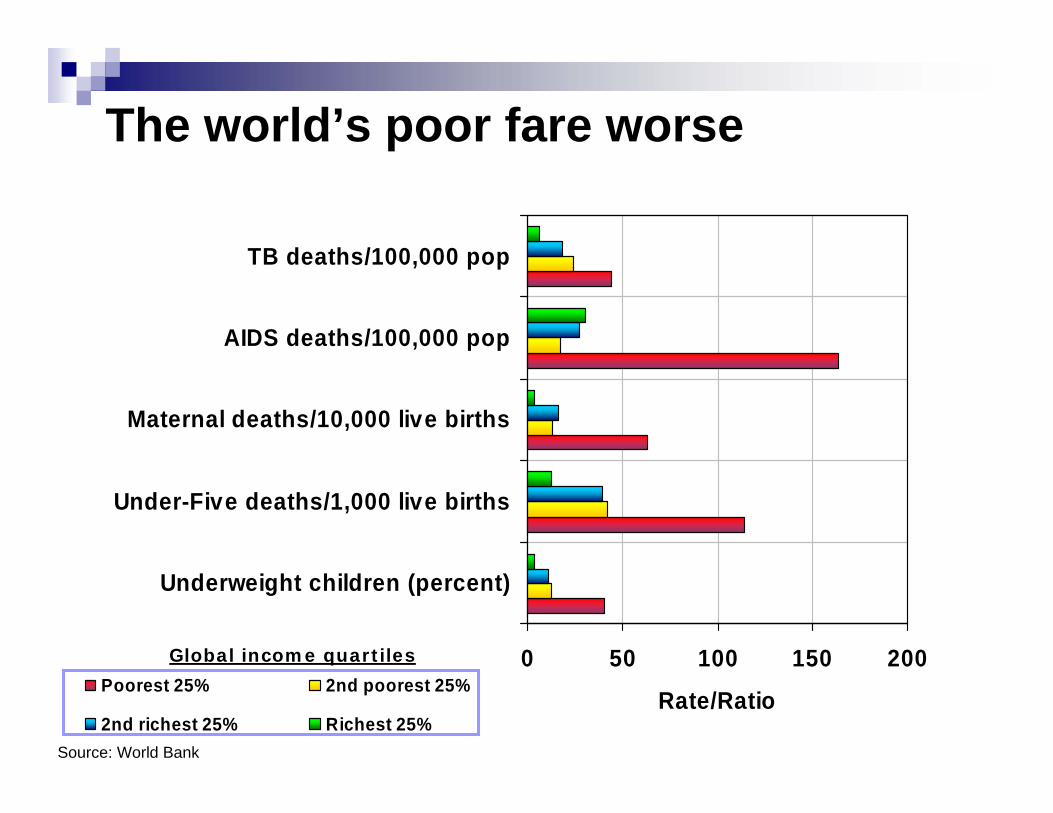
0 50 100 150 200
Underweight children (percent)
Under-Five deaths/1,000 live births
Maternal deaths/10,000 live births
AIDS deaths/100,000 pop
TB deaths/100,000 pop
Rate/RatioPoorest 25% 2nd poorest 25%
2nd richest 25% Richest 25%
The world’s poor fare worse
Global income quartiles
Source: World Bank

Coverage rates of basic MCH services by income quintile in Asia
0
10
20
30
40
50
60
70
80
90
100
Antenatal Care OralRehydration
Thereapy
FullImmunization
Med. Treatmentof Ac. Res. Inf.
Att. Delivery Med. Treatmentof Fever
Modern Contra.Use (Women)
Lowest 20% of Population Highest 20% of Population

The world responds to the challenge:The Millennium Development Goals
Goal 1: Eradicate extreme poverty and hungerGoal 2: Achieve universal primary educationGoal 3: Promote gender equality and empower
womenGoal 4: Reduce child mortalityGoal 5: Improve maternal healthGoal 6: Combat HIV/AIDS, malaria, and other
diseases.Goal 7: Ensure environmental sustainabilityGoal 8: Develop a global partnership for
development.
189 member states adopt the goalsat the UN General Assembly:

Assessing progress on the MDGs:U5 Mortality
U5M - EAP
41
59
20
0
50
100
150
200
1990 1995 2000 2005 2010 2015Actual Goal
U5M - ECA
3615
46
0
50
100
150
200
1990 1995 2000 2005 2010 2015Actual Goal
U5M - LAC
33
53
18
0
50
100
150
200
1990 1995 2000 2005 2010 2015Actual Goal
U5M - MNA
53
77
26
0
50
100
150
200
1990 1995 2000 2005 2010 2015Actual Goal
U5M - SAS
92
43
130
0
50
100
150
200
1990 1995 2000 2005 2010 2015Actual Goal
U5M - SSA
171
62
187
0
50
100
150
200
1990 1995 2000 2005 2010 2015Actual Goal

Assessing progress on the MDGs: Share of people living on less than $1 (or $2) a day (%)

Global trends in underweight (Children 0-4 Years)1980-2005
Data Source: de Onis et al (2004)
0
15
30
45
60
75
1980 1985 1990 1995 2000 2005
Prev
alen
ce o
f und
erw
eigh
t (%
)
BangladeshIndiaChina
0
40
80
120
160
200
1980 1985 1990 1995 2000 2005
No.
of u
nder
wei
ght c
hild
ren
(mill
ion)
AfricaAsiaLACDeveloping

The poorest countries are progressing the slowest
-8%-7%-6%-5%-4%-3%-2%-1%0%
Malnutrition U5MR MMR
pop-
wei
ghte
d av
% ra
te o
f cha
nge
in 1
990s
Low incomeLower middle incomeUpper middle income
Target
Target
Target

Progress varies by country:Annual rate of decline in malnutrition, Africa
-8%-6%-4%-2%0%2%4%6%
Botswana
Maurit
aniaUgandaNigeri
aKen
ya
EthiopiaTan
zania
Burkina Fas
o
annu
al a
v. %
cha
nge
Target rate of reduction

Progress varies within countries: Rate of U5 mortality by income quintile: Bangladesh
0
20
40
60
80
100
120
140
160
Lowest 20% Second Middle Fourth Highest 20%
deat
hs p
er 1
000
live
birt
hs
U5 Mortality Rate

Achieving the Agenda:What is needed to reach the health MDGs?
FinancingPolicies, Institutions, and GovernanceMulti-sectoral ApproachesPartnerships

Region/income groupPopulation,
millions (2002)
Per capita GDP (2002
$US)
Health expenditure per capita,
(2000)
Public health expenditures as % of total health exp.
(2000)Aid as a % of GNI (2001)
East Asia & Pacific 1,838 980 44 38 0.5Europe & Central Asia 476 2,384 108 73 1Latin America & Caribbean 527 3,176 262 47 0.3Middle East & North Africa 306 2,265 171 62 0.7South Asia 1,401 467 21 20 1Sub-Saharan Africa 688 463 29 43 4.6World 6,201 5,201 482 58 0.2High income 965 26,942 2735 59 N/AMiddle income 2,742 1,870 115 51 0.4Low income 2,495 453 21 25 2.4
Source: WDI, 2002
Global health spending and ODA

Accelerating progress to reach the health MDGs: U5 Mortality
Target

Accelerating progress to reach the health MDGs: Maternal Mortality
Target
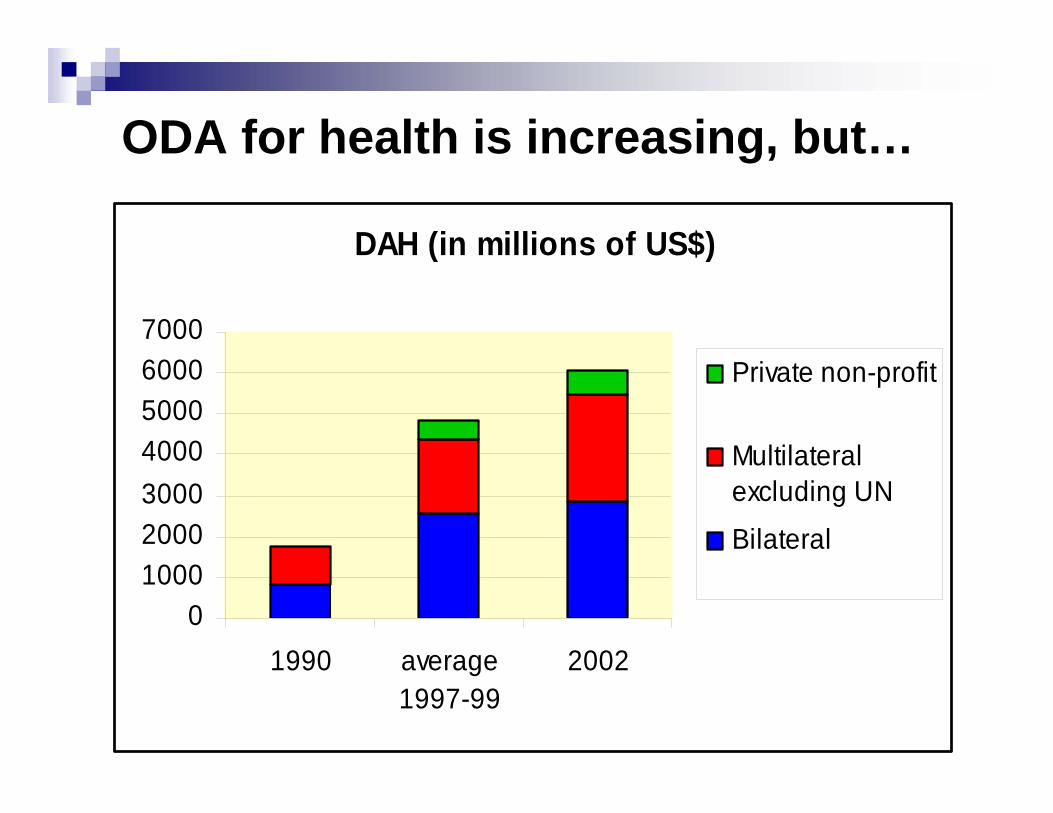
ODA for health is increasing, but…
DAH (in millions of US$)
01000200030004000500060007000
1990 average1997-99
2002
Private non-profit
Multilateralexcluding UN
Bilateral

External Funding is unreliable
ODA is NOT the solution
Donors are unable to make long term commitments
Donor Com m itm ents as a percentage of Total Health Expenditure
02040
6080
100
1997 1998 1999 2000 2001
Mauritania
Tanzania
Mali
Eritrea
Percentage of Total Health Expenditure Financed by External Sources
0
510
1520
25
1997 1998 1999 2000 2001
Guinea
Benin
Burundi
Liberia

Government health spendingNecessary, but not sufficient
Absorptive capacity of funds
Equitable targeting of funding needed
Policies and Institutions are crucial
Proportional scaling-up across programsLeads to bigger decline in MMR than U5MRImpact is greater in countries with good policies & institutions
But… even in countries with better policies and institutionsrelying on across-the-board scaling-up to get to MDGs would require much faster growth in share of GDP devoted to govt. health spending

Making money workPolicies and Institutions are critical
-0.74-0.75-0.375.00-0.52-0.72-0.084.00-0.31-0.690.223.00
MalnutritionMMRUnder-5 mortalityCPIA Index*
•CPIA: Country Policy and Institutional Assessment; ratings used by World Bank to allocate IDA credits
Elasticities of public health expenditures and MDGs

Stronger policies & institutionsImproving demand and service delivery
Policies need to address lowering all household barriers to access to care
Households key actors—as demanders & deliverers Lower financial barriers, especially for the poor; empower women; better knowledge; increase accessibility
Improved service delivery—accountabilityWithin organizations (management)
Performance improved through clearer responsibilities and accountability linking performance & rewards
Between organizations and public:Directly (patient-provider): governance participation, information disseminationIndirectly (policymaker-provider): contracting, partnerships, social marketing

Stronger policies & institutionsHR, drugs, public health, financing
Tackling HR and drugs constraintsHR: Improve returns to employment; training to focus on MDG-specific servicesDrugs: better logistics and incentives to get drugs to frontline; behavior change against poor quality drugs
Strengthening core public health functionsStrategies for disease prevention, treatment & control; govt.-led M&E
Sustainable health financingWork out what’s affordable; mobilize extra domestic resources where appropriate Better planning and budgeting to align goals & resourcesRely less on out-of-pocket expendituresMove toward risk pooling

The human resources challengeSub-Saharan Africa needs in health
800,000
80,000
1,140,000
470,000
0
200,000
400,000
600,000
800,000
1,000,000
1,200,000
Physicians Nurses
HR Requirements (HRR)Average of low andlower-middle incomecountries
HR Availability (HRA) inSSA

Effective Policies and institutions to Achieve the MDGs:PROGRESA: an example of effective targeting
Benefit:
125-Peso Monthly Food Transfer per Family
IF Each Child Receives 2-4 Checkups annually, Adults Receive One Annual Checkup, Pregnant Women Receive Seven Pre- and Post-natal Checkups
Accomplishments:
Serves over 20 million people (1/5 pop of Mexico)Provides 20% of income of participating familiesKeeps administrative expenses under 10% of total program costHas survived a landmark shift in power away from the political party that established it.

PROGRESA: Effective Targeting
0102030405060708090
Bottom 20% ofNational Population
Bottom 40% ofNational Population
Perc
ent o
f Tot
alPr
ogra
m B
enef
its
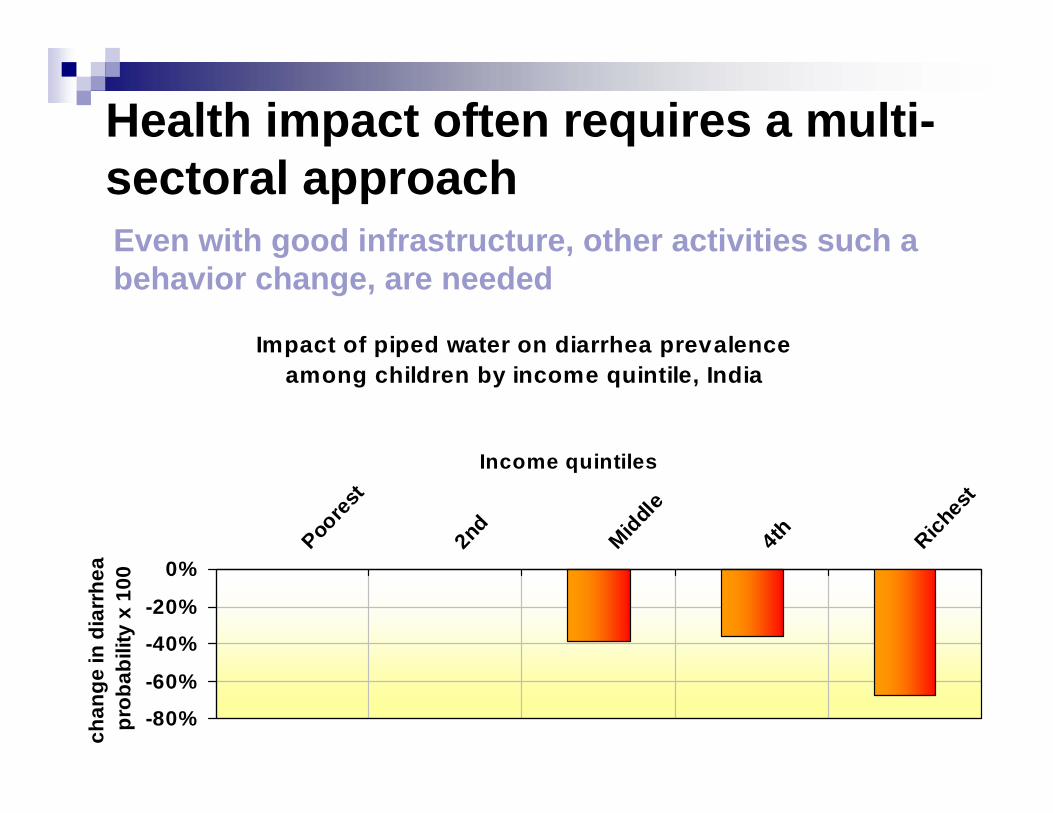
Health impact often requires a multi-sectoral approach
Impact of piped water on diarrhea prevalence among children by income quintile, India
-80%
-60%
-40%
-20%
0%
Poore
st
2nd
Middle
4th Riches
t
Income quintiles
chan
ge in
dia
rrhe
a pr
obab
ility
x 1
00
Even with good infrastructure, other activities such a behavior change, are needed

Partnerships
Key to achieving the MDGs Broadens scope beyond government capacity to deliver servicesIncreases transparency and accountabilityGovernment can take on a more stewardship roleTypes:
International alliances to bring needed commodities to marketGov./Business/ Civil Society: targeted efforts to tackle specific public health issuesGov-NGO: give voice to population and access hard-to-reach populations

PartnershipsNGOs and Civil Society
Essential link at the grassroots level that can be in getting services to the hardest-to-reach populations
Can increase participation by tapping into social capital at the community level

Partnerships:Cambodia contracting
05
1015202530354045
Government Areas Contracted-InAreas
Contracted-OutAreas
19972001
Percentage of Poorest 20% Benefited by Intervention

Partnerships:Donor Harmonization
Donors need to use country owned and led initiatives as the basis for aligning and harmonizing assistance
Partners need to work together to improve the quality of aid by supporting activities that increase absorptive capacity within countries to effectively use assistance

The MDG+ Agenda
While the MDGS are important goals the focus on those targets is not the full picture for some regions
The epidemiologic transition in many countries calls for a agenda that is broader than the MDGs and needs to address non-communicable diseases (NCDs)

Deaths, by broad cause group and WHO Region, 2003
InjuriesNoncommunicableconditions
Communicable diseases, maternal and perinatal conditions and nutritional deficiencies
AFR EMR EURSEAR WPR AMR
25
50
75
%
Sour
ce: W
HO

Reaching MDGs will not be enoughHigh returns from reducing adult mortality – MDG+ approach in Europe and Central Asia
Increase in life expectancy from reaching MDGs 4 and 5, or reducing CVD and external causes
0.0 2.0 4.0 6.0 8.0 10.0 12.0
Remaining FSU
E. and S. Europe
Central Asia & Caucasus
Regional average
Increase in life expectancy (years)
Reaching MDGs 4 and 5 Reaching EU levels for CVD and external causes

The MDG+ Agenda- Implications for Health Promotion
Work multisectorallyTarget effectivelyStrengthen prevention efforts Build on existing HP modelsBuild partnerships with the private sector