partner summit 15_aha moments_ashleyohmann final
TRANSCRIPT
Ashley OhmannPRESENTED BY:
Visualization Practice Leader,Kforce Advisory and Solutions Practice
PARTNER SUMMIT 2015
PRESENTED BY:
A-HA! Moments

Ashley Ohmann - Biography
• Kforce Advisory and Solutions Visualization Practice Director
• 10+ years developing and implementing end-to-end technology solutions
• Tableau Jedi
• Certified Technical Trainer and Lean Six Sigma certified
• Frequent presenter at visualization user groups
• Trained 400+ Tableau Desktop authors
• Co-authoring a book on Tableau Public
• Extensive experience in retail, healthcare manufacturing, and financial services, including The Home Depot and Philips Healthcare
• Passionate about good design and sharing knowledge

A-HA Moments
“Eureka!”- Archimedes, c. 220 b.c.
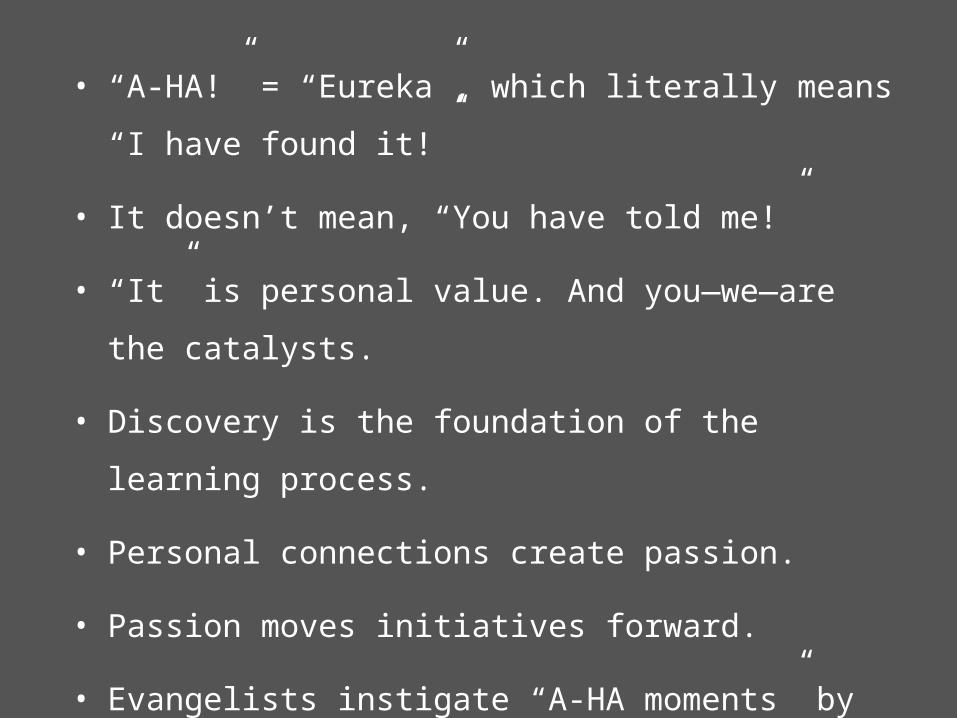
• “A-HA!” = “Eureka”, which literally means “I
have found it!”
• It doesn’t mean, “You have told me!”
• “It” is personal value. And you—we—are the
catalysts.
• Discovery is the foundation of the learning
process.
• Personal connections create passion.
• Passion moves initiatives forward.
• Evangelists instigate “A-HA moments” by
connecting to people with personal experiences
(stories!).

Evangelist[ih-van-juh-list], noun: • An enthusiastic advocate• A person with a passion• Someone who spreads good news to other
people• A Tableau partner—and, hopefully, your client
after his or her “A-HA” moment
Evangelists?

Why Do You Need Evangelists?
Evangelists• Discover value in an idea—or new tool — before
other people do• Tell people stories
– People relate to new ideas through stories– Story = history = personal experience
“If you teach someone something valuable, they’ll be your client for life.” – Patrick Diaz, Kforce

Getting to A-HA!
• Evangelists understand how to relate tools and ideas to other people, helping to overcome natural human biases towards: – Anything new– Tools other people are using that we don’t
know how to use– Other peoples’ agendas– Projects that appear to create more work for
us– Being the first one to try something– Taking a personal risk

A-HA! and Tableau
• Tableau is a new tool. And it’s kind of disruptive.
• Not everyone likes it at first: also, people tend to have a lot of money and political capital tied up in old tools. But that’s changing.
• People also don’t want to be irrelevant: they like being experts.
• And they’re scared of change.
• “Who moved my data?”

Change
Change[chānj], transitive verb.
Synonyms: alter, transform: • to make different in some particular • to give a different position, course, or direction to• to replace with another
Effective change is a personal choice.

How We Get our Clients to A-HA!
• We relate to them. We tell them our stories. And then we let them decide for themselves.
• We analyze our client situations regarding their BI tools by several criteria: – Level of information: how much do they know?– Burden of proof: how much do they want to see?– Passion: how much do they care?– Risk aversion: why would they not move forward?– Organization: how focused/influential are they? What
are the competing agenda?
• Client 1: Melanie• Client 2: Cliff• Client 3: Graham and Andy

Client 1: Anne
• Highly Informed• High Burden of Proof• Highly Passionate• Moderately Risk
Averse• Highly Organized

Client 1: Goals and Strategy
“You want to do WHAT?” – Our Client“Let us show you.” -- Us• Anne is an enterprise architect in a large retailer with very strict
protocols for– Master data management– Architecture– Data modeling– Production deployments
• Anne has a high level of expertise—and influence• She also has a high level of skepticism• We needed her sponsorship to form an analytics layer in our
client’s recently secured Hortonworks environment• Tableau was seen as the shiny new ball that Finance bought (for a
cool $1mm+)

• Perception by EA of the business necessity• The very large and expensive Microstrategy and Teradata
infrastructures that we were not proposing to use• The data source was unstructured (web scrapes) and was to
be joined with both master and aggregated transactional data from Teradata
• No one had ever done this before• Normal life cycle for a project like this would be six to nine
months, with multiple architectural reviews—which is where we met the most resistance
• Our clients needed it to be done yesterday• Political sensitivity around the recently acquired vendor
Client 1: Challenges

Client 1: Tactics and Execution
• We knew what the output needed to enable the business users to do, and we knew what the key metrics and desired latency were
• We started working with the unstructured data from Redshift• We used preliminary drafts to cluster and partition the data in the
client’s Hadoop infrastructure• We also build a solid ETL process in SQL Server with sample data—
which we used for a completely functional POC
• We took the POC—and the data model we built for the new schema in Hadoop—to the Architectural Review Board
• When we showed the ARB the dashboard that we needed to build—and showed them how it would meet a critical competitive business need for 500+ of their business customers—they bought in immediately.
• Outcome: “What you’re doing is brilliant.”

Client 2: Melanie
– Highly Informed– High Burden of Proof– Low Passion– High Risk Aversion– Medium Organization

Client 2: Goals and Strategy
Our Strategy - 3 Visits
• Visit 1: – Scott, a passionate Tableau evangelist; invited us to Q&A with BI
stakeholders.
• Visit 2: On-Site Q&A and Implementation Planning– Melanie, Scott’s key stakeholder to building Tableau momentum
• During our three-hour visit, we primarily answered Melanie’s questions
about change management.
• Visit 3: On-Site Tableau Desktop Training– She had just lost another team member– Completed each exercise quickly and correctly– Asked technical questions; did not interact with others– Melanie was scowling.

Melanie’s A-HA! Moment
Melanie’s A-HA!• “I think we can use this to show top and bottom
funds in a single dashboard—we have been trying to solve that problem for a while.”
Results• New positive demeanor
• Team’s tone around Tableau less negative; more optimistic and trusting
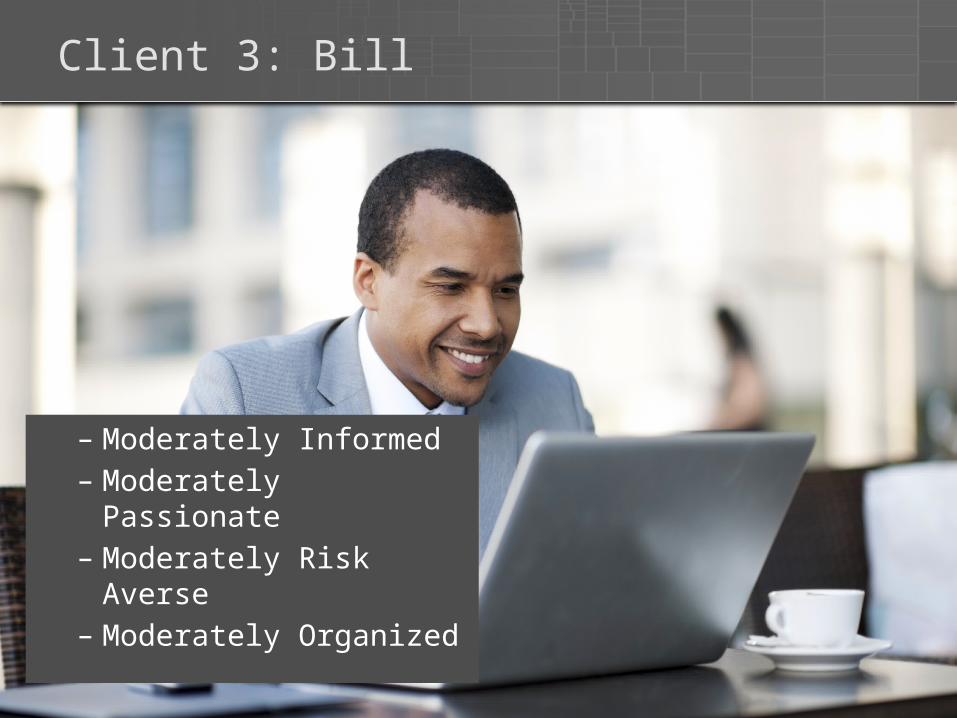
Client 3: Bill
– Moderately Informed– Moderately Passionate– Moderately Risk Averse– Moderately Organized

Client 3: First Visits
• Traditional Cognos developers
• No obvious leaders or decision-makers
• Demo of Desktop and Server; business needs discussion
• Bill: – Build production-grade dashboard with surprise
data in an hour• BI “shock value;” break team out of cube-limited mindset

Client 3: Incremental Steps and Results
• Bill needed tangible Tableau products and a roadmap for enterprise license
• As new Cognos development slowed, Bill needed to keep those developers busy
• We trained his Cognos developers globally
• Implementation plan built focused on:– Data governance– Change management– Current data architecture
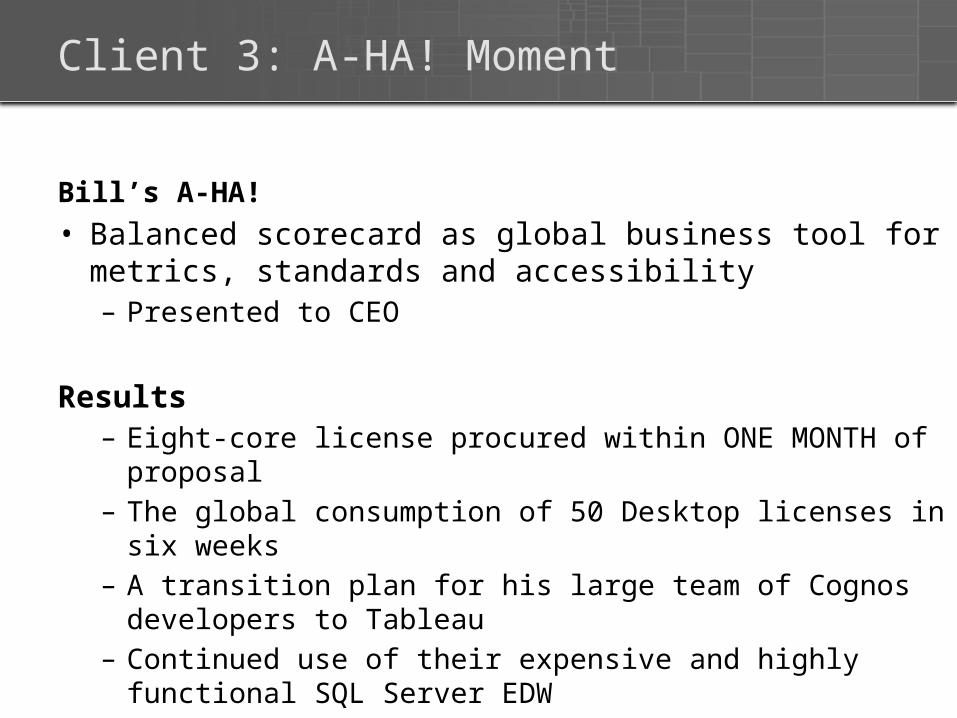
Client 3: A-HA! Moment
Bill’s A-HA!• Balanced scorecard as global business tool for
metrics, standards and accessibility– Presented to CEO
Results– Eight-core license procured within ONE MONTH of
proposal– The global consumption of 50 Desktop licenses in six
weeks– A transition plan for his large team of Cognos
developers to Tableau– Continued use of their expensive and highly functional
SQL Server EDW

Client 4: Graham and Andy
– Highly Informed– Passionate!– Moderately Risk Averse– Well Organized

Client 34 Challenges
Graham and Andy’s challenges were multiple:• Team’s unfamiliarity with Tableau, lack of time
to learn it quickly• 5+ regions of business consumers
• Varied greatly in culture• Various proficiencies with BI tools, size, priorities and
integration with other groups
• Six weeks to build University framework—and no budget
• Team feared change

Client 4: Our Approach
• Building trust
• Best practices documentation for Tableau University
• A-HA! moments occurred in each region:– Leaders recognized:
• Clear vision for using Tableau• Value easy to communicate across organizations

Client 3: Our Tactics
• Industry-customized standard Desktop training program
• Six-month training schedule
• Results– Consistent messaging throughout the country– Excellent collaboration with IT partners who manage
licensing and Server environments— new relationship formed in a year
– Filled training classes within a week of opening (25 – 30 students)
– Proven medium for introducing new tools to business customers

Conclusion
• Aha! moments for our clients – recognizing Tableau value add to their organizations
• Most challenges are around change management or politics, not the tool itself
• It’s not the specifics of the objection that matters—but rather the cause of the objection, which usually reveal themselves over time
• Provide patient consistency, investments of knowledge and time, and an organization-wide ethos of service
• Helping clients discover time and cost savings with Tableau

PROVIDE SESSION FEEDBACK
Go to:http://partner15.tableau.com/vegas/survey/salesmarketingtrack
OR
Go to the Mobile App, Summit15, and find this session and in the session description is the survey link.
Thank YouE-mail [email protected] with questions