partner for success - uba ghana
TRANSCRIPT

Excellent Service…Delivered
Excellence. Execution. Enterprise
Customer Fulfillment Centre+233 (0) 302 634 [email protected]
20
18
AN
NU
AL R
EP
OR
T AN
D A
CC
OU
NTS
UN
ITED
BA
NK
FOR
AFR
ICA
(GH
AN
A) LIM
ITED
ANNUAL REPORT & ACCOUNTS 2018United Bank for Africa (Ghana) Limited
� � � � � � �� �� �� � � � �� � � �
PARTNERFOR SUCCESS

Africa’s global bank
UNITED BANK FOR AFRICA (GHANA) LIMITED

We are committed
to strengthening
partnerships and working
closely with our clients
towards our shared goals
of growth
and development.
Enterprise. Excellence. Execution.

3United Bank for Africa (Ghana) Limited2018 Annual Report
Contents
Inside this report
Business Overview
Corporate Governance
Financials
Corporate Information
Business Review
Corporate Responsibility And Sustainability
• Corporate Profile
• 2019 Outlook
• Ghana Footprint (Locations &
Offices)
• The Board
• Executive Committee
• Directors’ Report
• Corporate Governance Report
• Independent Auditors’ Report
• Statement of Profit or Loss and
other Comprehensive Income
• Statement of Financial Position
• Statement of Changes In Equity
• Statement of Cash Flows
• Notes
• Corporate Information
• Notice of Annual General Meeting
• Proxy Form
• Branch Networks and ATM
Locations
• Chairman’s Statement• Managing Director’s Report• Ghana Economic Outlook• Digital Banking Report
• UBA Foundation National Essay
Competition
• Jogging to Bond
14
5
6
2
3
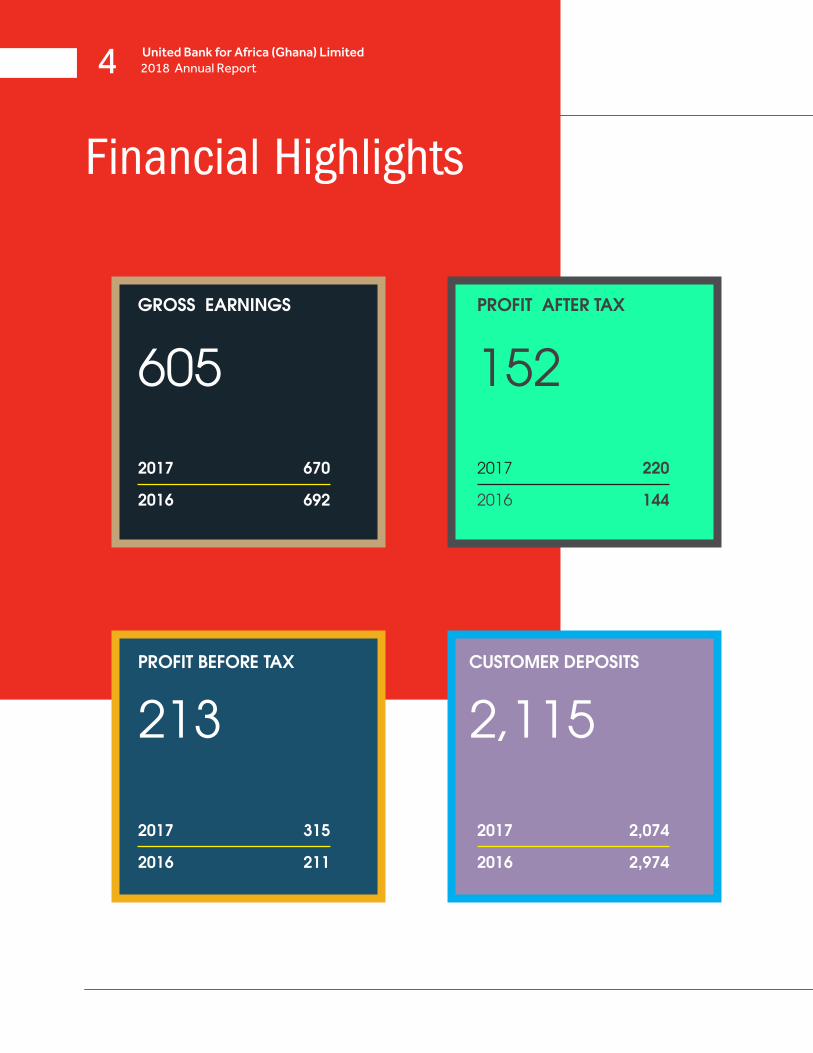
Financial Highlights
4 United Bank for Africa (Ghana) Limited2018 Annual Report
GROSS EARNINGS
PROFIT BEFORE TAX
PROFIT AFTER TAX
CUSTOMER DEPOSITS
605 152
2,115213
2017 2017
20172017
670 220
2,074315
2016 2016
20162016
692 144
2,974211

5United Bank for Africa (Ghana) Limited
LOANS SHAREHOLDER’S FUNDS
TOTAL ASSETS
634 642
3,564
2017 2017
2017
1,099 549
2,963
2016 2016
2016
1,846 329
3,743
2018 Annual Report
2018 2017 2016
Gross earnings 605 670 692
Profit before tax 213 315 211
Profit after tax 152 220 144
Customer deposits 2,115 2,074 2,974
Loans 634 1.099 1,846
Shareholder’s funds 642 549 329
Total assets 3,564 2,963 3,743
“In 2018, we saw responsible growth at work for shareholders, customers and clients, the communities we serve, and our teammates.”


A brief review of the Bank’s Financial and Operational performance in the past year
Corporate Profile
2019 Outlook
Ghana Footprint (Locations & Offices)
08
09
10
BusinessOverview
1

United Bank for Africa Plc
Corporate Profile8 United Bank for Africa (Ghana) Limited
2018 Annual Report
January 2005, a pioneering year for United Bank for Africa (Ghana) Limited, as they chartered a new path of entry into Ghana, birthing a new generation of foreign banks and changing the landscape of relationship banking.
The vision and strategy of Pan-Africanism was simultaneously birthed by United Bank for Africa (UBA) Plc which until that moment was simply a leading financial service bank operating in all regions of Nigeria. When the subsidiary in Ghana was created, UBA then grew into group status in Sub-Saharan African region, now with presence in 20 African countries: Ghana, Benin Republic, Cote d’Ivoire, Burkina Faso, Guinea, Chad, Cameroon, Kenya, Gabon, Tanzania, Zambia, Uganda, Liberia, Sierra-Leone, Mozambique, Senegal, Congo DR, Congo Brazzaville, and Mali, as well as United Kingdom, United States of America and France. 2005 was truly historic for UBA as it was in this same year it completed one of the biggest mergers in the history of Nigeria’s capital markets with the business combination of Standard Trust Bank (STB) Plc and the then United Bank for Africa.
The origin of UBA dates back to 1949 when it was first referred to as the British and French Bank Limited (BFB). It took over the assets and liabilities of BFB and was incorporated as a limited liability company on 23 February, 1961 under the Compliance Ordinance (Cap 37) 1922.
UBA was the first Nigerian bank to make an Initial Public Offering (IPO), following its listing on the Nigerian Stock Exchange (NSE) in1970. It was also the first bank to issue Global Depository Receipts (GDRs).
Who We Are
“We work for one of the strongest and most successful financial services institutions in Africa. Our bank, the United Bank for Africa and our brand have grown significantly and require no introduction across our Continent. We should be proud of what we have achieved and I look forward to welcoming further countries into our family this year, as we deliver on our promise to be Africa’s Global Bank.” Kennedy Uzoka UBA GMD, Jan 2017.
UBA is a full financial service institution offering a plethora of unique banking products and services. As Africa’s global bank, UBA Ghana has developed a branch footprint and delivery network that has ensured that the bank’s services are always within the reach of valued customers. In line with the bank’s positioning statement and strategic intent, UBA Ghana has a footprint of 26 fully networked branches, 2 agencies and close to 60 visa enabled ATM’s spread across Accra, Tema, Tarkwa, Tamale, Takoradi, Kumasi, and Aflao.
What We Do
United Bank for Africa (Ghana) Limited, is a subsidiary of the United Bank for Africa Plc which is one of Africa’s leading financial institutions with assets in excess of US$20 billion and offering services to more than 7.5 million customers across 850 branches and over 2000 ATMs in 20 African countries.
The bank’s new goal is simple. Excellent Service …Delivered. We have interrogated ourselves, our processes and the evolving internal and external environments. We have challenged who we are, what we want to be known for and how we want to do business. This exercise, has given us a new Corporate Goal: ‘Excellent Service…Delivered’.
To deliver this, we have fundamentally refined our Core
Values, to ensure our commitment to deliver:
Enterprise. Excellence. Execution (EEE).
These values will drive all our actions towards our internal and external customers. Since August 1, 2016, we have directed efforts in the three critical areas:
• Deployment of customer focused IT systems
• Re-engineering our processes to speak to what the customers really need; and
• Creating a workforce of engaged and productive People.
Our People:
People are central to our new Corporate Strategy.
Our Processes:
Our Processes speak to how we serve our customers. We are challenging the status quo, to completely align our processes ground-up from the customer’s perspective.
Our Technology:
We have continued to increase investment in Information Systems (IS) and Digital Banking Channels reliability to attain overall positive customer experience.
With presence in New York, London and Paris, UBA is connecting people and businesses across Africa through retail and corporate banking and our innovative Africa Trade Platform.
UBA Plc has been rated by “the Financial Times Magazine” as one of the five African banks in the top global 500 banks and the second fastest growing brand in the world and by the Boston Consulting Group as one of the top “40 African Challengers” on account of globalization, workforce and asset diversity, cash flow and leverage ratio.
UBA VISION
To be the undisputed leading and dominant financial services institution in Africa.
UBA MISSION
“We shall be a role model for African businesses by creating superior value for all stakeholders; abiding by the utmost professional and ethical standards and building an enduring institution”
CORE VALUES
Our corporate identity rests on our core values. These values are: Enterprise . Excellence . Execution
United Bank for Africa (Ghana) Limited
Corporate Profile9United Bank for Africa (Ghana) Limited
2018 Annual Report
Our objective has been to become Africa’s leading and most respected Pan African bank. Our purpose is to be where the growth is, connecting customers to opportunities. We have engaged businesses to discover their potential and to prosper, by helping people fulfill dreams and realize their ambitions. We have developed the primary strategy of our Parent company into our own secondary and tertiary strategies that reflect our purpose and distinctive advantage:
• To be a fully automated network of business offices connecting Ghana to Africa and the world. We are well positioned to capture intercontinental trade and to be the conduit for capital inflows. Our reach and range of services place us in a strong position to serve clients as they grow from small enterprises into diverse businesses all over Ghana and Africa.
• To combine sound financial management with a delicate mix of some embryonic and some maturing wholesale and retail banking on a local scale with a global view: we aim to make the most of opportunities arising from the developing economy we deal in along with the demographic changes in our dynamic industry sectors. We will study the pace carefully and deal in full-scale private and public sector markets and businesseswhere we can achieve profitable margins at varying levels.
As the flow of goods, agriculture, oil and gas services as well as trade continues to expand, driven by the new FinTech revolution of mobile money, digital and virtual banking and technology, we in turn expect to be within and amongst the top tier in Ghana, becoming strong enough to be termed a Systemically Important Bank.
The growth of our industry is bringing the people of Ghana into the global middle class, and United Bank for Africa (Ghana) is one of the few truly Pan African banks with the financial backing as well as trade and capital flows that can connect our customers to the fastergrowing and developed markets. We have a diversified banking model that supports a strong capital and funding base, reduces our risk profile and volatility, and generates stable shareholder returns. These are distinctive competitive advantages that the Bank will bring to its customers, going forward.
2019 Outlook
The Ghanaian economy is projected to grow by 8.8% in 2019 according to International Monetary Fund (IMF). This would be influenced by an increase in commodity prices and production volume as well as reforms embarked upon in the previous years. Based on the expected growth, UBA Ghana has identified new opportunities in the economy for significant growth of our business. In this year, our focus is to:• Increase our market share significantly by
delivering excellent service to meet the ever changing needs of customers.
• Increase internal efficiency by automating most of our manual processes with the view of satisfying our customers.
• Continue with our innovation culture in product and service delivery by increasing our investment in digital banking to generate a minimum of 25% of the Bank’s revenue.
• Enhance our staff productivity by continuously training employees to deliver on the job and reduce attrition rate significantly.
• Build on our reputation for compliance with all relevant regulations.
Our desire in delivering excellent customer services has enabled the bank to invest in robust technological platform and talented workforce to provide prompt, flawless and innovative banking products and services to customers. Considering that we operate in a rate sensitive environment, we will continue to deploy robust risk management practices and systems that will be able to identify, measure and monitor the various risks associated with our business. Leveraging on the positive market conditions and our strong balance sheet, our bank is positioned to grow and return value to all stakeholders especially our shareholders. We will harness all our resources in a customer centric manner to deliver sustainable and superior shareholder value with employees motivated to deliver our core values.

10 United Bank for Africa (Ghana) Limited2018 Annual Report
We are expanding our footprints to new capital cities and major commercial centres. Today, we are a true national bank, helping to create new possibilities for business across Ghana.
Greater Accra Region
Head Office
Accra Central
Kantamanto
Achimota
Ring Road
Labone
Abossey Okai
North Industrial Area
Dzorwulu Central
Airport
Abeka Lapaz
Madina
Spintex
Teshie
Tema Community 1
Tema Community 4
East Legon - American House
East Legon - Lagos Avenue
Ashanti Region
Adum
Kejetia
Tanoso
Alabar
Suame
KNUST
Western Region
Takoradi
Tarkwa
Volta Region
Aflao
Northern Region
Tamale

BusinessReview
2
A summary of the changing landscape we operate in, and how that has shaped our
strategy and financial position
Chairman’s Statement Managing Director’s Report
Ghana Economic OutlookDigital Banking Report
12
15
18
20

12 United Bank for Africa (Ghana) Limited2018 Annual Report
Chairman’sReportKenneth Chikezie OrjiChairman

13United Bank for Africa (Ghana) Limited2018 Annual Report
Dear Shareholders,
It is with great pleasure that I present to you, the annual report of our Bank, United Bank for Africa (Ghana) Limited, for the 2018 financial year. Despite a rather challenging operating environment in 2018, I am pleased to report that your Bank defied these challenges to record creditable financial performance indices for the financial year. It was certainly a year in which we proved the resilience of our business model, effective Board oversight as well as the dedication of Management and staff.
Following your approval for the transfer of the sum of GHS 325 million from income surplus to stated capital in compliance with the new minimum capital requirements, I am pleased to inform you that your Bank met the minimum capital requirement before the 31st December 2018 deadline stipulated by the Bank of Ghana. With the successful conclusion of the recapitalization exercise, we are better placed to fund bigger ticket transactions and actively support growth of the key sectors of the economy. My colleagues and I who represent you as Directors on the Board remain committed to supporting Management towards achieving our collective aspiration of being a Systematically Important Bank in Ghana, with dominant market share in key sectors of the economy.
I will like to start by highlighting some of the key global and local events that characterized the year after which I will review our performance and outlook.
Global events
Global economic growth momentum remained steady in 2018, buoyed by strong fiscal expansion in the United States of America, which largely offset slower growth in some other large economies such as China, Germany, United Kingdom and Turkey.
Global economic growth according to the International Monetary Fund(IMF) is estimated at 3.7% in 2018 compared to 3.5% in 2017. The improvement is expected to be largely driven by accelerating growth in developed economies, a steady performance in East Asia, and recovery from recession in several developing and transition economies. In Sub-Saharan Africa, growth was estimated to have inched up to 2.9% in 2018 compared to 2.8% in 2017, supported by rising commodity prices, stronger household demand, and improved economic activities in the large economies of Nigeria and South Africa.
Global growth forecast for 2019 has been revised downward to 3.5% partly because of the negative effects of tariff increases enacted in the United States and China early in 2019.
Operating Environment: Macro-economic and Banking Industry Developments
Ghana’s economy enjoyed relative stability in 2018 following the economic recovery experienced since the second half of 2017. Headline inflation declined from 11.8% in December 2017 to 9.4% in December 2018 reaching the single digit benchmark and drawing closer to the Bank of Ghana’s medium-term target band of 8±2%.
This coupled with other positive factors underpinned the gradual reduction of the policy rate by the Bank of Ghana from 20% in December 2017 to 17% at the end of December 2018. Despite this, the 91-day treasury bill rate increased from 13.3% in December 2017 to 14.6% in December 2018 after months of continuous decline. The Ghana Reference rate introduced in April 2018, as a key determinant of average lending rates also declined to 16.61% in December 2018 compared to 16.82% in June 2018. With respect to exchange rates, the Cedi depreciated by 8.4%, 3.3% and 3.9% against the US dollar, the
Pound sterling and the Euro respectively during the period under review, with this trend continuing into the first quarter of 2019.
Ghana’s overall GDP growth for 2018 is projected at 5.6%. The economy is expected to witness improved performance as the government implements its key industrial and economic policies supported by pick up in lending following the reforms undertaken in the banking sector. The growth in lending is expected to boost growth in industrial activities in the economy and also lead to growth in private consumer demand.
The banking sector witnessed significant reforms during the year. First was the revocation of the licenses of five insolvent Banks; UniBank Ghana Limited, The Royal Bank Limited, Beige Bank Limited, Sovereign Bank Limited and Construction Bank Limited in August 2018 and merged as Consolidated Bank Ghana limited. This came on the back of the reported insolvency and undercapitalization of these Banks.
2018 also saw the conclusion of the recapitalization exercise for the banking sector. Following the recapitalization exercise which ended on 31 December 2018, 23 banks met the new minimum paid-up capital of GHS 400 million and are currently operating as universal banks in Ghana. Consequently, First Atlantic Bank Limited merged with Energy Commercial Bank, Omni Bank with Bank Sahel Sahara and First National Bank with GHL Bank, with the three resulting banks from the mergers meeting the new minimum capital requirement. GN Bank however downgraded to a Savings and Loans Company. Following these reforms, we expect a stronger and more stable banking sector.
Following the recapitalization, total assets in the banking sector was GHS107.3 billion in December 2018 representing an annual growth of 14.7%, compared to GHS 93.6 billion in December 2017. While loan growth was subdued in 2018, as banks focused on NPL resolution and recapitalization, asset quality improved as industry non-Performing Loans(NPLs) declined by 18.9% to GHS 6.5 billion in December 2018 from GHS 8.19 billion in December 2017. Accordingly, the ratio of NPLs to gross advances declined to 18.2% in 2018 from 21.6% in 2017.
Financial Performance
Despite the challenging operating environment, our Bank remained resolute in achieving robust growth in total assets while maintaining sustainable profitability. This was achieved through robust risk management practices and adhering to the implementation of our strategic objectives as a Bank. We recorded interest income of GHS 511million coupled with an impressive growth in non-interest income, from GHS 73million in 2017 to GHS 93million in 2018. In relation to costs, the Bank sustained its prudent cost optimization measures while also relying on our investments in digital channels to drive a 39% year-on-year reduction in operating expenses from GHS 107 million in 2017 to GHS 66million in 2018, resulting in a 28% cost-to-income ratio for the year, down from 32% in 2017.
Overall, we closed the year with a creditable profit before tax of GHS 213 million and profit after tax of GHS 152 million. Despite the decline in profitability compared to 2017, our key profitability indicators remained strong as we posted return on assets and return on equity of 5% and 25% respectively. The Bank’s total assets grew significantly by 21% to GHS 3.56 billion in 2018 compared to GHS 2.96billion in 2017, driven mainly by growth in deposits and shareholders’ funds. Overall, deposits from customers and banks increased by 16% from GHS 2.3 billion in 2017 to GHS 2.7 billion in 2018. Shareholders’ funds also increased by 21% from GHS 549million in 2017 to GHS 662 million in 2018, following our decision to fully retain profits for

14 United Bank for Africa (Ghana) Limited2018 Annual Report
the year and transfer same to stated capital.
Our liquidity and capital adequacy ratios are positive at 86% and 28% respectively, a pointer to the efficiency of our balance sheet and an indicator that there is head room for further growth especially in risk asset creation.
We remain focused on driving sustainable growth for the Bank and will continue to take advantage of emerging growth opportunities to ultimately deliver compelling returns to shareholders in the years ahead.
Corporate Governance
Our Bank remains committed to the highest standards of corporate governance through the effective functioning of the Board. Globally, the banking sector continues to undergo a range of reforms resulting in tighter and more stringent regulations. On the domestic front, the Bank of Ghana took several measures in 2018 aimed at building a stronger and more robust banking sector and strengthening the corporate governance structures of financial institutions.
Some of these new regulations include; the Corporate Governance Directive 2018, Financial Holding Companies Directive, Fit and Proper Directive and the Bank of Ghana Cyber and Information Security Directive. The Bank remains committed to high corporate governance standards and has put in place the necessary steps to ensure full compliance with these regulations. We will continue to inculcate the culture of ethical banking through the implementation of a robust management framework to guide all staff in their daily working activities. In as much as our clients may occasionally feel frustrated by the stiff enforcement of these governance obligations, overtime it will become clear that a robust environment is in the best interest of all stakeholders.
Directorship
The Banks’ Board is composed of diverse and committed group of directors who continuously contribute their sound business insight and expertise to our Bank. During the course of the year, Prof. Kwamena Ahwoi and Mr. Samuel Ofori-Adjei, Non-Executive Directors of our Bank, retired after serving their statutory tenures for non-executive directors. Mr. Soni Awal, an Executive Director also resigned from his position effective 31 December 2018, in order to pursue other personal interests. We take this opportunity to thank all for their valuable contributions over the years.
I am also pleased to inform you that the Board has approved the appointment of Mr. Isong Udom as MD/CEO as successor to Mrs Abiola Bawuah who has been elevated to the position of Regional CEO for UBA West Africa 1 Region. I wish to specially thank Abiola for her service and dedication over the last six years and wish her all the best in her new role. I also take this opportunity to welcome Isong to the Board and assure him of our full support to take the Bank to greater heights.
Corporate Social Responsibility
In fulfilling our objectives of giving back to the society, the Bank undertook several CSR initiatives that impacted a lot of lives within Ghana. Through “the Read Africa” project we donated about 3,000 books to Senior High Schools across the country aimed at encouraging African youth to improve their vocabulary and communication skills through reading. The Bank, with the endorsement of the Ghana Education Service and Ghana Library Authority, also organized the fifth National Essay Competition for students in the senior cycle institutions. Winners of the competition were awarded scholarship and educational
packages. We also supported the renovation of the ceremonial grounds of Ghana National College in Cape Coast.
Awards
I am proud to mention that our Bank won two major corporate social responsibility awards in recognition of our support to education and youth development at the second edition of the Sustainability and Social Investment (SSI) Awards. We were recognised for the best company in Educational Sustainability programme and Youth Development Program.
Outlook
We look forward to 2019 with great optimism following the reforms undertaken in the banking sector coupled with a favourable domestic and global economic outlook. I believe we have the right business strategy, required staff with the right business insight and expertise to exploit emerging business opportunities to deliver superior returns to our shareholders.
We will continue with our digital transformation agenda by leveraging on technology to take our business closer to our customers. This we believe will help us improve services to our customers, create sustainable value for all stakeholders while minimizing and diversifying our risk. The Board is confident of the ability of management and staff to seize the right opportunities to deliver on our set goals for growth while effectively responding to the challenges that can potentially undermine the Bank’s performance. The Board, on its part, will sustain its effective oversight and strategic guidance to Management.
Conclusion
On behalf of the Board, I would like to thank our stakeholders especially customers for their continued support and patronage of our brand over the years. I will also like to sincerely thank our shareholders for the support and encouragement we have received over the period. Further thanks goes to my fellow Board members for their enormous commitment and advise which has greatly benefited the bank.
Finally, I am grateful to management and staff for their dedication, hard work and tireless efforts in executing the Bank’s strategy with diligence and passion. I believe we can continue to count on you in 2019.
Thank you.

15United Bank for Africa (Ghana) Limited2018 Annual Report
ManagingDirector’sReport
Abiola BawuahMD /CEO

16 United Bank for Africa (Ghana) Limited2018 Annual Report
Distinguished Shareholders,
It is my pleasure to present to you highlights of the Bank’s performance for the year ended 31 December 2018. This being the final year of my stewardship, I would like to start by expressing my profound gratitude to all shareholders for the trust and confidence you have placed in the Board and Management of the Bank. I would also like to thank the Board of Directors for their unflinching support and guidance throughout this journey. My special thanks also goes to our esteemed customers who are the essence of our corporate existence and whose loyal patronage has been the source of our success over the years.
Our primary goal remains to consistently deliver superior returns to our shareholders. We however remain steadfast in our dedication to the success of our customers, the development of our community and the growth of the broader economy in which we operate. To achieve this, we are continuously investing in our people, processes and technology in order to meet and surpass the anticipated needs of our customers. Our primary objective is to support individuals, businesses and institutions to conduct their financial transactions in the most seamless, fast and cost-efficient way possible. As we continue to invest in our human capital and technology to drive these objectives, I am very optimistic about the future of our business and our ability to consistently deliver superior value to our stakeholders in order to achieve our strategic aspiration of becoming a Systematically Important Bank (SIB) in Ghana.
I would now like to provide a brief background to the Bank’s financial performance in 2018, referencing a number of macroeconomic and industry developments that shaped the operating environment in 2018.
The Operating Environment
2018 was a very eventful year marked with movements in key macroeconomic indicators coupled with the conclusion of major banking sector reforms on the domestic front. I will present the key factors driving the operating environment along two thematic areas; Macroeconomic Indicators and Banking Sector developments.
Macroeconomic Indicators
The global economy continued to expand in the first half of 2018 but the momentum moderated in the third quarter driven by a slow-down in growth in the advanced economies and some large emerging market economies. Emerging markets and developing economies experienced several external shocks from early in the second quarter arising from rising oil prices, higher yields in the United States, dollar appreciation as well as trade and geopolitical tensions. In Sub-Saharan Africa, growth was estimated to have inched up to 2.9% in 2018 compared to 2.8% in 2017, supported by rising commodity prices, stronger household demand, and improved economic activities in the large economies of Nigeria and South Africa.
The developments in the external environment had positive implications for the domestic Ghanaian economy. Developments in the real sector indicated firm growth trends in 2018 though at a slower pace compared to 2017. Real GDP growth in the first three quarters of 2018 averaged 6.1%, down from 9.1% in the same period of 2017. Similarly, non-oil GDP growth averaged 5.9% against 6.1% in the comparative period. Overall GDP growth for 2018 is projected at 5.6%.
The downside risks from a strengthening US dollar and increased domestic pressures caused the Cedi to depreciate cumulatively by 8.4% in 2018 compared to 4.9% in 2017. However, the cedi depreciated more moderately against the pound and euro by
3.3% and 3.9% respectively, compared with 12.9% and 16.2% depreciation in 2017. In line with the medium-term target band of 8+/2%, inflation declined to single digit levels of 9.4% at the end of the year representing a 2.4% decline from 11.8% in 2017. The declining inflation trend is supported by the relatively tight monetary policy stance maintained throughout the year.
Driven by the benign inflation outlook, the Monetary Policy Committee (MPC) reduced the Monetary Policy Rate(MPR) by 300 basis points to 17% in 2018 from 20% recorded at the end of 2017. Developments in the money market however reflected an upward trend in interest rates at both the short end and medium-term segments of the market. The 91-day treasury bill rate steadily increased from 13.3% in December 2017 to 14.6% in December 2018. Also, rates on the secondary bond market have increased, reflecting tight financing conditions. Conversely, the weighted average interbank lending rate, that is, the rate at which commercial banks lend to each other, declined to 16.1% in December 2018 from 19.3% in the same period last year.
Banking Sector Developments
In August 2018, the Bank of Ghana announced the revocation of the licenses of five (5) banks namely Unibank Ghana Limited, The Royal Bank Limited, Beige Bank Limited, Sovereign Bank Limited and Construction Bank Limited and appointed KPMG as the Receiver. The Bank of Ghana also announced that it had granted a universal banking license to Consolidated Bank Ghana (CBG) Limited, established by the Government of Ghana. The deposits of the 5 banks whose licenses were revoked were transferred to CBG. Following the conclusion of the banking sector recapitalization exercise in December 2018, the licenses of Premium Bank and Heritage Bank were also revoked due to insolvency and inability to meet the minimum capital requirements. Selected assets and liabilities and all deposits of these two banks were also transferred to CBG.
The recapitalization exercise in the banking sector ended in December 2018, with a total of 23 banks meeting the minimum capital requirements. These banks are now sound, liquid and well-capitalised and well positioned to play a key role in economic growth as banks are expected to deploy their newly injected capital towards financial intermediation. Sixteen (16) banks met the minimum capital requirements without mergers while three (3) banks met the requirements through a merger. Four (4) other indigenous banks are to receive fresh capital injection from private pension funds through a special purpose holding company named Ghana Amalgamated Trust Limited (GAT). UBA Ghana was able to recapitalize solely from its internally generated capital without having to secure additional capital either from internal or external sources.
At the end of December 2018, total banking industry assets stood at GHS 107.3 billion a 14.7% year-on-year growth with the growth mainly funded by increase in deposits and shareholders’ funds. Total deposits increased by 17.3% year-on-year to GHS 68.3 billion while total shareholders’ funds more than doubled to close at GHS 10.9 billion in December 2018. Credit growth was however subdued in 2018, as banks focused on NPL resolution and recapitalization, ahead of the December 31, 2018 deadline. Nonetheless issues with high industry non-performing loans are yet to be fully resolved in spite of the implementation of the Bank of Ghana’s loan write-off policy. Average industry NPL’s stood at 18.2% as at December 2018, a slight decline from 21.6% in 2017.
In the course of the year, the Bank of Ghana introduced the Ghana Reference Rate (GRR) with the motivation of having
17United Bank for Africa (Ghana) Limited2018 Annual Report
changes in the market rates transmitted to lending rates. The GRR framework is moving towards a more market based model purely on market rates. Unlike the base rate model where it was the minimum lending rates for banks, the GRR is only a reference rate and banks are required to either add or subtract a risk premium which is customer specific.
Following the introduction of the GRR, the weighted average lending rate reduced from 19.3% in December 2017 to 16.1% in December 2018. Also, the average lending rates of banks declined by 2.4% in 2018 to 26.9%. The GRR also reduced by 0.55% since its introduction in April 2018 to close at 16.61% in December 2018.
Financial Highlights
Despite the challenging and highly competitive operating environment, UBA Ghana leveraged our franchise and grew market share across our key focus sectors by increasing our share of existing customer’s wallet while also onboarding new customers. Overall, we grew total assets by GHS 618 million representing 21% increase to GHS 3.6 billion for 2018. This growth was largely funded by growth in deposits, borrowings from multi-laterals and growth in shareholders’ funds through prudent earnings retention. Despite the tight liquidity in the market, we recorded modest growth in customer deposits to close at GHS 2.11 billion at the end of the year. More significantly, we grew retail deposits by 19% year-on-year to close at GHS 950 million, as we leveraged our efficient digital channels to mobilize low cost deposits while also delivering innovative product offerings.
We recorded profit before tax of GHS 213.4 million and profit after tax of GHS151.9 million translating to an impressive 25% return on average equity and a 5% return on assets. Year-on-year, profit before tax however declined by 32% largely driven by a reduction in net interest income arising from structured pay-downs on major loan exposures coupled with lower yields on treasury instruments especially in the first half of the year. PBT for the year was also impacted by the first-time adoption of IFRS 9 which contributed to an increase of GHS 63.2 million in impairment charges from GHS 34.5 million in 2017 to GHS 97.7 million in 2018.
We however leveraged our transaction banking channels and trade product offerings to grow our non-interest income by an impressive 59% year-on-year. While our non-funded income for 2018 still represents about 15% of our gross earnings, we are optimistic that our novel investments in alternative channels will support the growth of these income lines which we believe should contribute 40% of gross earnings in the medium term. We are beginning to yield the benefits of these investments on our cost efficiency as we recorded year-on-year decline of 39% in operating expenses and closed the year with an impressive 28% cost-to-income ratio. Furthermore, our balance sheet liquidity ratio of 86% and relatively low loan-to-deposit ratio of 30% reinforces our capacity for further growth.
With the successful conclusion of our recapitalization exercise to meet the minimum capital requirement of GHS 400 million, we are better placed to fund bigger ticket transactions and actively support growth of the key sectors of the economy. While we will continue to strategically expand our physical distribution coverage through branches, we will also leverage our electronic self-service channels as a convenient value proposition and cost-efficient alternative to our network of brick and mortar branches.
Strategic Aspirations and Outlook
In the face of growing competition and increasing technology coupled with the changing dynamics in the Ghanaian banking sector, UBA Ghana remains unflinching and committed towards achieving its strategic aspiration of becoming a Systematically Important Bank in Ghana. In this light, we shall continue to focus on:
1.Significantly growing our market share by continuing to create value for our customers. Our age-long essence is to serve our customers, enabling individuals, households, businesses and governments fulfil their financial purpose.
2.Driving internal efficiency by reducing all process steps by 50% in order to provide faster, convenient and seamless service to our esteemed customers.
3.Sustaining our culture of innovation in service and product offerings by investing new technologies for digital banking.
4.Enhancing people productivity by retooling our talent and performance management, ensuring that we put our rich human capital resources in their best fit while reducing regrettable attrition to the barest minimum.
5.Build on our reputation for compliance with all relevant regulations with zero tolerance for regulatory infractions and penalties.
It is my firm belief that unwavering execution of our key imperatives will position the Bank to fulfil the expectations of all our stakeholders in the coming years.
Passing the Baton
As you may be aware, effective 31 December 2018, I am stepping down as MD/CEO of UBA Ghana, following my appointment as Regional CEO of UBA West Africa 1 region. I have served as MD/CEO for four years prior to which I served as Deputy Managing Director for two years. During this time, we have gone through periods of prosperity and challenges, emerging a bigger and stronger bank and better focused on our vision of becoming a Systematically Important Bank in Ghana. We have supported major public and private sector projects and played our role in the development of the Ghanaian economy. All these have been made possible by the commitment shown by the UBA workforce and the continued support of our customers, Board and shareholders.
After due consideration, the Board of Directors approved the appointment of Mr. Isong Udom as my successor. This appointment has also been approved by the Bank of Ghana. Mr. Udom comes with vast experience in corporate and commercial banking having served in the banking industry for over twenty years. Prior to his appointment, Mr. Udom was the MD/CEO of UBA Cameroun, one of UBA Plc’s largest subsidiaries by balance sheet size. At various times, Isong has also served as Deputy Managing Director of UBA Cameroun and briefly as MD/CEO of UBA Guinea. A seasoned professional, Isong has operated at Executive Management level for over ten years, initiating and implementing strategic policies across the UBA Group. I am confident that he will build on the foundations that have been established and project the Bank through its next growth phase.
I wish to specially thank you, our shareholders for the opportunity to serve you and your support during my tenure. The race we run is a marathon and as I pass the baton to Mr. Udom, I ask you all to extend the same support to him so that together, we can deliver the bank of our dreams.
Thank you.

18 United Bank for Africa (Ghana) Limited2018 Annual Report
Ghana’s macroeconomic performance in 2018
The Ghanaian economy is projected to have underperformed in 2018 relative to its real GDP growth in the preceding year. Ghana’s GDP is estimated to grow by 6.8% in 2018 compared to 8.5% growth recorded a year earlier; thus 1.7 percentage points lower (Ghana’s Budget Statement, 2019). With estimated population of about 29.8 million, Ghana’s per capita income is projected to end 2018 at US$ 1,786 (GHS8,609) relative to US$ 1,708 (GHS7,541) recorded a year earlier.
Per 2019 Budget Statement, Ghana’s overall fiscal deficit on cash basis is estimated to improve markedly to 4.5% of GDP relative to the 6.5% fiscal deficit recorded in 2017. The estimated 2.0 percentage points reduction in overall fiscal deficit on cash basis is anchored on fiscal discipline, improved oil and domestic tax revenues as well as conscious steps taken by Government of Ghana to contain expenditure overruns.
Accordingly, Ghana’s trade balance improved significantly and recorded 2.7% GDP surplus at the end of 2018 compared to 2.3% of GDP deficit recorded a year earlier, predicated on 46.8% increase in Ghana’s Oil export proceeds during the period. However, Ghana’s Gross International Reserves in 2018 declined to 3.7 months import cover compared to 4.3 months import cover recorded at the end of 2017. Meanwhile, Ghana’s rebased debt-to-GDP ratio improved to an estimated 57.9% at the end of November 2018 financial year.
Interest rates
Interest rates generally responded positively to the improved economic conditions, subdued inflationary pressures and relative stability in the value of Ghana Cedi in 2018. The Central Bank of Ghana subsequently responded to the positive economic indices and reduced monetary policy rate by 300 basis points to 17.0% in 2018 from 20.0% recorded at the end of 2017. Consequently, average interbank lending rates declined by 339 basis points and stood at 15.95% in 2018 from 19.34% recorded at the same period a year earlier. Consistently, average lending rate decreased by 2.44 percentage points to end 2018 at 26.86% relative to 29.3% recorded at the end of 2017. The 91 and 182-day Treasury bill rates increased by 123 and 124 basis points to record 14.56% and 15.02% respectively while, the 1- year fixed note rate remained flat 15.0% in 2018.
Exchange rates
In 2018, the Ghana Cedi fell against the major trading currencies. The local currency depreciated by 8.4% against the US dollar compared to 4.9% depreciation it managed a year earlier on the interbank market. The local currency relatively performed better in 2018 against the British Pound recording 3.3% depreciation compared to 12.9% recorded during the same period a year earlier. It also depreciated by 3.9% against the Euro in 2018 compared to 16.2% depreciation it managed in 2017. The relative decline in the value of Cedi against the major trading currencies especially the US dollar in 2018 is
attributed to significant decline in Ghana’s Overall Balance of Payment surplus position of 1.9% of GDP at the end of 2017 to 1.0% of GDP deficit at the end of 2018. This was on the back of over 93% drop in capital and financial account balance that moved from USD3,015.7 million surplus a year earlier to USD1,560 million surplus at the end of 2018, resulting in 7.0% and 14.9% decrease in the gross and net international reserves respectively.
Inflation
Headline inflation decreased by 2.4 percentage points and stood at 9.4% at the end of 2018 relative to the 11.8% recorded a year earlier. The 2.4 percentage points decline in 2018 headline inflation reflected monetary policy tightness, improved energy and food supply.
The Banking Sector Performance
Total Assets of the Ghanaian Banking System increased from GHS 93.6 billion at the end of 2017 to GHS 107.3 billion in 2018 which represents 14.7% year-on-year growth compared to 15.2% recorded during the same period a year earlier. Industry’s total advances subsequently improved to GHS42.7 billion at the end of 2018 up from GHS37.8 billion recorded a year earlier; an increase of 12.9% in 2018 compared to 6.8% recorded in 2017. The 12.9% annual growth in total advances was mainly funded from GHS10.1 billion increase in the industry’s total deposits which stood at GHS68.3 billion at the end of 2018 compared to GHS58.2 billion recorded at the end 2017.
The Banking Industry’s Capital Adequacy Ratio stood at 21.9% at the end 2018 up from 18.6% recorded during the same period a year earlier. The 3.3 percentage points increase in industry CaR emphasizes the sound capital base of the industry to create additional assets since the average CaR of 21.9% far exceed the regulatory 10% capital requirement.
Consistently, the quality of the industry’s advances improved during 2018. Industry’s total non-performing loans witnessed a significant drop to 18.2%, down from 21.6% recorded at the end of 2017. The NPLs excluding the loss category however deteriorated to 10.2% at close of 2018 from 10.1% recorded a year earlier. The improvement in industry’s assets quality is largely associated with some write-offs approved by BOG during the period and significant improvement in the credit administration process in the industry.
UBA Ghana’s Performance
UBA Ghana is a major force in the Ghanaian Banking System recording significant improvement in its balance sheet size in 2018. UBA Ghana’s balance sheet size improved by 20.26% in 2018 relative to the 20.83% decrease recorded in 2017. The Bank ended 2018 with a balance sheet size of GHS3.56 billion. The 20.26% improvement in UBA Ghana’s total balance size were mainly funded by 128% increase in deposits from other financial institutions. Total customer deposits closed the year
Ghana Economic Outlook
19United Bank for Africa (Ghana) Limited2018 Annual Report
Ghana Economic Outlook
at GHS2.11 billion. It is imperative to note that the downside effect of banking sector reforms and significant increase in non-performing loans on the back of the BDCs debt portfolio accounts for the 32.25% decrease in profits before taxes and ended 2018 financial year at GHS213.4 million. UBA Ghana’s cost optimisation strategy however paid off during the period. It closed the year with 3 percentage points drop in cost to income ratio in 2018 recording 29% compared to 32% recorded a year earlier. Additionally, the ratio of non-interest income to gross earnings improved to 15.43% in 2018 relative to 9.9% recorded in 2017.
Consequently, UBA Ghana managed to improve its shareholder’s wealth by 16.96% to close the year with GHS641.8 million. UBA Ghana’s resolve to consistently improve its service delivery and risk management practices enhanced the bank’s capacity to meet the required GHS400 million regulatory capital announced by Bank of Ghana within the stipulated period from internally generated income. The Bank closed the year with capital adequacy ratio of 28.1% higher than the industry’s average of 21.9%.
Ghana’s Economic Outlook (2019)
Ghana Government projects 7.6% real GDP growth in 2019 (Ghana’s Budget Statement, 2019) relative to the provisional outturn of 6.8% real GDP growth in 2018. Ghana Government is seeking to leverage the growth potentials in both the Agricultural and Industry Sectors anchored on Agriculture modernization and industrialization through the One-District-One Factory program and improved oil revenue to achieve the projected 7.6% real GDP growth in 2019 fiscal year. Meanwhile, fiscal challenges, unfavourable external environment, interest rate hikes in United States of America and recent pressures on the local currency pose major risk to the realization of Ghana’s forecasted GDP growth in 2019.
Per 2019 fiscal policy statement, Ghana’s fiscal deficit is projected to decline by 0.3 percentage points to end 2019 to 4.2% of GDP, down from the provisional outturn of 4.5% (3.7% in rebased series) in 2018, predicated on prudent economic management and Government’s resolve to operate within the fiscal space that restricts annual budget deficit to 5% of GDP (Ghana’s Fiscal Responsibility Act 2018). Though Ghana’s annual debt accumulation rate increased significantly by 6.22 percentage points to 19.8% in 2018, up from 13.6% debt accumulation rate recorded a year earlier mainly driven by cost of the clean-up of the financial sector involving the consolidation of the seven defunct banks. Meanwhile, debt servicing shall remain a major challenge to Government of Ghana’s fiscal operations in 2019 and could drain the fiscal space if not prudently managed.
According to World Bank, the global economic growth is expected to soften to 2.9% relative to the downwardly revised 3% growth in 2018. The growth trajectory based on the World
Economic outlook is associated with tightening financial conditions, moderating international trade and investments and elevated trade tensions. Consistently, growth in emerging and developing economies has lost momentum and projected to stall at 4.2% at the end of 2018, with weaker-than-expected rebound in commodity exports accompanied by deceleration in raw material imports. Meanwhile, the downside risk to global economic growth have become acutely predicated on financial market pressures and potential escalation of trade tensions.
In the medium term, Ghana’s economic growth is projected to average 7.0% between 2019 and 2022 anchored on improved oil production, tightly controlled expenditure, improved revenue mobilization and efficiency measures, industrialization drive as well as planned investments in modernizing Agriculture. Likewise, current declining trend in interest and inflation rates are expected to remain unchanged with medium term inflation target of 8±2%, overall fiscal deficit target to remain within the fiscal rule of not more than 5.0%, primary balance of 1.0% and gross international reserves of at least four (4) months import cover in the medium term while the Ghana Cedi is projected to remain relatively stable against major trading currencies with the interventions from Bank of Ghana and the Ministry of Finance.
20 United Bank for Africa (Ghana) Limited2018 Annual Report
United Bank for Africa Ghana has been at the forefront of innovation and leadership in the Ghanaian Digital Banking space through the delivery of our cutting edge digital product offerings. Our continued dominance in the Digital Banking play is not by chance but as a result of very deliberate, meticulous planning and execution of Human Centered Design Principles and extensive co-creation in the roll out of our products and platforms.
We start every journey with the customer from conceptualizing the service offering through building the products to rigorous testing and deployment with strong emphasis of compelling use cases for the consumers of our product and extensive customization to meet the expectations of the users.
United Bank for Africa (Ghana) Limited being a member of the UBA Group with operations in twenty African Countries including a full-fledged Branch in Paris, New York and London draws from our experience in these geographies to enrich our customer experience. While differentiating in each country of operation, we leverage best practice and scale to provide the best experience to our customers.
It is in recognition of our leadership in the African Digital Banking Space that UBA was crowned the Most Innovative Bank in Africa by the prestigious Banker’s Magazine in London for the year 2018. Our pioneering effort in the use of Artificial Intelligence to offer financial services led to the headlining of LEO our Chatbot at Facebook’s formula 8 event hosted by Mark Zuckerberg the CEO of Facebook in 2018.
The journey of leadership through innovation is culture for United Bank for Africa Ghana Limited; along this line we recently launched a brand new Mobile Banking app that boasts of the latest technology and excellent user experience.
The app comes with a Biometric enabled log in, complete self-registration framework with capabilities for remote account origination. The app also packs the best in class personal financial management tool that leverages advanced analytics to provide on the spot insight to the customer on their expense and savings management.
Looking Forward To The Future
The payments landscape in Ghana is undergoing very significant changes especially from a regulatory perspective in view of the newly passed Payment Industry Bill. It is our belief that we will witness the emergence of very strong and established non-bank payments players in the market which essentially will change the competitive landscape.
The banks who will differentiate themselves going forward will be those with strong technology platforms and skill sets as well as those with an Open Banking Architecture who are willing to embrace the changes in technology. UBA Ghana is positioned very well here given our size and exposure, these factors have combined successfully to give us the experience and capacity to position for this change.
We will continue to push for Channel prevalence with our very elaborate deployment trajectory that will see us double our existing inventory this year alone.
Our strategic collaboration with some of our partners will see us deploy our Agency Banking solution across over a thousand points with full compliments of services ranging from account opening, Cash in Cash Out, Remittances and other Value Added Services.
We are positioning our Channels and Platforms to address the needs of Mobile Wallet holders in Ghana by embedding Mobile Money services on all our offerings. This trajectory will see us launching a number of products that will be running on some emerging payment form factors like QR (Quick Response) and NFC (Near Field Communications) Payments.
We foresee a very vibrant year ahead with very strategic alliances with Billers, Fintechs, Agricultural sector value chain and other Agencies of Government to maintain our leadership position in the Industry while we continue to contribute towards the cash lite agenda of the government. The market is evolving at a very fast rate and UBA Ghana Limited is excited to be at the forefront of these developments.
Digital Banking Report: Leading By Innovation

Corporate Social Responsibility
3
A review of the progress the Bank is making towards building a sustainable
banking franchise in Ghana.
UBA Foundation National Essay Competition Jogging to Bond
2223
UBA Ghana – Empowering Dreams Through Education
CSR22 United Bank for Africa (Ghana) Limited
2018 Annual Report
The year 2018 was a year filled with lots of activities and innovations as United Bank for Africa (UBA) Ghana focused on enhancing its relationship with customers, government and other stakeholders. This was buttressed with rigorous initiatives to ensure the bank which is a subsidiary of UBA PLC supersedes its limitations, envisage new opportunities and commit to the general development of the customers and the country at large.
UBA being one of the leading banks in Africa sees development as people centred. This is one of the reasons why we continue to boost our corporate social responsibilities by rolling out initiatives tied to our three core values of Enterprise, Excellence and Execution (3 EEEs). Several other promotions were executed through our digital platforms as part of efforts to stay glued to our valued customers. At some point in the year, we decided to empower our staff to take up personal projects within the communities we operate. And this led to the introduction of our “Each One Teach One” project- a programme designed to engage our operational areas with entrepreneurial skills. Each Business office visited either a school or a section of people to teach them makeup, haircut, savings and financial management. Within one week from Friday, 23rd November, 2018, we had reached over 28 different small scale enterprises or schools within our communities of operation, and this was made possible through the UBA Foundation.
It is widely said that development is about the people, so we engaged people through the introduction project which made enormous impact on various communities and staff as well. This project was launched as a UBA Community Service Day on Friday, 23 November 2018. It stands as a wing to ensure UBA contribute to socio-economic development around the continent. The initiative gave all UBA staff members across the African continent an opportunity to give back to the community in their own way, with a conscious effort to help underprivileged and young children acquire skills which might result in revenue generation. The initiative is also in line with the Foundation’s focus on Economic Empowerment, Environment, Education and Special Projects. Staff of UBA Ghana Business Offices nationwide joined their peers across Africa where they were deployed into various communities to impact knowledge through skill training and motivation.It was intriguing as staff engaged in activities which included reading and donation of books; entrepreneurial and financial inclusion skills; first-aid training; photography skills training; make-up skills training; gardening and landscaping skills among others. This again forms part of the Foundation’s effort to ensure employees volunteer towards a cause they are passionate about for better fulfilment, team-building, and boosting employee-morale as contribute to society.
At UBA, the well-being of our valued staff is our top priority, so we continue to strengthen the Jogging to bond initiative to
ensure staff gather all around the country to jog and bond to stay healthy and strengthen relationships. Professional physical trainers were engaged to take staff through a healthy physical activities and fun games meant to keep them healthy. The event also offered staff of the bank the opportunity to network and socialise among themselves. The games were climaxed by football competition, which saw Abiola Rangers and Isong United competing for honours. The final edition in 2018 jogging to bond was dubbed “THE GLADIATOR CHALLENGE” which was held at the Adenta-based Light Academy. Before the games, the staff led by their Deputy Managing Director, Mr Soni Anwal were taken through aerobatics as they warmed up for the games. The fun games were simultaneously organised in all regions of the country where UBA operates. Jogging to Bond activities are held in the 19 subsidiaries of United Bank for Africa Plc across Africa, as well as in London, New York and Paris. The 5th Edition of National Essay Competition added lots of light to the year after witnessing massive entries enabling students to develop their cognitive prowess and also receive academic support from the bank. The 2018 edition was brimmed with students with high intelligence and intriguing track records making the competition a keenly contested one. The Grand Final held on Monday, 28th January, 2019 at the Bank’s Corporate Headquarters, Heritage Towers, Ridge, Accra, Ghana welcomed the Deputy Minister of Education in charge of Technical and Vocational Education and Training (TVET), Hon. Barbara Asher Ayisi , the Chief Executive Officer of UBA Ghana, Mr Isong Udom and other ExCo Members of the Bank. Other dignitaries that graced the event were Mr. Francis Agyemfra and Ken Abittey of the secondary division of the Ghana Education Service. The ceremony witnessed a historic moment when Presbyterian Boys Senior High School picked up the first spot once again through Ariff Abdul Sabit after Jason Emmanuel K. Asante Ghansah in the 4th Edition.
It was all joy when Ariff Abdul Sabit from Presbyterian Boys Senior High School was announced the winner of the whooping USD5,000. Manasseh Sampana Nam-Mahime from St. Thomas Aquinas High School and Nana Adwoa Quayson of Aburi Girls Senior High School walked home with USD3,500 and USD2,000 for the second and third prize respectively. Each of the 10 finalists were given a UBA branded Laptop to go home as a token for the bold step taken to encourage others to participate in the competition. To upgrade our service to cherished customers, we introduced the Platinum MasterCard which comes with mouth-watering discounts. The card is meant to serve high net worth customers of the bank after a open-hearted launch at the plush Movenpick Ambassador Hotel. The Mastercard platinum card was to support its well-off and frequent travelling customers who desire to do electronic transactions more efficiently without having to worry about security. Holders of the MasterCard platinum card will have the luxury of booking flights, reserving

CSR23United Bank for Africa (Ghana) Limited
2018 Annual Report
hotels and paying for bills all at a discounted rate. This was made possible by UBA’s strategic partnership with MasterCard and key retail agents across Europe, Asia, America and other continent.
Awards
Humongous efforts placed in the bank’s corporate responsibility was highly recognized when the bank bagged two educational empowerment awards at the second edition of the Sustainability and Social Investment (SSI) Awards.
UBA Ghana was recognized as the best company in ‘Educational Sustainability Programme and Youth Development Programme’. This signifies that we are on the right track in making impact on the people. This honour was made possible through some of our life transforming initiatives including, the Read Africa Project, UBA National Essay Competition among others.
Mr. Isong Udom together with Hon. Deputy Minister of Education, Hon. Barbara Asher Ayisi presenting certificate to Manasseh Sampana Nam-Mahime, winner of NEC 2018.
Mr. Isong Udom together with Hon. Deputy Minister of Education, Hon. Barbara Asher Ayisi with other executives during the 2018 NEC
final ceremony.
Abiola Buwuah launching Mobile App and USSD code.
Jogging to bond
Jogging to bond
UBA wins Sustainability Award in Education
Abiola Bawuah receiving Exemplary Leadership Award at the Ghana Accountancy and Finance Awards


Corporate Governance
4
The governance framework, including what our Board does and how it underpins the
delivery of long-term sustainable success.
The Board Executive Committee
Director’s ReportCorporate Governance Report
Independent Auditor’s Report
2630323539

26 United Bank for Africa (Ghana) Limited2018 Annual Report
Board of Directors
Kenneth Chikezie OrjiChairman
Abiola BawuahMD/CEO
Soni AnwalDeputy Managing Director
Professor Kwamena AhwoiNon-Executive Director
1 2 3 4
1
5
2
6

27United Bank for Africa (Ghana) Limited2018 Annual Report
Samuel Ofori-AdjeiNon-Executive Director
Oliver AlawubaNon-Executive Director
Ebele OgbueNon-Executive Director
Kwamena BartelsNon-Executive Director
5 6 7 8
3
7
4
8

28 United Bank for Africa (Ghana) Limited2018 Annual Report
Mrs. Marufatu Abiola Bawuah has enormous experience in retail banking and marketing. She holds a BSc in Actuarial Science from the University of Lagos, Nigeria, an LLB with honors from the University of London, a diploma in Marketing from GIMPA and an EMBA (Finance) from the University of Ghana and also has numerous leadership qualifications from Harvard Business School, Columbia, University of New York, INSEAD and Institut Villa Pierrefeu in Switzerland. At the 2016 Chartered Institute of Marketing Ghana Awards, she was adjudged the “CIMG Marketing Woman of the Year” and subsequently went on to win the “Finance Personality of the Year Award” at the Ghana Accountancy and Finance Awards barely two months after. Mrs Bawuah is part of the Woman Rising inspiring list of the Top 50 Women Corporate Leaders in Ghana. Again, she was adjudged by the Chief Finance Officers (CFO) in 2016 as “Woman of Excellence in Finance”. In 2017, she was crowned as “Female Expatriate CEO of the Year by the Millennium Excellence Foundation for her hard work, achievements and contribution to Ghana. Mrs. Abiola Bawuah is the MD/CEO of UBA Ghana.
Mr. Anwal comes with over 20 years of banking experience and has spent the latter years of this experience in target marketing. Prior to his appointment as Deputy Managing Director, Mr. Anwal was the Regional Bank Head for United Bank for Africa Plc in Lagos, Nigeria. Between 2009 and 2011, he was the Managing Director for UBA (Sierra Leone), where he provided leadership for the day to day running of the bank. He has worked in various capacities in Nigeria’s financial services industry where he acquired strong strategic management, leadership, marketing and people skills. Mr. Anwal is a senior executive with international experience in retail banking, business strategy, credit risk and analysis, relationship management and general banking. He is highly skilled at building and leading strong teams to meet set objectives. Mr. Soni Anwal obtained an MSC degree in Economics from the Enugu State University of Science and Technology Business School in Nigeria.
Professor Ahwoi is a Hertford College, Oxford University Scholar and a University of Ghana Scholar. He holds a Bachelor of Civil Law (BCL) and a Bachelor of Law (LL.B.) respectively from the two universities. He was a lecturer in Law at the Faculty of Law of the University of Ghana, Legon, before joining the Government of the Provisional National Defence Council in 1982. Mr. Ahwoi was PNDC Secretary (Minister) of Local Government from 1988 to 1993. In 1997/98, Professor Ahwoi had the unique distinction of holding both the Local Government and Foreign Affairs ministerial portfolios simultaneously. He has considerable international experience in the area of local government and decentralization. As a legal academic, Professor Ahwoi’s passion was Jurisprudence. His seminal article on “Kelson, the Grund Norm and the 1979 Constitution” published in the University of Ghana Law Journal is still compulsory reading in the course on the “Pure Theory of Law” at the University of Ghana Law Faculty. At GIMPA, where he is currently a Professor of Governance, he has written and published extensively on local government and Decentralization.
Mr. Orji was educated at University of Ibadan, Nigeria where he was a J. F. Kennedy Scholar, having emerged national first place winner of the John F. Kennedy Memorial Essay Contest, organized by the US Government. He graduated with BSc Hons. and was awarded the Sir James Robertson Prize and Medal for Outstanding Performance in Economics. He also obtained MSc Accounting and Finance from London School of Economics and attended Harvard Business School (Program for Management Development). Mr. Orji has over 33 years’ experience, primarily in banking and finance, human capital development, consulting and advisory services. He began his banking career at International Merchant Bank Limited, Nigeria (affiliate of First National Bank of Chicago). He then moved to Diamond Bank Limited where he was General Manager and Head of Divisions responsible for Corporate Banking, Commercial and Consumer Banking, Treasury, Investment Banking, Energy Unit, Project Finance, Public Sector, Private Banking, Strategic Planning, Financial Control, Risk Management and Systems/Technology. He contributed to major innovations in the Nigerian banking industry and was involved in national policy development as a pioneer member of the Nigerian Economic Summit Group and the Technical Committee of Nigeria’s Vision 2010 project. Mr. Orji is currently Chairman/CEO of Centennial Capital Limited and Director of several companies
Kenneth Chikezie Orji Chairman
Abiola Bawuah MD/CEO
Soni Anwal Deputy Managing Director
Professor Kwamena Ahwoi Non-executive Director
Directors Profile

29United Bank for Africa (Ghana) Limited2018 Annual Report
Mr. Ofori-Adjei is an educationist and the current Headmaster of Accra Academy Senior High School. In addition to serving on the Board of UBA Ghana, Mr. Ofori-Adjei also serves as the Board Chairman for the Teachers Fund and is a Member of the Ghana National Committee of the West African Examinations Council. He is president of the Conference of Heads of Assisted Secondary Schools (CHASS) Mr. Ofori-Adjei holds a Bachelor of Arts degree and a Master’s degree in Public Administration.
Mr. Alawuba has over twenty years’ experience in the banking industry and academia. His extensive banking experience cuts across such areas as investment, retail and commercial banking, corporate finance as well as project management. Oliver was an Executive Director at Finbank, Nigeria Plc prior to his appointment as Managing Director for UBA Cote d’Ivoire Plc in 2010, and subsequently as the Managing Director for UBA Ghana in 2011. Oliver has a Master’s degree in Banking and Finance from the Olabisi Onabanjo University, Nigeria and an MSc in Food Technology from the University of Ibadan, Nigeria. He is an alumnus of the AMP and SEP programmes of the prestigious Insead Business School and London Business School respectively.
Ebele holds a B.Sc (Honours) degree in Accounting from the University of Lagos and an MBA (IT & Management) from CASS Business School London.His professional career started at Price Waterhouse in 1991 before his foray into banking, where he has spent the last two decades working at international banks such as, Citibank and Standard Chartered Bank, before joining UBA in 2004. His banking experience spans various areas of banking from Asset Based Finance to core Corporate Banking and Trade Finance. Prior to his current role, he was MD/CEO, UBA Capital Europe Limited and the pioneer MD/CEO, UBA Liberia.
Hon. Kwamena Bartels is an astute politician, and a lawyer by profession. His experience spans both the private and public sectors as well as on the international scene. He served in different ministerial portfolios in the NPP Government of 2000-2004 and 2004 to 2008. Apart from his ministerial duties, he served as Member of Parliament for the Ablekuma-North Constituency from 1997 to 2008. Mr. Bartels graduated from the University of Ghana with an LLB (Honours) degree and was called to the Bar in 1974. He also has a Post-Graduate Certificate in Personnel Administration from the Ghana Institute of Management and Public Administration and Post-Graduate Certificate in University Administration from University of Ife in Nigeria. He was Principal Assistant Registrar and Principal Lecturer at the Anambra State Polytechnic, Oko in Nigeria.
Samuel Ofori-Adjei Non-executive Director
Oliver Alawuba Non-executive Director
Ebele OgbueNon-Executive Director
Kwamena Bartels Non-Executive Director
Directors Profile

30 United Bank for Africa (Ghana) Limited2018 Annual Report
Executive Committee
Adedayo Marcus Adesipo Chief Operating Officer
Johnson Olakunmi Head, Digital Banking Products and Sales (January 2018 - July 2018)
Nkechi AkunyiliRegional Treasurer, WAMZ
Jocelyn Emma Ackon (Mrs) Country Head of Resources
Layi Sofolahan Chief Risk Officer (January 2018 - July 2018)
Evans Amenyo Sallah Country Head, Internal Control
Adedayo Marcus Adesipo is the Chief Operating Officer for UBA Ghana Ltd. He started his Banking career in Nigeria with the defunct Crystal Bank of Africa Ltd; and was a pioneering staff of Standard Trust Bank Plc before its merger with United Bank for Africa Plc. He is an astute Banker with 25 years’ experience spanning all areas of branch banking operation. He has also served and overseen the Banks Operations Directorate at Zonal, Regional and Group levels. He has a Bachelor of Science degree in Fisheries Management with a Post Graduate Diploma in Management.
Johnson is directly involved in the deployment and marketing of various customized digital banking and other product offerings to corporate and retail customers. He has over sixteen years banking experience, majorly in managerial capacity, with in-depth knowledge and understanding of the dynamics of banking business and operations in Ghana and Nigeria. He Holds a BSC-First Class Honours, in Banking and Finance from the University of Ado-Ekiti with a Master’s degree in Business Administration (MBA) from the University of Ghana, Legon. Johnson is a Certified Information System Auditor (CISA) and a certified strategist with Meirc Professional Certification (MPC). He has attended various training in Europe, Middle East and Africa including an Executive Education Program at the London Business School.
Jocelyn has a first and second degree in Human Resource Management as well as a Post Graduate Diploma in Organisation Development. Jocelyn has been in Human Resource Management practice for over 15 years, with the greater part in management. Her experience in Human Resource Management covers diverse sectors such as Transportation, Pharmaceutical and Banking.
Evans is a result oriented young man with over ten years banking experience. He has expertise in information security, risk management, internal control and audit. He joined United Bank for Africa (Ghana) Limited in 2007 as an Information Systems Auditor and holds a BSc. (Hons) degree in Computer Science from the Kwame Nkrumah University of Science and Technology. Evans is a member of the Information Systems Audit and Control Association (ISACA) and holds international certifications in Information Systems Auditing (CISA) and Information Security Management (CISM).
Nkechi Akunyili is a Treasury and Business Development professional. She has a Bsc. in Economics from UNN, Nigeria and Msc in Finance and investment from university of Exeter UK. Nkechi has over 20 years banking experience spanning across Treasury and Capital risk management, Business Development, Portfolio Management, project finance, investment analysis and Corporate Finance. Since the commencement of her Treasury career in 1998, Nkechi has made tremendous impact in Nigeria and Ghana markets, having pioneered market developments in both markets and other English speaking West African countries as the Regional Treasurer for West Africa 1.
Layi holds a BSc Accounting Degree from Obafemi Awolowo University Ile-Ife Nigeria, an MSc Development Finance from University of Ghana Legon and is also a Fellow of the Institute of Chartered Accountants of Nigeria (ICAN). He has over 19 years Banking experience covering the entire spectrum of Risk Management. He was with UBA Group Risk Management in Lagos Nigeria before his secondment to UBA Ghana.

31United Bank for Africa (Ghana) Limited2018 Annual Report
Executive Committee
Chiedu Okonta Country Chief Inspector
Mr. Peter Dery Head, Wholesale Banking
Kwame Aduansere Head, IT Operations
Ugochukwu Abanum Chief Finance Officer
Philip Odoom Head, Compliance & AMLRO
Valerie Ackwerh Head, Legal & Company Secretary
Peter has enormous wealth of experience in Corporate Banking as well as Credit Risk Management. His experience in the sector through various roles span over a decade. He holds a BSc degree in Banking & Finance from University of Ghana, an MBA (Project Management) from Ghana Institute of Management and Public Administration (GIMPA). He has worked as Director, Sales & Relationship Management at Standard Chartered Bank Ghana Limited; where he played key role in driving liabilities and assets growth and was credited with significant achievements. Prior to that, he served as Head of High Value Small Businesses in the SME Segment of the Bank. He was the Country lead Trainer for Foreign Account Tax Compliance and credited with the Successful implementation of Foreign Account Tax Compliance Act(FATCA) in bank. Before joining Standard Chartered Bank, he worked at CAL Bank as a Relationship Manager and credit Analyst and has participated in various leadership and Training programmes. In 2017, he was appointed as Head, Wholesale Banking, at United Bank for Africa (Ghana) Limited.
Ugochukwu is a Chartered Accountant and an Associate of the Institute of Chartered Accountants of Nigeria (ICAN). He holds a Bsc. in Estate Management from Obafemi Awolowo University, Ile- Ife, Nigeria and an MBA from Warwick Business School, Coventry, England.
An ICAN merit award winner, Ugochukwu is a seasoned financial expert with over ten years experience spanning audit and assurance, financial control and reporting, performance management, regulatory reporting and stakeholder management. Prior to his current role, he was Head of Financial Reporting at UBA Plc. Before joining UBA Group in 2014, he worked with the audit division of KPMG Nigeria.
Valerie started her legal profession from Sam Okudzeto & Associates, then joined Access Bank (Ghana) Limited as a Legal Officer. She also acted as Secretary to the Board of Directors. Prior to her appointment with UBA Ghana, she was Head, Legal & Company Secretary of Pan-African Savings and Loans, an affiliate of Ecobank Ghana Limited. Having worked in different Administrative roles in both Ghana and the United Kingdom. She holds a postgraduate diploma in Legal Practice from the University of Law (Birmingham, United Kingdom) and a Qualifying Certificate of Law from the Ghana School of Law. She graduated from the University of Wales (Swansea) with a Joint Honours degree in Law and Psychology.
Chiedu, a Fellow of the Institute of Chartered Accountants of Nigeria and holder of Executive MBA from the prestigious Lagos Business School, with Second Class Upper BSc. Honours in Accounting. He has vast post qualification experience that spans over 25 years, most of which were in UBA at various leadership positions covering several aspects of banking. Since his resumption in 2015, as the Country Chief Inspector, UBA Ghana has leveraged on Chiedu’s Strategic Management expertise to add immense value to the Bank.
Kwame is an Information Technology professional with over 13 years banking experience. He joined UBA from Zenith Bank Ghana Ltd where he served in various senior IT roles. He has extensive experience and deployed major IT infrastructure solutions, core banking solutions and electronic banking systems. He holds a BSc. in Computer Science from Kwame Nkrumah University of Science and Technology (KNUST), a member of the International Information Systems Security Certification Consortium (ISC2) and Information Systems Audit and Control Association (ISACA) with various international professional certifications including Certified Information Security Manager (CISM), Certified in Risk and Information Systems Control (CRISC) and Certified Information Systems Security Professional (CISSP).
Philip is a Chartered Accountant and a member of Association of Chartered Certified Accountants. He is an associate member of Association of Certified Fraud Examiners. He holds first degree in Bachelor of Commerce (B.COM) from the University of Cape Coast. He has over 10 years banking experience covering Audit, Internal Controls and Compliance and Anti-Money Laundering/Counter Financing of Terrorism function. He has knowledge and understanding of applicable banking operations and Anti-Money Laundering/Counter Financing of Terrorism laws, regulations and international best standards.
32 United Bank for Africa (Ghana) Limited2018 Annual Report
In accordance with the requirements of Section 132 of the Companies Act 1963 (Act 179), as amended, we the Board of United Bank for Africa (Ghana) Limited submit herewith the annual report on the state of affairs of the Bank for the year ended 31 December 2018.
Statement of directors’ responsibilities
The Companies Act 1963 (Act 179), as amended, requires the directors to prepare financial statements for each financial year which give a true and fair view of the state of affairs of the Bank as at the end of the financial year and of the operating results of the Bank for that year.
It also requires the directors to ensure that the Bank keeps proper accounting records which disclose with reasonable accuracy at any time the financial position of the Bank. They are also responsible for safeguarding the assets of the Bank.
The directors are responsible for the preparation of financial statements that give a true and fair view in accordance with International Financial Reporting Standards and the requirements of the Companies Act 1963 (Act 179), as amended, and the Banks and Specialised Deposit-Taking Institutions Act, 2016 (Act 930). This responsibility includes: designing, implementing and maintaining internal controls relevant to the preparation and fair presentation of financial statements that are free from material misstatement, whether due to fraud or error, selecting and applying appropriate accounting policies, and making accounting estimates that are reasonable in the circumstances.
The directors accept responsibility for the annual financial statements, which have been prepared using appropriate accounting policies supported by reasonable and prudent judgements and estimates, in conformity with International Financial Reporting Standards and the requirements of the Companies Act 1963 (Act 179) and the Banks and Specialised Deposit-Taking Institutions Act, 2016 (Act 930).
The directors are of the opinion that the financial statements give a true and fair view of the state of the financial affairs of the Bank and of its operating results. The directors further accept responsibility for the maintenance of accounting records which may be relied upon in the preparation of financial statements, as well as adequate systems of internal financial control.
Nothing has come to the attention of the directors to indicate that the Bank will not remain a going concern for at least the next twelve months from the date of this financial statements.
Holding Company
The Bank is a subsidiary of United Bank for Africa Plc, a company incorporated in the Federal Republic of Nigeria and licensed to undertake all banking and related services.
Nature of business
The Bank is licensed to carry out universal banking business in Ghana. There was no change in the nature of the bank’s business during the year.
Directors and their interests
The names of the directors who served during the year are provided on Page 106 of this report.
None of the Bank’s directors has any direct or indirect interest in the issued share capital of the Bank.
No director had a material interest, at any time during the year, in any contract, other than a service contract with the Bank. All contracts with related parties during the year were conducted at arm’s length. Information concerning related party transactions are disclosed in Note 33 to the financial statements.
Report of the Directors
33United Bank for Africa (Ghana) Limited2018 Annual Report
Report of the Directors (continued)
Directors’ Other Engagements
Details of serving directors’ other engagements at the reporting date, are disclosed below:
S/n Director Designation (UBA Ghana) Other Engagements
1 Honourable Kwamena Bartels Independent Non-Executive Director
Chairman, Ghana Oil Company (GOIL)
2 Mrs. Abiola BawuahManaging Director/Chief Executive Officer
Non-Executive Director - UBA Benin, UBA Cote d'Ivoire, UBA Liberia, UBA Sierra Leone, UBA Burkina Faso as well as other Non-Financial Institutions (NFI) Directorships
3 Mr. Oliver Alawuba Non-Executive Director
Executive Director - UBA Plc Non-Executive Director - UBA Liberia, UBA Sierra Leone, UBA Kenya, UBA Tanzania, UBA Uganda and UBA Zambia
4 Mr. Kenneth Chikezie Orji Non-Executive Director
Non-Executive Director - UBA Kenya, UBA Senegal and UBA DR Congo as well as other non-UBA Directorships
5 Mr. Ebele Ogbue Non-Executive Director
Executive Management - UBA PlcNon-Executive Director - UBA Liberia, UBA Sierra Leone, UBA Kenya, UBA Tanzania, UBA Uganda, and UBA Zambia
*Effective 1 January 2019, Mr Isong Udom was appointed MD/CEO, following the elevation of Mrs Abiola Bawuah to Regional CEO for UBA West Africa 1 Region.

34 United Bank for Africa (Ghana) Limited2018 Annual Report
(All amounts are expressed in Ghana cedis unless otherwise stated)
Isong UdomMD/CEO
08 March 2019
Honourable Kwamena BartelsDirector08 March 2019
Financial results
The financial results for the year are set out below:
Dec 2018 Dec 2017
Operating income 430,694,664 516,668,372
Profit before tax 213,383,975 314,953,921
Income tax expense and national fiscal stabilization levy (61,473,751) (94,985,941)
Profit after tax of 151,910,224 219,967,980
Income surplus brought forward from the previous year 279,798,768 34,678,268
Total 431,708,992 254,646,248
Opening adjustment on adoption of IFRS 9* (30,383,158) -
Transfer to credit risk reserve fund - 52,648,517
Transfer to statutory reserves fund (18,988,778) (27,495,997)
Transfer to stated capital (325,340,939) -
Stamp duty/withholding tax on transfer to stated capital (29,917,221) -
Balance on the income surplus account 27,078,896 279,798,768
*Effective 1 January 2018, the Bank adopted IFRS 9 (Financial Instruments). The impact of the adoption of this standard on the Bank’s financial statements is disclosed in Note 3.3 of the financial statements.
Dividend
In line with plans to capitalise the Bank’s income surplus in order to comply with the new minimum capital requirements for Banks in Ghana, the directors recommended no dividend payment for the year ended 31 December 2018 (2017: nil).
Paid up Capital
During the year, the Bank increased it’s stated capital from GHS 74.66 million to GHS 400.00million in line with the new minimum capital requirements stipulated by the Bank of Ghana. The increase was effected by the transfer of GHS 325.34 million from income surplus to stated capital by way of a bonus issue of 3,700,250,000 new shares of no par value at approximately GHS 0.08 per share, on the basis of one bonus share for every existing share. The capitalization received shareholders’ approval at the Emergency General Meeting held on 4 December 2018.
AuditorsMessrs Deloitte & Touche were appointed auditors of the Bank at the last Annual General Meeting and will continue in office as auditors in accordance with Section 134 (2) of the Companies Act,1963 (Act 179) and in line with the provisions of the Banks and Specialised Deposit-Taking Institutions Act, 2016 (Act 930).
On behalf of the Board
Report of the Directors (continued)
35United Bank for Africa (Ghana) Limited2018 Annual Report
Corporate Governance ReportUnited Bank for Africa (Ghana) Limited holds good governance as one of its core values and confirms its commitment to the implementation of effective corporate governance principles in its business operations. The Directors endorse the principles of best practice Corporate Governance as stated in the “Corporate Governance Directive, 2018” issued by the Bank of Ghana. The importance of governance is premised on the importance UBA Ghana accords to its relationships with its regulators, stakeholders and the public as a whole. The Bank has structures and processes set out in its regulations and policies, including the Board’s Governance Charter which guarantee transparency and accountability.
The Board of Directors of UBA Ghana has the overall responsibility for ensuring that the highest standards of corporate governance are maintained and adhered to by the Bank. In order to promote effective governance of the Bank, the following structures have been put in place for the execution of UBA Ghana’s Corporate Governance strategy:
1. Board of Directors
2. Board Committees
3. Executive Management Committees
As at December 31, 2018, the Board comprised an Independent Non-Executive Director, three (3) other Non-Executive Directors and one (1) Executive Director, all of whom bring a wide range of skills and experience to the Board.
The Board of Directors carries out its responsibility through its standing Committees. These are the Board Governance and Finance Committee, the Board Credit and Risk Management Committee and the Board Audit Committee. Through the workings of these committees, the Board sets broad policy guidelines and ensures the proper management and direction of the Bank.
In addition to the Board Committees, there are a number of Management Committees which ensure effective and good corporate governance at the managerial level.
1. The Board of Directors
As at 31 December 2018, the UBA Ghana (Limited) Board had five (5) members made up of three (3) Non-Executive Directors, one (1) Executive Director and an Independent Non-Executive Director.
They are:
1. Hon. Kwamena Bartels - Independent Non-Executive Director
2. Mrs. Abiola Bawuah - Managing Director/CEO
3. Mr. Kenneth Orji - Non-Executive Director
4. Mr. Oliver Alawuba - Non-Executive Director
5. Mr. Ebele Ogbue - Non-Executive Director
Mr. Kenneth Orji was Chairman of the Board until July 2018.
The Directors are people of very high integrity, with extensive knowledge in management, governance and expertise in the financial industry which equips them to make informed decisions relating to the Bank’s performance. In the performance of its mandate, the Board has delegated some of its specific authorities to three (3) Board Committees to discharge its responsibilities. It has also delegated some of its decision-making authority to
Executive Management specified in the Executive Management Charter.
Responsibility
The mandate of the Board of Directors is to act on behalf of the shareholders in the overall interest of UBA Ghana and its stakeholders and is accountable to the shareholders. The Board provides overall guidance and policy direction and provides oversight in the Bank’s strategic direction, policy formulation and is the ultimate decision making body of the Bank.
The roles of Chairman and Chief Executive Officer are separated and clearly defined. The Chairman is primarily responsible for the working of the Board whilst the Chief Executive Officer is responsible for the running of the business and implementation of Board strategy and policy. The Chief Executive Officer is assisted in managing the business of the Bank on a day-to-day basis by the Executive Management Committee, which he chairs and comprises Senior Management personnel and other critical functional heads. The Board is accountable to shareholders and is responsible for the management of the relationships with its various stakeholders.
The Board is also responsible for the Bank’s structure and areas of operation, financial reporting, ensuring there is an effective system of internal control and risk management and appointments to the Board. The Board has the authority to delegate matters to Directors, Board Committees and the Executive Management Committee.
Executive Management is accountable to the Board for the development and implementation of strategy and policies. The Board regularly reviews the Bank’s performance, matters of strategic concern and any other matters it regards as material.
The Board meets quarterly and additional meetings are convened as the need arises. The Board evaluates itself on an annual basis.
Appointments and Retirements
During the 2018 financial year, the following two (2) Non-Executive Directors retired:
1. Prof. Kwamena Ahwoi
2. Mr. Samuel Ofori-Adjei
Mr. Soni Anwal (Deputy Managing Director) also resigned during the 2018 financial year.
Subsequent to the 2018 financial year and effective 01 January 2019, Mr. Isong Udom was appointed MD/CEO of the Bank, replacing Mrs. Abiola Bawuah.
Financial Reporting
The Board has presented a balanced assessment of the Bank’s position and prospects. The Board is mindful of its responsibilities and is satisfied that in the preparation of its Financial Report, it has met its obligation under the Bank’s Corporate Governance Charter.
The Directors make themselves accountable to the shareholders through regular publication of the Bank’s financial performance and Annual Reports. The Board has ensured that the Bank’s reporting procedure is conveyed on the most recent infrastructure to ensure accuracy.
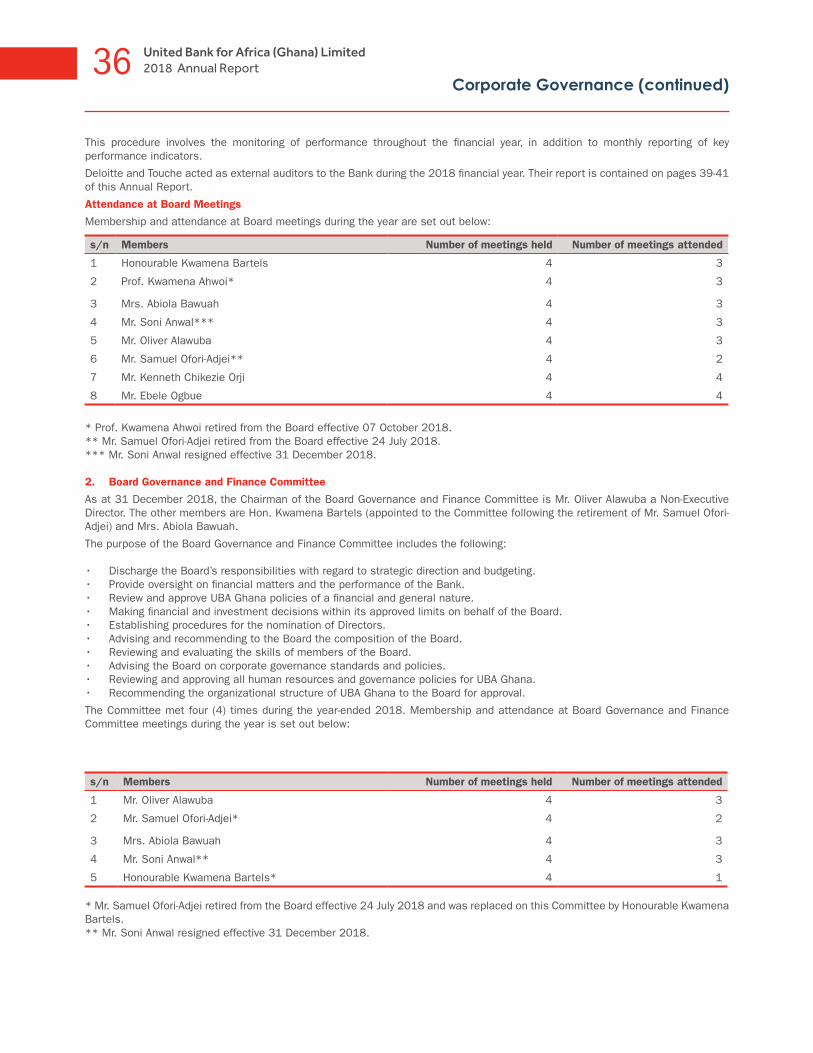
36 United Bank for Africa (Ghana) Limited2018 Annual Report
This procedure involves the monitoring of performance throughout the financial year, in addition to monthly reporting of key performance indicators.
Deloitte and Touche acted as external auditors to the Bank during the 2018 financial year. Their report is contained on pages 39-41 of this Annual Report.
Attendance at Board Meetings
Membership and attendance at Board meetings during the year are set out below:
s/n Members Number of meetings held Number of meetings attended
1 Honourable Kwamena Bartels 4 3
2 Prof. Kwamena Ahwoi* 4 3
3 Mrs. Abiola Bawuah 4 3
4 Mr. Soni Anwal*** 4 3
5 Mr. Oliver Alawuba 4 3
6 Mr. Samuel Ofori-Adjei** 4 2
7 Mr. Kenneth Chikezie Orji 4 4
8 Mr. Ebele Ogbue 4 4
* Prof. Kwamena Ahwoi retired from the Board effective 07 October 2018.** Mr. Samuel Ofori-Adjei retired from the Board effective 24 July 2018.*** Mr. Soni Anwal resigned effective 31 December 2018.
2. Board Governance and Finance Committee
As at 31 December 2018, the Chairman of the Board Governance and Finance Committee is Mr. Oliver Alawuba a Non-Executive Director. The other members are Hon. Kwamena Bartels (appointed to the Committee following the retirement of Mr. Samuel Ofori-Adjei) and Mrs. Abiola Bawuah.
The purpose of the Board Governance and Finance Committee includes the following:
• Discharge the Board’s responsibilities with regard to strategic direction and budgeting.• Provide oversight on financial matters and the performance of the Bank.• Review and approve UBA Ghana policies of a financial and general nature.• Making financial and investment decisions within its approved limits on behalf of the Board.• Establishing procedures for the nomination of Directors.• Advising and recommending to the Board the composition of the Board.• Reviewing and evaluating the skills of members of the Board.• Advising the Board on corporate governance standards and policies.• Reviewing and approving all human resources and governance policies for UBA Ghana.• Recommending the organizational structure of UBA Ghana to the Board for approval.
The Committee met four (4) times during the year-ended 2018. Membership and attendance at Board Governance and Finance Committee meetings during the year is set out below:
s/n Members Number of meetings held Number of meetings attended
1 Mr. Oliver Alawuba 4 3
2 Mr. Samuel Ofori-Adjei* 4 2
3 Mrs. Abiola Bawuah 4 3
4 Mr. Soni Anwal** 4 3
5 Honourable Kwamena Bartels* 4 1
* Mr. Samuel Ofori-Adjei retired from the Board effective 24 July 2018 and was replaced on this Committee by Honourable Kwamena Bartels.** Mr. Soni Anwal resigned effective 31 December 2018.
Corporate Governance (continued)

37United Bank for Africa (Ghana) Limited2018 Annual Report
Corporate Governance (continued)
3. Board Credit and Risk Management Committee
As at 31 December 2018, Mr. Kenneth Orji, a Non-Executive Director, was Chairman of the Board Credit and Risk Management Committee (appointed to the Committee following the retirement of Prof. Kwamena Ahwoi). The other members of the Committee were Mr. Oliver Alawuba and Mr. Ebele Ogbue who are both Non-Executive Directors, and Mrs. Abiola Bawuah.The purpose of the Committee includes but not limited to the following:• Discharging the Board’s risk management responsibilities as defined in UBA Ghana’s Risk policies and in compliance with
regulation, law and statute.• Discharging the Board’s responsibilities for information technology (IT) governance and ensuring it aligns with UBA Ghana’s
objectives, enables the business strategy, delivers value and improves performance.• Reviewing and assessing the integrity and adequacy of the overall risk management function of UBA Ghana.• Reviewing the adequacy of UBA Ghana’s capital (economic, regulatory and escalator) and its allocation to UBA Ghana’s business.• Reviewing risk limits and periodic risk and compliance reports and making recommendations to the Board.
The Committee met four (4) times in the year ended December, 2018. Membership and attendance at Board Credit and Risk Management Committee meetings during the year is set out below:
s/n Members Number of meetings held Number of meetings attended
1 Mr. Kenneth Chikezie Orji* 4 2
2 Mrs. Abiola Bawuah 4 3
3 Mr. Oliver Alawuba 4 3
4 Mr. Ebele Ogbue* 4 1
5 Prof. Kwamena Ahwoi 4 2
*Mr. Kenneth Orji and Ebele Ogbue were appointed to the Committee during the year.
4. Board Audit Committee
As at 31 December 2018, the Board Audit Committee is made up of four (4) Non-Executive Directors and is chaired by an Independent Non-Executive Director, Hon. Kwamena Bartels (appointed to the Committee following the retirement of Mr. Samuel Ofori-Adjei). The other members are, Mr. Oliver Alawuba, Mr. Ebele Ogbue and Mr. Kenneth Orji.
The purpose of the Board Audit Committee includes the following:
• Monitoring and assessing the overall integrity of the financial statements and disclosures of the financial condition and results of operations of UBA Ghana.
• Monitoring management’s responsibilities to ensure that an effective system of financial and internal controls is in place.
• Assisting the Board in discharging its responsibilities on Information Technology (IT) as it relates to financial reporting and the status of the company as a going concern.
• Monitoring and evaluating on a regular basis the qualifications, independence and performance of the External Auditors and the Internal Audit and Control Department.
• Monitoring processes designed to ensure compliance by UBA Ghana with respect to all legal and regulatory requirements, including disclosure controls and procedures and the impact (or potential impact) of developments related thereto.
The Committee met four (4) times during the year ended December, 2018. Membership and attendance at Board Audit Committee meetings during the year is set out below:
s/n Members Number of meetings held Number of meetings attended
1 Honourable Kwamena Bartels 4 2
2 Mr. Samuel Ofori-Adjei* 4 2
3 Prof. Kwamena Ahwoi** 4 2
4 Mr. Oliver Alawuba 4 3
5 Mr. Ebele Ogbue 4 2
6 Mr. Kenneth Orji 4 2
* Mr. Kenneth Orji was appointed to the Committee following the retirement of Mr. Samuel Ofori-Adjei.
** Prof. Kwamena Ahwoi retired from the Board effective 7 October 2018 and was replaced on this Committee by Mr. Ebele Ogbue.

38 United Bank for Africa (Ghana) Limited2018 Annual Report
5. Internal Control
UBA Ghana recognizes the importance of the Internal Control function in the Bank’s overall operations and has put in place control systems to ensure that the Bank’s operations are carried in a safe, objective and effective manner. The Directors review the effectiveness of the system of internal control through regular reports and reviews at Board and Risk Management Committee meetings.
6. Anti-Money Laundering
The Board and Management of UBA Ghana are committed to upholding all the laws and regulations regarding Anti-Money Laundering. Staff are continuously trained on the provisions of the Bank’s anti-money laundering policies as well as the Anti- Money Laundering Act, 2008 (Act 749) and the Anti-Laundering (Amendment) Act, 2014 (Act 874) to ensure strict compliance to these laws and regulations.
7. Conflicts of Interest
The Bank has a comprehensive policy regarding conflicts of interests which staff and directors are expected to abide to. Directors are made aware of their duty to avoid situations or activities that could create conflicts of interests and to disclose any activities that may result in or have already resulted in a conflict of interest. Staff and Directors are also required to make periodic declarations on conflicts of interest, to the regulator.
8. Shareholders Rights
The Board of UBA Ghana Limited has always placed considerable emphasis on effective communication with its shareholders. It ensures that the rights of shareholders are always protected. Notice of meetings and all other statutory notices and information are communicated to the shareholders regularly. The Bank ensures the protection of statutory and general rights of shareholders at all times, particularly their right to vote at General Meetings. All shareholders are treated equally regardless of their equity interest or social status.
The General Meeting of Shareholders is the highest decision-making body of the Bank and meetings are conducted in a fair and transparent manner that gives shareholders the opportunity to express their opinion. The Bank publishes quarterly, half-yearly and annual reports on its website as well as national newspapers. The Bank also provides other relevant communications that provide requisite information to shareholders and the general public, especially as regards the performance, strategy and developments in the Bank.
9. Directors’ Compensation
Package Type Description Timing
Basic Salary
Fixed This is part of gross salary package for Executive Directors only.
It reflects the banking industry competitive salary package and the extent to which the Bank’s objectives have been met for the financial year.
Paid monthly during the financial year
13th month salary
Fixed This is part of gross salary package for Executive Directors only.
It reflects the banking industry competitive salary package and the extent to which the Bank’s objectives have been met for the financial year.
Paid in a month during the financial year
Directors fees
Fixed This is paid quarterly to Non-Executive Directors only. Paid quarterly
Sitting allowances
Fixed Sitting allowances are paid to the Non-Executive Directors only for attending Board and Board Committee meetings.
Paid after each meeting
10. Annual Certification
The Board certifies that for the financial year ended 31 December 2018, the Bank has complied with the provisions of the Corporate Governance Directive 2018, as issued by the Bank of Ghana, except for the following sections of the Directive for which the Bank of Ghana has extended the transitional period to 31 March 2019 to ensure full compliance:
a) Board qualification and composition
b) Board size and structure
c) Board Secretary
d) Other engagements of Directors
e) Board sub-committees
In addition, the Board certifies that:
1) It has independently assessed and documented that the Bank’s corporate governance process is effective and has successfully achieved its objectives.
2) Directors are aware of their responsibilities to the Bank as persons charged with governance.
Corporate Governance (continued)

39United Bank for Africa (Ghana) Limited2018 Annual Report
Opinion
We have audited the accompanying financial statements of United Bank of Africa (Ghana) Limited which comprise the statement of financial
position as at 31 December 2018, the statements of profit or loss and other comprehensive income, statement of changes in equity,
statement of cash flow for the year then ended, and the notes to the financial statements including a summary of significant accounting
policies.
In our opinion, the financial statements give a true and fair view of the financial position of United Bank for Africa (Ghana) Limited as at
31 December 2018 and the financial performance and cash flows for the year then ended in accordance with the International Financial
Reporting Standards, and in the manner required by the Companies Act, 1963 (Act 179), and the Banks and Specialised Deposit-Taking
Institutions Act 2016, (Act 930).
Other matter
The financial statements of United Bank for Africa (Ghana) Limited for the year ended 31 December 2017 were audited by another auditor
who expressed an unmodified opinion on those financial statements. We do not express an opinion or any other form of assurance on the
2017 financial statement as a whole.
Basis for Opinion
We conducted our audit in accordance with International Standards on Auditing (ISAs). Our responsibilities under those standards are further
described in the Auditor’s Responsibilities for the Audit of the Financial Statements section of our report. We are independent of the Bank
in accordance with the requirements of the International Federation of Accountants Code of Ethics for Professional Accountants (IFAC Code)
as adopted by the Institute of Chartered Accountants Ghana (ICAG) and we have fulfilled our other ethical responsibilities in accordance with
IFAC Code. We believe that the audit evidence we have obtained is sufficient and appropriate to provide a basis for our opinion.
Key Audit Matters
Key audit matters are those matters that, in our professional judgement, were of most significance in our audit of the financial statements
of the current period. These matters were addressed in the context of our audit of the financial statements as a whole, and in forming our
opinion thereon, and we do not provide a separate opinion on these matters.
Key audit matter How our audit addressed the key audit matter
Loan Loss Provision
The Bank adopted IFRS 9 – Financial Instruments during the year, which requires the measurement of expected credit loss allowance for financial assets at amortised cost and fair value through other comprehensive income.
The Bank reviews its loans and advances for impairment at the end of each reporting period. There are significant judgements made in the following areas in applying IFRS 9 – Financial Instruments. These include;• Determining the staging of financial assets of the Bank which
includes establishing groups of similar financial assets• Determining criteria for significant increase in credit risk• Determination of the probability of default (PD) and Loss
Given Default (LGD), which includes establishing the relative weightings of forward-looking scenarios for each type of loan and the associated Expected Credit Loss (ECL).
Due to the significant judgements that are applied by management in determining whether an impairment loss has occurred we considered this to be a key audit matter.
We evaluated the design and tested the implementation and operating effectiveness of the key controls over the computation of impairment loss.
In evaluating the design of controls, we considered the appropriateness of the control considering the nature and significance of the risk, competence and authority of person(s) performing the control, frequency and consistency with which the control is performed.
In performing operating effectiveness of controls, we selected a sample of transactions based on the control frequency to determine whether the control operated during the year.
We performed an evaluation of management’s key assumptions over the expected credit loss model (ECL), including the probability of default and the Loss Given Default.
We challenged management’s staging of its financial assets in the ECL module and tested facilities to ensure they have been included in the correct stage.
Independent Auditor’s Report To the Shareholders of United Bank for Africa (Ghana) Limited
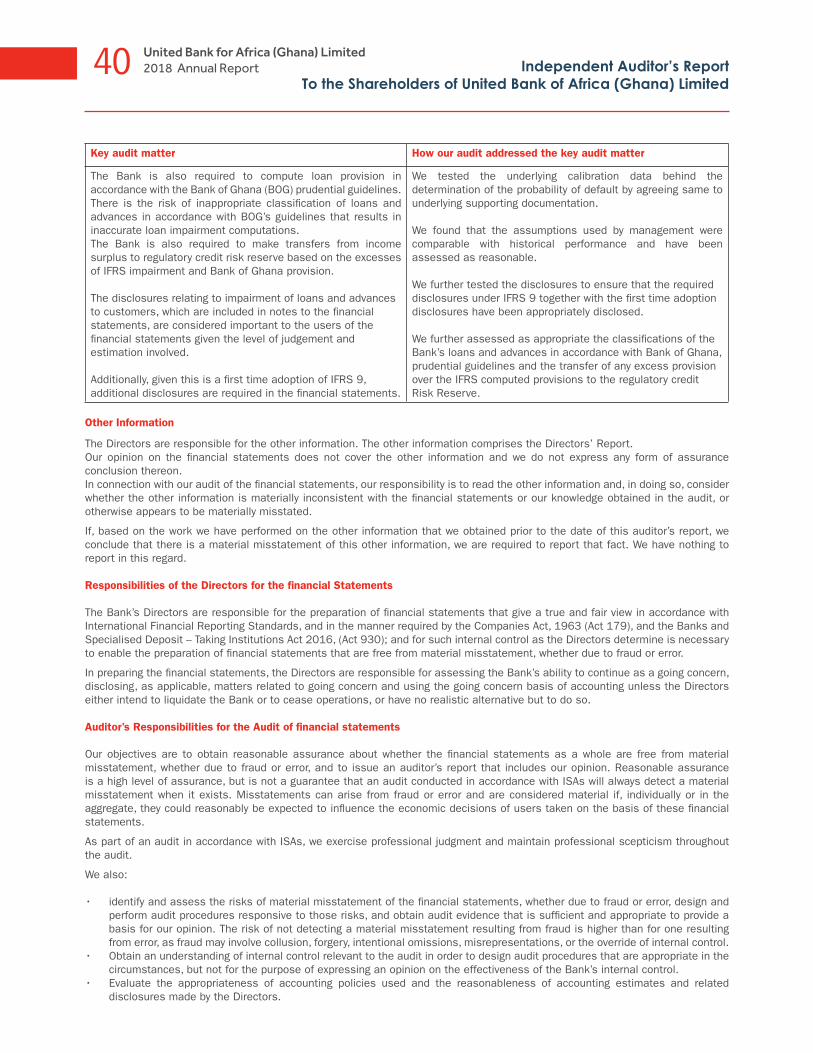
40 United Bank for Africa (Ghana) Limited2018 Annual Report
Key audit matter How our audit addressed the key audit matter
The Bank is also required to compute loan provision in accordance with the Bank of Ghana (BOG) prudential guidelines. There is the risk of inappropriate classification of loans and advances in accordance with BOG’s guidelines that results in inaccurate loan impairment computations.The Bank is also required to make transfers from income surplus to regulatory credit risk reserve based on the excesses of IFRS impairment and Bank of Ghana provision.
The disclosures relating to impairment of loans and advances to customers, which are included in notes to the financial statements, are considered important to the users of the financial statements given the level of judgement and estimation involved.
Additionally, given this is a first time adoption of IFRS 9, additional disclosures are required in the financial statements.
We tested the underlying calibration data behind the determination of the probability of default by agreeing same to underlying supporting documentation.
We found that the assumptions used by management were comparable with historical performance and have been assessed as reasonable.
We further tested the disclosures to ensure that the required disclosures under IFRS 9 together with the first time adoption disclosures have been appropriately disclosed.
We further assessed as appropriate the classifications of the Bank’s loans and advances in accordance with Bank of Ghana, prudential guidelines and the transfer of any excess provision over the IFRS computed provisions to the regulatory credit Risk Reserve.
Independent Auditor’s Report To the Shareholders of United Bank of Africa (Ghana) Limited
Other Information
The Directors are responsible for the other information. The other information comprises the Directors’ Report. Our opinion on the financial statements does not cover the other information and we do not express any form of assurance conclusion thereon. In connection with our audit of the financial statements, our responsibility is to read the other information and, in doing so, consider whether the other information is materially inconsistent with the financial statements or our knowledge obtained in the audit, or otherwise appears to be materially misstated.
If, based on the work we have performed on the other information that we obtained prior to the date of this auditor’s report, we conclude that there is a material misstatement of this other information, we are required to report that fact. We have nothing to report in this regard.
Responsibilities of the Directors for the financial Statements
The Bank’s Directors are responsible for the preparation of financial statements that give a true and fair view in accordance with International Financial Reporting Standards, and in the manner required by the Companies Act, 1963 (Act 179), and the Banks and Specialised Deposit – Taking Institutions Act 2016, (Act 930); and for such internal control as the Directors determine is necessary to enable the preparation of financial statements that are free from material misstatement, whether due to fraud or error.
In preparing the financial statements, the Directors are responsible for assessing the Bank’s ability to continue as a going concern, disclosing, as applicable, matters related to going concern and using the going concern basis of accounting unless the Directors either intend to liquidate the Bank or to cease operations, or have no realistic alternative but to do so.
Auditor’s Responsibilities for the Audit of financial statements
Our objectives are to obtain reasonable assurance about whether the financial statements as a whole are free from material misstatement, whether due to fraud or error, and to issue an auditor’s report that includes our opinion. Reasonable assurance is a high level of assurance, but is not a guarantee that an audit conducted in accordance with ISAs will always detect a material misstatement when it exists. Misstatements can arise from fraud or error and are considered material if, individually or in the aggregate, they could reasonably be expected to influence the economic decisions of users taken on the basis of these financial statements.
As part of an audit in accordance with ISAs, we exercise professional judgment and maintain professional scepticism throughout the audit.
We also:
• identify and assess the risks of material misstatement of the financial statements, whether due to fraud or error, design and perform audit procedures responsive to those risks, and obtain audit evidence that is sufficient and appropriate to provide a basis for our opinion. The risk of not detecting a material misstatement resulting from fraud is higher than for one resulting from error, as fraud may involve collusion, forgery, intentional omissions, misrepresentations, or the override of internal control.
• Obtain an understanding of internal control relevant to the audit in order to design audit procedures that are appropriate in the circumstances, but not for the purpose of expressing an opinion on the effectiveness of the Bank’s internal control.
• Evaluate the appropriateness of accounting policies used and the reasonableness of accounting estimates and related disclosures made by the Directors.

41United Bank for Africa (Ghana) Limited2018 Annual ReportIndependent Auditor’s Report
To the Shareholders of United Bank of Africa (Ghana) Limited
• Conclude on the appropriateness of the Directors’ use of the going concern basis of accounting and based on the audit evidence obtained, whether a material uncertainty exists relating to events or conditions that may cast significant doubt on the Bank’s ability to continue as a going concern. If we conclude that a material uncertainty exists, we are required to draw attention in our auditor’s report to the related disclosures in the financial statements or, if such disclosures are inadequate, to modify our opinion. Our conclusions are based on the audit evidence obtained up to the date of our auditor’s report. However, future events or conditions may cause the Bank to cease to continue as a going concern.
• Evaluate the overall presentation, structure and content of the financial statements, including the disclosures, and whether the Bank’s financial statements represent the underlying transactions and events in a manner that achieves fair presentation.
We communicate with the Audit Committee and the Directors regarding, among other matters, the planned scope and timing of the audit and significant audit findings, including any significant deficiencies in internal control that we identify during our audit
We also provide the Audit Committee and Directors with a statement that we have complied with relevant ethical requirements regarding independence, and to communicate with them all relationships and other matters that may reasonably be thought to bear on our independence, and where applicable, related safeguards.
From the matters communicated with the audit committee and the directors, we determine those matters that were of most significance in the audit of the financial statements of the current year and are therefore the key audit matters. We describe these matters in our auditor’s report unless law or regulation precludes public disclosure about the matter or when, in extremely rare circumstances, we determine that a matter should not be communicated in our report because the adverse consequences of doing so would reasonably be expected to outweigh the benefits derivable by the public from such communication.
Report on Other Legal and Regulatory Requirements
The Companies Act, 1963 (Act 179) requires that in carrying out our audit work we consider and report on the following matters. We confirm that:
i.) We have obtained all the information and explanation, which to the best of our knowledge and belief were necessary for the purpose of our audit.
ii.) The Bank has kept proper books of account, so far as appears from our examination of those books.iii.) The Bank’s financial position and its statement of profit or loss and other comprehensive income are in agreement with the
books of account and returns.
The Banks and Specialised Deposit – Taking Institutions Act 2016, (Act 930) Section 85 (2) requires that we state certain matters in our report. We hereby state that;
a.) The financial statements give a true and fair view of the state of affairs of the Bank and the results of its operations for the year under review;
b.) We obtained all the information and explanations required for the efficient performance of our audit;c.) The transactions of the Bank are within its powers;d.) In our opinion the Bank has generally complied with the provisions of the anti-money laundering Act, 2008 (Act 749), the Anti
–Terrorism Act, 2008 (Act 762) and the regulations made under these enactments and,e.) The Bank has generally complied with the provisions of the Banks and Specialised Deposit – Taking Institutions Act 2016, (Act
930). The engagement partner on the audit resulting in this independent auditor’s report is Kwame Ampim-Darko (ICAG/P/1453)
For and on behalf of Deloitte & Touche (ICAG/F/2019/129)Chartered AccountantsPlot No.71, Off George Walker Bush HighwayNorth DzorwuluAccra Ghana
04 April 2019
Auditor’s Responsibilities for the Audit of financial statements (continued)


Financials5
Statutory financial statements of the Bank and associated audit report.
Statement of Profit or Loss and other Comprehensive Income Statement of Financial Position
Statement of Changes in EquityStatement of Cash Flows
Notes
4445464748
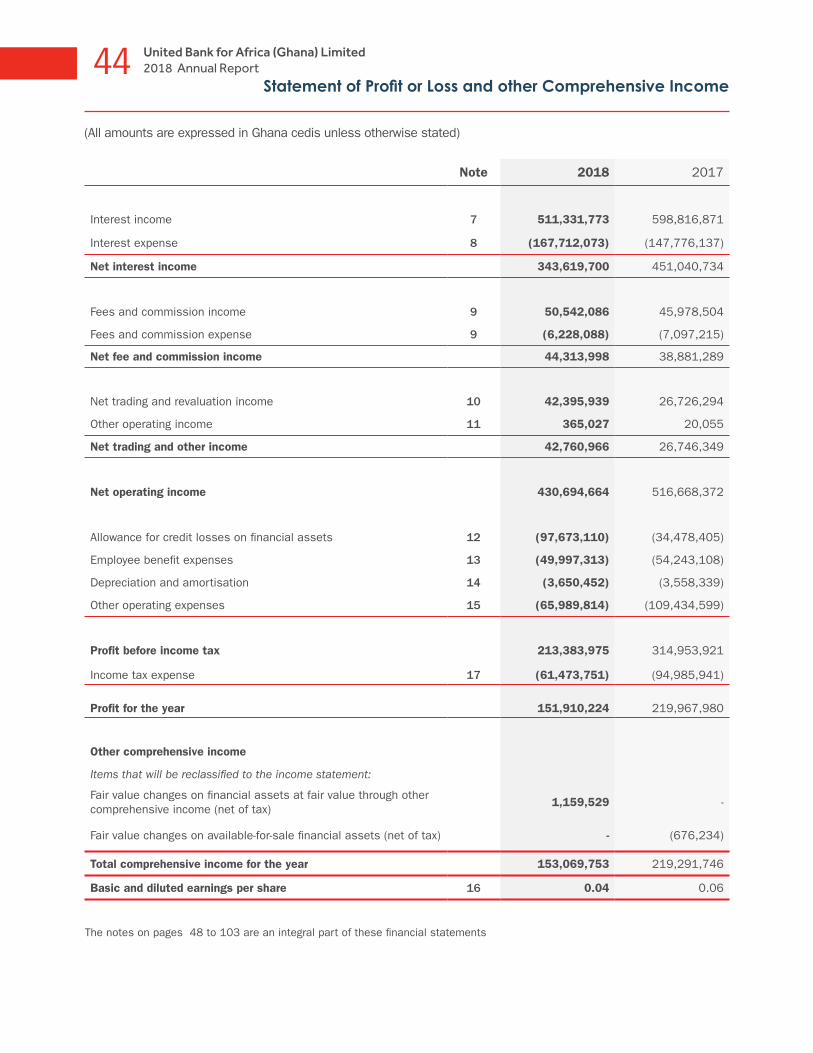
44 United Bank for Africa (Ghana) Limited2018 Annual Report
Statement of Profit or Loss and other Comprehensive Income
(All amounts are expressed in Ghana cedis unless otherwise stated)
Note 2018 2017
Interest income 7 511,331,773 598,816,871
Interest expense 8 (167,712,073) (147,776,137)
Net interest income 343,619,700 451,040,734
Fees and commission income 9 50,542,086 45,978,504
Fees and commission expense 9 (6,228,088) (7,097,215)
Net fee and commission income 44,313,998 38,881,289
Net trading and revaluation income 10 42,395,939 26,726,294
Other operating income 11 365,027 20,055
Net trading and other income 42,760,966 26,746,349
Net operating income 430,694,664 516,668,372
Allowance for credit losses on financial assets 12 (97,673,110) (34,478,405)
Employee benefit expenses 13 (49,997,313) (54,243,108)
Depreciation and amortisation 14 (3,650,452) (3,558,339)
Other operating expenses 15 (65,989,814) (109,434,599)
Profit before income tax 213,383,975 314,953,921
Income tax expense 17 (61,473,751) (94,985,941)
Profit for the year
151,910,224 219,967,980
Other comprehensive income
Items that will be reclassified to the income statement:
Fair value changes on financial assets at fair value through other comprehensive income (net of tax)
1,159,529 -
Fair value changes on available-for-sale financial assets (net of tax) - (676,234)
Total comprehensive income for the year 153,069,753 219,291,746
Basic and diluted earnings per share 16 0.04 0.06
The notes on pages 48 to 103 are an integral part of these financial statements

45United Bank for Africa (Ghana) Limited2018 Annual Report
Statement of Financial Position
Honourable Kwamena Bartels Director
Isong UdomMD/CEO
(All amounts are expressed in Ghana cedis unless otherwise stated)
The financial statements were approved by the Board of Directors on 08 March 2019 and signed on its behalf by:
Note 2018 2017
Assets
Cash and cash equivalents 19 546,269,526 538,466,380
Investment securities:
- At amortised cost 20 1,049,921,734 -
- At fair value through other comprehensive income 20 1,219,620,955 -
- Held to maturity 20 - 1,189,337,509
- Available for sale 20 - 68,347,089
Loans and advances to customers 21 634,206,101 1,098,846,411
Other assets 22 80,555,600 36,025,822
Property and equipment 23 28,350,497 28,850,322
Intangible assets 24 1,291,388 1,135,576
Income tax asset 17 2,935,441 -
Deferred tax asset 18 564,628 2,261,926
Total assets 3,563,715,870 2,963,271,035
Liabilities
Deposits from customers 25 2,114,717,879 2,073,671,821
Deposits from banks 26 581,546,997 255,599,382
Borrowings 27 120,909,248 -
Other liabilities 28 104,716,006 76,596,769
Current tax liability 17 - 8,085,891
Deferred tax liability 18 - 543,201
Total liabilities 2,921,890,130 2,414,497,064
Equity
Stated capital 29 400,000,000 74,659,061
Income surplus 30 27,078,896 279,798,768
Fair value reserve 30 765,690 (676,234)
Statutory reserve 30 213,981,154 194,992,376
Total equity 641,825,740 548,773,971
Total liabilities and equity 3,563,715,870 2,963,271,035
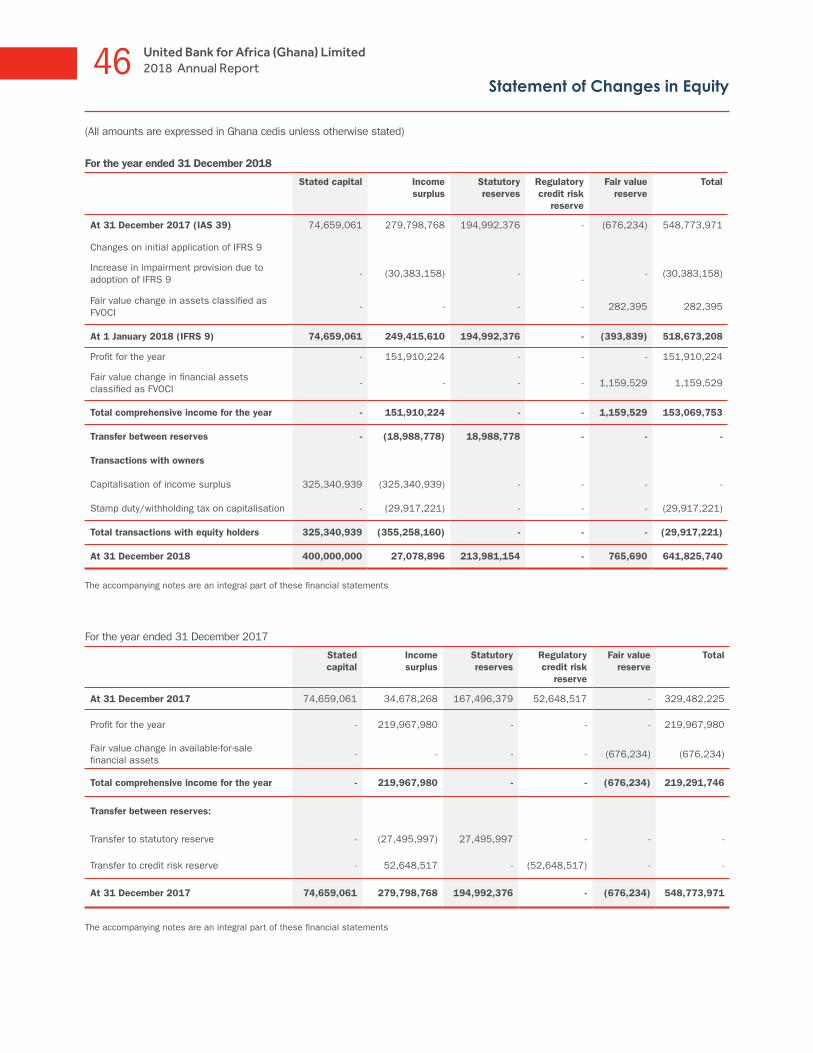
46 United Bank for Africa (Ghana) Limited2018 Annual Report
Statement of Changes in Equity
For the year ended 31 December 2018
Stated capital Income surplus
Statutory reserves
Regulatory credit risk
reserve
Fair value reserve
Total
At 31 December 2017 (IAS 39) 74,659,061 279,798,768 194,992,376 - (676,234) 548,773,971
Changes on initial application of IFRS 9
Increase in impairment provision due to adoption of IFRS 9
- (30,383,158) -
- - (30,383,158)
Fair value change in assets classified as FVOCI
- - - - 282,395 282,395
At 1 January 2018 (IFRS 9) 74,659,061 249,415,610 194,992,376 - (393,839) 518,673,208
Profit for the year - 151,910,224 - - - 151,910,224
Fair value change in financial assets classified as FVOCI
- - - - 1,159,529 1,159,529
Total comprehensive income for the year - 151,910,224 - - 1,159,529 153,069,753
Transfer between reserves - (18,988,778) 18,988,778 - - -
Transactions with owners
Capitalisation of income surplus 325,340,939 (325,340,939) - - - -
Stamp duty/withholding tax on capitalisation - (29,917,221) - - - (29,917,221)
Total transactions with equity holders 325,340,939 (355,258,160) - - - (29,917,221)
At 31 December 2018 400,000,000 27,078,896 213,981,154 - 765,690 641,825,740
The accompanying notes are an integral part of these financial statements
For the year ended 31 December 2017
Stated capital
Income surplus
Statutory reserves
Regulatory credit risk
reserve
Fair value reserve
Total
At 31 December 2017 74,659,061 34,678,268 167,496,379 52,648,517 - 329,482,225
Profit for the year - 219,967,980 - - - 219,967,980
Fair value change in available-for-sale financial assets
- - - - (676,234) (676,234)
Total comprehensive income for the year - 219,967,980 - - (676,234) 219,291,746
Transfer between reserves:
Transfer to statutory reserve - (27,495,997) 27,495,997 - - -
Transfer to credit risk reserve - 52,648,517 - (52,648,517) - -
At 31 December 2017 74,659,061 279,798,768 194,992,376 - (676,234) 548,773,971
The accompanying notes are an integral part of these financial statements
(All amounts are expressed in Ghana cedis unless otherwise stated)

47United Bank for Africa (Ghana) Limited2018 Annual Report
Statement of Cash Flows
(All amounts are expressed in Ghana cedis unless otherwise stated)
Note 2018 2017
Cash flows from operating activities
Profit before income tax 213,383,975 314,953,921
Adjustments for:
Depreciation and amortisation 14 3,650,452 3,558,339
Allowance for credit loss on loans to customers 12 95,394,114 -
Allowance for credit loss on other assets 12 608,539 -
Allowance for credit loss on contingent liabilities 12 165,800 -
Allowance for credit loss on investment securities 12 1,079,442 -
Allowance for credit loss on placements with banks 12 467,339 -
Impairment charge on loans to customers 12 - 33,791,238
Impairment charge on accounts receivable 12 - 739,151
Gain on disposal of property and equipment 23 (337,444) (1,210)
Write-off of property and equipment 23 43,246 150,128
Foreign currency exchange difference on borrowings 27 9,465,282 -
Net interest income (343,619,700) (451,040,734)
(19,698,955) (97,849,167)
Change in operating assets and liabilities
Change in mandatory reserve deposits (4,104,606) 89,993,994
Change in loans and advances to customers 348,143,335 713,007,923
Change in other assets (46,256,171) 6,150,084
Change in deposits from banks 325,947,615 (30,460,227)
Change in deposits from customers 41,046,058 (899,939,935)
Change in other liabilities 20,596,264 2,634,759
Interest received 511,331,773 598,816,871
Interest paid (160,129,696) (147,776,137)
Income tax paid 17 (71,727,496) (86,315,045)
Net cash from operating activities 945,148,121 148,263,120
Cash flows from investing activities
Purchase of investment securities (3,099,583,210) (1,355,294,438)
Proceeds from sale/redemption of investment securities 1,209,453,973 1,233,409,797
Purchase of property and equipment 23 (2,663,124) (17,959,411)
Proceeds from sale of property and equipment 23 337,444 1,210
Purchase of intangible assets 24 (686,561) (558,939)
Net cash used in investing activities (1,893,141,478) (140,401,781)
Cash flows from financing activities
Proceeds from borrowings 27 110,453,750 -
Interest paid on borrowings 27 (7,582,377) -
Stamp duty/withholding tax on capitalisation 29 (29,917,221) -
Dividend paid 31 - (79,556,000)
Net cash from financing activities 72,954,152 (79,556,000)
Net decrease in cash and cash equivalents (875,039,205) (71,694,661)
Cash and cash equivalents at 1 January 19 1,309,467,868 1,381,162,529
Cash and cash equivalents at 31 December 19 434,428,663 1,309,467,868
Notes48 United Bank for Africa (Ghana) Limited
2018 Annual Report
1. Reporting Entity
United Bank for Africa (Ghana) Limited (“the Bank”) is a limited liability company and is incorporated and domiciled in Ghana. The registered office is Heritage Towers, Ambassadorial Enclave, Accra. The Bank operates under the Banks and Specialised Deposit-Taking Institutions Act, 2016 (Act 930). The Bank is a subsidiary of United Bank for Africa Plc of Nigeria and provides retail, corporate banking and investment banking services.
2. Summary Of Significant Accounting Policies
2.1 Basis of preparation
The Bank’s financial statements have been prepared in accordance with International Financial Reporting Standards (IFRS). The financial statements have been prepared under the historical cost convention, except for financial assets measured at fair value through other comprehensive income. Additional information required under the Companies Act, 1963 (Act 179) and the Banks and Specialised Deposit-Taking Institutions Act, 2016 (Act 930) have been included, where appropriate.
The financial statements for the year ended 31 December 2018 were approved and authorised for issue by the Board of Directors on 8 March 2019.
The same accounting policies and methods of computation were followed in preparation of these financial statements as compared with the Bank’s most recent annual financial statements. Details of changes in accounting policies, where applicable during the year are disclosed in Note 3.
The preparation of financial statements requires the directors to make judgments, estimates and assumptions that affect the application of policies and reported amounts of assets and liabilities, incomes and expenses. The estimates and associated assumptions are based on historical experience and various other factors that are believed to be reasonable under the circumstances, the results of which form the basis of making the judgments about carrying values of assets and liabilities that are not readily apparent from other sources. Actual results may differ from these estimates.
2.2 Foreign currency translation
(a) Functional and presentation currency
Items included in the Bank’s financial statements are measured using the currency of the primary economic environment in which the entity operates (‘the functional currency’).
The financial statements are presented in Ghana Cedi, which is the Bank’s functional currency.
(b) Transactions and balances
Foreign currency transactions are recorded at the rate of exchange on the date of the transaction. At the reporting date, monetary assets and liabilities denominated in foreign currencies are reported using the closing exchange rate. Exchange differences arising on the settlement of transactions at rates different from those at the date of the transaction, as well as unrealized foreign exchange differences on unsettled foreign currency monetary assets and liabilities, are recognized in the income statement. The Ghana Interbank Exchange rates are used to translate foreign currency items into the functional currency.
Unrealized exchange differences on non-monetary financial assets are a component of the change in their entire fair value. For non-monetary financial assets measured at fair value through profit or loss, unrealized exchange differences are recognized
in profit or loss. For non-monetary financial assets measured at fair value through other comprehensive income, unrealized exchange differences are recorded in other comprehensive income until the asset is sold or becomes impaired.
2.3 Sale and repurchase agreements
Securities sold subject to repurchase agreements (‘repos’) are reclassified in the financial statements as pledged assets when the transferee has the right by contract or custom to sell or repledge the collateral; the counterparty liability is included in due to other banks or customer deposits, as appropriate. Securities purchased under agreements to resell (‘reverse repos’) are recorded as loans and advances to customers or due from other banks, as appropriate. The difference between sale and repurchase price is treated as interest and accrued over the life of the agreements using the effective interest method. Securities lent to counterparties are also retained in the financial statements.
2.4 Leases
Leases are divided into finance leases and operating leases.
a. The Bank is the lessee
(i) Operating lease
Leases in which a significant portion of the risks and rewards of ownership are retained by another party, the lessor, are classified as operating leases. Payments, including pre-payments, made under operating leases (net of any incentives received from the lessor) are charged to profit or loss on a straight-line basis over the period of the lease.
(ii) Finance lease
Leases of assets where the Bank has substantially all the risks and rewards of ownership are classified as finance leases. Finance leases are capitalised at the lease’s commencement at the lower of the fair value of the leased property and the present value of the minimum lease payments. Each lease payment is allocated between the liability and finance charges so as to achieve a constant rate on the finance balance outstanding. The corresponding rental obligations, net of finance charges, are included in deposits from Banks or deposits from customers depending on the counter party. The interest element of the finance cost is charged to profit or loss over the lease period so as to produce a constant periodic rate of interest on the remaining balance of the liability for each period.
The leases entered into by the Bank are primarily operating leases. The total payments made under operating leases are charged to other operating expenses in profit or loss on a straight-line basis over the period of the lease. When an operating lease is terminated before the lease period has expired, any payment required to be made to the lessor by way of penalty is recognised as an expense in the period in which termination takes place.
b. The Bank as the lessor
When assets are held subject to a finance lease, the present value of the lease payments is recognised as a receivable. The difference between the gross receivable and the present value of the receivable is recognised as unearned finance income. Lease income is recognised over the term of the lease using the net investment method (before tax), which reflects a constant periodic rate of return. Rental incomes from operating leases are recognised in profit or loss on a straight-line basis over the term of the relevant lease.

Notes49United Bank for Africa (Ghana) Limited
2018 Annual Report
c. Fees paid in connection with arranging leases
The Bank makes payments to agents for services in connection with negotiating lease contracts with the Bank’s lessees. For operating leases, the letting fees are capitalised within the carrying amount of the related property, and depreciated over the life of the lease.
2.5 Property, plant and equipment
Items of property and equipment are carried at cost less accumulated depreciation and impairment losses. Cost includes expenditures that are directly attributable to the acquisition of the asset. When parts of an item of property and equipment have different useful lives, they are accounted for as separate items (major components) of property and equipment.
Subsequent expenditures are included in the asset’s carrying amount or are recognised as a separate asset, as appropriate, only when it is probable that future economic benefits associated with the item will flow to the Bank and the cost of the item can be measured reliably. The carrying amount of the replaced part is derecognised. All other repair and maintenance costs are charged to profit or loss during the financial period in which they are incurred.
Depreciation is recognised in profit or loss on a straight-line basis over the estimated useful lives of each part of an item of property and equipment since this most closely reflects the expected pattern of consumption of the future economic benefits embodied in the asset. Leased assets are depreciated over the shorter of the lease term and their useful lives. Depreciation begins when an asset is available for use and ceases at the earlier of the date that the asset is derecognised or classified as held for sale in accordance with IFRS 5 Non-current Assets Held for Sale and Discontinued Operations.
Land is not depreciated. Depreciation on other classes of property and equipment are as follows:
Building 2.5%
Leasehold improvement Over the period of lease
Computers 20%
Motor vehicles 25%
Equipment, furniture and fittings 20%
The assets’ residual values and useful lives are reviewed, and adjusted if appropriate, at the end of each reporting period. Assets are reviewed for impairment whenever events or changes in circumstances indicate that the carrying amount may not be recoverable.
Gains and losses on disposals are determined by comparing proceeds with carrying amount. These are included in other operating expenses in profit or loss.
Capital work-in-progress (CWIP)
These are costs in respect of property, plant and equipment and other construction work-in-progress that will eventually be capitalised. Amounts paid or accrued either in a lump sum or on an instalment basis related to the construction, alteration, or renovation of premises, installations, and equipment (including special equipment such as computers) that are not yet functional or in use are accumulated in capital work-in-progress sub-accounts that are reported in the appropriate fixed asset
accounts. Payments made for capital work-in-progress projects that will eventually be expensed are expensed as incurred.
Depreciation methods, useful lives and residual values are reassessed at each reporting date and adjusted if appropriate. Changes in the expected useful life are accounted for by changing the amortisation period or methodology, as appropriate, and treated as changes in accounting estimates.
An item of property and equipment is derecognised on disposal or when no future economic benefits are expected from its use or disposal. Any gain or loss arising on de-recognition of the asset (calculated as the difference between the net disposal proceeds and the carrying amount of the asset) is included in profit or loss in the year the asset is derecognised.
2.6 Intangible assets
Intangible assets comprise computer software licences and other intangible assets. Intangible assets are recognised at cost less accumulated amortisation and accumulated impairment losses. Intangible assets with a definite useful life are amortised using the straight-line method over their estimated useful economic life, generally not exceeding four (4) years. Intangible assets with an indefinite useful life are not amortised. Generally, the identified intangible assets of the Bank have a definite useful life. At the end of each reporting period, intangible assets are reviewed for indications of impairment or changes in estimated future economic benefits. If such indications exist, the intangible assets are analysed to assess whether their carrying amount is fully recoverable. An impairment loss is recognised if the carrying amount exceeds the recoverable amount.
Intangible assets with indefinite useful life are annually tested for impairment and whenever there is an indication that the asset may be impaired.
2.7 Impairment of non-financial assets
Intangible assets that have an indefinite useful life are not subject to amortisation and are tested annually for impairment. Assets are reviewed for impairment whenever events or changes in circumstances indicate that the carrying amount may not be recoverable. An impairment loss is recognised for the amount by which the asset’s carrying amount exceeds its recoverable amount. The recoverable amount is the higher of an asset’s fair value less costs to sell and value in use. For the purposes of assessing impairment, assets are grouped at the lowest levels for which there are separately identifiable cash flows (cash-generating units). The impairment test also can be performed on a single asset when the fair value less cost to sell or the value in use can be determined reliably. Non-financial assets that suffered impairment are reviewed for possible reversal of the impairment at each reporting date.
2.8 National Fiscal Stabilisation Levy
The National Stabilisation Levy is assessed under the National Fiscal Stabilisation Levy Act (Act 862) of 2013 at 5% on accounting profit before tax and became effective on 12 July 2013. The levy is not tax deductible and it is accounted for on accrual basis.
2.9 Income tax
Current income tax
The tax expense for the period comprises current and deferred income tax. Tax is recognised in the profit or loss, except to the extent that it relates to items recognised in other comprehensive income or directly in equity. In this case, the tax
2. Summary of significant accounting policies (continued)
Notes50 United Bank for Africa (Ghana) Limited
2018 Annual Report
is also recognised in other comprehensive income or directly in equity respectively.
The current income tax charge is calculated on the basis of tax laws enacted or substantively enacted at the reporting date. Management periodically evaluates positions taken in tax returns with respect to situations in which applicable tax regulation is subject to interpretation. It establishes provisions where appropriate on the basis of amounts expected to be paid to the tax authorities.
Deferred income tax
Deferred income tax is recognised, using the liability method, on temporary differences arising between the tax bases of assets and liabilities and their carrying amounts in the financial statements.
However, deferred tax liabilities are not recognised if they arise from the initial recognition of goodwill; deferred income tax is not accounted for if it arises from initial recognition of an asset or liability in a transaction other than a business combination that at the time of the transaction affects neither accounting nor taxable profit or loss. Deferred income tax is determined using tax rates (and laws) that have been enacted or substantially enacted by the reporting date and are expected to apply when the related deferred income tax asset is realised or the deferred income tax liability is settled. Deferred income tax assets are recognised only to the extent that it is probable that future taxable profit will be available against which the temporary differences can be utilised.
However, deferred tax liabilities are not recognised if they arise from the initial recognition of goodwill; deferred income tax is not accounted for if it arises from initial recognition of an asset or liability in a transaction other than a business combination that at the time of the transaction affects neither accounting nor taxable profit or loss. Deferred income tax is determined using tax rates (and laws) that have been enacted or substantially enacted by the reporting date and are expected to apply when the related deferred income tax asset is realised or the deferred income tax liability is settled. Deferred income tax assets are recognised only to the extent that it is probable that future taxable profit will be available against which the temporary differences can be utilised.
Deferred income tax is provided on temporary differences except for deferred income tax liability where the timing of the reversal of the temporary difference is controlled by the Bank and it is probable that the temporary difference will not reverse in the foreseeable future.
Deferred income tax assets and liabilities are offset when there is a legally enforceable right to offset current tax assets against current tax liabilities and when the deferred income taxes assets and liabilities relate to income taxes levied by the same taxation authority on either the same entity or different taxable entities where there is an intention to settle the balances on a net basis.
2.10 Employee benefits
a. Defined Contribution Plans
The Bank operates a defined contribution pension scheme.
A defined contribution plan is a pension plan under which the Bank makes fixed contributions on contractual basis. The Bank has no legal or constructive obligations to pay further
contributions if the fund does not hold sufficient assets to pay all employees the benefits relating to employee service in the current and prior periods.
Obligations for contributions to defined contribution plans are recognised as an expense in profit or loss when they are due.
b. Termination benefits
The Bank recognises termination benefits as an expense when the Bank is demonstrably committed, without realistic possibility of withdrawal, to a formal detailed plan to either terminate employment before the normal retirement date, or to provide termination benefits as a result of an offer made to encourage voluntary redundancy. The Bank settles termination benefits within 12 months and are accounted for as short- term benefits.
c. Short-term employee benefits
Short-term employee benefit obligations are measured on an undiscounted basis and are expensed as the related service is provided.
A liability is recognised for the amount expected to be paid under short-term employee benefits if the Bank has a present legal or constructive obligation to pay this amount as a result of past service provided by the employee and the obligation can be estimated reliably.
2.11 Provisions
Provisions are recognised when: the Bank has a present legal or constructive obligation as a result of past events; it is probable that an outflow of resources will be required to settle the obligation; and the amount has been reliably estimated. Provisions are not recognised for future operating losses.
Where there are a number of similar obligations, the likelihood that an outflow will be required in settlement is determined by considering the class of obligations as a whole. A provision is recognised even if the likelihood of an outflow with respect to any one item included in the same class of obligations may be small.
Provisions are measured at the present value of the expenditures expected to be required to settle the obligation using a pre-tax rate that reflects current market assessments of the time value of money and the risks specific to the obligation. The increase in the provision due to passage of time is recognised as interest expense.
2.12 Stated capital
a. Ordinary shares
Ordinary shares are classified as ‘’Stated capital” in equity.
b. Dividends on ordinary shares
Dividends on ordinary shares are recognised in equity in the period in which they are approved by the Bank’s shareholders. Dividends for the year that are declared after the reporting date are dealt with in the subsequent events note.
2.13 Contingent liabilities
Letters of credit, acceptances, guarantees and performance bonds are generally written by the Bank to support performance by a customer to third parties. The Bank will only be required to meet these obligations in the event of the customer’s default. These obligations are accounted for as off balance sheet transactions and disclosed as contingent liabilities; credit risk, liquidity risk, market risk-comprising currency, interest rate and other price risk.
2. Summary of significant accounting policies (continued)2.9 Income tax (continued)Current income tax (continued)
Notes51United Bank for Africa (Ghana) Limited
2018 Annual Report
2. Summary of significant accounting policies (continued)
2.14 Cash and cash equivalents
Cash and cash equivalents comprise balances with less than three months’ maturity at the date of acquisition, including cash in hand, deposits held at call with other Banks, and other short term highly liquid investments with original maturities of three months or less.
2.15 Interest income and expense
Interest income and expense for all interest-bearing financial instruments are recognised in profit or loss using the effective interest method.
The effective interest method is a method of calculating the amortised cost of a financial asset or a financial liability and allocating the interest income or interest expense over the relevant period. The effective interest rate is the rate that exactly discounts estimated future cash payments or receipts through the expected life of the financial instrument or, when appropriate, a shorter period to the net carrying amount of the financial asset or financial liability. When calculating the effective interest rate, the Bank estimates cash flows considering all contractual terms of the financial instrument (for example, prepayment options) but does not consider future credit losses. The calculation includes all fees paid or received between parties to the contract that are an integral part of the effective interest rate, transaction costs and all other premiums or discounts.
Once a financial asset or a group of similar financial assets has been written down as a result of an impairment loss, interest income is recognised using the rate of interest used to discount the future cash flows for the purpose of measuring the impairment loss.
2.16 Fees and commissions
Fees and commissions are generally recognised on an accrual basis when the service has been provided. Loan commitment fees for loans that are likely to be drawn down are deferred (together with related direct costs) and recognised as an adjustment to the effective interest rate on the loan. Loan syndication fees are recognised as revenue when the syndication has been completed and the Bank has retained no part of the loan package for itself or has retained a part at the same effective interest rate as the other participants. Commission and fees arising from negotiating, or participating in the negotiation of, a transaction for a third party – such as the arrangement of the acquisition of shares or other securities, or the purchase or sale of businesses – are recognised on completion of the underlying transaction. Portfolio and other management advisory service fees are recognised based on the applicable service contracts, usually on a time-apportionment basis. Performance-linked fees or fee components are recognised when the performance criteria are fulfilled. Other fees and commission expenses relate mainly to transaction and service fees, which are expensed as the services are received.
2.17 Net trading and revaluation income
Net trading income and revaluation income comprises gains less losses related to trading assets and liabilities, and includes all realised and unrealised fair value changes and foreign exchange differences.
2.18 Earnings per share
The Bank presents basic earnings per share (EPS) for its ordinary shares. Basic EPS is calculated by dividing the profit or loss attributable to ordinary shareholders of the Bank by the
weighted average number of ordinary shares outstanding during the period.
Diluted EPS is determined by adjusting the profit or loss attributable to ordinary shareholders and the weighted average number of ordinary shares outstanding for the effects of all dilutive potential ordinary shares.
3. Changes in accounting policies and disclosures
(a) New standards, amendments and interpretations adopted by the Bank
The following amendments to standards and interpretations are effective from 1 January 2018 but do not have any impact on the Bank’s financial position, performance and/or disclosures:
• IFRIC Interpretation 22 Foreign Currency Transactions and Advance Considerations
• Amendments to IAS 40 Transfers of Investment Property• Amendments to IFRS 2 Classification and Measurement of
Share Based Payment Transactions• Amendments to IFRS 4 Applying IFRS 9 Financial Instruments
with IFRS 4 Insurance Contracts• Amendments to IAS 28 Investments in Associates and Joint
Ventures - Clarification that measuring investees at fair value through profit or loss is an investment-by-investment choice
IFRS 9 introduced a consequential amendment to IAS 1 – Presentation of Financial Statements, which is effective from 1 January 2018. The amendment requires interest income which is calculated using the effective interest rate method, to be presented separately from other interest income. This amendment had no impact on the Bank as all interest income recorded by the Bank are calculated using the effective interest rate method.
As at 31 December 2018, the Bank had no financial instruments measured at FVTPL.
The Bank applied IFRS 15 and IFRS 9 for the first time in 2018. The nature and effect of the changes as a result of adoption of these new accounting standards are described below.
3.1 IFRS 15: Revenue from contracts with customers
In May 2014, the IASB issued IFRS 15 Revenue from Contracts with Customers, effective for periods beginning on 1 January 2018 with early adoption permitted. IFRS 15 defines principles for recognising revenue and will be applicable to all contracts with customers.
However, interest and fee income integral to financial instruments and leases will continue to fall outside the scope of IFRS 15 and will be regulated by the other applicable standards (e.g., IFRS 9, and IFRS 16 Leases). Revenue under IFRS 15 is recognised as goods and services are transferred, to the extent that the transferor anticipates entitlement to goods and services. The standard also specifies a comprehensive set of disclosure requirements regarding the nature, extent and timing as well as any uncertainty of revenue and the corresponding cash flows with customers.
Adoption of this standard does not have any significant impact on the Bank.

Notes52 United Bank for Africa (Ghana) Limited
2018 Annual ReportNotes
3. Changes in accounting policies and disclosures (continued)
3.2 IFRS 9: Financial Instruments
The Bank has adopted IFRS 9 as issued by the IASB in July 2014 with a date of transition of 1 January 2018, which resulted in changes in accounting policies and adjustments to the amounts previously recognised in the financial statements. The Bank did not early adopt any provisions of IFRS 9 in the previous periods.
As permitted by the transitional provisions of IFRS 9, the Bank elected not to restate comparative figures. Any adjustments to the carrying amounts of financial assets and liabilities at the date of transition were recognised in opening retained earnings and other reserves in the current period. Consequently, for notes disclosures, the consequential amendments to IFRS 7 disclosures have also only been applied to the current period. The comparative period notes disclosures repeat those disclosures made in the prior year.
The adoption of IFRS 9 has resulted in changes in the Bank’s accounting policies for recognition, classification and measurement of financial assets and liabilities, and impairment of financial assets. IFRS 9 also significantly amends other standards dealing with financial instruments such as IFRS 7: Financial Instruments Disclosures.
Set out below are the specific IFRS 9 accounting policies applied in the current period. Further disclosures relating to the impact of the adoption of IFRS 9 on the Bank are made in Note 3.3.
(i) Classification and measurement of financial assets
Financial assets are recognised in the Bank’s balance sheet when the Bank becomes a party to the contractual provisions of the instrument. Financial assets are measured at initial recognition at fair value, and are classified and subsequently measured at fair value through profit or loss (FVTPL), fair value through other comprehensive income (FVOCI) or amortised cost. Subsequent classification and measurement for debt securities is based on the Bank’s business model for managing the financial instruments and the contractual cash flow characteristics of the instruments.
Debt instruments are measured at amortised cost if both of the following conditions are met and the asset is not designated as FVTPL:
(a) the asset is held within a business model that is Held-to-Collect (HTC) as described below, and
(b) the contractual terms of the instrument give rise to cash flows that are solely payments of principal and interest on the principal amount outstanding (SPPI).
Debt instruments are measured at FVOCI if both of the following conditions are met and the asset is not designated as FVTPL:
(a) the asset is held within a business model that is Held-to-Collect-and-Sell (HTC&S) as described below, and
(b) the contractual terms of the instrument give rise, on specified dates, to cash flows that are SPPI.
(ii) Business model assessment
The Bank determines the business models at the level that best reflects how portfolios of financial assets are managed to achieve the Bank’s business objectives. Judgment is used in determining the business models, which is supported by relevant, objective evidence including:
• How the economic activities of our businesses generate benefits, for example through trading revenue, enhancing yields or other costs and how such economic activities are
evaluated and reported to key management personnel;
• The significant risks affecting the performance of our businesses, for example, market risk, credit risk, or other risks and the activities undertaken to manage those risks; and
• Historical and future expectations of sales of the loans or securities portfolios managed as part of a business model.
• The Bank’s business models fall into three categories, which are indicative of the key strategies used to generate returns:
• Hold-to-Collect (HTC): The objective of this business model is to hold loans and securities to collect contractual principal and interest cash flows. Sales are incidental to this objective and are expected to be insignificant or infrequent.
• Hold-to-Collect-and-Sell (HTC&S): Both collecting contractual cash flows and sales are integral to achieving the objective of the business model.
• Other fair value business models: These business models are neither HTC nor HTC&S, and primarily represent business models where assets are held-for-trading or managed on a fair value basis.
(iii) SPPI Assessment
Instruments held within a HTC or HTC&S business model are assessed to evaluate if their contractual cash flows are comprised of solely payments of principal and interest. SPPI payments are those which would typically be expected from basic lending arrangements. Principal amounts include par repayments from lending and financing arrangements, and interest primarily relates to basic lending returns, including compensation for credit risk and the time value of money associated with the principal amount outstanding over a period of time. Interest can also include other basic lending risks and costs (for example, liquidity risk, servicing or administrative costs) associated with holding the financial asset for a period of time, and a profit margin.
Where the contractual terms introduce exposure to risk or variability of cash flows that are inconsistent with a basic lending arrangement, the related financial asset is classified and measured at FVTPL.
(iv) Investment Securities
Investment securities include all securities classified as FVOCI and amortised cost. All investment securities are initially recorded at fair value and subsequently measured according to the respective classification. Prior to our adoption of IFRS 9, Investment securities comprised of available-for-sale securities and held-to-maturity securities.
Investment securities carried at amortised cost are measured using the effective interest method, and are presented net of any allowance for credit losses, calculated in accordance with our policy for allowance for credit losses, as described below. Interest income, including the amortization of premiums and discounts on securities measured at amortised cost are recorded in interest income. Impairment gains or losses recognized on amortised cost securities are recorded in Allowance for credit losses. When a debt instrument measured at amortised cost is sold, the difference between the sale proceeds and the amortised cost of the security at the time of the sale is recorded as a gain/(loss) on Investment securities in Net trading and
Notes53United Bank for Africa (Ghana) Limited
2018 Annual ReportNotes
3. Changes in accounting policies and disclosures (continued)3.2 IFRS 9: Financial Instruments (continued)(iv) Investment Securities (continued)
revaluation income.
Debt securities carried at FVOCI are measured at fair value with unrealized gains and losses arising from changes in fair value included in fair value reserve. Impairment gains and losses are included in allowance for credit losses and correspondingly reduce the accumulated changes in fair value included in fair value reserve. When a debt instrument measured at FVOCI is sold, the cumulative gain or loss is reclassified from fair value reserve to net gain/(loss) on Investment securities in net trading and revaluation income
(v) Loans
Loans are debt instruments recognized initially at fair value and are subsequently measured in accordance with the classification of financial assets policy provided above. Loans are carried at amortised cost using the effective interest method, which represents the gross carrying amount less allowance for credit losses.
Interest on loans is recognized in interest income using the effective interest method. The estimated future cash flows used in this calculation include those determined by the contractual term of the asset and all fees that are considered to be integral to the effective interest rate. Also included in this amount are transaction costs and all other premiums or discounts. Fees that relate to activities such as originating, restructuring or renegotiating loans are deferred and recognized as Interest income over the expected term of such loans using the effective interest method. Where there is a reasonable expectation that a loan will be originated, commitment and standby fees are also recognized as interest income over the expected term of the resulting loans using the effective interest method. Otherwise, such fees are recorded as other liabilities and amortised into Other operating income over the commitment or standby period.
Impairment losses on loans are recognized at each balance sheet date in accordance with the three-stage impairment model outlined below.
(vi) Allowance for credit losses
An allowance for credit losses (ACL) is established for all financial assets, except for financial assets classified or designated as FVTPL and equity securities designated as FVOCI, which are not subject to impairment assessment. Assets subject to impairment assessment include loans, overdrafts and debt securities. These are carried at amortised cost and presented net of ACL on the Statement of Financial Position. ACL on loans is presented in Allowance for credit losses - loans and advances. ACL on debt securities measured at FVOCI is presented in Fair value reserve in equity. Off-balance sheet items subject to impairment assessment include financial guarantees and undrawn loan commitments. For all other off-balance sheet products subject to impairment assessment, ACL is separately calculated and included in Other Liabilities – Provisions.
The ACL is measured at each reporting date according to a three-stage expected credit loss impairment model which is based on changes in credit risk of financial assets since initial recognition:
1) Performing financial assets:
• Stage 1 – From initial recognition of a financial asset to the reporting date, where the asset has not experienced a significant increase in credit risk relative to its initial recognition, a loss
allowance is recognized equal to the credit losses expected to result from defaults occurring over the 12 months following the reporting date. Interest income is calculated on the gross carrying amount of these financial assets.
• Stage 2 – Following a significant increase in credit risk relative to the initial recognition of the financial asset, a loss allowance is recognized equal to the credit losses expected over the remaining lifetime of the asset. Interest income is calculated on the gross carrying amount of these financial assets.
2) Impaired financial assets
• Stage 3 – When a financial asset is considered to be credit-impaired, a loss allowance is recognized equal to credit losses expected over the remaining lifetime of the asset. The Stage 3 expected credit loss impairment model is based on changes in credit quality since initial recognition. Interest revenue is calculated based on the carrying amount of the asset, net of the loss allowance, rather than on its gross carrying amount.
The ACL is a discounted probability-weighted estimate of the cash shortfalls expected to result from defaults over the relevant time horizon. For loan commitments, credit loss estimates consider the portion of the commitment that is expected to be drawn over the relevant time period.
For financial guarantees, credit loss estimates are based on the expected payments required under the guarantee contract. Increases or decreases in the required ACL attributable to purchases and new originations, derecognitions or maturities, and remeasurements due to changes in loss expectations or stage migrations are recorded in provision for credit losses. Write-offs and recoveries of amounts previously written off are recorded against ACL.
The ACL represents an unbiased estimate of expected credit losses on our financial assets as at the balance sheet date. Judgment is required in making assumptions and estimations when calculating the ACL, including movements between the three stages and the application of forward looking information. The underlying assumptions and estimates may result in changes to the provisions from period to period that significantly affect our results of operations.
(vii) Measurement of expected credit losses
Expected credit losses are based on a range of possible outcomes and consider all available reasonable and supportable information including internal and external ratings, historical credit loss experience, and expectations about future cash flows. The measurement of expected credit losses is based primarily on the product of the instrument’s probability of default (PD), loss given default (LGD) and exposure at default (EAD) discounted to the reporting date. Stage 1 estimates project PD, LGD and EAD over a maximum period of 12 months while Stage 2 estimates project PD, LGD and EAD over the remaining lifetime of the instrument.
An expected credit loss estimate is produced for each individual exposure. Relevant parameters are modelled on a collective basis using portfolio segmentation that allows for appropriate incorporation of forward looking information.
Expected credit losses are discounted to the reporting period date using the effective interest rate.
Notes54 United Bank for Africa (Ghana) Limited
2018 Annual Report
3. Changes in accounting policies and disclosures (continued)
3.2 IFRS 9: Financial Instruments (continued)
(viii) Assessment of significant increase in credit risk
The assessment of significant increase in credit risk requires significant judgment. The Bank’s process to assess changes in credit risk is based on the use ‘backstop’ indicators. Instruments which are more than 30 days past due may be credit-impaired. There is a rebuttable presumption that the credit risk has increased significantly if contractual payments are more than 30 days past due; this presumption is applied unless the bank has reasonable and supportable information demonstrating that the credit risk has not increased significantly since initial recognition.
In addition, the Bank also considers the following conditions in assessing a significant increase in credit risk especially for corporate loans and advances:
(i) Inadequate or unreliable financials and other information such as unavailability of audited financial statements.
(ii) A downgrade of a borrower by a recognised credit rating agency.
(iii) Non-cooperation of the borrower in matters pertaining to documentation.
(iv) Borrower is the subject of litigation by third parties that may have a significant impact on his financial position.
(v) Frequent changes in senior management of the obligor.
(vi) Intra-group transfer of funds without underlying transactions.
(vii) Deferment/delay in the date of commencement if commercial operations by more than one year.
(viii) Modification of terms resulting in concessions granted to the borrower including extension of moratorium, deferment of payment, waiver of covenants etc.
(ix) Expectation of forbearance or restructuring due to financial difficulties.
The following are however considered as exceptions:
1. Outstanding obligation is a result of an amount being disputed between the bank and obligor where the dispute is not more than 90 days.
2. Outstanding obligation is an insignificant amount compared to the total amount due. Any amount not more than 10% is considered insignificant. Only applicable where there is no significant increase in credit risk and analysed on a case by case basis.
The assessment is generally performed at the instrument level and it is performed at least on quarterly basis. If any of the factors above indicate that a significant increase in credit risk has occurred, the instrument is moved from Stage 1 to Stage 2. The assessments for significant increases in credit risk since initial recognition and credit-impairment are performed independently as at each reporting period. Assets can move in both directions through the stages of the impairment model. After a financial asset has migrated to Stage 2, if it is no longer considered that credit risk has significantly increased relative to initial recognition in a subsequent reporting period, it will move back to Stage 1 after 90 days.
Similarly, an asset that is in Stage 3 will move back to Stage 2 if it is no longer considered to be credit-impaired after 90 days. An asset will not move back from stage 3 to stage 1 until after a minimum of 180 days, if it is no longer considered to be credit impaired.
For certain instruments with low credit risk as at the reporting date, it is presumed that credit risk has not increased significantly relative to initial recognition. Credit risk is considered to be low if the instrument has a low risk of default, and the borrower has the ability to fulfill their contractual obligations both in the near term and in the longer term, including periods of adverse changes in the economic or business environment.
(ix) Use of forward looking information
The measurement of expected credit losses for each stage and the assessment of significant increase in credit risk considers information about past events and current conditions as well as reasonable and supportable projections of future events and economic conditions. The estimation and application of forward-looking information requires significant judgment.
The PD, LGD and EAD inputs used to estimate Stage 1 and Stage 2 credit loss allowances are modelled based on the macroeconomic variables (or changes in macroeconomic variables) that are most closely correlated with credit losses in the relevant portfolio. Each macroeconomic scenario used in our expected credit loss calculation includes a projection of all relevant macroeconomic variables applying scenario weights. Macroeconomic variables used in our expected credit loss models include GDP growth rate, interbank rates, inflation rate and population growth rate.
Our estimation of expected credit losses in Stage 1 and Stage 2 is a discounted probability-weighted estimate that considers a minimum of three future macroeconomic scenarios. Our base case scenario is based on macroeconomic forecasts published by relevant government agencies. Upside and downside scenarios vary relative to our base case scenario based on reasonably possible alternative macroeconomic conditions. Additional and more severe downside scenarios are designed to capture material non-linearity of potential credit losses in portfolios. Scenario design, including the identification of additional downside scenarios, occurs at least on an annual basis and more frequently if conditions warrant.
Scenarios are designed to capture a wide range of possible outcomes and weighted according to our best estimate of the relative likelihood of the range of outcomes that each scenario represents. Scenario weights take into account historical frequency, current trends, and forward-looking conditions and are updated on a quarterly basis. All scenarios considered are applied to all portfolios subject to expected credit losses with the same probabilities.
Our assessment of significant increases in credit risk is based on changes in probability-weighted forward-looking lifetime PD as at the reporting date, using the same macroeconomic scenarios as the calculation of expected credit losses.
(x) Definition of default
A default is considered to have occurred with regard to a particular obligor when either or both of the following events have taken place.
• The bank considers that the obligor is unlikely to pay its credit obligations in full, without recourse by the bank to actions such as realising security (if held).
• The obligor is past due more than 90 days on any material credit obligation to the bank (principal or interest). Overdrafts will be considered as being past due once the
Notes

Notes55United Bank for Africa (Ghana) Limited
2018 Annual Report
3. Changes in accounting policies and disclosures (continued)3.2 IFRS 9: Financial Instruments (continued)(x) Definition of default (continued)
customer has breached an advised limit or been advised of a limit smaller than current outstanding.
• Interest payments equal to 90 days or more have been capitalized, rescheduled, rolled over into a new loan (except where facilities have been reclassified)
The elements to be taken as indications of unlikeliness to pay include:
- The bank sells the credit obligation at a material credit-related economic loss.
- The bank consents to a distressed restructuring of the credit obligation where this is likely to result in a diminished financial obligation caused by the material forgiveness, or postponement, of principal, interest or (where relevant) fees.
- The bank has filed for the obligor’s bankruptcy or a similar order in respect of the obligor’s credit obligation to the banking group.
The following are considered as exceptions:
a. Outstanding obligation is a result of an amount being disputed between the bank and obligor where the dispute is not more than 150 days;
b. In the case of specialized loans, default is defined as where the obligor is past due more than 180 days on any material credit obligation to the bank (principal or interest). In addition, it is consistent with the Bank’s historical default pattern on this category of loans. The specialized loans to which this is applicable are Project Financing, Object Financing, Income Producing Real Estate, Commercial Real Estate and Mortgage Loans;
c. Outstanding obligation is an insignificant amount compared to the total amount due. Any amount not more than 10% of amount due is considered insignificant. Only applicable where there is no significant increase in credit risk and analysed on a case by case basis.
d. Exposure is still in default due to a new debit when the initial debit has been cleared. Usually occurs when the debit that initiated the initial days past due has been paid but the days past due continues to reflect a debit.
(xi) Credit-impaired financial assets (Stage 3)
Financial assets are assessed for credit-impairment at each balance sheet date and more frequently when circumstances warrant further assessment. Evidence of credit-impairment may include indications that the borrower is experiencing significant financial difficulty, probability of bankruptcy or other financial reorganization, as well as a measurable decrease in the estimated future cash flows evidenced by the adverse changes in the payments status of the borrower or economic conditions that correlate with defaults. A loan is considered for transfer from stage 2 to stage 1 where there is significant improvement in credit risk and from stage 3 to stage 2 (declassified) where the facility is no longer in default. Factors that are considered in such backward transitioning include the following:
i) Declassification of the exposure by all the licensed private credit bureaux or the credit risk management system;
ii) Improvement of relevant credit risk drivers for an individual obligor (or pool of obligors);
iii) Evidence of full repayment of principal or interest.
Generally, the above are to represent an improvement in credit risk to warrant consideration for a backward transition of loans.
Where there is evidence of significant reduction in credit risk, the following probationary periods should apply before a loan may be moved to a lower stage (indicating lower risk):
Transfer from Stage 2 to 1:- 90 days
Transfer from Stage 3 to 2:- 90 days
Transfer from Stage 3 to Stage 1:- 180 days
When a financial asset has been identified as credit-impaired, expected credit losses are measured as the difference between the asset’s gross carrying amount and the present value of estimated future cash flows discounted at the instrument’s original effective interest rate.
For impaired financial assets with drawn and undrawn components, expected credit losses also reflect any credit losses related to the portion of the loan commitment that is expected to be drawn down over the remaining life of the instrument.
When a financial asset is credit-impaired, interest ceases to be recognised on the regular accrual basis, which accrues income based on the gross carrying amount of the asset. Rather, interest income is calculated by applying the original effective interest rate to the amortised cost of the asset, which is the gross carrying amount less the related ACL.
(xii) Write-off
Loans and debt securities are written off when the Bank has no reasonable expectations of recovering the financial asset (either in its entirety or a portion of it). This is the case when the Bank determines that the borrower does not have assets or sources of income that could generate sufficient cash flows to repay the amounts subject to the write-off. A write-off constitutes a derecognition event. The Bank may apply enforcement activities to financial assets written off. Recoveries resulting from the Bank’s enforcement activities will result in impairment gains.”
(xiii) Presentation of allowance for Expected Credit Loss in the Statement of Financial Position
Loss allowances for ECL are presented in the statement of financial position as follows:
• for financial assets measured at amortised cost: as a deduction from the gross carrying amount of the assets;
• for debt instruments measured at FVTOCI: no loss allowance is recognised in the statement of financial position as the carrying amount is at fair value. However, the loss allowance is included as part of the revaluation amount in the investments revaluation reserve;
• for loan commitments and financial guarantee contracts: as a provision; and
• where a financial instrument includes both a drawn and an undrawn component, and the Bank cannot identify the ECL on the loan commitment component separately from those on the drawn component: the Bank presents a combined loss allowance for both components. The combined amount is presented as a deduction from the gross carrying amount of the drawn component.
Any excess of the loss allowance over the gross amount of the drawn component is presented as a provision.
Debt and equity instruments that are issued are classified as either financial liabilities or as equity in accordance with the substance of the contractual arrangement.
Notes
Notes56 United Bank for Africa (Ghana) Limited
2018 Annual Report
3. Changes in accounting policies and disclosures (continued)3.2 IFRS 9: Financial Instruments (continued)(xiii) Presentation of allowance for Expected Credit Loss in the Statement of Financial Position (continued)
A financial liability is a contractual obligation to deliver cash or another financial asset or to exchange financial assets or financial liabilities with another entity under conditions that are potentially unfavourable to the Bank or a contract that will or may be settled in the Bank’s own equity instruments and is a non-derivative contract for which the Bank is or may be obliged to deliver a variable number of its own equity instruments, or a derivative contract over own equity that will or may be settled other than by the exchange of a fixed amount of cash (or another financial asset) for a fixed number of the Bank’s own equity instruments.
An equity instrument is any contract that evidences a residual interest in the assets of an entity after deducting all of its liabilities. Equity instruments issued by the Bank are recognised at the proceeds received, net of direct issue costs. Repurchase of the Bank’s own equity instruments is recognised and deducted directly in equity. No gain/loss is recognised in profit or loss on the purchase, sale, issue or cancellation of the Bank’s own equity instruments
(xiv) Financial Liabilities and Equity
The Bank recognizes financial liabilities when it first becomes a party to the contractual rights and obligations in the relevant contracts.
Under IFRS 9, financial liabilities are either classified as financial liabilities at amortised cost or financial liabilities at FVTPL.
The Bank classifies its financial liabilities as measured at amortised cost, except for:
i. Financial liabilities at FVTPL: this classification is applied to derivatives, financial liabilities held for trading (e.g. short positions in the trading booking) and other financial liabilities designated as such at initial recognition. Gains or losses from financial liabilities designated at fair value through profit or loss are presented partially in other comprehensive income (the amount of change in the fair value of the financial liability that is attributable to changes in the Bank’s own credit risk, which is determined as the amount that is not attributable to changes in market conditions that give rise to market risk) and partially profit or loss (the remaining amount of change in the fair value of the liability). This is unless such a presentation would create, or enlarge, an accounting mismatch, in which case the gains and losses attributable to changes in the Bank’s credit risk are also presented in profit or loss;
ii. Financial guarantee contracts and commitments.
Other financial liabilities (not measured at FVTPL), including deposits and borrowings, are initially measured at fair value, net of transaction costs and subsequently measured at amortised cost using the effective interest method.
The effective interest method is a method of calculating the amortised cost of a financial liability and of allocating interest expense over the relevant period. The EIR is the rate that exactly discounts estimated future cash payments through the expected life of the financial liability, or, where appropriate, a shorter period, to the net carrying amount on initial recognition.
The Bank derecognises financial liabilities when, and only when, the Bank’s obligations are discharged, cancelled or have expired. The difference between the carrying amount of the financial liability derecognised and the consideration paid and payable is recognised in profit or loss.
When the Bank exchanges with the existing lender one debt instrument into another one with substantially different terms, such exchange is accounted for as an extinguishment of the original financial liability and the recognition of a new financial liability. Similarly, the Bank accounts for substantial modification of terms of an existing liability or part of it as an extinguishment of the original financial liability and the recognition of a new liability. It is assumed that the terms are substantially different if the discounted present value of the cash flows under the new terms, including any fees paid net of any fees received and discounted using the original effective rate is at least 10 per cent different from the discounted present value of the remaining cash flows of the original financial liability.
(xv) Reclassification of financial assets
Financial assets are reclassified when and only when the business model for managing those assets changes. The reclassification takes place from the start of the first reporting period following the change. Such changes are expected to be very infrequent and none occurred during the period.
(xvi) Modification and derecognition of financial assets and liabilities
A modification of a financial asset occurs when the contractual terms governing the cash flows of a financial asset are renegotiated or otherwise modified between initial recognition and maturity of the financial asset. A modification affects the amount and/or timing of the contractual cash flows either immediately or at a future date.
In addition, the introduction or adjustment of existing covenants of an existing loan would constitute a modification even if these new or adjusted covenants do not yet affect the cashflows immediately but may affect the cash flows depending on whether the covenant is or is not met (e.g. a change to the increase in the interest rate that arises when covenants are breached).
The Bank renegotiates loans to customers in financial difficulty to maximise collection and minimise the risk of default. A loan forbearance is granted in cases where although the borrower made all reasonable efforts to pay under the original contractual terms, there is a high risk of default or default has already happened and the borrower is expected to be able to meet the revised terms.
The revised terms in most of the cases include an extension of the maturity of the loan, changes to the timing of the cash flows of the loan (principal and interest repayment), reduction in the amount of cash flows due (principal and interest forgiveness) and amendments to covenants.
When a financial asset is modified the Bank assesses whether this modification results in derecognition. In accordance with the Bank’s policy a modification results in derecognition when it gives rise to substantially different terms. To determine if the modified terms are substantially different from the original contractual terms the Bank considers the following:
• Qualitative factors, such as contractual cash flows after modification are no longer SPPI, change in currency or change of counterparty, the extent of change in interest rates, maturity, covenants. If these do not clearly indicate a substantial modification, then;
• A quantitative assessment is performed to compare the present value of the remaining contractual cash flows under
Notes

Notes57United Bank for Africa (Ghana) Limited
2018 Annual Report
3. Changes in accounting policies and disclosures (continued)3.2 IFRS 9: Financial Instruments (continued)(xvi) Modification and derecognition of financial assets and liabilities (continued)
the original terms with the contractual cash flows under the revised terms, both amounts discounted at the original effective interest.
In the case where the financial asset is derecognised the loss allowance for ECL is remeasured at the date of derecognition to determine the net carrying amount of the asset at that date. The difference between this revised carrying amount and the fair value of the new financial asset with the new terms will lead to a gain or loss on derecognition.
The new financial asset will have a loss allowance measured based on 12-month ECL except in the rare occasions where the new loan is considered to be originated credit impaired. This applies only in the case where the fair value of the new loan is recognised at a significant discount to its revised par amount because there remains a high risk of default which has not been reduced by the modification.
The Bank monitors credit risk of modified financial assets by evaluating qualitative and quantitative information, such as if the borrower is in past due status under the new terms. When the contractual terms of a financial asset are modified and the modification does not result in derecognition, the Bank determines if the financial asset’s credit risk has increased significantly since initial recognition by comparing:
• the remaining lifetime PD estimated based on data at initial recognition and the original contractual terms; with
• the remaining lifetime PD at the reporting date based on the modified terms.
For financial assets modified as part of the Bank’s forbearance policy, where modification did not result in derecognition, the estimate of PD reflects the Bank’s ability to collect the modified cash flows taking into account the Bank’s previous experience of similar forbearance action, as well as various behavioural indicators, including the borrower’s payment performance against the modified contractual terms. If the credit risk remains significantly higher than what was expected at initial recognition the loss allowance will continue to be measured at an amount equal to lifetime ECL. The loss allowance on forborne loans will generally only be measured based on 12-month ECL when there is evidence of the borrower’s improved repayment behaviour following modification leading to a reversal of the previous significant increase in credit risk.
Where a modification does not lead to derecognition the Bank calculates the modification gain/loss comparing the gross carrying amount before and after the modification (excluding the ECL allowance). Then the Bank measures ECL for the modified asset, where the expected cash flows arising from the modified financial asset are included in calculating the expected cash shortfalls from the original asset. The Bank derecognises a financial asset only when the contractual rights to the asset’s cash flows expire (including expiry arising from a modification with substantially different terms), or when the financial asset and substantially all the risks and rewards of ownership of the asset are transferred to another entity.
If the Bank neither transfers nor retains substantially all the risks and rewards of ownership and continues to control the transferred asset, the Bank recognises its retained interest in the asset and an associated liability for amounts it may have to pay. If the Bank retains substantially all the risks and
rewards of ownership of a transferred financial asset, the Bank continues to recognise the financial asset and also recognises a collateralised borrowing for the proceeds received.
On derecognition of a financial asset in its entirety, the difference between the asset’s carrying amount and the sum of the consideration received and receivable and the cumulative gain/loss that had been recognised in OCI and accumulated in equity is recognised in profit or loss, with the exception of equity investment designated as measured at FVTOCI, where the cumulative gain/loss previously recognised in OCI is not subsequently reclassified to profit or loss.
On derecognition of a financial asset other than in its entirety (e.g. when the Bank retains an option to repurchase part of a transferred asset), the Bank allocates the previous carrying amount of the financial asset between the part it continues to recognise under continuing involvement, and the part it no longer recognises on the basis of the relative fair values of those parts on the date of the transfer.
The difference between the carrying amount allocated to the part that is no longer recognised and the sum of the consideration received for the part no longer recognised and any cumulative gain/loss allocated to it that had been recognised in OCI is recognised in profit or loss.
A cumulative gain/loss that had been recognised in OCI is allocated between the part that continues to be recognised and the part that is no longer recognised on the basis of the relative fair values of those parts. This does not apply for equity investments designated as measured at FVTOCI, as the cumulative gain/loss previously recognised in OCI is not subsequently reclassified to profit or loss.
(xvii) Financial Guarantee Contracts
A financial guarantee contract is a contract that requires the issuer to make specified payments to reimburse the holder for a loss it incurs because a specified debtor fails to make payments when due in accordance with the terms of a debt instrument.
Financial guarantee contracts issued by the Bank are initially measured at their fair values and, if not designated as at FVTPL and not arising from a transfer of a financial asset, are subsequently measured at the higher of:
• the amount of the loss allowance determined in accordance with IFRS 9; and
• the amount initially recognised less, where appropriate, cumulative amount of income recognised in accordance with the Bank’s revenue recognition policies.
Financial guarantee contracts not designated at FVTPL are presented as provisions on the consolidated statement of financial position and the remeasurement is presented in other revenue.
The Bank has not designated any financial guarantee contracts as at FVTPL.
(xviii) Commitments to provide a loan at below market interest rate
Commitments to provide a loan at a below-market interest rate are initially measured at their fair values and, if not designated as at FVTPL, are subsequently measured at the higher of:
• the amount of the loss allowance determined in accordance with IFRS 9; and
Notes

Notes58 United Bank for Africa (Ghana) Limited
2018 Annual Report
3. Changes in accounting policies and disclosures (continued)
3.2 IFRS 9: Financial Instruments (continued)
(xviii) Commitments to provide a loan at below market interest rate (continued)
• the amount initially recognised less, where appropriate, cumulative amount of income recognised in accordance with the revenue recognition policies.
Commitments to provide a loan below market rate not designated at FVTPL are presented as provisions in the statement of financial position and the remeasurement is presented in other revenue.
The Bank has not designated any commitments to provide a loan below market rate designated at FVTPL.
3.3 Financial impact assessment of IFRS 9 adoptionMandatory reclassificationsThe combined application of the business model and SPPI tests on adoption of IFRS 9 resulted in the reclassification of the following financial assets. Classification of all financial liabilities remain the same under IFRS 9.
All amounts are expressed in Ghana cedis unless otherwise stated
Measurement category
Carrying amount Previous measurement
category
Carrying amount
As at 1 January 2018 31 December 2017
Financial assets
Cash and cash equivalents Amortised cost 538,466,380 Amortised cost 538,466,380
Investment securities FVOCI 68,068,694 Available-for-sale 68,347,089
Investment securities Amortised cost 1,189,337,509 Held-to-maturity 1,189,337,509
Loans and advances to customers Amortised cost 1,077,743,550 Amortised cost 1,098,846,411
Presentation of the statement of financial positionOn 1 January 2018, the balance sheet line item Investment securities represent all securities other than those measured at FVTPL, which are presented as Financial assets at fair value through profit or loss. For comparative periods, Investment securities represent securities previously classified as available-for-sale and held-to-maturity under IAS 39. For the current period, Investment securities represent securities classified as FVOCI and amortised cost under IFRS 9.
Allowance for credit losses
The following tables show the comparison of impairment allowances determined in accordance with IAS 39 to the corresponding impairment allowance determined in accordance with IFRS 9 as at 1 January, 2018.
Investment securities at
amortised cost
Loans to customers at amortised cost
Off-balance sheet items
Total allowance for credit losses
IAS 39 as at 31 December 2017
Specific impairment - 167,897,631 - 167,897,631
Portfolio impairment - 8,146,057 - 8,146,057
Total - 176,043,688 - 176,043,688
Transition adjustments - 21,102,861 8,997,902 30,100,763
IFRS 9 as at 1 January 2018 - 197,146,549 8,997,902 206,144,451
Stage 1 - 8,136,609 8,997,902 17,134,511
Stage 2 - 9,448 - 9,448
Stage 3 - 189,000,492 - 189,000,492
Total - 197,146,549 8,997,902 206,144,451
(All amounts are expressed in Ghana cedis unless otherwise stated)
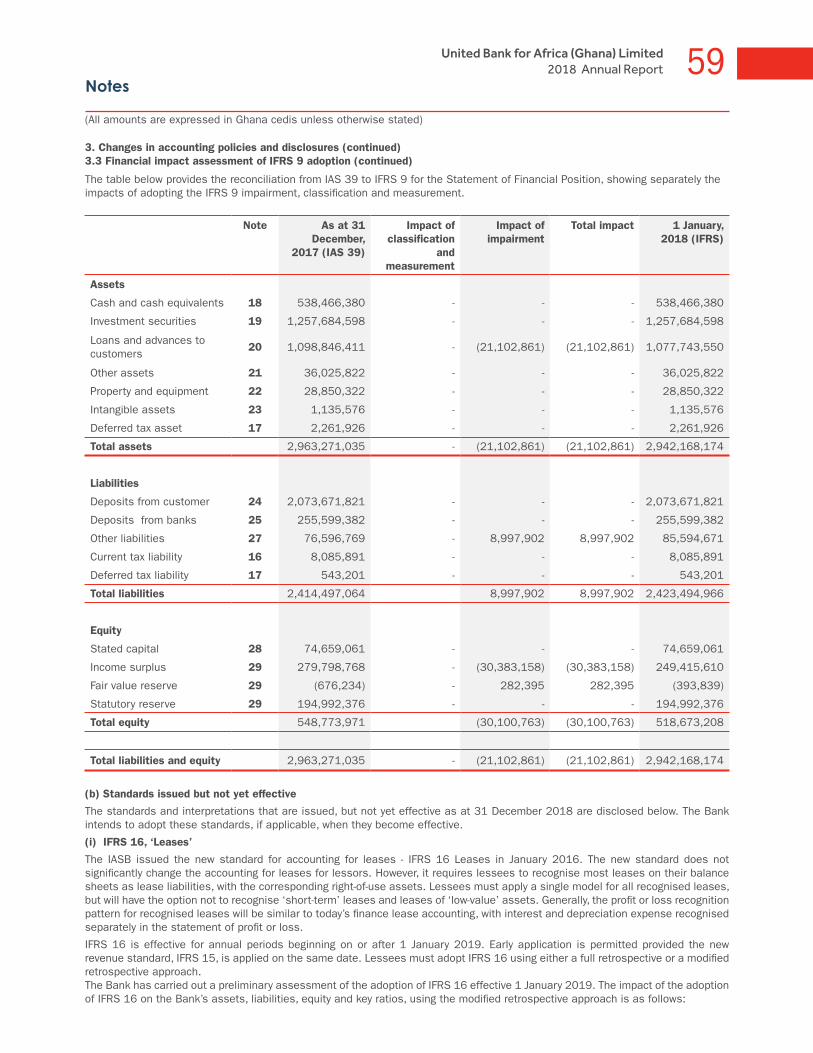
Notes59United Bank for Africa (Ghana) Limited
2018 Annual Report
The table below provides the reconciliation from IAS 39 to IFRS 9 for the Statement of Financial Position, showing separately the impacts of adopting the IFRS 9 impairment, classification and measurement.
Note As at 31 December,
2017 (IAS 39)
Impact of classification
and measurement
Impact of impairment
Total impact 1 January, 2018 (IFRS)
Assets
Cash and cash equivalents 18 538,466,380 - - - 538,466,380
Investment securities 19 1,257,684,598 - - - 1,257,684,598
Loans and advances to customers
20 1,098,846,411 - (21,102,861) (21,102,861) 1,077,743,550
Other assets 21 36,025,822 - - - 36,025,822
Property and equipment 22 28,850,322 - - - 28,850,322
Intangible assets 23 1,135,576 - - - 1,135,576
Deferred tax asset 17 2,261,926 - - - 2,261,926
Total assets 2,963,271,035 - (21,102,861) (21,102,861) 2,942,168,174
Liabilities
Deposits from customer 24 2,073,671,821 - - - 2,073,671,821
Deposits from banks 25 255,599,382 - - - 255,599,382
Other liabilities 27 76,596,769 - 8,997,902 8,997,902 85,594,671
Current tax liability 16 8,085,891 - - - 8,085,891
Deferred tax liability 17 543,201 - - - 543,201
Total liabilities 2,414,497,064 8,997,902 8,997,902 2,423,494,966
Equity
Stated capital 28 74,659,061 - - - 74,659,061
Income surplus 29 279,798,768 - (30,383,158) (30,383,158) 249,415,610
Fair value reserve 29 (676,234) - 282,395 282,395 (393,839)
Statutory reserve 29 194,992,376 - - - 194,992,376
Total equity 548,773,971 (30,100,763) (30,100,763) 518,673,208
Total liabilities and equity 2,963,271,035 - (21,102,861) (21,102,861) 2,942,168,174
(b) Standards issued but not yet effective
The standards and interpretations that are issued, but not yet effective as at 31 December 2018 are disclosed below. The Bank intends to adopt these standards, if applicable, when they become effective.
(i) IFRS 16, ‘Leases’
The IASB issued the new standard for accounting for leases - IFRS 16 Leases in January 2016. The new standard does not significantly change the accounting for leases for lessors. However, it requires lessees to recognise most leases on their balance sheets as lease liabilities, with the corresponding right-of-use assets. Lessees must apply a single model for all recognised leases, but will have the option not to recognise ‘short-term’ leases and leases of ‘low-value’ assets. Generally, the profit or loss recognition pattern for recognised leases will be similar to today’s finance lease accounting, with interest and depreciation expense recognised separately in the statement of profit or loss.
IFRS 16 is effective for annual periods beginning on or after 1 January 2019. Early application is permitted provided the new revenue standard, IFRS 15, is applied on the same date. Lessees must adopt IFRS 16 using either a full retrospective or a modified retrospective approach. The Bank has carried out a preliminary assessment of the adoption of IFRS 16 effective 1 January 2019. The impact of the adoption of IFRS 16 on the Bank’s assets, liabilities, equity and key ratios, using the modified retrospective approach is as follows:
3. Changes in accounting policies and disclosures (continued)3.3 Financial impact assessment of IFRS 9 adoption (continued)
(All amounts are expressed in Ghana cedis unless otherwise stated)

Notes60 United Bank for Africa (Ghana) Limited
2018 Annual Report
3. Changes in accounting policies and disclosures (continued)(i) IFRS 16, ‘Leases’ (continued)
All amounts are in Ghana cedis unless otherwise stated
IAS 17 IFRS 16 Impact
Total assets 3,584,077,838 3,606,365,172 22,287,334
Total liabilities 2,921,890,129 2,945,007,250 23,117,121
Shareholders' funds 662,187,708 661,357,922 (829,786)
Risk weighted assets 3,116,742,576 3,139,029,910 22,287,334
Capital adequacy ratio 16.4% 15.5% (0.9)%
Leverage ratio 13.1% 13.0% (0.1)%
(ii) IFRS 17, ‘Insurance Contracts’
IFRS 17 establishes the principles for the recognition, measurement, presentation and disclosure of insurance contracts within the scope of the standard. The objective of IFRS 17 is to ensure that an entity provides relevant information that faithfully represents those contracts. This information gives a basis for users of financial statements to assess the effect that insurance contracts have on the entity’s financial position, financial performance and cash flows. IFRS 17 was issued in May 2017 and applies to annual reporting periods beginning on or after 1 January 2021.
4. Financial risk management
The Bank’s activities expose it to a variety of financial risks and those activities involve the analysis, evaluation, acceptance and management of some degree of risk or combination of risks. Taking risk is core to the Bank’s business, and the operational risks are an inevitable consequence of being in business. The Bank’s aim is therefore to achieve an appropriate balance between risk and return and minimise potential adverse effects on its financial performance. The most important types of risk include; credit risk, liquidity risk and market risk- comprising currency, interest rate and other price risk.
Risk Management Framework
The Board of Directors has overall responsibility for the establishment and oversight of the Bank’s risk management framework. The Board has established a Risk Management Committee in support of their risk oversight objectives and responsibilities. There is also a Risk Management Department which has responsibility for the implementation of the Bank’s risk control principles, frameworks and processes across the entire risk spectrum.
The Bank’s risk management policies are established to identify and analyse the risks faced by the Bank, to set appropriate risk limits and controls, and to monitor risks and adherence to limits. Risk management policies and systems are reviewed regularly to reflect changes in market conditions, products and services offered. The Bank, through its training and management standards and procedures, aims to develop a disciplined and constructive control environment, in which all employees understand their roles and obligations.
4.1 Credit Risk
Credit risk is the risk of financial loss to the Bank if a customer or counterparty to a financial instrument fails to fulfil its contractual obligations. Credit risk arises mainly from interbank, commercial and consumer loans and advances and loan commitments arising from such lending activities but can also arise from credit enhancement provided such as financial guarantees, letters of credits, endorsements and acceptances.
The Bank is also exposed other credit risks arising from investments in debt securities and exposures arising from its other trading activities including settlement balances with market counterparties and reverse purchase agreements.
Credit risk is the single largest risk for the Bank’s business; management therefore carefully manages its exposure to credit risk.
(All amounts are expressed in cedis unless otherwise stated)
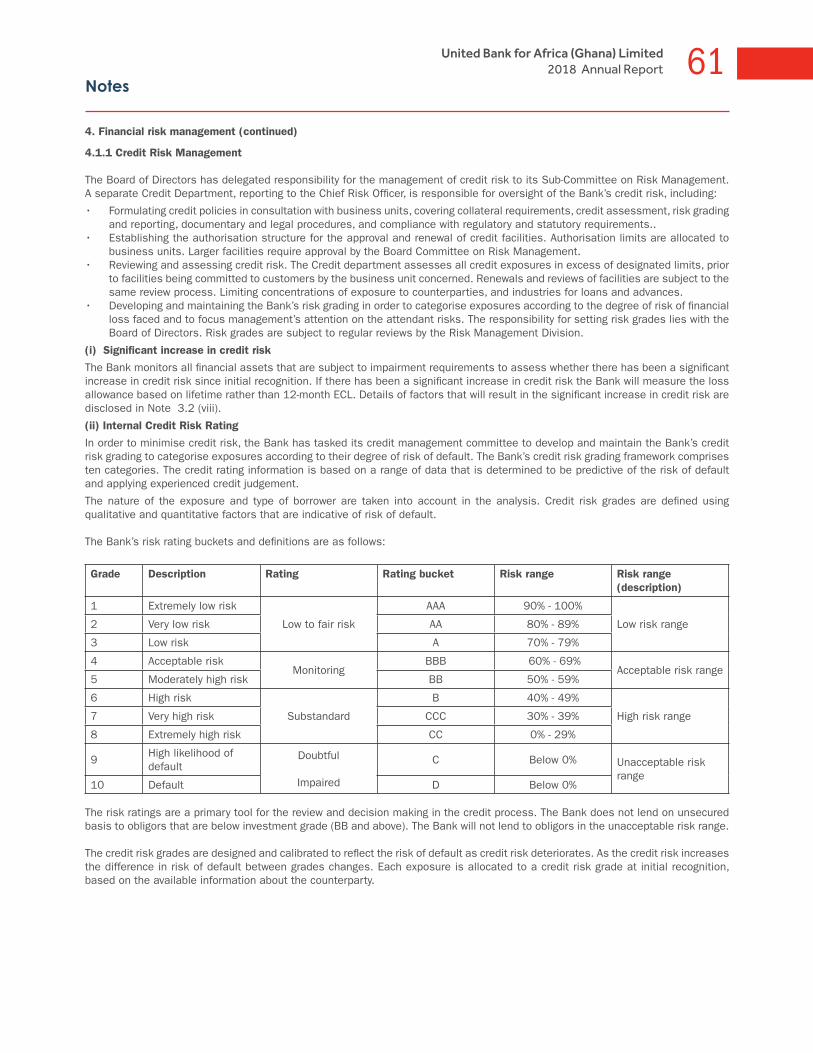
Notes61United Bank for Africa (Ghana) Limited
2018 Annual Report
4. Financial risk management (continued)
4.1.1 Credit Risk Management
The Board of Directors has delegated responsibility for the management of credit risk to its Sub-Committee on Risk Management. A separate Credit Department, reporting to the Chief Risk Officer, is responsible for oversight of the Bank’s credit risk, including:
• Formulating credit policies in consultation with business units, covering collateral requirements, credit assessment, risk grading and reporting, documentary and legal procedures, and compliance with regulatory and statutory requirements..
• Establishing the authorisation structure for the approval and renewal of credit facilities. Authorisation limits are allocated to business units. Larger facilities require approval by the Board Committee on Risk Management.
• Reviewing and assessing credit risk. The Credit department assesses all credit exposures in excess of designated limits, prior to facilities being committed to customers by the business unit concerned. Renewals and reviews of facilities are subject to the same review process. Limiting concentrations of exposure to counterparties, and industries for loans and advances.
• Developing and maintaining the Bank’s risk grading in order to categorise exposures according to the degree of risk of financial loss faced and to focus management’s attention on the attendant risks. The responsibility for setting risk grades lies with the Board of Directors. Risk grades are subject to regular reviews by the Risk Management Division.
(i) Significant increase in credit risk
The Bank monitors all financial assets that are subject to impairment requirements to assess whether there has been a significant increase in credit risk since initial recognition. If there has been a significant increase in credit risk the Bank will measure the loss allowance based on lifetime rather than 12-month ECL. Details of factors that will result in the significant increase in credit risk are disclosed in Note 3.2 (viii).
(ii) Internal Credit Risk Rating
In order to minimise credit risk, the Bank has tasked its credit management committee to develop and maintain the Bank’s credit risk grading to categorise exposures according to their degree of risk of default. The Bank’s credit risk grading framework comprises ten categories. The credit rating information is based on a range of data that is determined to be predictive of the risk of default and applying experienced credit judgement.
The nature of the exposure and type of borrower are taken into account in the analysis. Credit risk grades are defined using qualitative and quantitative factors that are indicative of risk of default.
The Bank’s risk rating buckets and definitions are as follows:
Grade Description Rating Rating bucket Risk range Risk range (description)
1 Extremely low risk
Low to fair risk
AAA 90% - 100%
Low risk range2 Very low risk AA 80% - 89%
3 Low risk A 70% - 79%
4 Acceptable risk Monitoring
BBB 60% - 69% Acceptable risk range
5 Moderately high risk BB 50% - 59%
6 High risk
Substandard
B 40% - 49%
High risk range7 Very high risk CCC 30% - 39%
8 Extremely high risk CC 0% - 29%
9High likelihood of default
Doubtful
Impaired
C Below 0% Unacceptable risk range
10 Default D Below 0%
The risk ratings are a primary tool for the review and decision making in the credit process. The Bank does not lend on unsecured basis to obligors that are below investment grade (BB and above). The Bank will not lend to obligors in the unacceptable risk range.
The credit risk grades are designed and calibrated to reflect the risk of default as credit risk deteriorates. As the credit risk increases the difference in risk of default between grades changes. Each exposure is allocated to a credit risk grade at initial recognition, based on the available information about the counterparty.

Notes62 United Bank for Africa (Ghana) Limited
2018 Annual Report
4. Financial risk management 4.1.1 Credit Risk Management (continued)(ii) Internal Credit Risk Rating (continued)
All exposures are monitored and the credit risk grade is updated to reflect current information. The monitoring procedures followed are both general and tailored to the type of exposure. The following data are typically used to monitor the Bank’s exposures:• Payment record, including payment ratios and ageing
analysis;• Extent of utilisation of granted limit;• Forbearances (both requested and granted);• Changes in business, financial and economic conditions;• Credit rating information supplied by external rating
agencies;• For retail exposures: internally generated data of customer
behaviour, affordability metrics etc.
The Bank uses credit risk grades as a primary input into the determination of the term structure of the PD for exposures. The Bank collects performance and default information about its credit risk exposures analysed by jurisdiction or region and by type of product and borrower as well as by credit risk grading. The information used is both internal and external depending on the portfolio assessed.
The Bank analyses all data collected using statistical models and estimates the remaining lifetime PD of exposures and how these are expected to change over time. The factors taken into account in this process include macro-economic data such as GDP growth, unemployment and benchmark interest rates.
The Bank generates a ‘base case’ scenario of the future direction of relevant economic variables as well as a representative range of other possible forecast scenarios. The Bank then uses these forecasts, which are probability-weighted, to adjust its estimates of PDs. The Bank uses different criteria to determine whether credit risk has increased significantly per portfolio of assets. The criteria used are both quantitative changes in PDs as well as qualitative.
Irrespective of the outcome of the above assessment, the Bank presumes that the credit risk on a financial asset has increased significantly since initial recognition when contractual payments are more than 30 days past due unless the Bank has reasonable and supportable information that demonstrates otherwise.
The Bank has monitoring procedures in place to make sure that the criteria used to identify significant increases in credit are effective, meaning that significant increase in credit risk is identified before the exposure is defaulted or when the asset becomes 30 days past due.
The Bank performs periodic back-testing of its ratings to consider whether the drivers of credit risk that led to default were accurately reflected in the rating in a timely manner.
Incorporation of forward looking information
The Bank uses forward-looking information that is available without undue cost or effort in its assessment of significant increase of credit risk as well as in its measurement of ECL. The Bank employs experts who use external and internal information to generate a ‘base case’ scenario of future forecast of relevant economic variables along with a representative range of other possible forecast scenarios.
The external information used includes economic data and forecasts published by governmental bodies and monetary
authorities. The Bank applies probabilities to the forecast scenarios identified. The base case scenario is the single most-likely outcome and consists of information used by the Bank for strategic planning and budgeting.
The Bank has identified and documented key drivers of credit risk and credit losses for each portfolio of financial instruments and, using a statistical analysis of historical data, has estimated relationships between macro-economic variables and credit risk and credit losses. The Bank has not made changes in the estimation techniques or significant assumptions made during the reporting period.
Grouping of instruments for losses measured on a collective basis
For expected credit loss provisions modelled on a collective basis, a grouping of exposures is performed on the basis of shared risk characteristics, such that risk exposures within a group are homogeneous. In performing this grouping, there must be sufficient information for the group to be statistically credible. The grouping of financial instruments for assessment of credit loss provisions on a collective basis is based on the industry sectors of the exposures. Stage 2 and Stage 3 loans are however assessed individually.
Grouping of instruments for losses measured on a collective basis (continued)
The Base PD’s applied for the various sectors are as follows:
Agriculture, Forestry & Fishing
8.92%
Manufacturing 8.43%
Commerce & Finance 1.46%
Transportation 0.29%
Construction 18.34%
Services 3.74%
Oil & Gas 0.56%
Power 14.86%
Miscellaneous 13.87%
The appropriateness of the groupings is monitored and reviewed on a quarterly basis.
Measurement of ECL
The key inputs used for measuring ECL are:• probability of default (PD);• loss given default (LGD); and• exposure at default (EAD).
As explained above these figures are generally derived from internally developed statistical models and other historical data and they are adjusted to reflect probability-weighted forward-looking information. PD is an estimate of the likelihood of default over a given time horizon. It is estimated as at a point in time.
The calculation is based on statistical rating models, and assessed using rating tools tailored to the various categories of counterparties and exposures. These statistical models are based on market data (where available), as well as internal data comprising both quantitative and qualitative factors.

Notes63United Bank for Africa (Ghana) Limited
2018 Annual Report
4. Financial risk management (continued)4.1.1 Credit Risk Management (continued)
Measurement of ECL (continued)
PDs are estimated considering the contractual maturities of exposures and estimated prepayment rates.
The estimation is based on current conditions, adjusted to take into account estimates of future conditions that will impact PD. LGD is an estimate of the loss arising on default. It is based on the difference between the contractual cash flows due and those that the lender would expect to receive, taking into account cash flows from any collateral.
The LGD models for secured assets consider forecasts of future collateral valuation taking into account sale discounts, time to realisation of collateral, cross-collateralisation and seniority of claim, cost of realisation of collateral and cure rates (i.e. exit from non-performing status). LGD models for unsecured assets consider time of recovery, recovery rates and seniority of claims.
The calculation is on a discounted cash flow basis, where the cash flows are discounted by the original EIR of the loan. EAD is an estimate of the exposure at a future default date, taking into account expected changes in the exposure after the reporting date, including repayments of principal and interest, and expected drawdowns on committed facilities.
The Bank’s modelling approach for EAD reflects expected changes in the balance outstanding over the lifetime of the loan exposure that are permitted by the current contractual terms, such as amortisation profiles, early repayment or overpayment, changes in utilisation of undrawn commitments and credit mitigation actions taken before default.
The Bank uses EAD models that reflect the characteristics of the portfolios. The Bank measures ECL considering the risk of default over the maximum contractual period (including extension options) over which the entity is exposed to credit risk and not a longer period, even if contact extension or renewal is common business practice. However, for financial instruments such as credit cards, revolving credit facilities and overdraft facilities that include both a loan and an undrawn commitment component, the Bank’s contractual ability to demand repayment and cancel the undrawn commitment does not limit the Bank’s exposure to credit losses to the contractual notice period.
For such financial instruments the Bank measures ECL over the period that it is exposed to credit risk and ECL would not be mitigated by credit risk management actions, even if that period extends beyond the maximum contractual period. These financial instruments do not have a fixed term or repayment structure and have a short contractual cancellation period.
However, the Bank does not enforce in the normal day-to-day management the contractual right to cancel these financial instruments. This is because these financial instruments are managed on a collective basis and are cancelled only when the Bank becomes aware of an increase in credit risk at the facility level. This longer period is estimated taking into account the credit risk management actions that the Bank expects to take to mitigate ECL, e.g. reduction in limits or cancellation of the loan commitment.
4.1.2 Risk limit control and mitigation policies
The Bank manages, limits and controls concentrations of credit risk wherever they are identified − in particular, to individual counterparties and banks, and to industries and countries.
The Bank structures the levels of credit risk it undertakes by placing limits on the amount of risk accepted in relation to
one borrower, or banks of borrowers, and to geographical and industry segments. Such risks are monitored on a revolving basis and subject to an annual or more frequent review, when considered necessary. Limits on the level of credit risk by product and industry sector are approved quarterly by the Board of Directors.
The exposure to any one borrower including banks and brokers is further restricted by sub-limits covering on- and off-balance sheet exposures, and daily delivery risk limits in relation to trading items such as forward foreign exchange contracts. Actual exposures against limits are monitored daily.
Lending limits are reviewed in the light of changing market and economic conditions and periodic credit reviews and assessments of probability of default.
Some other specific control and mitigation measures are outlined below:
(a) Collateral
The Bank employs a range of policies and practices to mitigate credit risk. The most traditional of these is the taking of security for funds advanced, which is common practice. The Bank implements guidelines on the acceptability of specific classes of collateral or credit risk mitigation. The principal collateral types for loans and advances are:
• Mortgages over residential properties.
• Charges over business assets such as premises, inventory and accounts receivable.
• Charges over financial instruments such as debt securities and equities.
Collateral held as security for financial assets other than loans and advances depends on the nature of the instrument. Longer-term finance and lending to corporate entities are generally secured; revolving individual credit facilities are generally unsecured. In addition, in order to minimise the credit loss the Bank will seek additional collateral from the counterparty as soon as impairment indicators are identified for the relevant individual loans and advances.
(b) Financial covenants (for credit related commitments and loan books)
The primary purpose of these instruments is to ensure that funds are available to a customer as required. Guarantees and standby letters of credit carry the same credit risk as loans. Documentary and commercial letters of credit – which are written undertakings by the Bank on behalf of a customer authorising a third party to draw drafts on the Bank up to a stipulated amount under specific terms and conditions – are collateralised by the underlying shipments of goods to which they relate and therefore carry less risk than a direct loan.
Commitments to extend credit represent unused portions of authorisations to extend credit in the form of loans, guarantees or letters of credit. With respect to credit risk on commitments to extend credit, the Bank is potentially exposed to loss in an amount equal to the total unused commitments. However, the likely amount of loss is less than the total unused commitments, as most commitments to extend credit are contingent upon customers maintaining specific credit standards (often referred to as financial covenants).

Notes64 United Bank for Africa (Ghana) Limited
2018 Annual Report
4. Financial risk management 4.1.2 Risk limit control and mitigation policies (continued)
The Bank monitors the term to maturity of credit commitments because longer-term commitments generally have a greater degree of credit risk than shorter-term commitments.
4.1.3 Maximum exposure to credit risk before collateral held or other credit enhancements
The Bank’s maximum exposure to credit risk is represented by the gross carrying amounts of the financial assets with the exception of financial and other guarantees issued by the Bank for which the maximum exposure to credit risk is represented by the maximum amount the Bank would have to pay if the guarantees are called on. The financial assets are categorised by the industry sectors of the Bank’s counterparties.
Loans and advances to customers form 24.1% of the total maximum exposure (2017: 41.1%); 59.5% represent investments in government securities (2017: 40.6%) and 16.4% represent balances with banks, placements and other assets (2017: 18.3%).
The following table breaks down the Bank’s credit exposure at carrying amounts (without taking into account any collateral held or other credit support), as categorised by the industry sectors of the Bank’s counterparties.
On balance sheet
At 31 December 2018 Loans and advances to
customers
Cash and balances with
Bank of Ghana
Due from other Banks
Investment Securities
Other Assets (less
prepayments)
Total
Agriculture 270,706 - - - - 270,706
Manufacturing 20,015,288 - - - - 20,015,288
Commerce and Finance 151,013,618 267,129,029 279,607,836 2,270,622,131 72,083,707 3,040,456,321
Transport and communications
5,097,725 - - - - 5,097,725
Building and construction 1,052,562 - - - - 1,052,562
Services 17,051,775 - - - - 17,051,775
Oil and Gas 705,649,312 - - - - 705,649,312
Miscellaneous (Consumer) 20,056,664 - - - - 20,056,664
Total 920,207,650 267,129,029 279,607,836 2,270,622,131 72,083,707 3,809,650,353
Allowance for credit losses (286,001,549) - (467,339) (1,079,442) (1,347,690) (288,896,020)
Net carrying amount 634,206,101 267,129,029 279,140,497 2,269,542,689 70,736,017 3,520,754,333
At 31 December 2017 Loans and advances to
customers
Cash and balances with
Bank of Ghana
Due from other Banks
Investment Securities
Other Assets (less
prepayments)
Total
Agriculture 9,241,448 - - - - 9,241,448
Manufacturing 19,220,421 - - - - 19,220,421
Commerce and Finance 96,177,596 248,881,165 289,585,215 1,257,684,598 29,276,940 1,921,605,514
Transport and communications
560,298,251 - - - - 560,298,251
Building and construction 1,007,818 - - - - 1,007,818
Services 18,376,962 - - - - 18,376,962
Oil and Gas 550,906,106 - - - - 550,906,106
Power 677 - - - - 677
Miscellaneous (Consumer) 19,660,820 - - - - 19,660,820
Total 1,274,890,099 248,881,165 289,585,215 1,257,684,598 29,276,940 3,100,318,017
Impairment (176,043,688) - - (739,151) (176,782,839)
Net carrying amount 1,098,846,411 248,881,165 289,585,215 1,257,684,598 28,537,789 2,923,535,178
(All amounts are expressed in cedis unless otherwise stated)
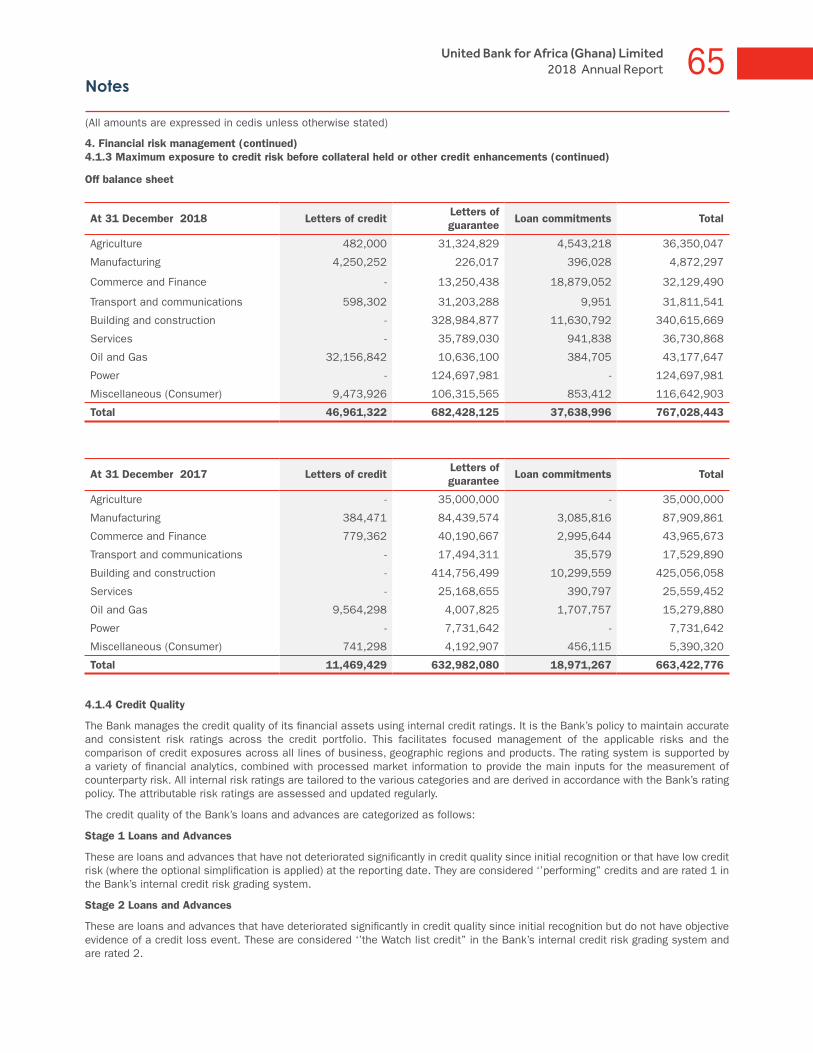
Notes65United Bank for Africa (Ghana) Limited
2018 Annual Report
Off balance sheet
At 31 December 2018 Letters of creditLetters of guarantee
Loan commitments Total
Agriculture 482,000 31,324,829 4,543,218 36,350,047
Manufacturing 4,250,252 226,017 396,028 4,872,297
Commerce and Finance - 13,250,438 18,879,052 32,129,490
Transport and communications 598,302 31,203,288 9,951 31,811,541
Building and construction - 328,984,877 11,630,792 340,615,669
Services - 35,789,030 941,838 36,730,868
Oil and Gas 32,156,842 10,636,100 384,705 43,177,647
Power - 124,697,981 - 124,697,981
Miscellaneous (Consumer) 9,473,926 106,315,565 853,412 116,642,903
Total 46,961,322 682,428,125 37,638,996 767,028,443
At 31 December 2017 Letters of creditLetters of guarantee
Loan commitments Total
Agriculture - 35,000,000 - 35,000,000
Manufacturing 384,471 84,439,574 3,085,816 87,909,861
Commerce and Finance 779,362 40,190,667 2,995,644 43,965,673
Transport and communications - 17,494,311 35,579 17,529,890
Building and construction - 414,756,499 10,299,559 425,056,058
Services - 25,168,655 390,797 25,559,452
Oil and Gas 9,564,298 4,007,825 1,707,757 15,279,880
Power - 7,731,642 - 7,731,642
Miscellaneous (Consumer) 741,298 4,192,907 456,115 5,390,320
Total 11,469,429 632,982,080 18,971,267 663,422,776
4. Financial risk management (continued)4.1.3 Maximum exposure to credit risk before collateral held or other credit enhancements (continued)
4.1.4 Credit Quality
The Bank manages the credit quality of its financial assets using internal credit ratings. It is the Bank’s policy to maintain accurate and consistent risk ratings across the credit portfolio. This facilitates focused management of the applicable risks and the comparison of credit exposures across all lines of business, geographic regions and products. The rating system is supported by a variety of financial analytics, combined with processed market information to provide the main inputs for the measurement of counterparty risk. All internal risk ratings are tailored to the various categories and are derived in accordance with the Bank’s rating policy. The attributable risk ratings are assessed and updated regularly.
The credit quality of the Bank’s loans and advances are categorized as follows:
Stage 1 Loans and Advances
These are loans and advances that have not deteriorated significantly in credit quality since initial recognition or that have low credit risk (where the optional simplification is applied) at the reporting date. They are considered ‘’performing’’ credits and are rated 1 in the Bank’s internal credit risk grading system.
Stage 2 Loans and Advances
These are loans and advances that have deteriorated significantly in credit quality since initial recognition but do not have objective evidence of a credit loss event. These are considered ‘’the Watch list credit’’ in the Bank’s internal credit risk grading system and are rated 2.
(All amounts are expressed in cedis unless otherwise stated)
Notes66 United Bank for Africa (Ghana) Limited
2018 Annual Report
4. Financial risk management (continued)4.1.4 Credit Quality (continued)
Stage 3 Loans and Advances
These are loans and advances that have objective evidence of a credit loss event. Stage 3 allocation is driven by either the identification of credit impairment or an exposure being classified as defaulted. These loans are considered “non performing” in the Bank’s internal credit risk grading system and are rated 3 or 4.
All loans and advances are categorized as follows in the comparative period:
Neither past due nor impaired
These are loans and securities where contractual interest or principal payments are not past due.
Past due but not impaired
Loans and securities where contractual interest or principal payments are past due but the Bank believes that impairment is not appropriate on the basis of the level of security / collateral available and / or the stage of collection of amounts owed to the Bank.
Impaired loans and securities
Impaired loans and securities are loans and securities for which the Bank determines that it is probable that it will be unable to collect all principal and interest due according to the contractual terms of the loan / securities agreement(s). These are loans and securities specifically impaired.
Loans with renegotiated terms
The contractual terms of a loan may be modified for a number of reasons including changing market conditions, customer retention and other factors not related to a current or potential credit deterioration of the customer. The Bank renegotiates loans to customers to maximise collection opportunities and minimise the risk of default. The revised terms of renegotiated facilities usually include extended maturity, changing timing of interest payments and amendments to the terms of the loan agreement. There are no loans or other financial assets with renegotiated terms as at 31 December 2018 (December 2017: nil).
Impairment assessment under IFRS 9
The Bank assesses its impairment for the purpose of IFRS reporting using the ‘forward-looking’ Expected Credit Loss (ECL) model in line with provisions of IFRS 9 - Financial Instruments.
The Bank records an allowance for expected losses for all loans and other debt financial assets not held at FVPL, together with loan commitments and financial guarantee contracts. The allowance is based on the expected credit losses associated with the probability of default in the next twelve months unless there has been a significant increase in credit risk since origination, in which case, the allowance is based on the probability of default over the life of the asset.
The measurement of expected credit losses is based on the product of the instrument’s probability of default (PD), loss given default (LGD), and exposure at default (EAD), discounted to the reporting date using the effective interest rate.
The ECL model has three stages. The Bank recognises a 12-month expected loss allowance on initial recognition (stage 1) and a lifetime expected loss allowance when there has been a significant increase in credit risk since initial recognition (stage 2). Stage 3 requires objective evidence that an asset is credit-impaired and then a lifetime expected loss allowance is recognised.
Write-off policy
The Bank writes off a loan / security balance (and any related allowances for impairment losses) when the Credit department determines that the loans are uncollectible. This determination is reached after considering information such as the occurrence of significant changes in the borrower’s financial position such that the borrower can no longer pay the obligation, or that proceeds from collateral will not be sufficient to pay back the entire exposure.
For smaller balance standardised loans, charge off decisions generally are based on a product specific past due status. Loan write off requires approval of the Board of Directors and the Bank of Ghana.
Credit Risk Exposure
An analysis of the Bank’s credit risk exposure per class of financial asset, internal rating and “stage” without taking into account the effects of any collateral or other credit enhancements is provided in the following tables. Unless specifically indicated, for financial assets, the amounts in the table represent gross carrying amounts. For loan commitments and financial guarantee contracts, the amounts in the table represent the amounts committed or guaranteed, respectively.
(All amounts are expressed in cedis unless otherwise stated)
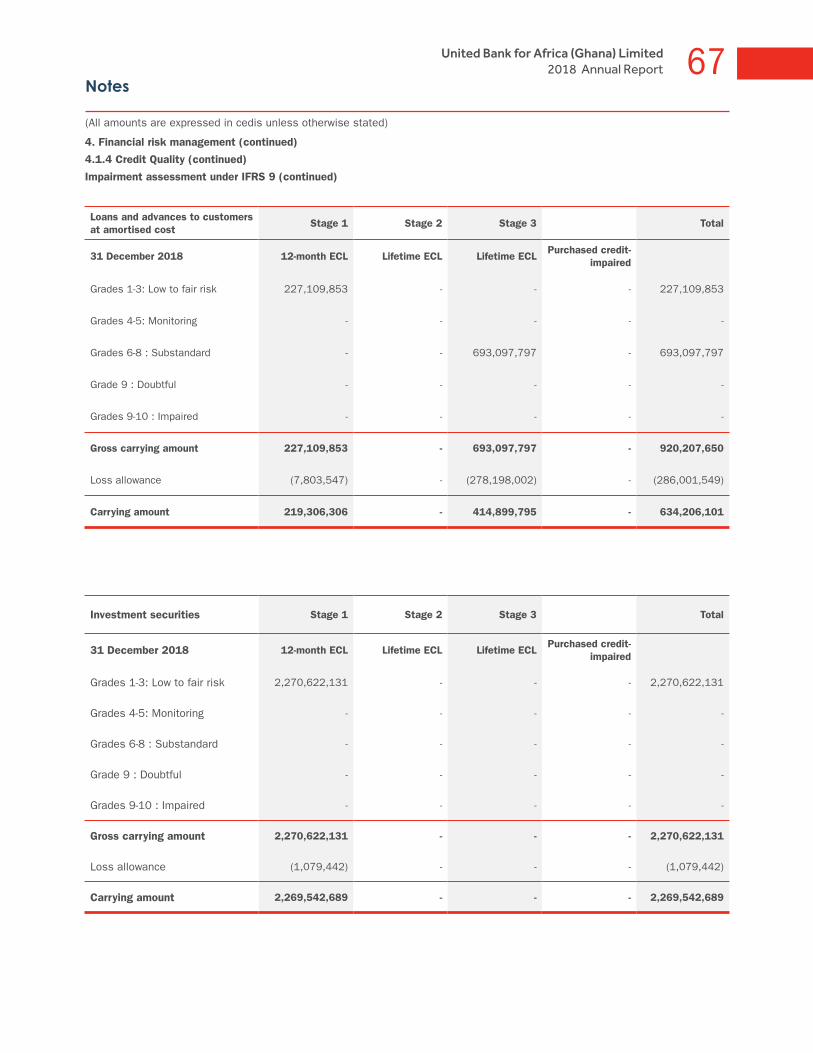
Notes67United Bank for Africa (Ghana) Limited
2018 Annual Report
4. Financial risk management (continued)
4.1.4 Credit Quality (continued)
Impairment assessment under IFRS 9 (continued)
Loans and advances to customers at amortised cost
Stage 1 Stage 2 Stage 3 Total
31 December 2018 12-month ECL Lifetime ECL Lifetime ECLPurchased credit-
impaired
Grades 1-3: Low to fair risk 227,109,853 - - - 227,109,853
Grades 4-5: Monitoring - - - - -
Grades 6-8 : Substandard - - 693,097,797 - 693,097,797
Grade 9 : Doubtful - - - - -
Grades 9-10 : Impaired - - - - -
Gross carrying amount 227,109,853 - 693,097,797 - 920,207,650
Loss allowance (7,803,547) - (278,198,002) - (286,001,549)
Carrying amount 219,306,306 - 414,899,795 - 634,206,101
Investment securities Stage 1 Stage 2 Stage 3 Total
31 December 2018 12-month ECL Lifetime ECL Lifetime ECLPurchased credit-
impaired
Grades 1-3: Low to fair risk 2,270,622,131 - - - 2,270,622,131
Grades 4-5: Monitoring - - - - -
Grades 6-8 : Substandard - - - - -
Grade 9 : Doubtful - - - - -
Grades 9-10 : Impaired - - - - -
Gross carrying amount 2,270,622,131 - - - 2,270,622,131
Loss allowance (1,079,442) - - - (1,079,442)
Carrying amount 2,269,542,689 - - - 2,269,542,689
(All amounts are expressed in cedis unless otherwise stated)
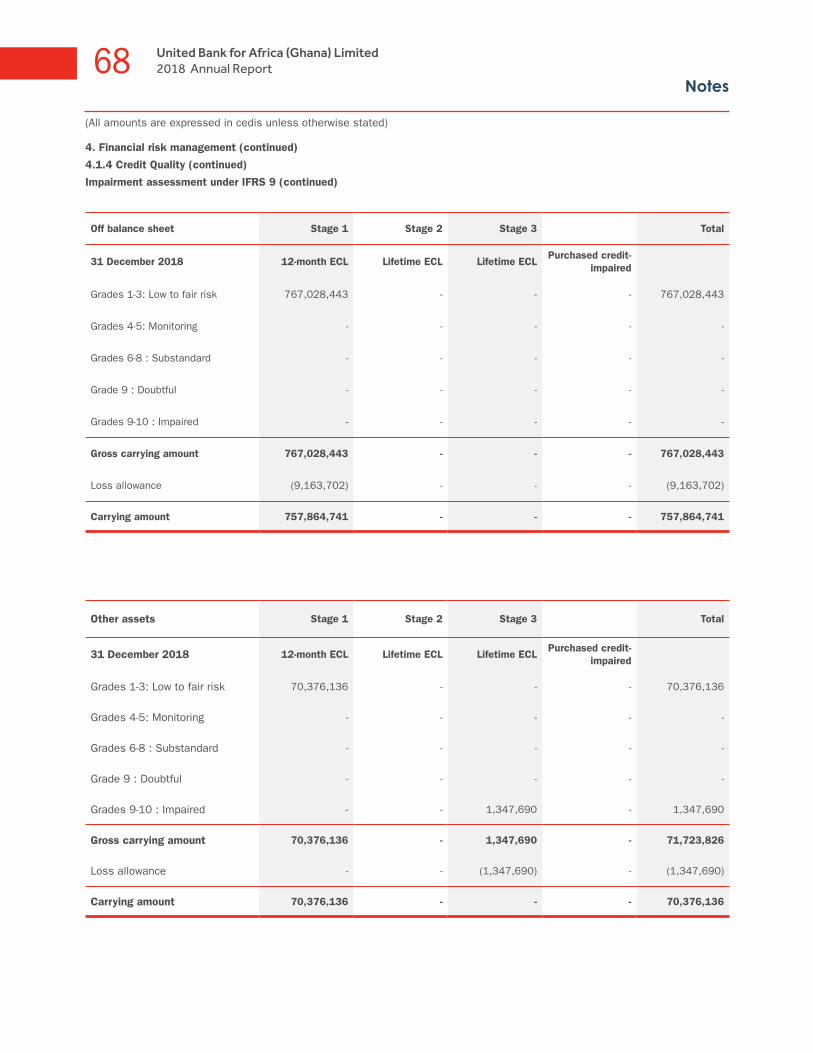
Notes68 United Bank for Africa (Ghana) Limited
2018 Annual Report
4. Financial risk management (continued)
4.1.4 Credit Quality (continued)
Impairment assessment under IFRS 9 (continued)
Off balance sheet Stage 1 Stage 2 Stage 3 Total
31 December 2018 12-month ECL Lifetime ECL Lifetime ECLPurchased credit-
impaired
Grades 1-3: Low to fair risk 767,028,443 - - - 767,028,443
Grades 4-5: Monitoring - - - - -
Grades 6-8 : Substandard - - - - -
Grade 9 : Doubtful - - - - -
Grades 9-10 : Impaired - - - - -
Gross carrying amount 767,028,443 - - - 767,028,443
Loss allowance (9,163,702) - - - (9,163,702)
Carrying amount 757,864,741 - - - 757,864,741
Other assets Stage 1 Stage 2 Stage 3 Total
31 December 2018 12-month ECL Lifetime ECL Lifetime ECLPurchased credit-
impaired
Grades 1-3: Low to fair risk 70,376,136 - - - 70,376,136
Grades 4-5: Monitoring - - - - -
Grades 6-8 : Substandard - - - - -
Grade 9 : Doubtful - - - - -
Grades 9-10 : Impaired - - 1,347,690 - 1,347,690
Gross carrying amount 70,376,136 - 1,347,690 - 71,723,826
Loss allowance - - (1,347,690) - (1,347,690)
Carrying amount 70,376,136 - - - 70,376,136
(All amounts are expressed in cedis unless otherwise stated)
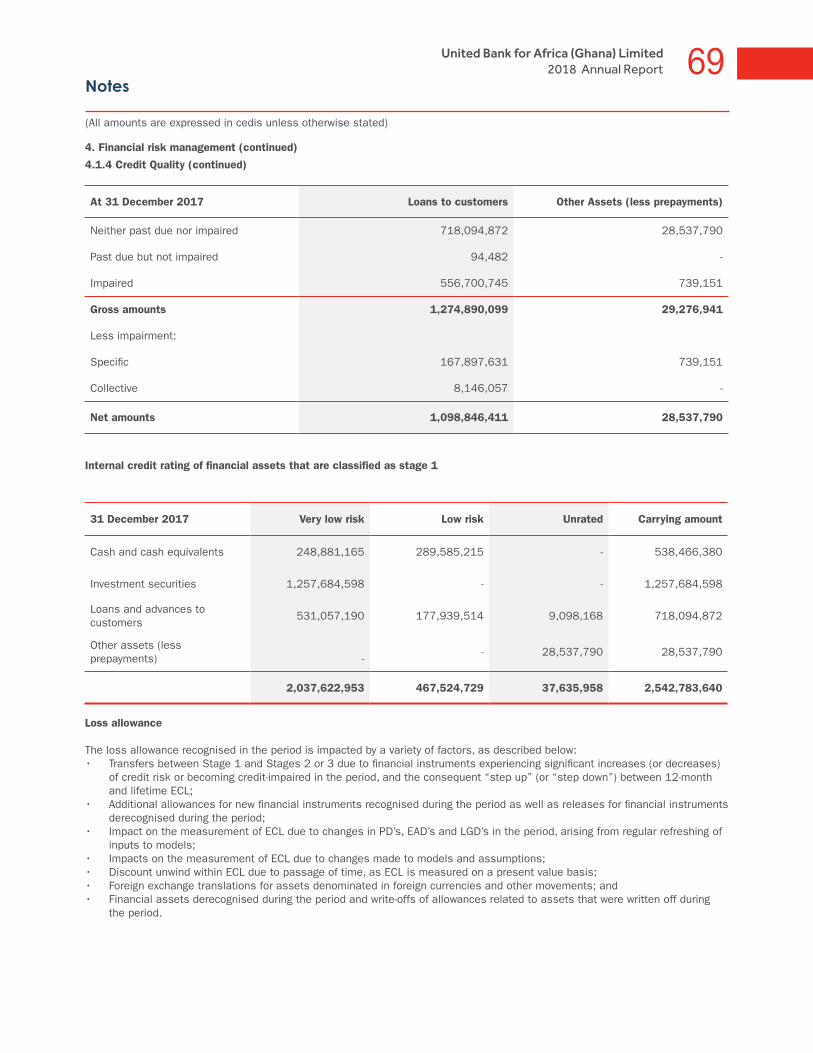
Notes69United Bank for Africa (Ghana) Limited
2018 Annual Report
4. Financial risk management (continued)
4.1.4 Credit Quality (continued)
At 31 December 2017 Loans to customers Other Assets (less prepayments)
Neither past due nor impaired 718,094,872 28,537,790
Past due but not impaired 94,482 -
Impaired 556,700,745 739,151
Gross amounts 1,274,890,099 29,276,941
Less impairment:
Specific 167,897,631 739,151
Collective 8,146,057 -
Net amounts 1,098,846,411 28,537,790
Internal credit rating of financial assets that are classified as stage 1
31 December 2017 Very low risk Low risk Unrated Carrying amount
Cash and cash equivalents 248,881,165 289,585,215 - 538,466,380
Investment securities 1,257,684,598 - - 1,257,684,598
Loans and advances to customers
531,057,190 177,939,514 9,098,168 718,094,872
Other assets (less prepayments)
-
- 28,537,790 28,537,790
2,037,622,953 467,524,729 37,635,958 2,542,783,640
Loss allowance
The loss allowance recognised in the period is impacted by a variety of factors, as described below:• Transfers between Stage 1 and Stages 2 or 3 due to financial instruments experiencing significant increases (or decreases)
of credit risk or becoming credit-impaired in the period, and the consequent “step up” (or “step down”) between 12-month and lifetime ECL;
• Additional allowances for new financial instruments recognised during the period as well as releases for financial instruments derecognised during the period;
• Impact on the measurement of ECL due to changes in PD’s, EAD’s and LGD’s in the period, arising from regular refreshing of inputs to models;
• Impacts on the measurement of ECL due to changes made to models and assumptions;• Discount unwind within ECL due to passage of time, as ECL is measured on a present value basis;• Foreign exchange translations for assets denominated in foreign currencies and other movements; and• Financial assets derecognised during the period and write-offs of allowances related to assets that were written off during
the period.
(All amounts are expressed in cedis unless otherwise stated)

Notes70 United Bank for Africa (Ghana) Limited
2018 Annual Report
4. Financial risk management (continued)
4.1.4 Credit Quality (continued)
The tables below analyse the movement of the loss allowance during the year per class of assets.
Loss allowance - loans and advances to customers at amortised cost
Stage 1 Stage 2 Stage 3 Total
12-month ECL Lifetime ECL Lifetime ECLPurchased
credit-impaired
Loss allowance as at 31 December 2017 8,136,609 9,448 167,897,631 - 176,043,688
Transition adjustments - - 21,102,861 - 21,102,861
Loss allowance as at 1 January 2018 8,136,609 9,448 189,000,492 - 197,146,549
Movements with P&L impact: - - - - -
Transfers:
Transfers from Stage 1 to Stage 2 - - - - -
Transfers from Stage 1 to Stage 3 - - - - -
Transfers from Stage 2 to Stage 1 - - - - -
Increases/(decreases) due to change in credit risk
- (9,448) 9,448 - -
Additional allowance for new financial assets originated
5,269,921 - 95,727,176 - 100,997,097
Release of allowance for financial assets derecognised
(5,602,983) - - - (5,602,983)
Changes in model assumptions and methodologies
- - - - -
Foreign exchange and other movements - - - - -
Total net P&L charge (333,062) (9,448) 95,736,624 - 95,394,114
Write-offs - - (6,539,114) - (6,539,114)
Loss allowance at 31 December 2018 7,803,547 - 278,198,002 - 286,001,549
(All amounts are expressed in cedis unless otherwise stated)

Notes71United Bank for Africa (Ghana) Limited
2018 Annual Report
4. Financial risk management (continued)
4.1.4 Credit Quality (continued)
Loss allowance - Off balance sheet
Stage 1 Stage 2 Stage 3 Total
12-month ECL Lifetime ECL Lifetime ECLPurchased
credit-impaired
Loss allowance as at 31 December 2017 - - - - -
Transition adjustments 8,997,902 - - - 8,997,902
Loss allowance as at 1 January 2018 8,997,902 - - - 8,997,902
Movements with P&L impact: - - - - -
Transfers:
Transfers from Stage 1 to Stage 2 - - - - -
Transfers from Stage 1 to Stage 3 - - - - -
Transfers from Stage 2 to Stage 1 - - - - -
Increases/(decreases) due to change in credit risk
- - - - -
Additional allowance for new financial assets originated
5,197,437 - - - 5,197,437
Release of allowance for financial assets derecognised
(5,031,637) - - - (5,031,637)
Changes in model assumptions and methodologies
- - - - -
Foreign exchange and other movements - - - - -
Total net P&L charge 165,800 - - - 165,800
Write-offs - - - - -
Loss allowance at 31 December 2018 9,163,702 - - - 9,163,702
(All amounts are expressed in cedis unless otherwise stated)
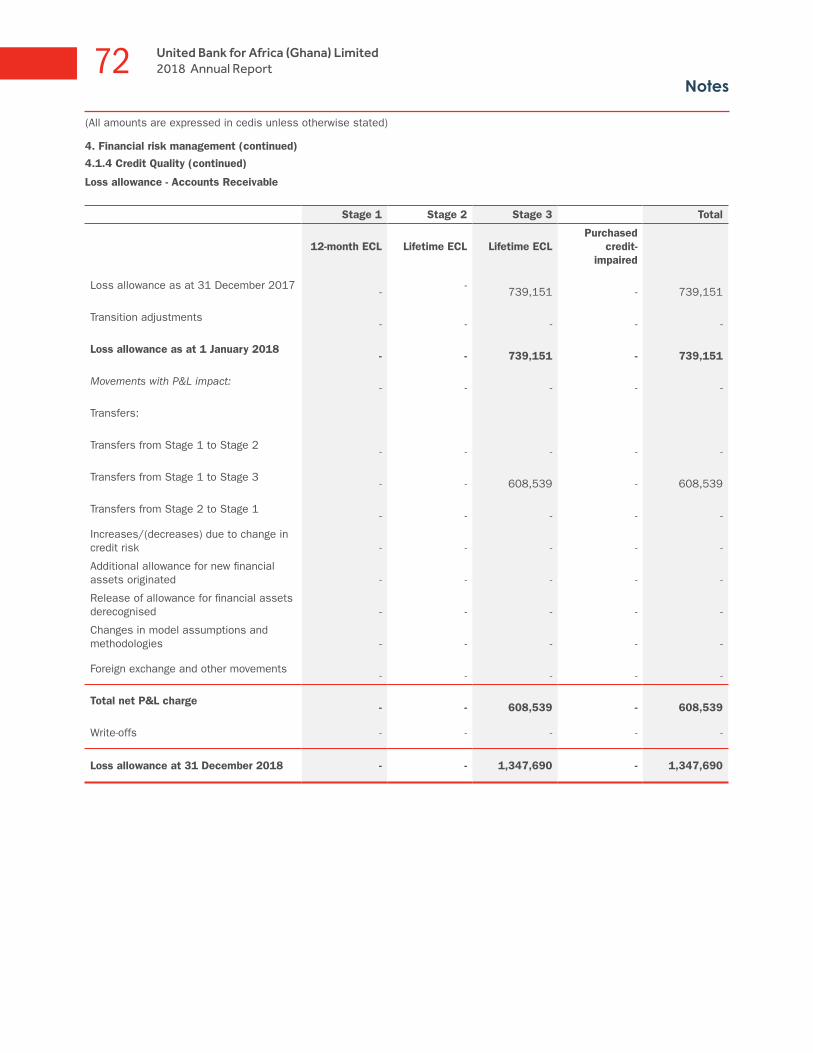
Notes72 United Bank for Africa (Ghana) Limited
2018 Annual Report
4. Financial risk management (continued)
4.1.4 Credit Quality (continued)
Loss allowance - Accounts Receivable
Stage 1 Stage 2 Stage 3 Total
12-month ECL Lifetime ECL Lifetime ECLPurchased
credit-impaired
Loss allowance as at 31 December 2017
- -
739,151
-
739,151
Transition adjustments
-
-
-
-
-
Loss allowance as at 1 January 2018
-
- 739,151
-
739,151
Movements with P&L impact:
-
-
-
-
-
Transfers:
Transfers from Stage 1 to Stage 2
-
-
-
-
-
Transfers from Stage 1 to Stage 3
-
-
608,539
-
608,539
Transfers from Stage 2 to Stage 1
-
-
-
-
-
Increases/(decreases) due to change in credit risk
-
-
-
-
-
Additional allowance for new financial assets originated
-
-
-
-
-
Release of allowance for financial assets derecognised
-
-
-
-
-
Changes in model assumptions and methodologies
-
-
-
-
-
Foreign exchange and other movements
-
-
-
-
-
Total net P&L charge
-
-
608,539
-
608,539
Write-offs - - - - -
Loss allowance at 31 December 2018 - - 1,347,690 - 1,347,690
(All amounts are expressed in cedis unless otherwise stated)
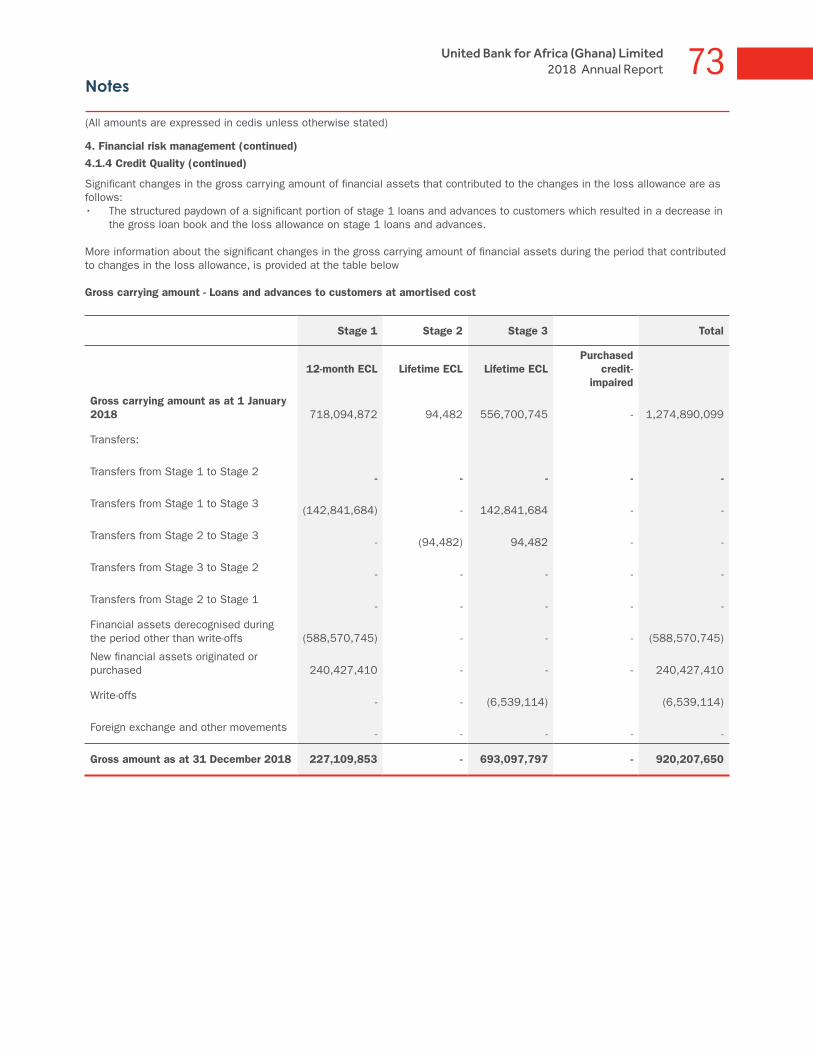
Notes73United Bank for Africa (Ghana) Limited
2018 Annual Report
4. Financial risk management (continued)
4.1.4 Credit Quality (continued)
Significant changes in the gross carrying amount of financial assets that contributed to the changes in the loss allowance are as follows: • The structured paydown of a significant portion of stage 1 loans and advances to customers which resulted in a decrease in
the gross loan book and the loss allowance on stage 1 loans and advances.
More information about the significant changes in the gross carrying amount of financial assets during the period that contributed to changes in the loss allowance, is provided at the table below
Gross carrying amount - Loans and advances to customers at amortised cost
Stage 1 Stage 2 Stage 3 Total
12-month ECL Lifetime ECL Lifetime ECLPurchased
credit-impaired
Gross carrying amount as at 1 January 2018
718,094,872
94,482
556,700,745
-
1,274,890,099
Transfers:
Transfers from Stage 1 to Stage 2
-
-
-
-
-
Transfers from Stage 1 to Stage 3
(142,841,684)
-
142,841,684
-
-
Transfers from Stage 2 to Stage 3
- (94,482)
94,482
-
-
Transfers from Stage 3 to Stage 2
-
-
-
-
-
Transfers from Stage 2 to Stage 1
-
-
-
-
-
Financial assets derecognised during the period other than write-offs
(588,570,745)
-
-
-
(588,570,745)
New financial assets originated or purchased
240,427,410
-
-
-
240,427,410
Write-offs
-
-
(6,539,114)
(6,539,114)
Foreign exchange and other movements
-
-
-
-
-
Gross amount as at 31 December 2018 227,109,853 - 693,097,797 - 920,207,650
(All amounts are expressed in cedis unless otherwise stated)

Notes74 United Bank for Africa (Ghana) Limited
2018 Annual Report
4. Financial risk management (continued)
4.1.4 Credit Quality (continued)
Gross carrying amount - Accounts receivable
Stage 1 Stage 2 Stage 3 Total
12-month ECL Lifetime ECL Lifetime ECLPurchased
credit-impaired
Gross carrying amount as at 1 January 2018
9,973,604 - 739,151 - 10,712,755
Transfers: -
Transfers from Stage 1 to Stage 2 - - - - -
Transfers from Stage 1 to Stage 3 (608,539) - 608,539 - -
Transfers from Stage 2 to Stage 3 - - - - -
Transfers from Stage 3 to Stage 2 - - - - -
Transfers from Stage 2 to Stage 1 - - - - -
Financial assets derecognised during the period other than write-offs
9,365,065 - - - 9,365,065
New financial assets originated or purchased
23,932,242 - - - 23,932,242
Write-offs - - - - -
Foreign exchange and other movements - - - - -
Gross amount as at 31 December 2018 42,662,372 - 1,347,690 - 44,010,062
Gross carrying amount - Off balance sheet
Stage 1 Stage 2 Stage 3 Total
Gross carrying amount as at 1 January 2018
663,422,776 - - - 663,422,776
Transfers: -
Transfers from Stage 1 to Stage 2 - - - - -
Transfers from Stage 1 to Stage 3 - - - - -
Transfers from Stage 2 to Stage 3 - - - - -
Transfers from Stage 3 to Stage 2 - - - - -
Transfers from Stage 2 to Stage 1 - - - - -
Financial assets derecognised during the period other than write-offs
(370,986,802) - - - (370,986,802)
New financial assets originated or purchased
474,592,469
-
-
-
474,592,469
Write-offs - - - - -
Foreign exchange and other movements - - - - -
Gross amount as at 31 December 2018 767,028,443 - - - 767,028,443
(All amounts are expressed in cedis unless otherwise stated)

Notes75United Bank for Africa (Ghana) Limited
2018 Annual Report
4. Financial risk management (continued)
4.1.5 Credit Concentration
The Bank monitors concentrations on credit risk by sector, geographic location and industry. The analysis of concentrations of credit risk by location at the reporting date is shown below:
2018 2017
In Ghana Outside Ghana In Ghana Outside Ghana
Assets
Cash and cash equivalents 417,183,555 129,085,971 288,667,047 249,799,333
Investment securities - amortised cost 468,307,301 581,614,433 - -
Investment securities - FVOCI 1,219,620,955 - - -
Investment securities - Held to maturity - - 1,189,337,509 -
Investment securities - Available-for-sale - - 68,347,089 -
Loans to customers 634,206,101 - 1,098,846,411 -
Other financial assets 70,376,136 - 28,537,790
2,809,694,048 710,700,404 2,673,735,846 249,799,333
Liabilities
Deposits from customers 2,114,717,879 - 2,073,671,821 -
Deposits from banks 428,277,013 153,269,984 235,287,392 20,311,990
Borrowings - 120,909,248 - -
Other liabilities 63,352,699 41,363,307 44,515,077 32,081,692
Total liabilities 2,606,347,591 315,542,539 2,353,474,290 52,393,682
Off Balance Sheet Items
Letters of credit - 46,961,322 - 11,469,429
Guarantees 682,428,125 - 632,982,080 -
682,428,125 46,961,322 632,982,080 11,469,429
4.1.6 Credit Collateral
The Bank holds collateral against loans and advances to customers in the form of cash, treasury bills/certificates, stock and shares of reputable quoted companies, legal mortgages, debentures and guarantees. Estimates of fair value are based on the value of collateral assessed at the time of borrowing, and updated periodically.
Collateral generally is not held over placements with other Banks, except when securities are held as part of reverse repurchase and securities borrowing activity. Collateral is usually also not held against investment securities.
(All amounts are expressed in cedis unless otherwise stated)

Notes76 United Bank for Africa (Ghana) Limited
2018 Annual Report
4. Financial risk management (continued)
4.1.6 Credit Collateral (continued)
An estimate of the fair value of collateral and other security enhancements held against loans and advances to customers is shown below:
Dec 2018 Dec 2017
Against stage 3 loans 411,325,363 388,964,459
Against stage 2 loans - 25,692,412
Against stage 1 loans 294,051,253 663,086,679
705,376,616 1,077,743,550
Details of collateral held against loans and advances and their carrying amounts are shown below. The Bank manages collaterals for loans and advances based on the nature of those collaterals.
Dec 2018 Dec 2017
Total exposure Value of collateral Total exposure Value of collateral
Secured against real estate
90,435,458 257,874,450 102,461,822 126,669,750
Secured against cash 16,113,846 16,113,846 2,741,098 2,741,098
Secured against other collateral*
808,769,461 431,388,320 1,164,798,294 948,332,702
Unsecured 4,888,885 - 4,888,885 -
920,207,650 705,376,616 1,274,890,099 1,077,743,550
* Other collateral are mainly domiciliation of payments (sales, invoices, salaries, allowances and terminal benefits), lien on shipping documents, corporate guarantees and similar collaterals.
Other financial assets comprising cash and bank balances (including balances with the central bank), investment securities and accounts receivable are not secured. The Bank’s investment in government securities as well as balances held with the Central Bank are not considered to require collaterals given their sovereign nature.
During the year, the Bank did not take possession of any security held as collateral against loans (2017: nil).
4.2 Liquidity risk Liquidity risk is the risk that the Bank does not have sufficient financial resources to meet maturing obligations or can only access these financial resources at excessive cost. Liquidity risk arises because of the possibility that the Bank may be unable to meet its payment obligations when they fall due as a result of mismatches in the timing of cash flows under normal and stress circumstances. To limit this risk, management has arranged for diversified funding sources in addition to its core deposit base, and adopted a policy of managing assets with liquidity in mind and monitoring future cash flows and liquidity on a daily basis. The Bank met all its financial commitments and obligations without any liquidity risk issues during the year.
(All amounts are expressed in cedis unless otherwise stated)

Notes77United Bank for Africa (Ghana) Limited
2018 Annual Report
4. Financial risk management (continued)4.2 Liquidity risk (continued)
4.2.1 Management of liquidity risk
The Bank’s liquidity management process, as carried out within the Bank and monitored by a separate team in the Treasury department, includes:
(i) Day-to-day funding, managed by monitoring future cash flows to ensure that requirements can be met. This includes replenishment of funds as they mature or are borrowed by customers;
(ii) Maintaining a portfolio of highly marketable assets that can easily be liquidated as protection against any unforeseen interruption to cash flow;
(iii) Monitoring the liquidity ratios of the statement of financial position against internal and regulatory requirements; and
(iv) Managing the concentration and profile of debt maturities.
Monitoring and reporting take the form of cash flow measurement and projections for the next day, week and month respectively, as these are key periods for liquidity management. The starting point for those projections is an analysis of the contractual maturity of the financial liabilities and the expected collection date of the financial assets. The Bank’s Treasury also monitors unmatched medium-term assets, the level and type of undrawn lending commitments, the usage of overdraft facilities and the impact of contingent liabilities such as standby letters of credit and guarantees.
4.2.2 Funding approach
The Bank manages its liquidity prudently in all locations and for all currencies. The principal uncertainties for liquidity risk are that customers withdraw their deposits at a substantially faster rate than expected, or that asset repayments are not received on the expected maturity date. To mitigate these uncertainties, our funding base is diverse and largely customer-driven, while customer assets are of short tenor. In addition, we have contingency funding plans including a portfolio of liquid assets that can be realised if a liquidity stress occurs, as well as ready access to wholesale funds under normal market conditions. We have significant levels of marketable securities, including government securities that can be monetised or pledged as collateral in the event of a liquidity stress.
Contingency funding plans are reviewed annually. They provide a broad set of Early Warning Indicators, an escalation framework and a set of management actions that could be effectively implemented by the appropriate level of senior management in the event of a liquidity stress.
4.2.3 Exposure to liquidity risk
The key measure used by the Bank for managing liquidity risk is the ratio of net liquid assets to deposits from customers. For this purpose, net liquid assets are considered as including cash and cash equivalents and investment grade debt securities for which there is an active and liquid market less any deposits from Banks, debt securities issued, other borrowings and commitments maturing within the next month. Details of the Bank’s (liquid ratio) ratio of net liquid assets to customer deposits at the reporting date was as follows:
Dec 2018 Dec 2017
At 31 December 85.4% 74.4%
Average for the year 83.3% 63.2%
Maximum for the year 94.0% 74.4%
Minimum for the year 74.6% 56.4%
4.2.4 Analysis of financial assets and liabilities by remaining contractual maturities
The tables below show the undiscounted cash flow on the Bank’s financial liabilities and on the basis of the earliest possible contractual maturity. The Gross nominal inflow/outflow disclosed in the table is the contractual, undiscounted cash flows on the financial liabilities or commitments. The Bank’s expected cash flows on some financial assets and financial liabilities vary significantly from the contractual cash flows. Demand and savings deposits are expected to remain stable or increase.

Notes78 United Bank for Africa (Ghana) Limited
2018 Annual Report
4. Financial risk management (continued)
4.2.4 Analysis of financial assets and liabilities by remaining contractual maturities (continued)
At 31 December 2018Gross Nominal
Amount Up to 3 months 3-6 months 6-12 months Over 1 year
Carrying Amount
Financial liabilities
Deposits from customers
2,126,997,252 2,067,837,155 50,321,531 5,808,021 3,030,545 2,114,717,879
Other liabilities 104,716,006 54,188,997 9,163,702 41,363,307 - 104,716,006
Borrowings 165,687,500 - 4,518,750 4,518,750 156,650,000 120,909,248
Deposits from banks 583,633,024 583,633,024 - - - 581,546,997
Total financial liabilities 2,981,033,782 2,705,659,176 64,003,983 51,690,078 159,680,545 2,921,890,130
Financial Assets
Cash and cash equivalents
547,737,376 547,737,376 - - - 546,269,526
Investment securities 2,491,311,363 741,770,851 304,135,026 1,263,692,413 181,713,073 2,269,542,689
Loans and advances to customers
682,316,160 487,923,821 25,352,761 74,445,442 94,594,136 634,206,101
Other assets 70,376,136 70,376,136 - - - 70,376,136
Assets held for managing liquidity risk
3,791,741,035 1,847,808,184 329,487,787 1,338,137,855 276,307,209 3,520,394,452
Net liquidity gap 810,707,253 (857,850,992) 265,483,804 1,286,447,777 116,626,664 598,504,322
At 31 December 2017Gross Nominal
Amount Up to 3 months 3-6 months 6-12 months Over 1 year
Carrying Amount
Financial liabilities
Deposits from customers
2,137,643,367 1,334,048,593 559,520,002 240,452,927 3,621,845 2,073,671,821
Other liabilities 76,596,769 60,513,113 16,083,656 - - 76,596,769
Deposit from banks 263,063,618 252,124,885 10,938,733 - - 255,599,382
Total financial liabilities 2,477,303,754 1,646,686,591 586,542,391 240,452,927 3,621,845 2,405,867,972
Financial Assets
Cash and cash equivalents
538,466,380 538,466,380 - - - 538,466,380
Investment securities 1,293,420,439 994,033,388 132,796,054 45,926,275 120,664,722 1,257,684,598
Loans and advances to customers
1,369,266,841 819,902,922 230,330,813 275,272,964 43,760,142 1,098,846,411
Other assets 28,537,790 28,537,790 - - - 28,537,790
Assets held for managing liquidity risk
3,229,691,450 2,380,940,480 363,126,867 321,199,239 164,424,864 2,923,535,179
Net liquidity gap 752,387,696 734,253,889 (223,415,524) 80,746,312 160,803,019 517,667,207
(All amounts are expressed in cedis unless otherwise stated)
The net liquidity gap is funded by shareholders’ funds as well as the excess liquidity under three months.
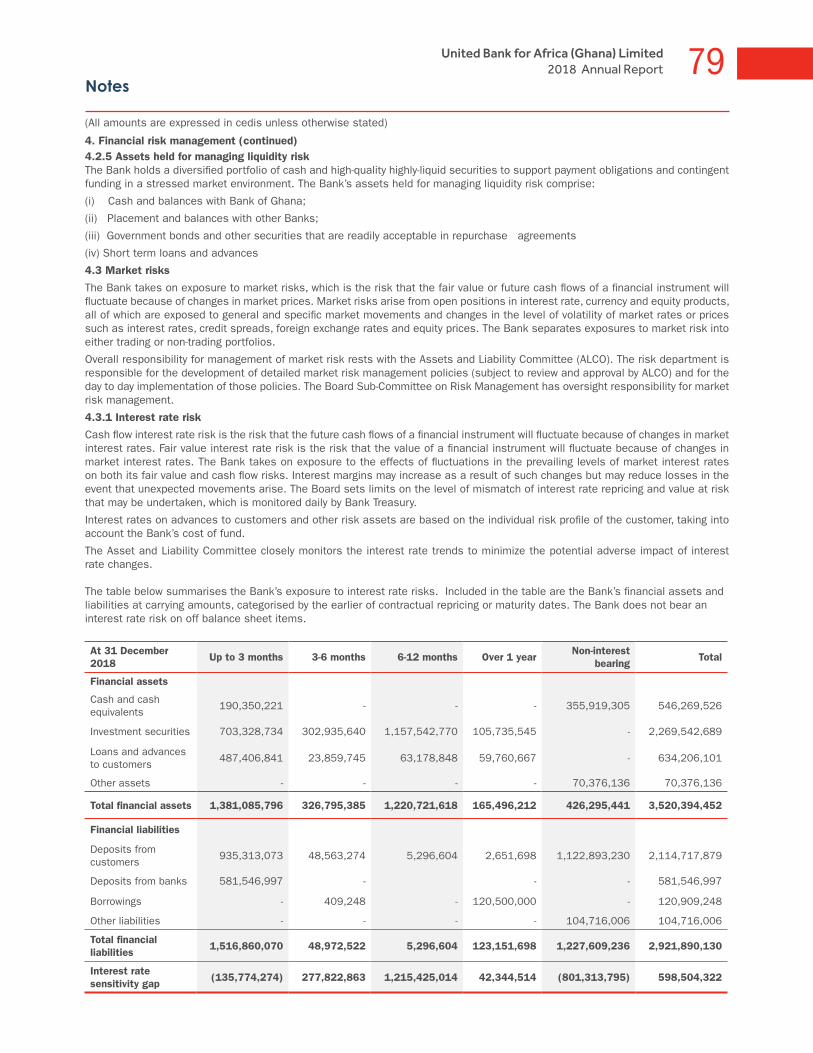
Notes79United Bank for Africa (Ghana) Limited
2018 Annual Report
4. Financial risk management (continued)4.2.5 Assets held for managing liquidity risk The Bank holds a diversified portfolio of cash and high-quality highly-liquid securities to support payment obligations and contingent funding in a stressed market environment. The Bank’s assets held for managing liquidity risk comprise:
(i) Cash and balances with Bank of Ghana;
(ii) Placement and balances with other Banks;
(iii) Government bonds and other securities that are readily acceptable in repurchase agreements
(iv) Short term loans and advances
4.3 Market risks
The Bank takes on exposure to market risks, which is the risk that the fair value or future cash flows of a financial instrument will fluctuate because of changes in market prices. Market risks arise from open positions in interest rate, currency and equity products, all of which are exposed to general and specific market movements and changes in the level of volatility of market rates or prices such as interest rates, credit spreads, foreign exchange rates and equity prices. The Bank separates exposures to market risk into either trading or non-trading portfolios.
Overall responsibility for management of market risk rests with the Assets and Liability Committee (ALCO). The risk department is responsible for the development of detailed market risk management policies (subject to review and approval by ALCO) and for the day to day implementation of those policies. The Board Sub-Committee on Risk Management has oversight responsibility for market risk management.
4.3.1 Interest rate risk
Cash flow interest rate risk is the risk that the future cash flows of a financial instrument will fluctuate because of changes in market interest rates. Fair value interest rate risk is the risk that the value of a financial instrument will fluctuate because of changes in market interest rates. The Bank takes on exposure to the effects of fluctuations in the prevailing levels of market interest rates on both its fair value and cash flow risks. Interest margins may increase as a result of such changes but may reduce losses in the event that unexpected movements arise. The Board sets limits on the level of mismatch of interest rate repricing and value at risk that may be undertaken, which is monitored daily by Bank Treasury.
Interest rates on advances to customers and other risk assets are based on the individual risk profile of the customer, taking into account the Bank’s cost of fund.
The Asset and Liability Committee closely monitors the interest rate trends to minimize the potential adverse impact of interest rate changes.
The table below summarises the Bank’s exposure to interest rate risks. Included in the table are the Bank’s financial assets and liabilities at carrying amounts, categorised by the earlier of contractual repricing or maturity dates. The Bank does not bear an interest rate risk on off balance sheet items.
At 31 December 2018
Up to 3 months 3-6 months 6-12 months Over 1 year Non-interest
bearing Total
Financial assets
Cash and cash equivalents
190,350,221 - - - 355,919,305 546,269,526
Investment securities 703,328,734 302,935,640 1,157,542,770 105,735,545 - 2,269,542,689
Loans and advances to customers
487,406,841 23,859,745 63,178,848 59,760,667 - 634,206,101
Other assets - - - - 70,376,136 70,376,136
Total financial assets 1,381,085,796 326,795,385 1,220,721,618 165,496,212 426,295,441 3,520,394,452
Financial liabilities
Deposits from customers
935,313,073 48,563,274 5,296,604 2,651,698 1,122,893,230 2,114,717,879
Deposits from banks 581,546,997 - - - 581,546,997
Borrowings - 409,248 - 120,500,000 - 120,909,248
Other liabilities - - - - 104,716,006 104,716,006
Total financial liabilities
1,516,860,070 48,972,522 5,296,604 123,151,698 1,227,609,236 2,921,890,130
Interest rate sensitivity gap
(135,774,274) 277,822,863 1,215,425,014 42,344,514 (801,313,795) 598,504,322
(All amounts are expressed in cedis unless otherwise stated)

Notes80 United Bank for Africa (Ghana) Limited
2018 Annual Report
4. Financial risk management (continued)
4.3.1 Interest rate risk (continued)
At 31 December 2017
Up to 3 months 3-6 months 6-12 months Over I year Non-interest
bearing Total
Financial assets
Cash and cash equivalents
240,711,165
-
-
- 297,755,215 538,466,380
Investment securities 978,127,949 126,925,784 43,765,029 108,865,836 - 1,257,684,598
Loans and advances to customers
463,636,868 18,517,100 587,782,944 28,909,499 - 1,098,846,411
Other assets - - - - 28,537,790 28,537,790
Total financial assets 1,682,475,982 145,442,884 631,547,973 137,775,335 326,293,005 2,923,535,179
Financial liabilities
Deposits from customers
399,329,329 526,835,965 213,584,053 3,217,130 930,705,344 2,073,671,821
Deposits from banks 255,599,382 - - - - 255,599,382
Other liabilities - - - - 76,596,769 76,596,769
Total financial liabilities
654,928,711 526,835,965 213,584,053 3,217,130 1,007,302,113 2,405,867,972
Interest rate sensitivity gap
1,027,547,271 (381,393,081) 417,963,920 134,558,205 (681,009,108) 517,667,207
The matching and controlled mismatching of the maturities and interest rates of assets and liabilities is fundamental to the management of the Bank.
Sensitivity analysis
An increase of a 100 basis points in interest rates at the reporting date would have impacted equity and profit by the amounts shown below:
Sensitivity analysis of interest rate risks - Increase of 100 basis points in net interest margin
2018 2017
Interest income impact 30,940,990 25,972,422
Interest expense impact (16,942,809) (13,985,659)
Net impact on profit 13,998,181 11,986,763
4.3.2 Foreign exchange risk
The Bank operates wholly within Ghana and its assets and liabilities are carried in local currency. The Bank maintains trade with correspondent Banks and takes deposits and lends in foreign currencies. The Bank is exposed to the risk that the value of financial instruments will fluctuate due to changes in foreign exchange rates. The Bank’s currency position and exposure are managed within the exposure guideline of 5% and 10% of the core capital for single currency position and aggregate currency position respectively as stipulated by the Bank of Ghana. These positions are reviewed on a daily basis by management.
The Bank applied the Bank of Ghana mid-rates indicated below to translate balances denominated in foreign currencies to Ghana cedi as at 31 December 2018:
Currency 2018 2017
USD 4.8200 4.4157
GBP 6.1711 5.9669
EUR 5.5131 5.2964
(All amounts are expressed in cedis unless otherwise stated)

Notes81United Bank for Africa (Ghana) Limited
2018 Annual Report
4. Financial risk management (continued)
4.3.2 Foreign exchange risk (continued)
The table below summarises the Bank’s exposure to foreign currency exchange rate risk as at the reporting date
As at 31 December 2018
Financial assets GH¢ USD EUR Others Total
Cash and cash equivalents 398,322,404 116,442,184 19,654,429 11,850,509 546,269,526
Investment securities 1,687,928,256 581,614,433 - - 2,269,542,689
Loans and advances to customers
236,247,077
397,959,024
-
-
634,206,101
Other assets 29,254,819 41,111,427 9,890 - 70,376,136
Total financial assets 2,351,752,556 1,137,127,068 19,664,319 11,850,509 3,520,394,452
Financial liabilities
Deposits from customers 1,537,775,149 548,525,478 19,383,364 9,033,888 2,114,717,879
Other liabilities 56,951,176 46,701,448 920,071 143,311 104,716,006
Borrowings - 120,909,248 - - 120,909,248
Deposits from banks 188,716,997 392,830,000 - - 581,546,997
Total financial liabilities 1,783,443,322 1,108,966,174 20,303,435 9,177,199 2,921,890,130
Net balance sheet position 568,309,234 28,160,894 (639,116) 2,673,310 598,504,322
Off balance sheet items
Letters of credit - 46,961,322 - - 46,961,322
Letters of guarantee 383,862,113 298,061,726 - 504,286 682,428,125
Loan commitments 37,638,996 - - - 37,638,996
As at 31 December 2017
Financial assets GH¢ USD EUR Others Total
Cash and cash equivalents 253,724,492 238,708,088 35,675,225 10,358,575 538,466,380
Investment securities 1,257,684,598 - - - 1,257,684,598
Loans and advances to customers 745,117,490 353,728,921 - - 1,098,846,411
Other assets 24,579,244 3,908,356 50,190 - 28,537,790
Total financial assets 2,281,105,824 596,345,365 35,725,415 10,358,575 2,923,535,179
Financial liabilities
Deposits from customers 1,690,652,603 342,104,381 31,209,251 9,705,586 2,073,671,821
Other liabilities 40,816,805 35,066,212 601,039 112,713 76,596,769
Deposits from banks 35,701,227 217,249,980 2,648,175 - 255,599,382
Total financial liabilities 1,767,170,635 594,420,573 34,458,465 9,818,299 2,405,867,972
Net balance sheet position 513,935,189 1,924,792 1,266,950 540,276 517,667,207
Off balance sheet items
Letters of credit - 11,469,429 - - 11,469,429
Letters of guarantee 632,982,080 - - - 632,982,080
Loan commitments 18,971,267 - - - 18,971,267
(All amounts are expressed in cedis unless otherwise stated)

Notes82 United Bank for Africa (Ghana) Limited
2018 Annual Report
4. Financial risk management (continued)4.3.2 Foreign exchange risk (continued)
Sensitivity analysis
A 5% strengthening of the cedi against foreign currencies at 31 December 2018 would have impacted equity and profit / (loss) by the amounts shown below. This analysis assumes that all other variables, in particular interest rates, remain constant. The analysis is performed on the same basis for 31 December 2017:
2018 2017
Loss (1,509,754)) (186,605)
A 5% weakening of the Ghana cedi against foreign currencies at 31 December 2018 would have had the equal but opposite effect on the amount shown above, on the basis that all other variables remain constant.
4.4 Fair value measurement
IFRS 7 specifies a hierarchy of valuation techniques based on whether the inputs to those valuation techniques are observable or unobservable. Observable inputs reflect market data obtained from independent sources; unobservable inputs reflect the company’s market assumptions. These two types of inputs have created the following fair value hierarchy:
Level 1 - inputs that are quoted market prices (unadjusted) in active markets for identical instruments. The fair value of financial instruments traded in active markets is based on quoted market prices at the balance sheet date. A market is regarded as active if quoted prices are readily and regularly available from an exchange, dealer, broker, industry group, pricing service, or regulatory agency, and those prices represent actual and regularly occurring market transactions on an arm’s length basis.
Level 2 - Inputs other than quoted prices included within level 1 that are observable for the asset or liability, either directly (as prices) or indirectly (derived from prices).
Level 3 - inputs that are unobservable. This category includes all instruments for which the valuation technique includes inputs not based on observable data and the unobservable inputs have a significant effect on the instrument’s valuation. This category includes instruments that are valued based on quoted prices for similar instruments for which significant unobservable adjustments or assumptions are required to reflect differences between the instruments.
Valuation techniques include net present value and discounted cashflow models, comparison with similar instruments for which market observable prices exist, Black-Scholes and polynomial option pricing models and other valuation models. Assumptions and inputs used in valuation techniques include risk-free and benchmark interest rates, credit spreads and other premia used in estimating discount rate, bond and equity prices, foreign currency exchange rates, equity and equity index prices and expected price volatilities and correlations.The table below analyses financial instruments measured at fair value at the end of the reporting period, by the level in the fair value hierarchy into which the fair value measurement is categorised. All fair value measurements are recurring.
31 December 2018 Level 1 Level 2 Level 3 Total
Investment securities at FVOCI
Treasury bills - - -
-
Government bonds - 1,219,620,955 - 1,219,620,955
Total - 1,219,620,955 - 1,219,620,955
31 December 2017
Available-for-sale investment securities
Treasury bills - 68,347,089 - 68,347,089
Government bonds - - -
-
Total - 68,347,089 - 68,347,089
There has been no change in the valuation techniques and inputs used in the valuation of fair value measurements categorized as level 2 in the fair value hierarchy.
During the year, there were no transfers between levels of the fair value hierarchy.
The carrying amount of financial assets and liabilities not measured at fair value, is deemed to be a reliable estimate of fair value.
(All amounts are expressed in cedis unless otherwise stated)
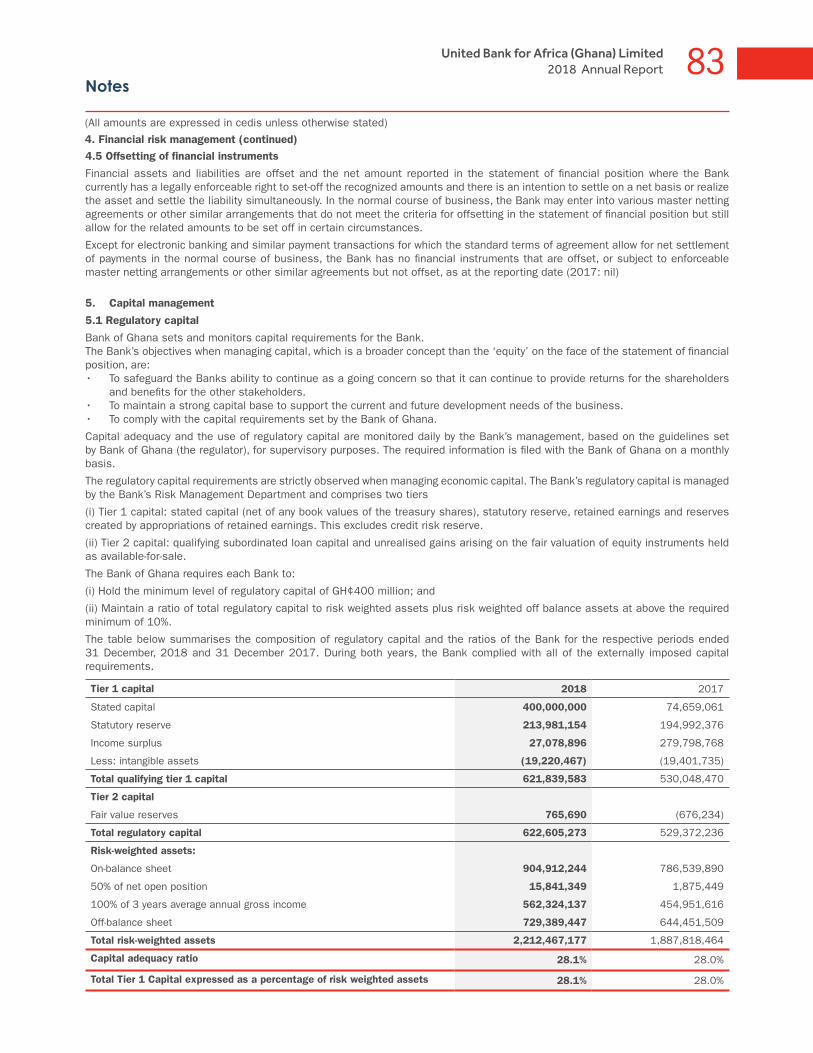
Notes83United Bank for Africa (Ghana) Limited
2018 Annual Report
4. Financial risk management (continued)4.5 Offsetting of financial instruments
Financial assets and liabilities are offset and the net amount reported in the statement of financial position where the Bank currently has a legally enforceable right to set-off the recognized amounts and there is an intention to settle on a net basis or realize the asset and settle the liability simultaneously. In the normal course of business, the Bank may enter into various master netting agreements or other similar arrangements that do not meet the criteria for offsetting in the statement of financial position but still allow for the related amounts to be set off in certain circumstances.
Except for electronic banking and similar payment transactions for which the standard terms of agreement allow for net settlement of payments in the normal course of business, the Bank has no financial instruments that are offset, or subject to enforceable master netting arrangements or other similar agreements but not offset, as at the reporting date (2017: nil)
5. Capital management
5.1 Regulatory capital
Bank of Ghana sets and monitors capital requirements for the Bank. The Bank’s objectives when managing capital, which is a broader concept than the ‘equity’ on the face of the statement of financial position, are: • To safeguard the Banks ability to continue as a going concern so that it can continue to provide returns for the shareholders
and benefits for the other stakeholders.• To maintain a strong capital base to support the current and future development needs of the business.• To comply with the capital requirements set by the Bank of Ghana.
Capital adequacy and the use of regulatory capital are monitored daily by the Bank’s management, based on the guidelines set by Bank of Ghana (the regulator), for supervisory purposes. The required information is filed with the Bank of Ghana on a monthly basis.
The regulatory capital requirements are strictly observed when managing economic capital. The Bank’s regulatory capital is managed by the Bank’s Risk Management Department and comprises two tiers
(i) Tier 1 capital: stated capital (net of any book values of the treasury shares), statutory reserve, retained earnings and reserves created by appropriations of retained earnings. This excludes credit risk reserve.
(ii) Tier 2 capital: qualifying subordinated loan capital and unrealised gains arising on the fair valuation of equity instruments held as available-for-sale.
The Bank of Ghana requires each Bank to:
(i) Hold the minimum level of regulatory capital of GH¢400 million; and
(ii) Maintain a ratio of total regulatory capital to risk weighted assets plus risk weighted off balance assets at above the required minimum of 10%.
The table below summarises the composition of regulatory capital and the ratios of the Bank for the respective periods ended 31 December, 2018 and 31 December 2017. During both years, the Bank complied with all of the externally imposed capital requirements.
Tier 1 capital 2018 2017
Stated capital 400,000,000 74,659,061
Statutory reserve 213,981,154 194,992,376
Income surplus 27,078,896 279,798,768
Less: intangible assets (19,220,467) (19,401,735)
Total qualifying tier 1 capital 621,839,583 530,048,470
Tier 2 capital
Fair value reserves 765,690 (676,234)
Total regulatory capital 622,605,273 529,372,236
Risk-weighted assets:
On-balance sheet 904,912,244 786,539,890
50% of net open position 15,841,349 1,875,449
100% of 3 years average annual gross income 562,324,137 454,951,616
Off-balance sheet 729,389,447 644,451,509
Total risk-weighted assets 2,212,467,177 1,887,818,464
Capital adequacy ratio 28.1% 28.0%
Total Tier 1 Capital expressed as a percentage of risk weighted assets 28.1% 28.0%
(All amounts are expressed in cedis unless otherwise stated)
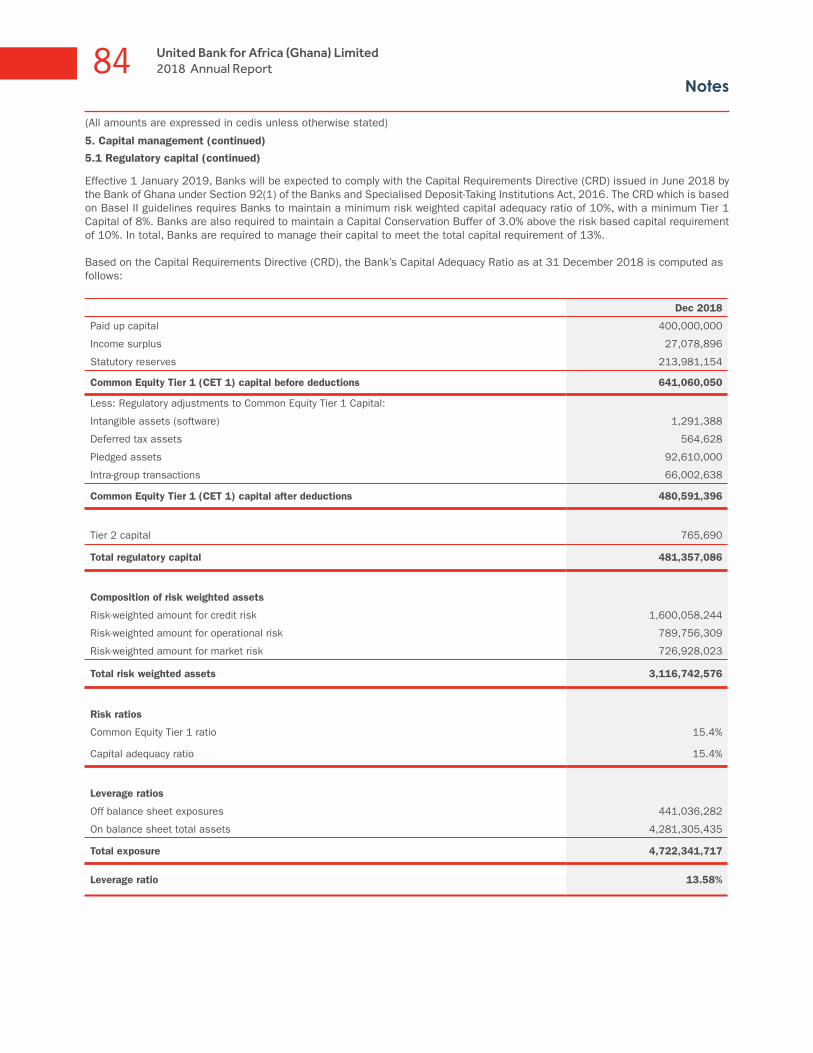
Notes84 United Bank for Africa (Ghana) Limited
2018 Annual Report
5. Capital management (continued)
5.1 Regulatory capital (continued)
Effective 1 January 2019, Banks will be expected to comply with the Capital Requirements Directive (CRD) issued in June 2018 by the Bank of Ghana under Section 92(1) of the Banks and Specialised Deposit-Taking Institutions Act, 2016. The CRD which is based on Basel II guidelines requires Banks to maintain a minimum risk weighted capital adequacy ratio of 10%, with a minimum Tier 1 Capital of 8%. Banks are also required to maintain a Capital Conservation Buffer of 3.0% above the risk based capital requirement of 10%. In total, Banks are required to manage their capital to meet the total capital requirement of 13%.
Based on the Capital Requirements Directive (CRD), the Bank’s Capital Adequacy Ratio as at 31 December 2018 is computed as follows:
Dec 2018
Paid up capital 400,000,000
Income surplus 27,078,896
Statutory reserves 213,981,154
Common Equity Tier 1 (CET 1) capital before deductions 641,060,050
Less: Regulatory adjustments to Common Equity Tier 1 Capital:
Intangible assets (software) 1,291,388
Deferred tax assets 564,628
Pledged assets 92,610,000
Intra-group transactions 66,002,638
Common Equity Tier 1 (CET 1) capital after deductions 480,591,396
Tier 2 capital 765,690
Total regulatory capital 481,357,086
Composition of risk weighted assets
Risk-weighted amount for credit risk 1,600,058,244
Risk-weighted amount for operational risk 789,756,309
Risk-weighted amount for market risk 726,928,023
Total risk weighted assets 3,116,742,576
Risk ratios
Common Equity Tier 1 ratio 15.4%
Capital adequacy ratio 15.4%
Leverage ratios
Off balance sheet exposures 441,036,282
On balance sheet total assets 4,281,305,435
Total exposure 4,722,341,717
Leverage ratio 13.58%
(All amounts are expressed in cedis unless otherwise stated)
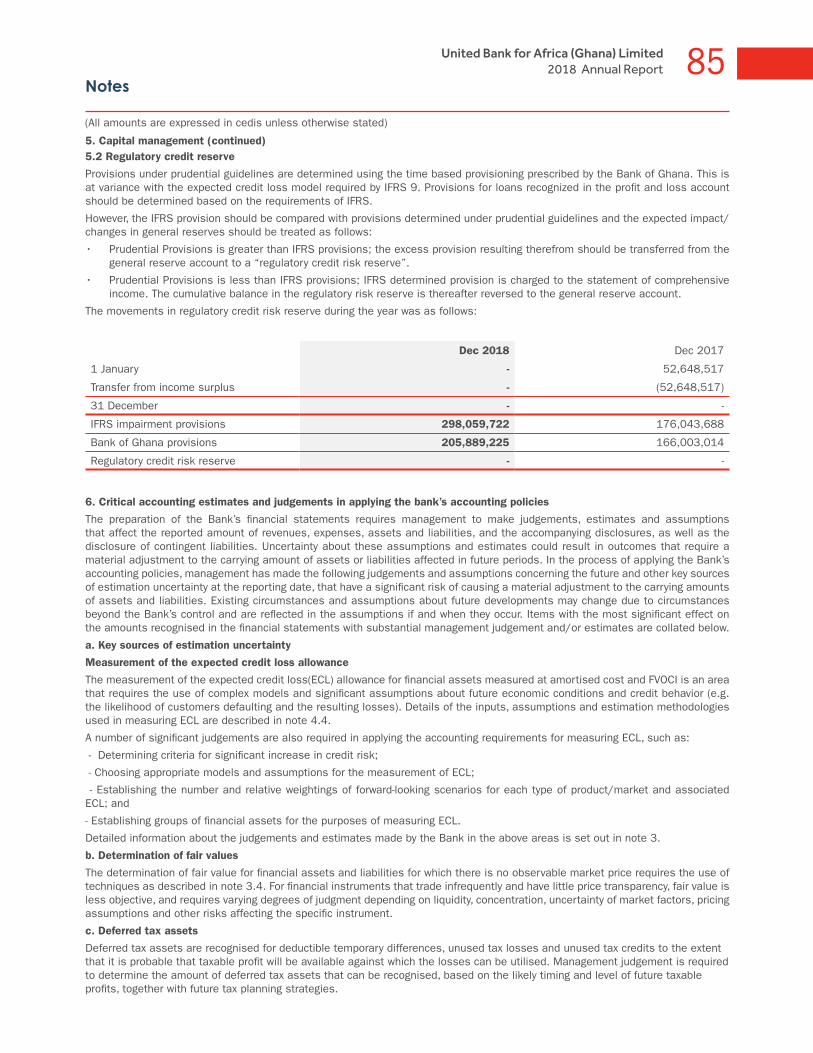
Notes85United Bank for Africa (Ghana) Limited
2018 Annual Report
5. Capital management (continued)5.2 Regulatory credit reserve
Provisions under prudential guidelines are determined using the time based provisioning prescribed by the Bank of Ghana. This is at variance with the expected credit loss model required by IFRS 9. Provisions for loans recognized in the profit and loss account should be determined based on the requirements of IFRS.
However, the IFRS provision should be compared with provisions determined under prudential guidelines and the expected impact/changes in general reserves should be treated as follows:
• Prudential Provisions is greater than IFRS provisions; the excess provision resulting therefrom should be transferred from the general reserve account to a “regulatory credit risk reserve”.
• Prudential Provisions is less than IFRS provisions; IFRS determined provision is charged to the statement of comprehensive income. The cumulative balance in the regulatory risk reserve is thereafter reversed to the general reserve account.
The movements in regulatory credit risk reserve during the year was as follows:
Dec 2018 Dec 2017
1 January - 52,648,517
Transfer from income surplus - (52,648,517)
31 December - -
IFRS impairment provisions 298,059,722 176,043,688
Bank of Ghana provisions 205,889,225 166,003,014
Regulatory credit risk reserve - -
6. Critical accounting estimates and judgements in applying the bank’s accounting policies
The preparation of the Bank’s financial statements requires management to make judgements, estimates and assumptions that affect the reported amount of revenues, expenses, assets and liabilities, and the accompanying disclosures, as well as the disclosure of contingent liabilities. Uncertainty about these assumptions and estimates could result in outcomes that require a material adjustment to the carrying amount of assets or liabilities affected in future periods. In the process of applying the Bank’s accounting policies, management has made the following judgements and assumptions concerning the future and other key sources of estimation uncertainty at the reporting date, that have a significant risk of causing a material adjustment to the carrying amounts of assets and liabilities. Existing circumstances and assumptions about future developments may change due to circumstances beyond the Bank’s control and are reflected in the assumptions if and when they occur. Items with the most significant effect on the amounts recognised in the financial statements with substantial management judgement and/or estimates are collated below.
a. Key sources of estimation uncertainty
Measurement of the expected credit loss allowance
The measurement of the expected credit loss(ECL) allowance for financial assets measured at amortised cost and FVOCI is an area that requires the use of complex models and significant assumptions about future economic conditions and credit behavior (e.g. the likelihood of customers defaulting and the resulting losses). Details of the inputs, assumptions and estimation methodologies used in measuring ECL are described in note 4.4.
A number of significant judgements are also required in applying the accounting requirements for measuring ECL, such as:
- Determining criteria for significant increase in credit risk;
- Choosing appropriate models and assumptions for the measurement of ECL;
- Establishing the number and relative weightings of forward-looking scenarios for each type of product/market and associated ECL; and
- Establishing groups of financial assets for the purposes of measuring ECL.
Detailed information about the judgements and estimates made by the Bank in the above areas is set out in note 3.
b. Determination of fair values
The determination of fair value for financial assets and liabilities for which there is no observable market price requires the use of techniques as described in note 3.4. For financial instruments that trade infrequently and have little price transparency, fair value is less objective, and requires varying degrees of judgment depending on liquidity, concentration, uncertainty of market factors, pricing assumptions and other risks affecting the specific instrument.
c. Deferred tax assets
Deferred tax assets are recognised for deductible temporary differences, unused tax losses and unused tax credits to the extent that it is probable that taxable profit will be available against which the losses can be utilised. Management judgement is required to determine the amount of deferred tax assets that can be recognised, based on the likely timing and level of future taxable profits, together with future tax planning strategies.
(All amounts are expressed in cedis unless otherwise stated)

Notes86 United Bank for Africa (Ghana) Limited
2018 Annual Report
(All amounts are expressed in Ghana cedis unless otherwise stated)
7. Interest income
2018 2017
Loans to banks 32,340,787 26,055,618
Loans to customers 160,168,215 346,853,296
Investment securities :
- At amortised cost 241,623,804 -
- At fair value through other comprehensive income 77,198,967 -
- Held to maturity - 212,569,458
- Available for sale - 13,338,499
511,331,773 598,816,871
8. Interest expense
2018 2017
Deposits from customers:
Fixed deposits 81,325,271 89,649,576
Savings deposits 2,109,177 1,988,545
Demand and call deposits 55,235,276 42,439,146
138,669,724 134,077,267
Deposits from banks 20,469,756 13,698,870
Borrowings 8,572,593 -
29,042,349 13,698,870
167,712,073 147,776,137
9. Fees and commission income
2018 2017
Commission on turnover 5,124,726 4,567,729
Credit-related fees and commissions 15,709,147 20,102,229
Trade finance fees 10,767,942 7,443,147
Electronic banking income 5,979,720 5,453,721
Guarantee charges and commissions 6,427,897 2,024,015
Other commissions on transactional services 6,532,654 6,387,663
50,542,086 45,978,504
Fees and commission expenses (6,228,088) (7,097,215)
Net fee and commission income 44,313,998 38,881,289
Fees and commission expense comprise expenses related to electronic banking as well as other bank charges.
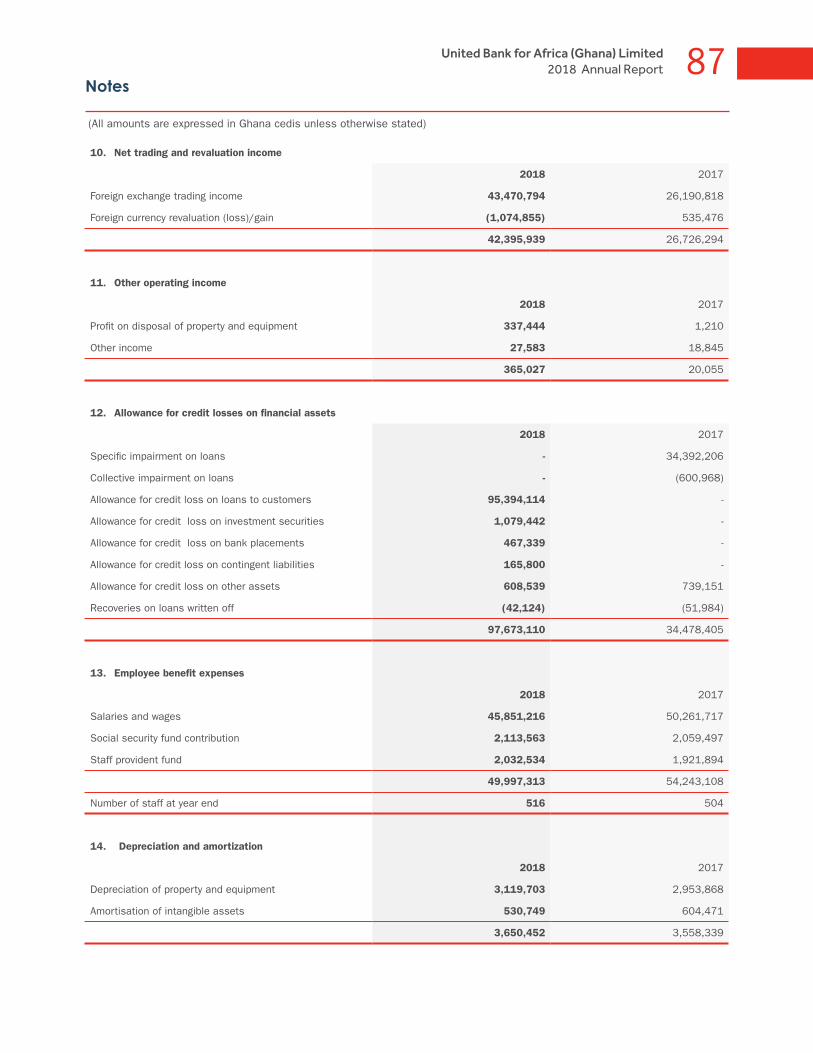
Notes87United Bank for Africa (Ghana) Limited
2018 Annual Report
(All amounts are expressed in Ghana cedis unless otherwise stated)
10. Net trading and revaluation income
2018 2017
Foreign exchange trading income 43,470,794 26,190,818
Foreign currency revaluation (loss)/gain (1,074,855) 535,476
42,395,939 26,726,294
11. Other operating income
2018 2017
Profit on disposal of property and equipment 337,444 1,210
Other income 27,583 18,845
365,027 20,055
12. Allowance for credit losses on financial assets
2018 2017
Specific impairment on loans - 34,392,206
Collective impairment on loans - (600,968)
Allowance for credit loss on loans to customers 95,394,114 -
Allowance for credit loss on investment securities 1,079,442 -
Allowance for credit loss on bank placements 467,339 -
Allowance for credit loss on contingent liabilities 165,800 -
Allowance for credit loss on other assets 608,539 739,151
Recoveries on loans written off (42,124) (51,984)
97,673,110 34,478,405
13. Employee benefit expenses
2018 2017
Salaries and wages 45,851,216 50,261,717
Social security fund contribution 2,113,563 2,059,497
Staff provident fund 2,032,534 1,921,894
49,997,313 54,243,108
Number of staff at year end 516 504
14. Depreciation and amortization
2018 2017
Depreciation of property and equipment 3,119,703 2,953,868
Amortisation of intangible assets 530,749 604,471
3,650,452 3,558,339

Notes88 United Bank for Africa (Ghana) Limited
2018 Annual Report
15. Other operating expenses
2018 2017
Directors fees 1,324,703 1,207,375
Auditors remuneration 443,711 504,048
Occupancy and premises maintenance costs 12,081,046 12,603,000
Business travels 1,678,145 1,707,016
Advertising, promotions and branding 3,163,676 2,419,554
Legal and professional service fees 16,770,797 34,963,116
IT and Communication 5,855,494 4,923,357
Printing, stationery and subscriptions 1,431,903 1,677,118
Security and cash handling expenses 3,026,828 2,715,789
Insurance 354,777 311,504
Fuel, repairs and maintenance 12,555,573 12,421,380
Training and human capital development 1,909,176 1,948,498
Property and equipment written off 43,246 150,128
Other expenses 5,350,739 31,882,716
65,989,814 109,434,599
Number of directors at year end 5 8
16. Basic and diluted earnings per share
2018 2017
Profit attributable to equity holders 151,910,224 219,967,980
Weighted average number of ordinary shares outstanding 4,008,604,167 3,700,250,000
Basic and diluted earnings per share 0.04 0.06
The Bank has no dilutive instruments. Hence basic and diluted earnings per share are equal.
17. Income tax
2018 2017
Current income tax 53,883,131 79,223,900
National fiscal stabilisation levy 6,823,033 15,747,696
Deferred income tax 767,587 14,345
Income tax expense 61,473,751 94,985,941
(All amounts are expressed in Ghana cedis unless otherwise stated)
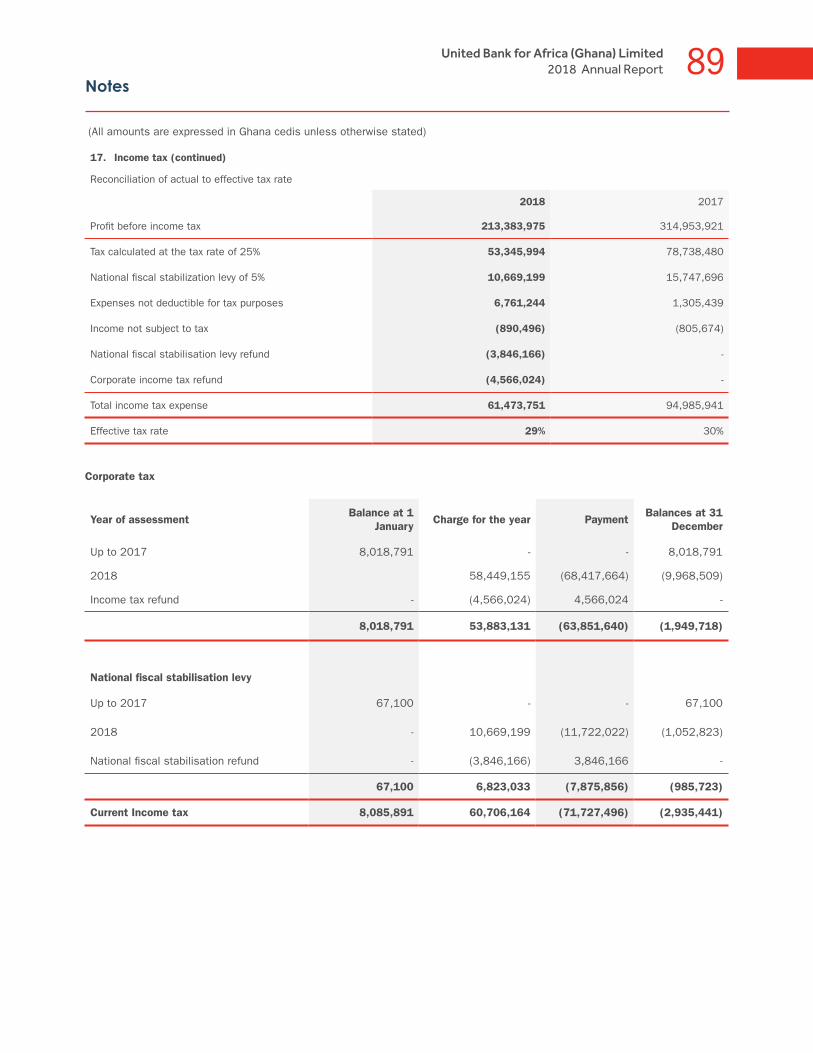
Notes89United Bank for Africa (Ghana) Limited
2018 Annual Report
17. Income tax (continued)
Reconciliation of actual to effective tax rate
2018 2017
Profit before income tax 213,383,975 314,953,921
Tax calculated at the tax rate of 25% 53,345,994 78,738,480
National fiscal stabilization levy of 5% 10,669,199 15,747,696
Expenses not deductible for tax purposes 6,761,244 1,305,439
Income not subject to tax (890,496) (805,674)
National fiscal stabilisation levy refund (3,846,166) -
Corporate income tax refund (4,566,024) -
Total income tax expense 61,473,751 94,985,941
Effective tax rate 29% 30%
Corporate tax
Year of assessment Balance at 1
January Charge for the year Payment
Balances at 31 December
Up to 2017 8,018,791 - - 8,018,791
2018 58,449,155 (68,417,664) (9,968,509)
Income tax refund - (4,566,024) 4,566,024 -
8,018,791 53,883,131 (63,851,640) (1,949,718)
National fiscal stabilisation levy
Up to 2017 67,100 - - 67,100
2018 - 10,669,199 (11,722,022) (1,052,823)
National fiscal stabilisation refund - (3,846,166) 3,846,166 -
67,100 6,823,033 (7,875,856) (985,723)
Current Income tax 8,085,891 60,706,164 (71,727,496) (2,935,441)
(All amounts are expressed in Ghana cedis unless otherwise stated)
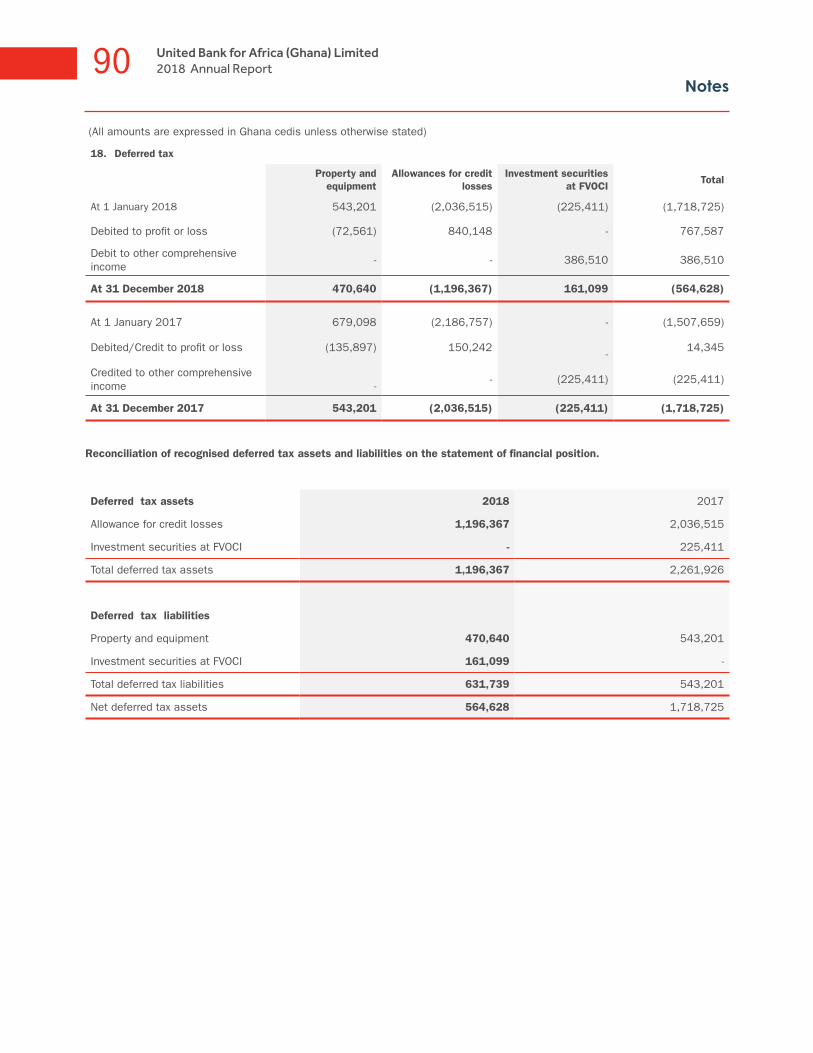
Notes90 United Bank for Africa (Ghana) Limited
2018 Annual Report
18. Deferred tax
Property and equipment
Allowances for credit losses
Investment securities at FVOCI
Total
At 1 January 2018 543,201 (2,036,515) (225,411) (1,718,725)
Debited to profit or loss (72,561) 840,148 - 767,587
Debit to other comprehensive income
- - 386,510 386,510
At 31 December 2018 470,640 (1,196,367) 161,099 (564,628)
At 1 January 2017 679,098 (2,186,757) - (1,507,659)
Debited/Credit to profit or loss (135,897) 150,242
- 14,345
Credited to other comprehensive income
-
- (225,411) (225,411)
At 31 December 2017 543,201 (2,036,515) (225,411) (1,718,725)
Reconciliation of recognised deferred tax assets and liabilities on the statement of financial position.
Deferred tax assets 2018 2017
Allowance for credit losses 1,196,367 2,036,515
Investment securities at FVOCI - 225,411
Total deferred tax assets 1,196,367 2,261,926
Deferred tax liabilities
Property and equipment 470,640 543,201
Investment securities at FVOCI 161,099 -
Total deferred tax liabilities 631,739 543,201
Net deferred tax assets 564,628 1,718,725
(All amounts are expressed in Ghana cedis unless otherwise stated)

Notes91United Bank for Africa (Ghana) Limited
2018 Annual Report
19. Cash and cash equivalents
2018 2017
a) Cash and Balances with Bank of Ghana
Cash on hand 27,992,953 26,128,697
Balances with Bank of Ghana( Mandatory) 211,471,788 207,367,182
Balances with Bank of Ghana(Unrestricted) 27,664,288 15,385,286
267,129,029 248,881,165
b) Due from other banks
Items in course of collection 25,999,626 17,706,641
Placement and balances with local Banks 124,054,901 22,079,240
Placement with foreign Banks 66,762,658 218,632,915
Nostro account balances 62,790,651 31,166,419
Allowance for credit loss on bank with placements (467,339) -
279,140,497 289,585,215
546,269,526 538,466,380
c) Cash and cash equivalents for purposes of the statements of cash flows
Cash and balances with Bank of Ghana 267,129,029 248,881,165
Mandatory deposit reserve (211,471,788) (207,367,182)
Unrestricted cash and bank balances 55,657,241 41,513,983
Due from other banks 279,140,497 289,585,215
Short term treasury bills 99,630,925 978,368,670
434,428,663 1,309,467,868
Balances with Bank of Ghana include mandatory deposit reserve of GH¢ 211,471,788 (2017: GH¢207,367,182) which is not available for day to day operations.
(All amounts are expressed in Ghana cedis unless otherwise stated)
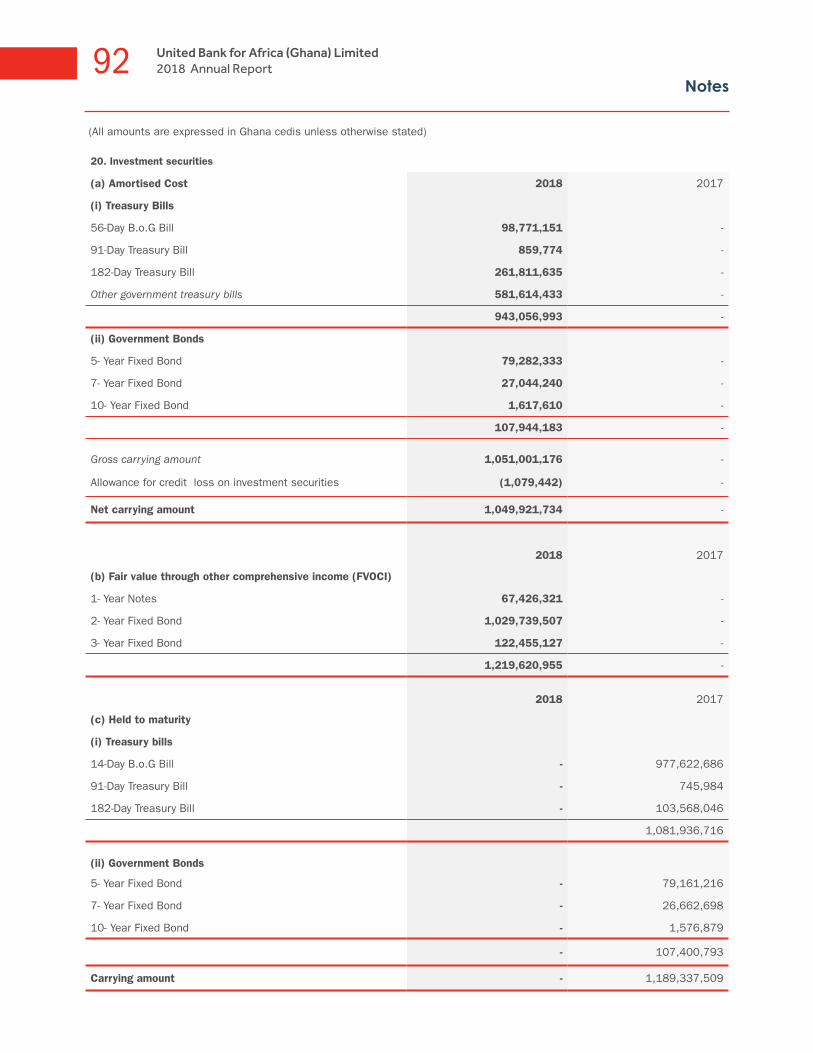
Notes92 United Bank for Africa (Ghana) Limited
2018 Annual Report
20. Investment securities
(a) Amortised Cost 2018 2017
(i) Treasury Bills
56-Day B.o.G Bill 98,771,151 -
91-Day Treasury Bill 859,774 -
182-Day Treasury Bill 261,811,635 -
Other government treasury bills 581,614,433 -
943,056,993 -
(ii) Government Bonds
5- Year Fixed Bond 79,282,333 -
7- Year Fixed Bond 27,044,240 -
10- Year Fixed Bond 1,617,610 -
107,944,183 -
Gross carrying amount 1,051,001,176 -
Allowance for credit loss on investment securities (1,079,442) -
Net carrying amount 1,049,921,734 -
2018 2017
(b) Fair value through other comprehensive income (FVOCI)
1- Year Notes 67,426,321 -
2- Year Fixed Bond 1,029,739,507 -
3- Year Fixed Bond 122,455,127 -
1,219,620,955 -
2018 2017
(c) Held to maturity
(i) Treasury bills
14-Day B.o.G Bill - 977,622,686
91-Day Treasury Bill - 745,984
182-Day Treasury Bill - 103,568,046
1,081,936,716
(ii) Government Bonds
5- Year Fixed Bond - 79,161,216
7- Year Fixed Bond - 26,662,698
10- Year Fixed Bond - 1,576,879
- 107,400,793
Carrying amount - 1,189,337,509
(All amounts are expressed in Ghana cedis unless otherwise stated)

Notes93United Bank for Africa (Ghana) Limited
2018 Annual Report
(All amounts are expressed in Ghana cedis unless otherwise stated)
Investment securities (continued)
(d) Available-for-sale 2018 2017
Government Bonds
1- Year Notes - 43,300,216
2- Year Fixed Bond - 1,370,908
3- Year Fixed Bond - 24,577,611
Fair value loss - (901,646)
- 68,347,089
Current 2,162,930,836 1,123,997,441
Non-current 106,611,853 133,687,157
2,269,542,689 1,257,684,598
21. Loans and advances to customers
2018 2017
Overdrafts 832,612,456 662,514,616
Term Loans 87,595,194 612,375,483
Gross loans and advances 920,207,650 1,274,890,099
Allowance for credit losses on loans to customers (286,001,549) -
Specific allowance for impairment - (167,897,631)
Collective allowance impairment - (8,146,057)
Net loans and advances 634,206,101 1,098,846,411
Analysis by type of customer
Private enterprises 904,267,386 1,259,126,446
Individuals 8,338,223 6,665,485
Staff 7,602,041 9,098,168
Gross loans and advances 920,207,650 1,274,890,099
Analysis by Sector
Retail customers 70,602,149 95,977,971
Corporate customers 849,605,501 1,178,912,128
Gross loans and advances 920,207,650 1,274,890,099
Allowance for credit losses on loans to customers (286,001,549) -
Specific allowance for impairment - (167,897,631)
Collective impairment - (8,146,057)
Net loans and advances to customers 634,206,101 1,098,846,411
Current 848,243,234 1,245,980,600
Non- current 71,964,416 28,909,499
920,207,650 1,274,890,099

Notes94 United Bank for Africa (Ghana) Limited
2018 Annual Report
(All amounts are expressed in Ghana cedis unless otherwise stated)
21. Loans and advances to customers (continued)
Movement in impairment on loans and advances to customers
2018 2017
Specific impairment
At 1 January - 133,505,425
Charge for the year - 34,392,206
Balance at end of year - 167,897,631
Collective impairment
At 1 January - 8,747,025
Write-back during the year - (600,968)
Balance at end of year - 8,146,057
Allowance for credit losses to customers
At 1 January 176,043,688 -
Transitional IFRS 9 adjustments 21,102,861 -
Charge for the year 95,394,114 -
Amounts written off (6,539,114) -
Balance at end of year 286,001,549 -
Loan loss provision ratio 31% 14%
Gross non-performing loans ratio 72% 44%
a) Loans and advances to customers per IFRS 9 classification
31 December 2018
Stage 1 Stage 2 Stage 3 Total
Gross Amount
Loans to individuals 8,050,276 - 7,889,988 15,940,264
Loans to corporate entities 219,059,577 - 685,207,809 904,267,386
227,109,853 - 693,097,797 920,207,650
Stage 1 Stage 2 Stage 3 Total
Allowance for credit losses
Loans to individuals 80,503 - 6,724,848 6,805,351
Loans to corporate entities 7,723,044 - 271,473,154 279,196,198
Total allowance for credit losses 7,803,547 - 278,198,002 286,001,549
Net Loans 219,306,306 - 414,899,795 634,206,101
b) Allowance for credit loss on loans and advances to customers
Stage 1 Stage 2 Stage 3 Total
Balance at 31 Dec 2017 (IAS 39) 8,136,609 9,448 167,897,631 176,043,688
Transition adjustments - - 21,102,861 21,102,861
Balance beginning of year (IFRS 9) 8,136,609 9,448 189,000,492 197,146,549
Transfers:
Allowance for credit losses (333,062) (9,448) 95,736,624 95,394,114
Write-offs/reversals - - (6,539,114) (6,539,114)
Balance, end of year 7,803,547 - 278,198,002 286,001,549
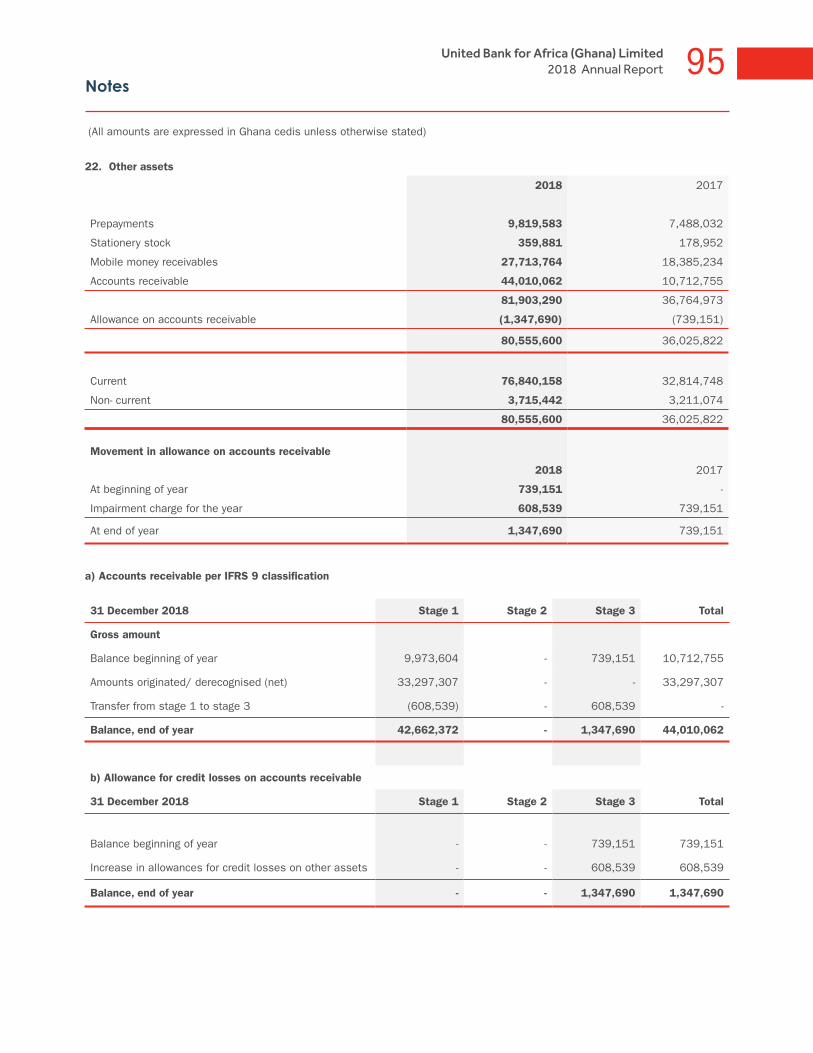
Notes95United Bank for Africa (Ghana) Limited
2018 Annual Report
(All amounts are expressed in Ghana cedis unless otherwise stated)
22. Other assets
2018 2017
Prepayments 9,819,583 7,488,032
Stationery stock 359,881 178,952
Mobile money receivables 27,713,764 18,385,234
Accounts receivable 44,010,062 10,712,755
81,903,290 36,764,973
Allowance on accounts receivable (1,347,690) (739,151)
80,555,600 36,025,822
Current 76,840,158 32,814,748
Non- current 3,715,442 3,211,074
80,555,600 36,025,822
Movement in allowance on accounts receivable
2018 2017
At beginning of year 739,151 -
Impairment charge for the year 608,539 739,151
At end of year 1,347,690 739,151
a) Accounts receivable per IFRS 9 classification
31 December 2018 Stage 1 Stage 2 Stage 3 Total
Gross amount
Balance beginning of year 9,973,604 - 739,151 10,712,755
Amounts originated/ derecognised (net) 33,297,307 - - 33,297,307
Transfer from stage 1 to stage 3 (608,539) - 608,539 -
Balance, end of year 42,662,372 - 1,347,690 44,010,062
b) Allowance for credit losses on accounts receivable
31 December 2018 Stage 1 Stage 2 Stage 3 Total
Balance beginning of year - - 739,151 739,151
Increase in allowances for credit losses on other assets - - 608,539 608,539
Balance, end of year - - 1,347,690 1,347,690
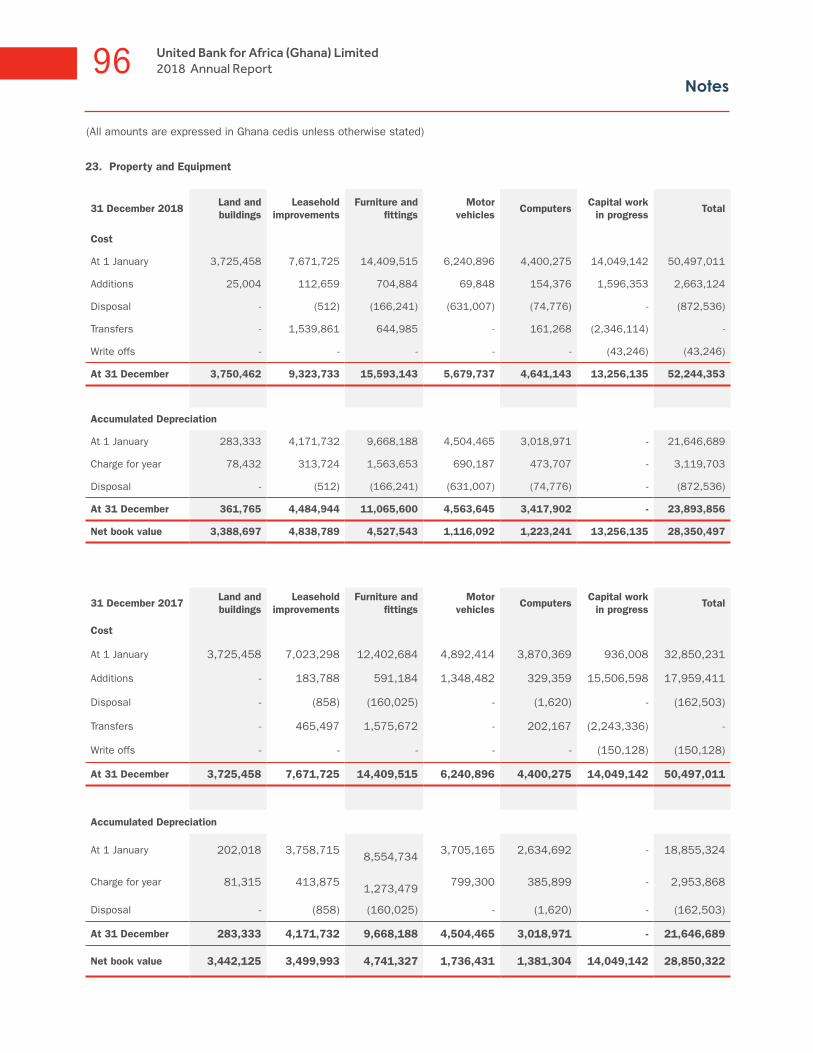
Notes96 United Bank for Africa (Ghana) Limited
2018 Annual Report
(All amounts are expressed in Ghana cedis unless otherwise stated)
23. Property and Equipment
31 December 2018 Land and buildings
Leasehold improvements
Furniture and fittings
Motor vehicles
ComputersCapital work
in progressTotal
Cost
At 1 January 3,725,458 7,671,725 14,409,515 6,240,896 4,400,275 14,049,142 50,497,011
Additions 25,004 112,659 704,884 69,848 154,376 1,596,353 2,663,124
Disposal - (512) (166,241) (631,007) (74,776) - (872,536)
Transfers - 1,539,861 644,985 - 161,268 (2,346,114) -
Write offs - - - - - (43,246) (43,246)
At 31 December 3,750,462 9,323,733 15,593,143 5,679,737 4,641,143 13,256,135 52,244,353
Accumulated Depreciation
At 1 January 283,333 4,171,732 9,668,188 4,504,465 3,018,971 - 21,646,689
Charge for year 78,432 313,724 1,563,653 690,187 473,707 - 3,119,703
Disposal - (512) (166,241) (631,007) (74,776) - (872,536)
At 31 December 361,765 4,484,944 11,065,600 4,563,645 3,417,902 - 23,893,856
Net book value 3,388,697 4,838,789 4,527,543 1,116,092 1,223,241 13,256,135 28,350,497
31 December 2017 Land and buildings
Leasehold improvements
Furniture and fittings
Motor vehicles
ComputersCapital work
in progressTotal
Cost
At 1 January 3,725,458 7,023,298 12,402,684 4,892,414 3,870,369 936,008 32,850,231
Additions - 183,788 591,184 1,348,482 329,359 15,506,598 17,959,411
Disposal - (858) (160,025) - (1,620) - (162,503)
Transfers - 465,497 1,575,672 - 202,167 (2,243,336) -
Write offs - - - - - (150,128) (150,128)
At 31 December 3,725,458 7,671,725 14,409,515 6,240,896 4,400,275 14,049,142 50,497,011
Accumulated Depreciation
At 1 January 202,018 3,758,715
8,554,734 3,705,165 2,634,692 - 18,855,324
Charge for year 81,315 413,875
1,273,479 799,300 385,899 - 2,953,868
Disposal - (858) (160,025) - (1,620) - (162,503)
At 31 December 283,333 4,171,732 9,668,188 4,504,465 3,018,971 - 21,646,689
Net book value 3,442,125 3,499,993 4,741,327 1,736,431 1,381,304 14,049,142 28,850,322

Notes97United Bank for Africa (Ghana) Limited
2018 Annual Report
(All amounts are expressed in Ghana cedis unless otherwise stated)
23. Property and equipment (continued)The profit on disposal is as follows:
2018 2017
Cost 872,536 162,503
Depreciation (872,536) (162,503)
Net book value - -
Proceeds 337,444 1,210
Profit on disposal 337,444 1,210
24. Intangible assets
Intangible assets represent computer software purchased by the Bank. The movement during the year is as follows:
2018 2017
Cost
At 1 January 3,707,623 3,148,684
Additions 686,561 558,939
At 31 December 4,394,184 3,707,623
Amortisation
At 1 January 2,572,047 1,967,576
Charge for the year 530,749 604,471
At 31 December 3,102,796 2,572,047
Net book value 1,291,388 1,135,576
25. Customer deposits
2018 2017
Analysis by type of customer
Savings deposits 113,091,040 93,828,107
Demand and call deposits 1,619,229,731 1,103,294,803
Fixed deposits 382,397,108 876,548,911
2,114,717,879 2,073,671,821
Current 2,112,076,016 2,070,454,691
Non-current 2,641,863 3,217,130
2,114,717,879 2,073,671,821
Analysis by sector
Retail customers 950,282,225 801,175,840
Corporate customers 1,164,435,654 1,272,495,981
2,114,717,879 2,073,671,821
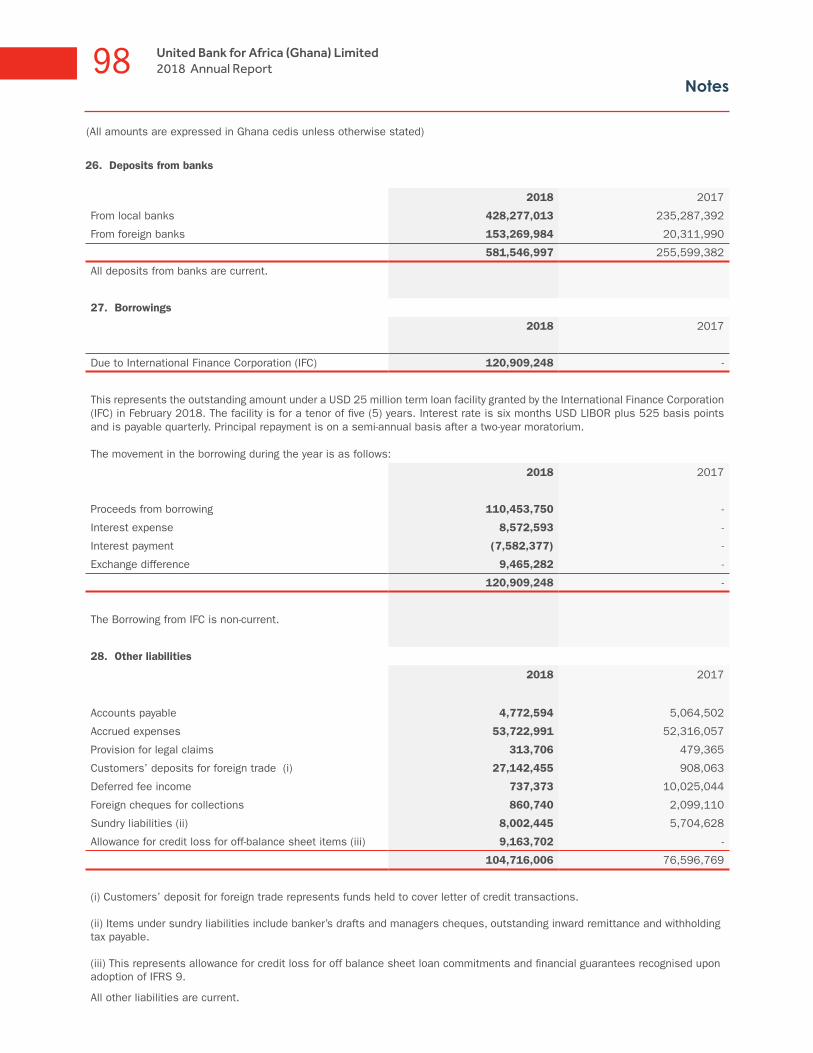
Notes98 United Bank for Africa (Ghana) Limited
2018 Annual Report
(All amounts are expressed in Ghana cedis unless otherwise stated)
26. Deposits from banks
2018 2017
From local banks 428,277,013 235,287,392
From foreign banks 153,269,984 20,311,990
581,546,997 255,599,382
All deposits from banks are current.
27. Borrowings
2018 2017
Due to International Finance Corporation (IFC) 120,909,248 -
This represents the outstanding amount under a USD 25 million term loan facility granted by the International Finance Corporation (IFC) in February 2018. The facility is for a tenor of five (5) years. Interest rate is six months USD LIBOR plus 525 basis points and is payable quarterly. Principal repayment is on a semi-annual basis after a two-year moratorium.
The movement in the borrowing during the year is as follows:
2018 2017
Proceeds from borrowing 110,453,750 -
Interest expense 8,572,593 -
Interest payment (7,582,377) -
Exchange difference 9,465,282 -
120,909,248 -
The Borrowing from IFC is non-current.
28. Other liabilities
2018 2017
Accounts payable 4,772,594 5,064,502
Accrued expenses 53,722,991 52,316,057
Provision for legal claims 313,706 479,365
Customers’ deposits for foreign trade (i) 27,142,455 908,063
Deferred fee income 737,373 10,025,044
Foreign cheques for collections 860,740 2,099,110
Sundry liabilities (ii) 8,002,445 5,704,628
Allowance for credit loss for off-balance sheet items (iii) 9,163,702 -
104,716,006 76,596,769
(i) Customers’ deposit for foreign trade represents funds held to cover letter of credit transactions.
(ii) Items under sundry liabilities include banker’s drafts and managers cheques, outstanding inward remittance and withholding tax payable.
(iii) This represents allowance for credit loss for off balance sheet loan commitments and financial guarantees recognised upon adoption of IFRS 9.
All other liabilities are current.

Notes99United Bank for Africa (Ghana) Limited
2018 Annual Report
(All amounts are expressed in Ghana cedis unless otherwise stated)
29. Stated capital
2018 2017
Issued :
Authorised Shares (number) 9,000,000,000 9,000,000,000
Issued shares (number) 7,400,500,000 3,700,250,000
Share capital (in GHS) 400,000,000 74,659,061
The movement in the issued shares account during the year is as follows:
Number of shares in issue at the start of the year 3,700,250,000 3,700,250,000
Additional number of shares from bonus issue 3,700,250,000 -
Number of shares in issue at the end of the year 7,400,500,000 3,700,250,000
During the year, the Bank increased it’s stated capital from GHS 74.66 million to GHS 400.00 million in line with the new minimum capital requirements stipulated by the Bank of Ghana. The increase was effected by the transfer of GHS 325.34 million from income surplus to stated capital by way of a bonus issue of 3,700,250,000 new shares of no par value at GHS 0.08 per share, on the basis of one bonus share for every existing share. The capitalization received shareholders’ approval at the Emergency General Meeting held on 4 December 2018.
The taxes paid in relation to the recapitalisation are as follows:
2018 2017
Withholding tax 28,290,516 -
Stamp duty 1,626,705 -
29,917,221 -
30. Reserves
a. Statutory reserveStatutory reserve represents transfer of 12.5% of profit after tax to reserve in compliance with Bank of Ghana’s regulatory requirement. The statutory reserve is not distributable.
b. Income surplus
This is the carried forward recognised income out of expenses plus current year’s profit attributable to shareholders.
c. Fair value reserves
This includes the net cumulative change in the fair value of investments at fair value through other comprehensive income. Such fair value charges are maintained until the investment is derecognised or impaired.
31. Dividend Declared
No dividend was declared during the year (2017: nil). The movement in the dividend payable account during the year is as follows:
2018 2017
At 1 January - 79,556,000
Dividend declared - -
Dividend paid - (79,556,000)
At 31 December - -

Notes100 United Bank for Africa (Ghana) Limited
2018 Annual Report
(All amounts are expressed in Ghana cedis unless otherwise stated)
32. Contingent liabilities and commitments
a. Legal proceedings
There were legal cases proceeding against the Bank at 31 December 2018. Beside provision of GH¢ 313,706 (December 2017: GH¢ 479,365) made in respect of these cases, no contingent liability associated with legal actions has been disclosed as professional advice indicates that it is unlikely that any significant loss will arise.
b. Capital commitments
At 31 December 2018, the Bank had capital commitments of GH¢235,467 (2017: GH¢318,510) in respect of leasehold improvements. The Bank’s Management is confident that future net revenues and funding will be sufficient to cover these commitments.
c. Loan commitments, guarantee and other financial facilities
At 31 December 2018, the Bank had contractual amounts of off-balance sheet financial instruments that commit the Bank to extend credit to customers, guarantee and other facilities as follows:
2018 2017
Letters of credit 46,961,322 11,469,429
Guarantees and indemnities 682,428,125 632,982,080
Loan commitments 37,638,996 18,971,267
Gross amount 767,028,443 663,422,776
Allowance for credit losses (9,163,702) -
Carrying amount 757,864,741 663,422,776
Letters of credit commit the Bank to make payments to third parties, on production of documents, which are subsequently reimbursed by customers.
33. Related party transactions
Parties are considered to be related if one party has the ability to control the other party or exercise significant influence over the other party in making financial or operational decisions. The Bank is a subsidiary of UBA Plc which owns 90.77% of the issued ordinary shares. UBA Plc is also the ultimate controlling party of the Bank.
All transactions with related parties are done in the normal course of business and at arm’s length.
Details of related party balances are as follows:
2018 2017
Loans to key management staff 818,431 990,861
Placements with UBA Plc 12,289,588 130,033,364
Placements with other UBA Plc subsidiaries 53,713,050 86,974,940
Nostro balances with UBA Plc 26,215,954 11,100,434
Nostro balances with other UBA Plc subsidiaries 6,136,866 3,041,183
Total 99,173,889 232,140,782
Interest income - key management staff 24,827 10,792
Deposits from key management staff 689,214 668,878
Due to Parent (UBA Plc) 41,363,306 32,081,692
Takings with UBA subsidiaries 151,830,000 20,311,990
Total 193,882,520 53,062,560

Notes101United Bank for Africa (Ghana) Limited
2018 Annual Report
(All amounts are expressed in Ghana cedis unless otherwise stated)
33. Related party transactions (continued)
Interest expense - key management staff 40,216 73,579
Other expenses 5,741,678 11,387,507
5,781,894 11,461,086
Key management compensation
Key management staff constitutes members of the Bank’s Executive Committee. The remuneration of key management staff during the year were as follows:
2018 2017
Salaries and other short-term employment benefits 5,836,959 5,474,005
Defined contribution for key management staff 230,883 222,903
6,067,842 5,696,908
Directors’ remuneration
Directors’ fees and allowances 1,324,703 1,207,375
34. Significant events after the year end
There were no significant events that have post-balance sheet adjustment effect, after the year ended 31 December 2018.
35. Compliance with prudential regulations
During the year, the Bank complied with all prudential regulations as stipulated by the Bank of Ghana. However, the Bank was sanctioned for the following:
SN Description Amount (GHS)
1 Penalty for outsourcing the Bank’s cash-pick delivery service without prior written approval from the Bank of Ghana.
24,000.00
2 Penalty for appointing a Senior Management personnel without prior written approval from the Bank of Ghana
12,000.00
36. Reclassification of Comparatives
Certain items in the statement of comprehensive income for the comparative period were reclassified in order to align with current year presentation which is deemed to provide information that is more relevant to users of the financial statements. The revised presentation is likely to continue so that comparability is not impaired. The amounts reclassified and the affected lines in the statement of comprehensive income are as shown below:
Dec 2017
(i) Other operating expenses
Amount as previously presented (124,643,325)
Reclassified to employee benefit expenses (note ii) 9,374,028
Reclassified to fees and commission expense (note iii) 5,834,698
Amount as re-presented (109,434,599)

Notes102 United Bank for Africa (Ghana) Limited
2018 Annual Report
(All amounts are expressed in Ghana cedis unless otherwise stated)
36. Reclassification of Comparatives (continued)
Dec 2017
(ii) Employee benefit expenses
Amount as previously presented (44,869,080)
Reclassified from other operating expenses (note i) (9,374,028)
Amount as re-presented (54,243,108)
(iii) Fees and commission expense
Amount as previously presented (1,262,517)
Reclassified from other operating expenses (note i) (5,834,698)
Amount as re-presented (7,097,215)

Notes103United Bank for Africa (Ghana) Limited
2018 Annual Report
(All amounts are expressed in Ghana cedis unless otherwise stated)
3. Value Added Statement
2018 2017
Interest and other operating income 561,873,859 644,795,375
Direct cost of services (238,605,272) (263,100,576)
Value added by banking services 323,268,587 381,694,799
Non-banking income 42,760,966 26,746,349
Impairments (97,673,110) (34,478,405)
Value added 268,356,443 373,962,743
Distributed as follows:
To employees:
Directors (excluding executives) 1,324,703 1,207,375
Executive directors 1,525,226 1,506,241
Other employees 48,472,087 52,736,867
To government:
Income taxes 61,473,751 94,985,941
To providers of capital:
Dividend to shareholders - -
To expansion and growth
Depreciation 3,119,703 2,953,868
Amortisation 530,749 604,471
Retained earnings 151,910,224 219,967,980
1. Shareholder information 2018
Shareholders Shareholding % holding
United Bank For Africa Plc 6,717,433,850 90.77%
Gold Coast Investment Project Ltd 496,573,550 6.71%
Teachers Fund 127,288,600 1.72%
Consortium Investment Trust 22,941,550 0.31%
Unique Insurance Co Ltd 22,941,550 0.31%
Labour Enterprises Trust Co. Ltd 13,320,900 0.18%
Totals 7,400,500,000 100%
2. Quantitative disclosures
2018 2017
Capital adequacy ratio 28.1% 28.0%
Liquid ratio 85.4% 74.4%
Gross non-performing loans ratio 72.0% 43.7%
Other disclosures


Corporate Information
6
Directory of the Bank’s offices, ATM locations and international network
Corporate InformationNotice of Annual General Meeting
Proxy Form Branch Network
106107108109
105
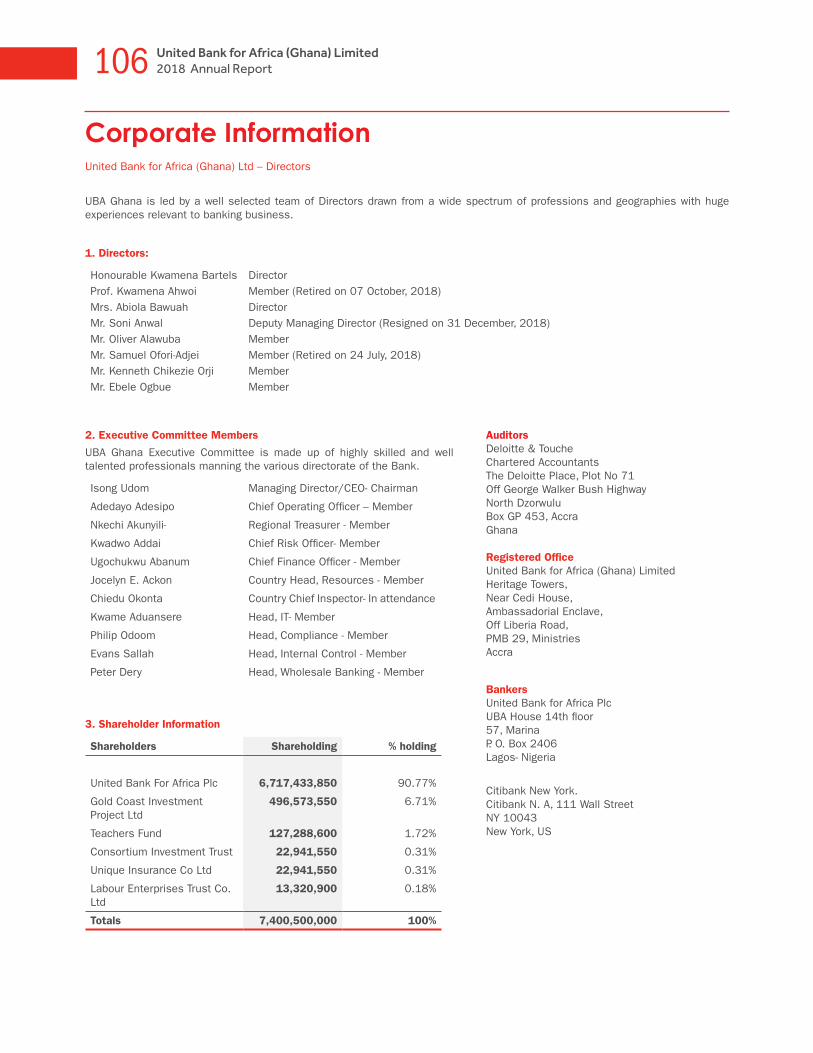
106 United Bank for Africa (Ghana) Limited2018 Annual Report
Corporate InformationUnited Bank for Africa (Ghana) Ltd – Directors
UBA Ghana is led by a well selected team of Directors drawn from a wide spectrum of professions and geographies with huge experiences relevant to banking business.
1. Directors:
Honourable Kwamena Bartels Prof. Kwamena Ahwoi Mrs. Abiola Bawuah Mr. Soni Anwal Mr. Oliver Alawuba Mr. Samuel Ofori-Adjei Mr. Kenneth Chikezie Orji Mr. Ebele Ogbue
DirectorMember (Retired on 07 October, 2018)DirectorDeputy Managing Director (Resigned on 31 December, 2018)MemberMember (Retired on 24 July, 2018)MemberMember
2. Executive Committee Members
UBA Ghana Executive Committee is made up of highly skilled and well talented professionals manning the various directorate of the Bank.
Isong Udom Managing Director/CEO- Chairman
Adedayo Adesipo Chief Operating Officer – Member
Nkechi Akunyili- Regional Treasurer - Member
Kwadwo Addai Chief Risk Officer- Member
Ugochukwu Abanum Chief Finance Officer - Member
Jocelyn E. Ackon Country Head, Resources - Member
Chiedu Okonta Country Chief Inspector- In attendance
Kwame Aduansere Head, IT- Member
Philip Odoom Head, Compliance - Member
Evans Sallah Head, Internal Control - Member
Peter Dery Head, Wholesale Banking - Member
3. Shareholder Information
Shareholders Shareholding % holding
United Bank For Africa Plc 6,717,433,850 90.77%
Gold Coast Investment Project Ltd
496,573,550 6.71%
Teachers Fund 127,288,600 1.72%
Consortium Investment Trust 22,941,550 0.31%
Unique Insurance Co Ltd 22,941,550 0.31%
Labour Enterprises Trust Co. Ltd
13,320,900 0.18%
Totals 7,400,500,000 100%
AuditorsDeloitte & ToucheChartered AccountantsThe Deloitte Place, Plot No 71Off George Walker Bush HighwayNorth DzorwuluBox GP 453, AccraGhana
Registered Office United Bank for Africa (Ghana) LimitedHeritage Towers,Near Cedi House,Ambassadorial Enclave,Off Liberia Road,PMB 29, MinistriesAccra
BankersUnited Bank for Africa PlcUBA House 14th floor57, MarinaP. O. Box 2406Lagos- Nigeria
Citibank New York. Citibank N. A, 111 Wall StreetNY 10043New York, US

107United Bank for Africa (Ghana) Limited2018 Annual Report
NOTICE IS HEREBY GIVEN that the Annual General Meeting of United Bank for Africa (Ghana) Limited will be held at 4.00pm prompt on Tuesday 14th May, 2019 at Heritage Tower, Ambassadorial Enclave, Off Liberia Road, West Ridge, Accra to transact the following business:
1. To receive the Audited Accounts for the year ended 31st December, 2018 together with the reports of the Directors and Auditors thereon.
2. To appoint Deloitte Ghana as Auditors of the Company.
3. To elect Directors
4. To authorise the Directors to fix the remuneration of the Auditors.
5. To transact any other business to be dealt with at an Annual General Meeting.
Dated this 10th day of April, 2019
By Order of the Board
For: COMPANY SECRETARY
UNITED BANK FOR AFRICA (GHANA) LIMITED
HERITAGE TOWER, AMBASSADORIAL ENCLAVE
WEST RIDGE, ACCRA
NOTE:
A member entitled to attend and vote at the General Meeting is entitled to appoint a proxy to attend and vote in his/her stead. Executed proxy forms must be deposited at the registered office of the Bank, Heritage Tower, near Cedi House, Ambassadorial Enclave, off Liberia Road, Ministries, Accra.
A proxy form is enclosed.
NOTICE OF ANNUAL GENERAL MEETING
United Bank for Africa (Ghana) LimitedHeritage Tower, Ambassadorial Enclave, Ridge. P.M.B. 29, Ministries, Accra, Ghana.
Managing Director/CEO: Isong Udom, Directors: Oliver Alawuba, Mr. Ebele Ogbue, Kwamena Bartels, Mr. Kenneth Chikezie OrjiTel: +233-030-263 4060 Fax: +233-302-680666
www.ubagroup.com
108 United Bank for Africa (Ghana) Limited2018 Annual Report
Proxy Form
PROXY FORM
ANNUAL GENERAL MEETING to be held at 4.00pm on Tuesday, May 14, 2019 at Heritage Tower, near Cedi House, Ambassadorial Enclave, West Ridge, Accra
I/We ................................................................. being a member of United Bank for Africa (Ghana) Limited hereby appoint .................................................(name of proxy) or failing him/her the Chairman of the meeting as my/our Proxy to vote for me/us
and on my/our behalf at the Annual General Meeting of the Company to be held on May 14, 2019.
Signed this ........ day of .............................. 2019
...................................................................................
Shareholder’s signature/Common Seal
No. Resolutions from the Board For Against
1.
To receive the Audited Accounts for the year ended
31st December, 2018 together with the reports of the
Directors and Auditors thereon.
2. To appoint Deloitte as Auditors of the Company.
3. To elect Directors.
4. To authorise the Directors to fix the remuneration of the Auditors.
5.To transact any other business to be dealt with at an Annual General
Meeting.
Please indicate with an “X” in the appropriate square how you wish your votes to be cast on the resolutions set out above. Unless otherwise instructed the proxy will vote or abstain from voting at his/her discretion.
THIS PROXY FORM SHOULD NOT BE SENT TO THE SECRETARY IF THE MEMBER WILL BE ATTENDING THE MEETING. Notes. 1. A member (Shareholder) who is unable to attend the Annual General Meeting is allowed by law to vote by proxy. The above Proxy
Form has been prepared to enable you to exercise your vote if you cannot personally attend. 2. Provision has been made on the Form for the Chairman of the meeting to act as your proxy, but if you wish, you may insert in
the blank space marked “name of the proxy” the name of any person whether a Member of the Company or not, who will attend the Meeting and vote on your behalf instead of the Chairman of the Meeting.
3. If executed by a Company/Trust, the Proxy Form should bear its Common Seal or be signed on its behalf by a Director/Trustees
of the Company/Trust. 4. Please execute the Proxy Form and deliver it so as to reach the Board Secretary not later than 9.00am on Tuesday May 14,
2019.
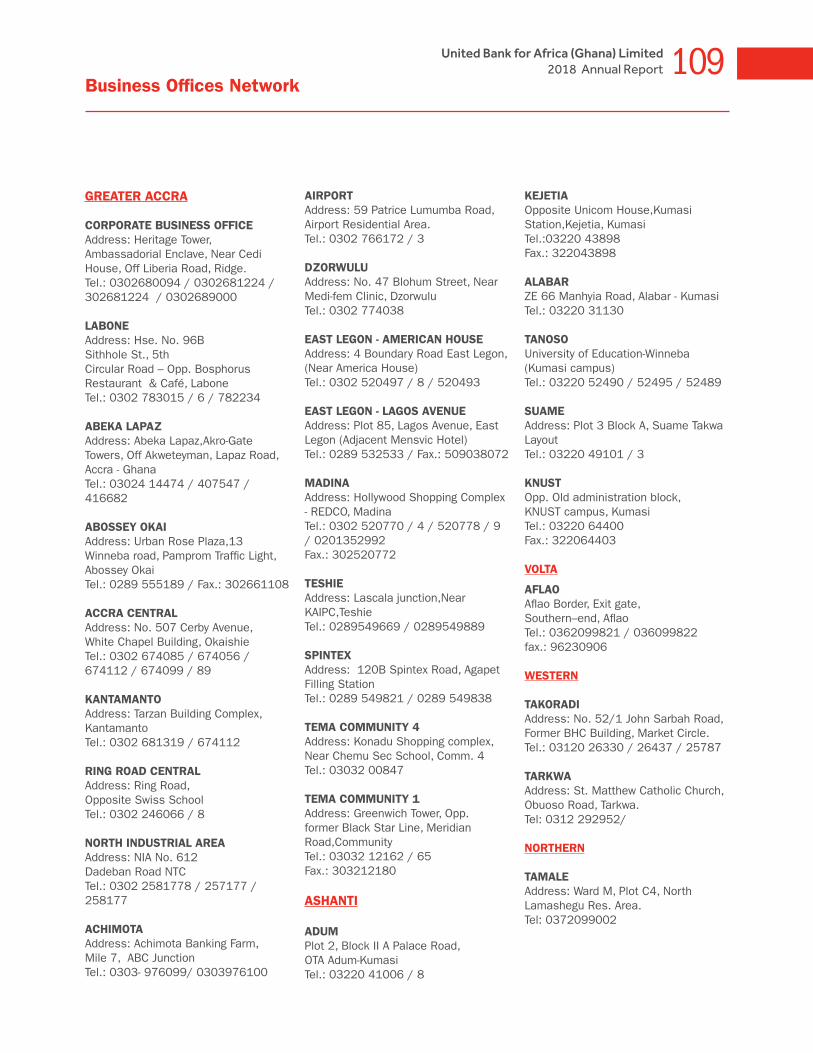
109United Bank for Africa (Ghana) Limited2018 Annual Report
Business Offices Network
GREATER ACCRA
CORPORATE BUSINESS OFFICEAddress: Heritage Tower, Ambassadorial Enclave, Near Cedi House, Off Liberia Road, Ridge.Tel.: 0302680094 / 0302681224 / 302681224 / 0302689000
LABONE Address: Hse. No. 96B Sithhole St., 5th Circular Road – Opp. Bosphorus Restaurant & Café, LaboneTel.: 0302 783015 / 6 / 782234
ABEKA LAPAZAddress: Abeka Lapaz,Akro-Gate Towers, Off Akweteyman, Lapaz Road, Accra - GhanaTel.: 03024 14474 / 407547 / 416682
ABOSSEY OKAIAddress: Urban Rose Plaza,13 Winneba road, Pamprom Traffic Light, Abossey OkaiTel.: 0289 555189 / Fax.: 302661108
ACCRA CENTRAL Address: No. 507 Cerby Avenue, White Chapel Building, OkaishieTel.: 0302 674085 / 674056 / 674112 / 674099 / 89
KANTAMANTOAddress: Tarzan Building Complex, KantamantoTel.: 0302 681319 / 674112
RING ROAD CENTRALAddress: Ring Road, Opposite Swiss SchoolTel.: 0302 246066 / 8
NORTH INDUSTRIAL AREAAddress: NIA No. 612 Dadeban Road NTCTel.: 0302 2581778 / 257177 / 258177
ACHIMOTAAddress: Achimota Banking Farm, Mile 7, ABC JunctionTel.: 0303- 976099/ 0303976100
AIRPORTAddress: 59 Patrice Lumumba Road, Airport Residential Area.Tel.: 0302 766172 / 3
DZORWULUAddress: No. 47 Blohum Street, Near Medi-fem Clinic, DzorwuluTel.: 0302 774038
EAST LEGON - AMERICAN HOUSEAddress: 4 Boundary Road East Legon, (Near America House)Tel.: 0302 520497 / 8 / 520493
EAST LEGON - LAGOS AVENUEAddress: Plot 85, Lagos Avenue, East Legon (Adjacent Mensvic Hotel)Tel.: 0289 532533 / Fax.: 509038072
MADINA Address: Hollywood Shopping Complex - REDCO, MadinaTel.: 0302 520770 / 4 / 520778 / 9 / 0201352992Fax.: 302520772
TESHIEAddress: Lascala junction,Near KAIPC,TeshieTel.: 0289549669 / 0289549889
SPINTEXAddress: 120B Spintex Road, Agapet Filling StationTel.: 0289 549821 / 0289 549838
TEMA COMMUNITY 4Address: Konadu Shopping complex, Near Chemu Sec School, Comm. 4Tel.: 03032 00847
TEMA COMMUNITY 1Address: Greenwich Tower, Opp. former Black Star Line, Meridian Road,CommunityTel.: 03032 12162 / 65Fax.: 303212180
ASHANTI
ADUMPlot 2, Block II A Palace Road, OTA Adum-KumasiTel.: 03220 41006 / 8
KEJETIAOpposite Unicom House,Kumasi Station,Kejetia, KumasiTel.:03220 43898Fax.: 322043898
ALABARZE 66 Manhyia Road, Alabar - KumasiTel.: 03220 31130
TANOSOUniversity of Education-Winneba (Kumasi campus)Tel.: 03220 52490 / 52495 / 52489
SUAMEAddress: Plot 3 Block A, Suame Takwa LayoutTel.: 03220 49101 / 3
KNUSTOpp. Old administration block, KNUST campus, KumasiTel.: 03220 64400Fax.: 322064403
VOLTA
AFLAOAflao Border, Exit gate, Southern–end, AflaoTel.: 0362099821 / 036099822fax.: 96230906
WESTERN
TAKORADIAddress: No. 52/1 John Sarbah Road, Former BHC Building, Market Circle.Tel.: 03120 26330 / 26437 / 25787
TARKWAAddress: St. Matthew Catholic Church, Obuoso Road, Tarkwa.Tel: 0312 292952/
NORTHERN
TAMALEAddress: Ward M, Plot C4, North Lamashegu Res. Area.Tel: 0372099002


Excellent Service…Delivered
Excellence. Execution. Enterprise
Customer Fulfillment Centre+233 (0) 302 634 [email protected]
20
18
AN
NU
AL R
EP
OR
T AN
D A
CC
OU
NTS
UN
ITED
BA
NK
FOR
AFR
ICA
(GH
AN
A) LIM
ITED
ANNUAL REPORT & ACCOUNTS 2018United Bank for Africa (Ghana) Limited
� � � � � � �� �� �� � � � �� � � �
PARTNERFOR SUCCESS