part a: urbanisation, poverty and housing · pdf file · 2010-11-109 surat...
TRANSCRIPT
1
E Q U I T A B L E C I T I E S
MAINSTREAMING URBAN POOR- Housing
AHMEDABAD
“Poverty is the worst form of violence.”
- Mahatma Gandhi
E Q U I T A B L E C I T I E S
Part A: Urbanisation, Poverty and Housing
2
E Q U I T A B L E C I T I E S
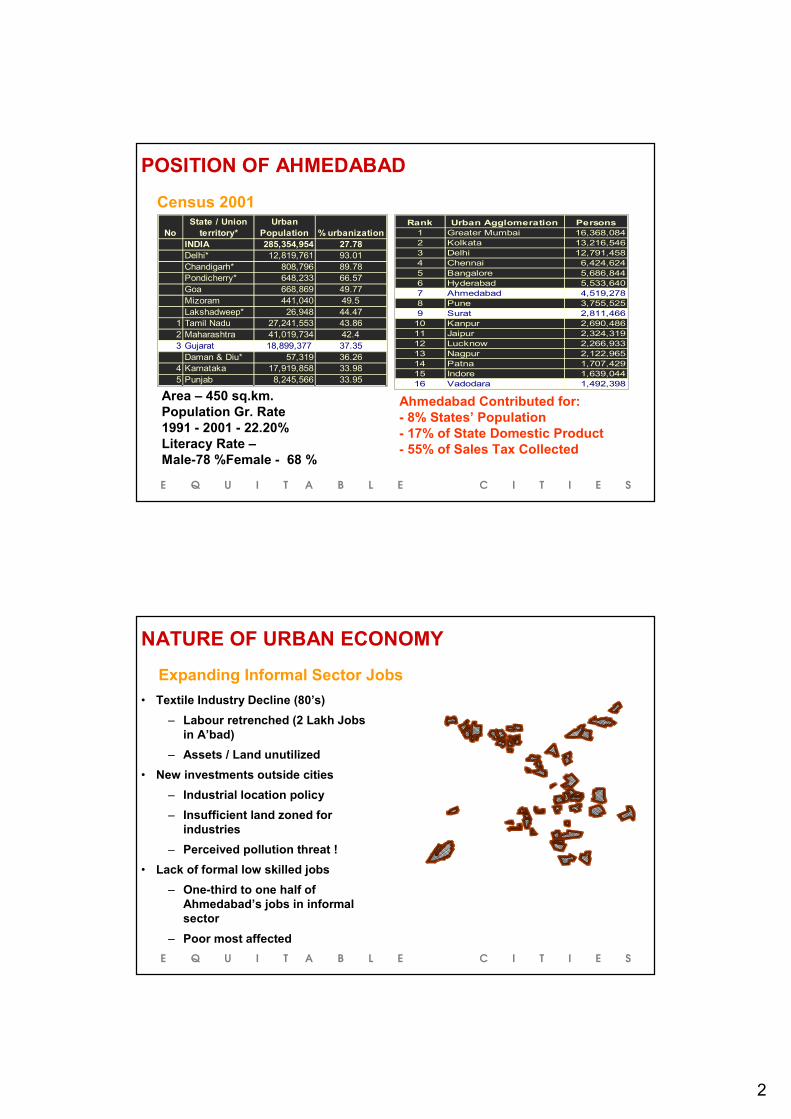
Census 2001Rank Urban Agglomeration Persons
1 Greater Mumbai 16,368,0842 Kolkata 13,216,5463 Delhi 12,791,4584 Chennai 6,424,6245 Bangalore 5,686,8446 Hyderabad 5,533,6407 Ahmedabad 4,519,2788 Pune 3,755,5259 Surat 2,811,466
10 Kanpur 2,690,48611 Jaipur 2,324,31912 Lucknow 2,266,93313 Nagpur 2,122,96514 Patna 1,707,42915 Indore 1,639,04416 Vadodara 1,492,398
NoState / Union
territory*Urban
Population % urbanizationINDIA 285,354,954 27.78Delhi* 12,819,761 93.01Chandigarh* 808,796 89.78Pondicherry* 648,233 66.57Goa 668,869 49.77Mizoram 441,040 49.5Lakshadweep* 26,948 44.47
1 Tamil Nadu 27,241,553 43.862 Maharashtra 41,019,734 42.43 Gujarat 18,899,377 37.35
Daman & Diu* 57,319 36.264 Karnataka 17,919,858 33.985 Punjab 8,245,566 33.95
Ahmedabad Contributed for:- 8% States’ Population - 17% of State Domestic Product- 55% of Sales Tax Collected
Area – 450 sq.km.Population Gr. Rate 1991 - 2001 - 22.20%Literacy Rate –Male-78 %Female - 68 %
POSITION OF AHMEDABAD
E Q U I T A B L E C I T I E S
NATURE OF URBAN ECONOMY
Expanding Informal Sector Jobs• Textile Industry Decline (80’s)
– Labour retrenched (2 Lakh Jobs in A’bad)
– Assets / Land unutilized• New investments outside cities
– Industrial location policy– Insufficient land zoned for
industries– Perceived pollution threat !
• Lack of formal low skilled jobs– One-third to one half of
Ahmedabad’s jobs in informal sector
– Poor most affected
3
E Q U I T A B L E C I T I E S
1 9 19
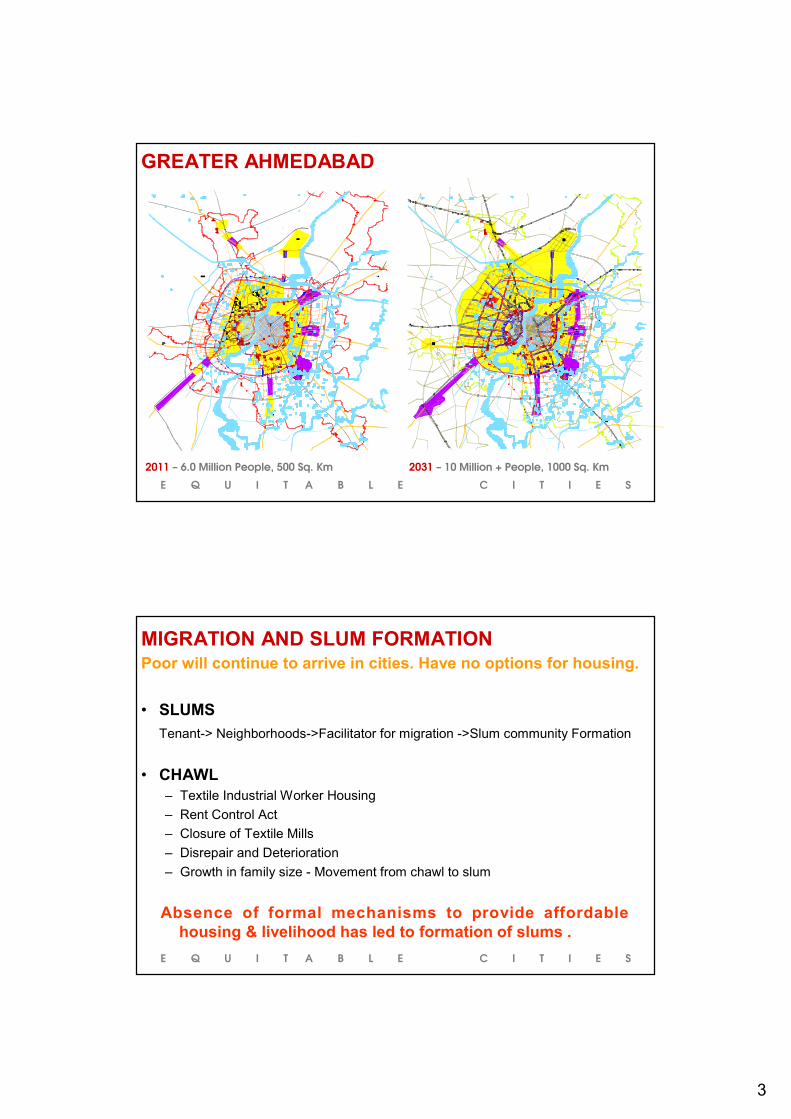
2011 – 6.0 Million People, 500 Sq. Km 2031 – 10 Million + People, 1000 Sq. Km
GREATER AHMEDABAD
E Q U I T A B L E C I T I E S
• SLUMS Tenant-> Neighborhoods->Facilitator for migration ->Slum community Formation
• CHAWL– Textile Industrial Worker Housing– Rent Control Act– Closure of Textile Mills– Disrepair and Deterioration– Growth in family size - Movement from chawl to slum
Absence of formal mechanisms to provide affordable housing & livelihood has led to formation of slums .
MIGRATION AND SLUM FORMATIONPoor will continue to arrive in cities. Have no options for housing.
4
E Q U I T A B L E C I T I E S
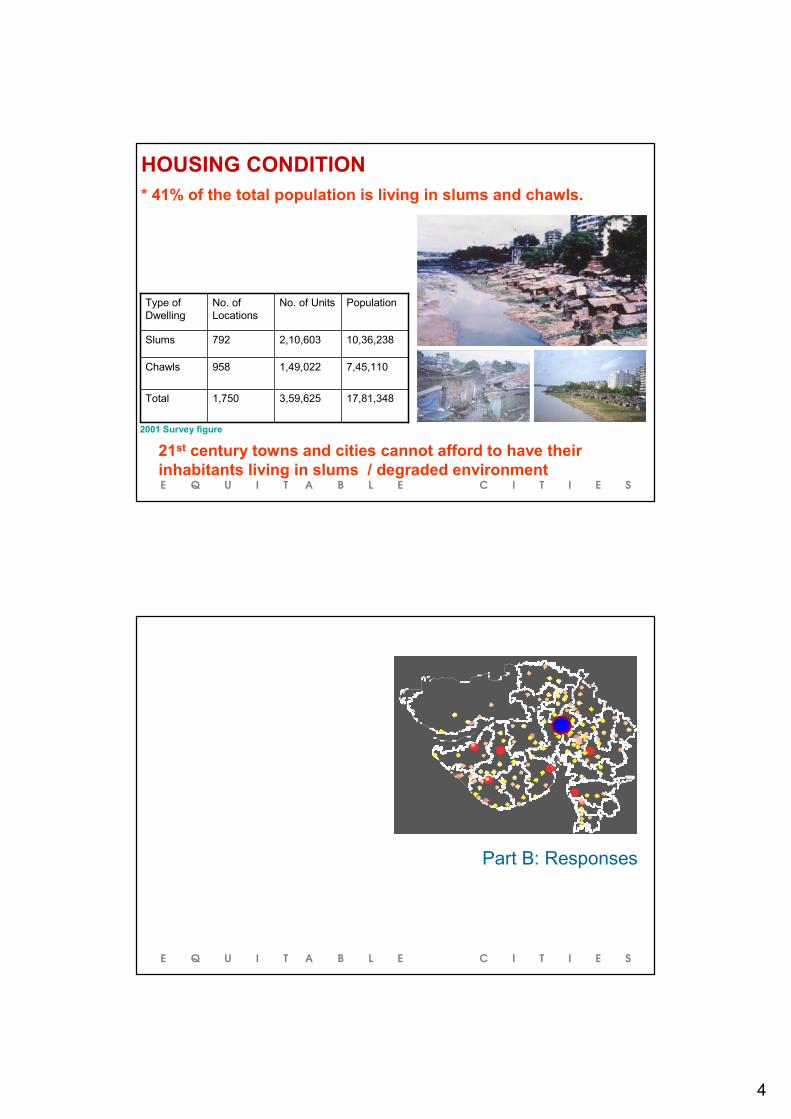
HOUSING CONDITION
21st century towns and cities cannot afford to have their inhabitants living in slums / degraded environment
17,81,3483,59,6251,750Total
7,45,1101,49,022958Chawls
10,36,2382,10,603792Slums
PopulationNo. of Units No. of Locations
Type of Dwelling
2001 Survey figure
* 41% of the total population is living in slums and chawls.
E Q U I T A B L E C I T I E S
Part B: Responses
5
E Q U I T A B L E C I T I E S
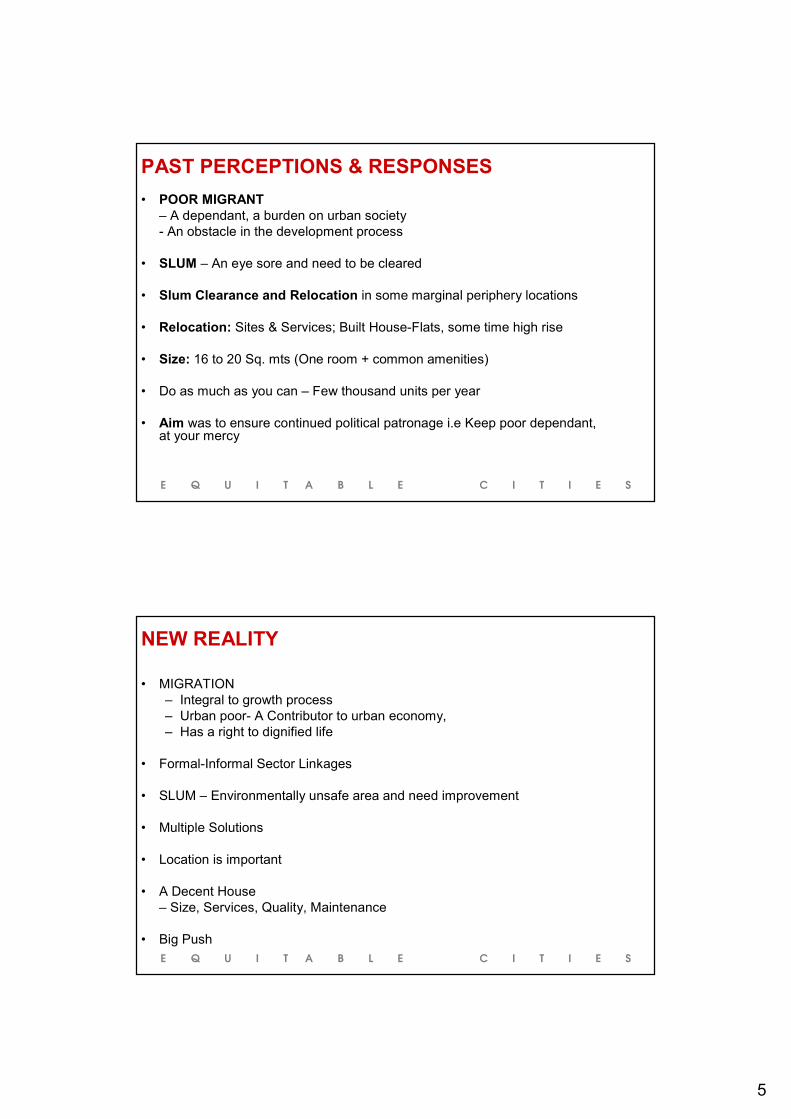
PAST PERCEPTIONS & RESPONSES• POOR MIGRANT
– A dependant, a burden on urban society- An obstacle in the development process
• SLUM – An eye sore and need to be cleared
• Slum Clearance and Relocation in some marginal periphery locations
• Relocation: Sites & Services; Built House-Flats, some time high rise
• Size: 16 to 20 Sq. mts (One room + common amenities)
• Do as much as you can – Few thousand units per year
• Aim was to ensure continued political patronage i.e Keep poor dependant, at your mercy
E Q U I T A B L E C I T I E S
• MIGRATION – Integral to growth process– Urban poor- A Contributor to urban economy,– Has a right to dignified life
• Formal-Informal Sector Linkages
• SLUM – Environmentally unsafe area and need improvement
• Multiple Solutions
• Location is important
• A Decent House – Size, Services, Quality, Maintenance
• Big Push
NEW REALITY
6
E Q U I T A B L E C I T I E S
Land Status:
• Public land In-situ development
• Public utility areas Relocation withinRoads, parks,etc., 3 kms radius
• Hazardous Location Relocation (<3 kms)(Riverfront, Lake..)
• Private Land Land sharing – PPP
Complimentary activities – Livelihood, Access..
APPROACH
E Q U I T A B L E C I T I E S
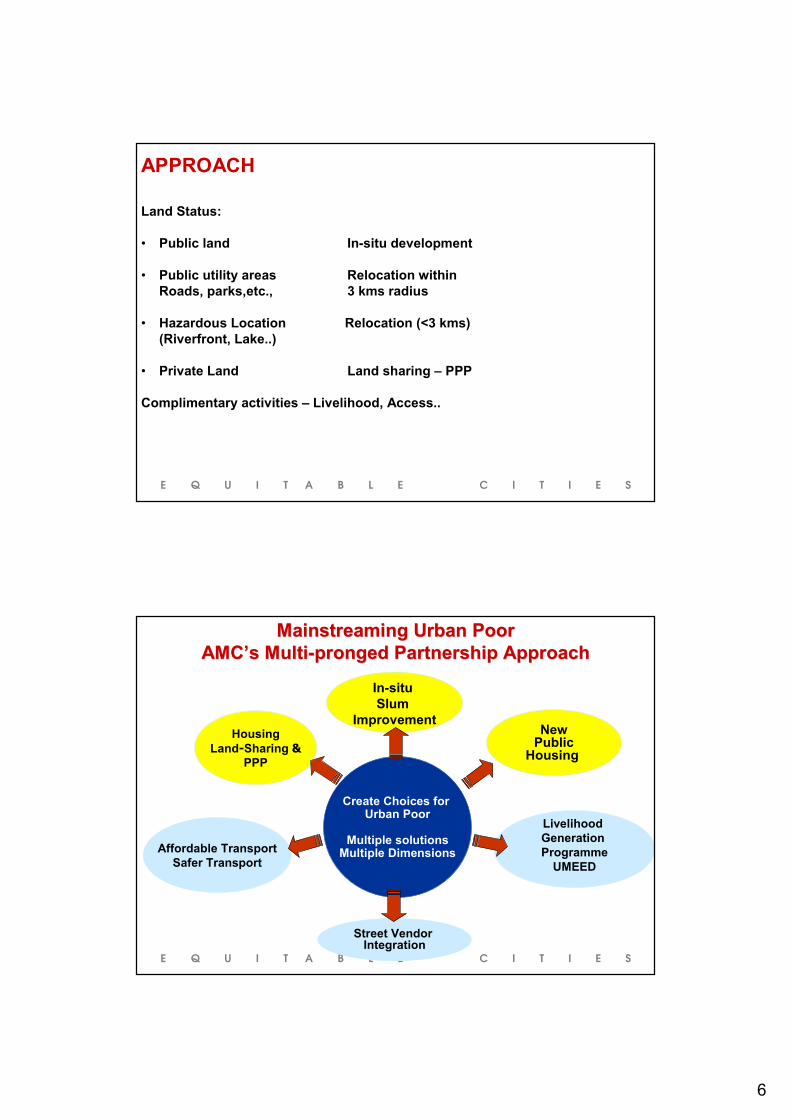
Mainstreaming Urban Poor Mainstreaming Urban Poor AMCAMC’’s Multis Multi--pronged Ppronged Partnershipartnership ApproachApproach
Create Choices for Urban Poor
Multiple solutionsMultiple Dimensions
In-situ Slum
ImprovementNew
PublicHousing
Livelihood Generation Programme
UMEED
Street Vendor Integration
Affordable TransportSafer Transport
HousingLand-Sharing &
PPP
7
E Q U I T A B L E C I T I E S
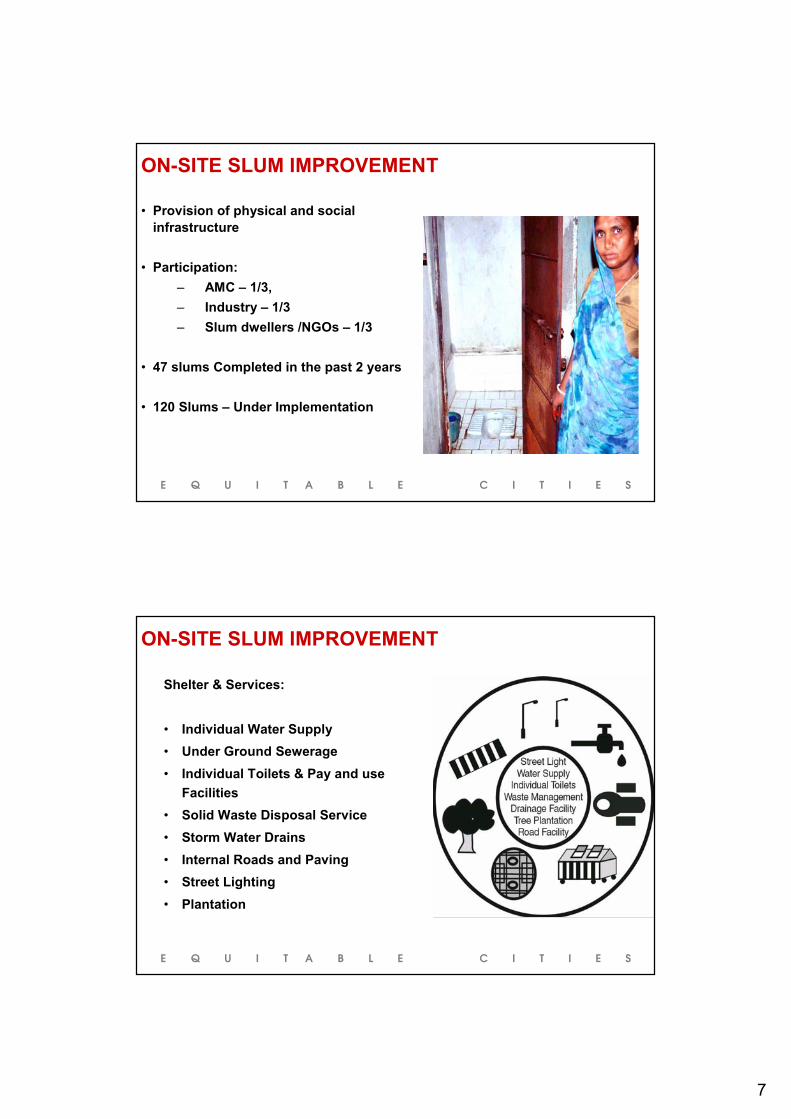
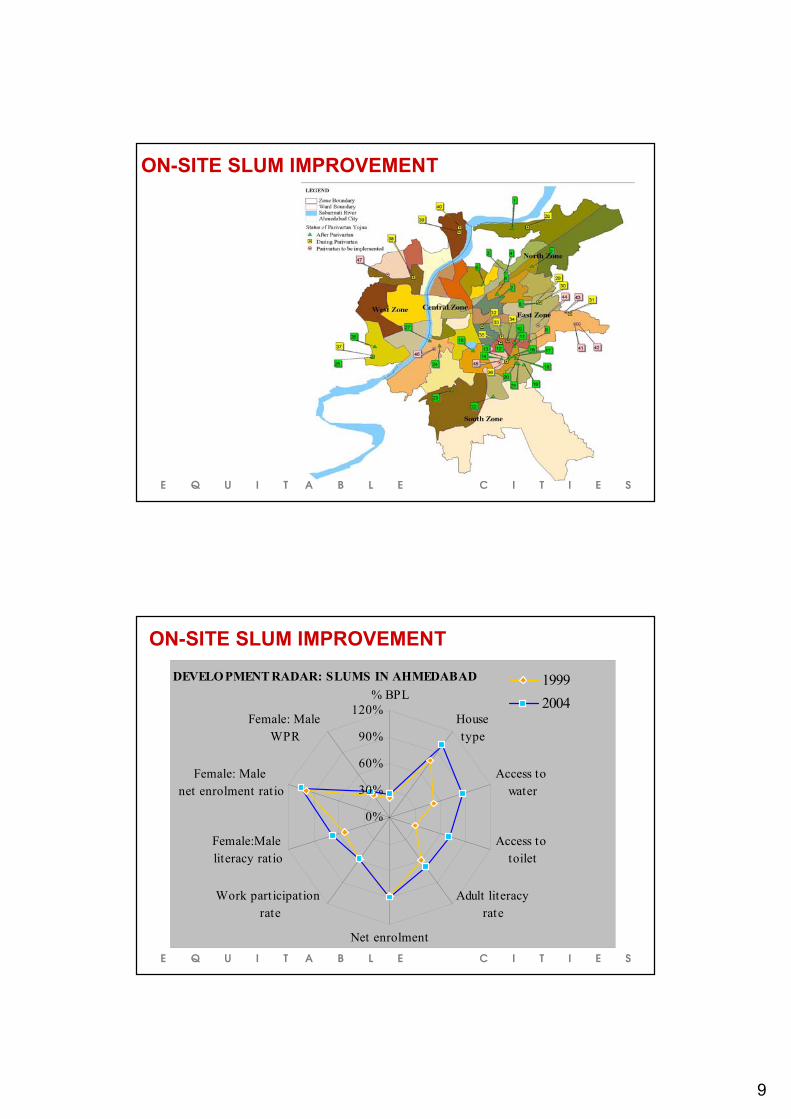
• Provision of physical and social infrastructure
• Participation:– AMC – 1/3, – Industry – 1/3– Slum dwellers /NGOs – 1/3
• 47 slums Completed in the past 2 years
• 120 Slums – Under Implementation
ON-SITE SLUM IMPROVEMENT
E Q U I T A B L E C I T I E S
Shelter & Services:
• Individual Water Supply• Under Ground Sewerage• Individual Toilets & Pay and use
Facilities• Solid Waste Disposal Service• Storm Water Drains• Internal Roads and Paving• Street Lighting• Plantation
ON-SITE SLUM IMPROVEMENT
8
E Q U I T A B L E C I T I E S
Social & Economic Development:
• Neighborhood, Women and Youth groups
• Mobilizing Micro Finance • Education - Children and Illiterate
adults• Mother and Child care• Income Generating Activities –
UMMEED
ON-SITE SLUM IMPROVEMENT
E Q U I T A B L E C I T I E S
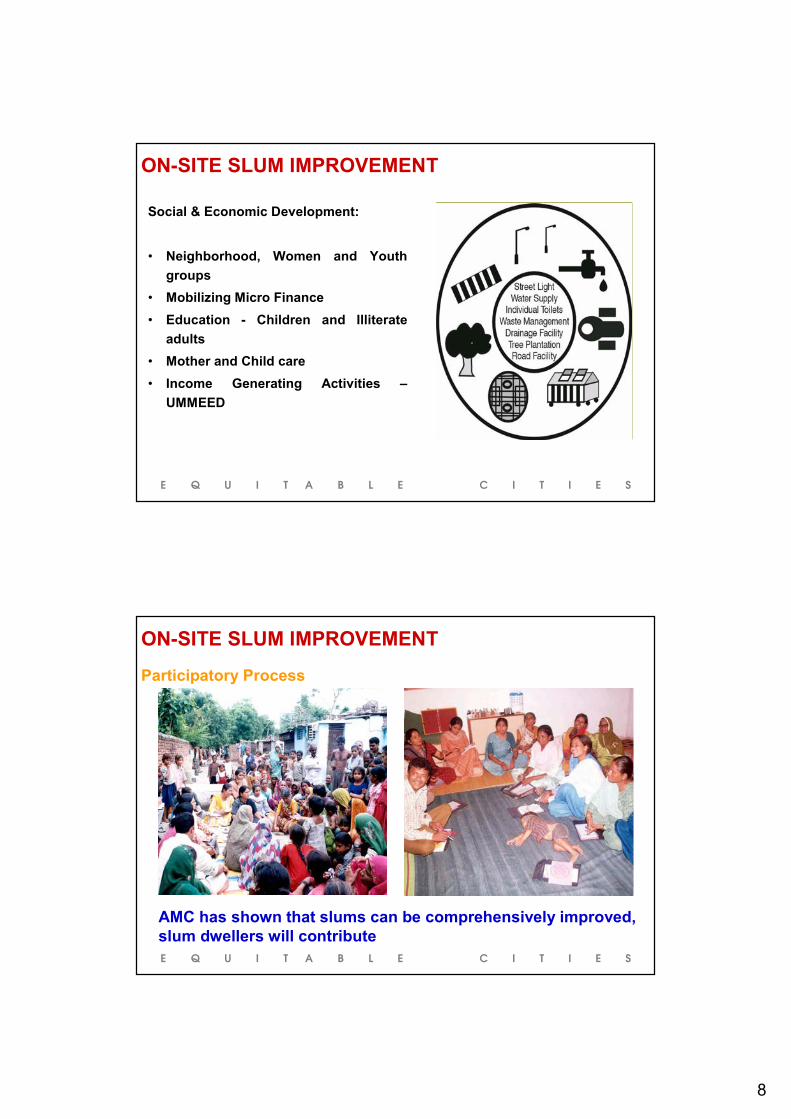
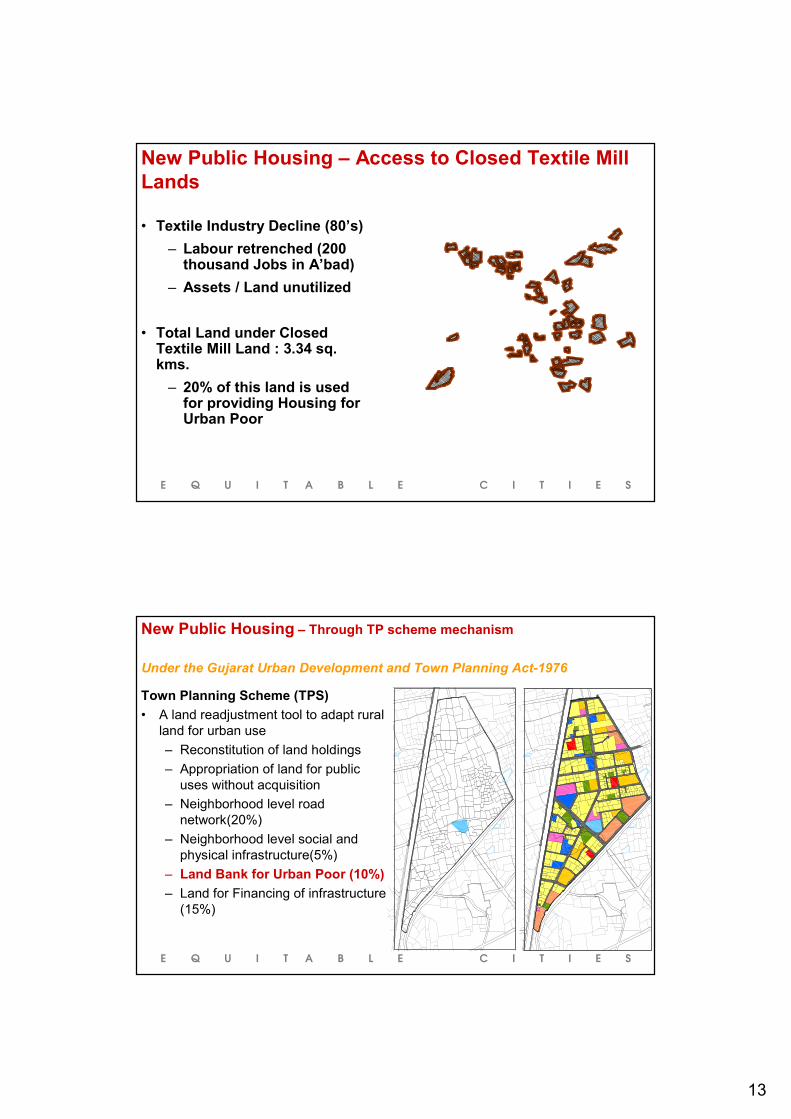
Participatory Process
AMC has shown that slums can be comprehensively improved, slum dwellers will contribute
ON-SITE SLUM IMPROVEMENT
9
E Q U I T A B L E C I T I E S
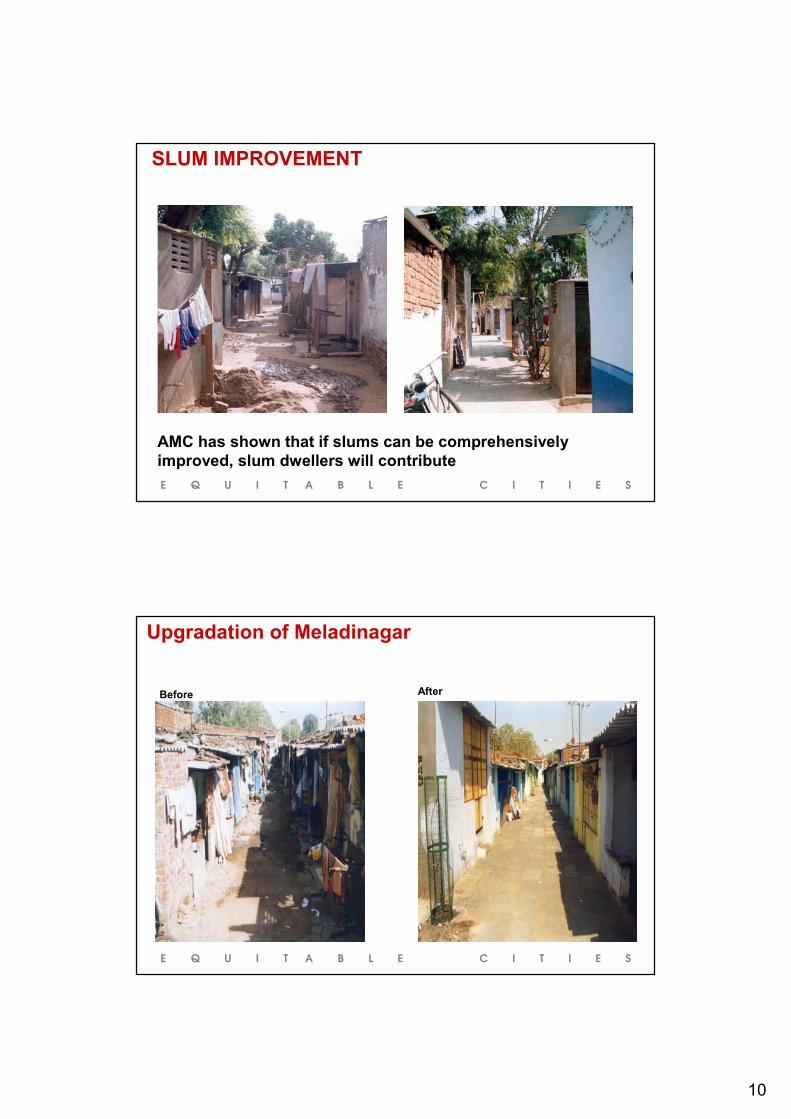
ON-SITE SLUM IMPROVEMENT
E Q U I T A B L E C I T I E S
DEVELOPMENT RADAR: SLUMS IN AHMEDABAD
0%
30%
60%
90%
120%% BPL
Housetype
Access to water
Access to toilet
Adult literacy rate
Net enrolment
Work part icipation rate
Female:Male literacy ratio
Female: Male net enrolment ratio
Female: Male WPR
19992004
ON-SITE SLUM IMPROVEMENT
10
E Q U I T A B L E C I T I E S
AMC has shown that if slums can be comprehensively improved, slum dwellers will contribute
SLUM IMPROVEMENT
E Q U I T A B L E C I T I E S
AfterBefore
Upgradation of Meladinagar

11
E Q U I T A B L E C I T I E S
Upgradation of Madrasi ni Chaali
AfterBefore
E Q U I T A B L E C I T I E S
Upgradation of Patan Nagaar
AfterBefore

12
E Q U I T A B L E C I T I E S
Upgradation of Barot Vaas
AfterBefore
E Q U I T A B L E C I T I E S
S IT E OF
P URCHA NGIS
KH AN PURS HE KH PURVI LLA GE SIT E OF
VI LL AGE
S ITE O FV ILLA GE
U SM ANPU R A
V I LLA G E S IT E O F
G .H .B.
OFNEW WADAJ
VILLAG E SITE
OLD W AD AJ
VIL LAG E SITEO F
G .H .B.
RAMNAGARSITE FOR
VIL LAGE
E LECTR ICITY CO.
HO USEPO WER
AHME DAB AD
AERO DRAME
VIL L AGES ITE O F
H AN SOL
NE WV IL LA GE
S IT E OFK OTA RP UR
VI LLA G ESI TEOF
M U THIA
VILLAGETANK
VI LLAGES ITE
OF
NA RODA
V ILL AG ES IT E OF
VIL LAGESIT E OF
MA TA -T A LA V
V IL LA GE SI T EOF
A SA RWA
T HE VI JA Y MI LL S LTD.REV . V I LLA GE OF A SA RWA
THE A SHOK MI LLS LTD.
T HE ARUN MI LLS LTD.
A RVI ND MI LLS LTD.REV . V I LLA GE OFA S ARWA
THE NEW S WA DESH A 'BAD LTD.
TH E N UTANMI LLS LTD.
MU NI. PLO T
NA RODA G.I .D .C .
O L D V I L LA G E
S I T E OFMO T E RA
NARODA G.I .D .C .
GA M TA LAV
WEST ZONECENTRAL
NORTH ZONE
EAST ZONE
SOUTH ZONE
ZONE
Choice of Location : 29 sites for Urban Poor Housing
NEW PUBLIC HOUSING - A WINDOW FOR THE UPWARDLY MOBILE
2005 to 2006: 8,000 units completed & alloted
2006 – 2007: 10,000 construction under completion
2007 – 2008: 20,000 under Progress
2008-2009: 12,000 under plan
13
E Q U I T A B L E C I T I E S
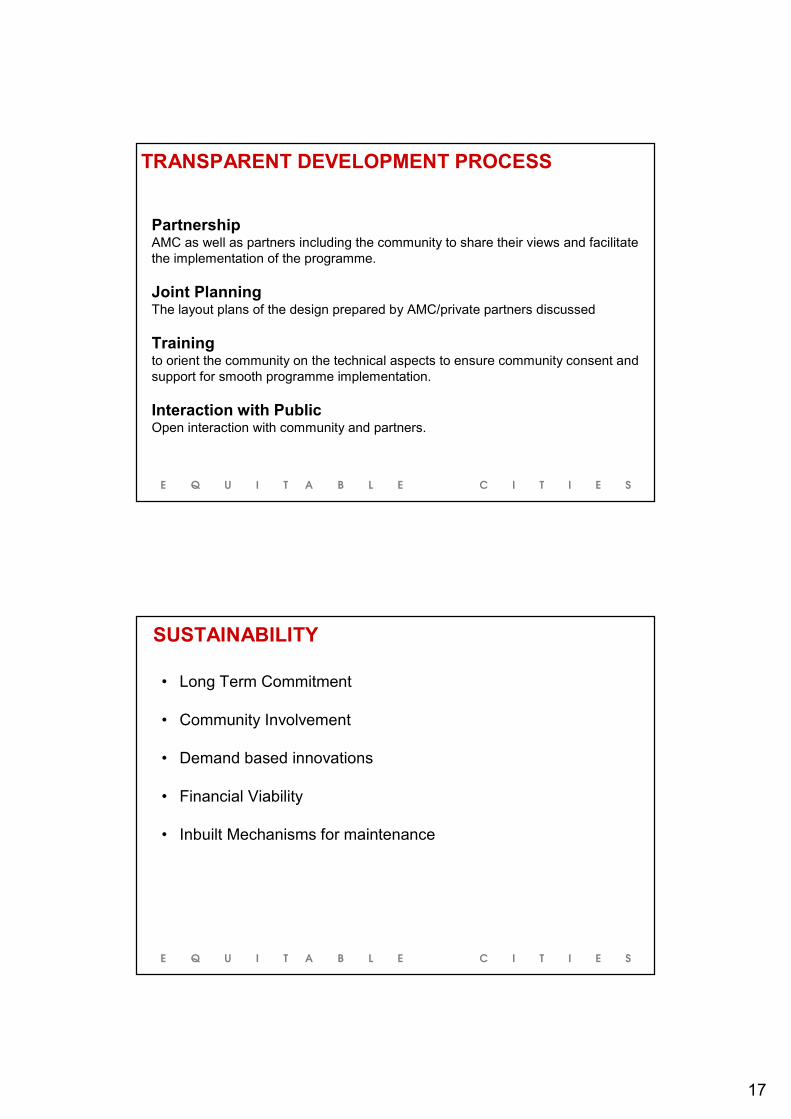
• Textile Industry Decline (80’s)– Labour retrenched (200
thousand Jobs in A’bad)– Assets / Land unutilized
• Total Land under Closed Textile Mill Land : 3.34 sq. kms.
– 20% of this land is used for providing Housing for Urban Poor
New Public Housing – Access to Closed Textile Mill Lands
E Q U I T A B L E C I T I E S
Under the Gujarat Urban Development and Town Planning Act-1976
Town Planning Scheme (TPS)• A land readjustment tool to adapt rural
land for urban use– Reconstitution of land holdings– Appropriation of land for public
uses without acquisition– Neighborhood level road
network(20%)– Neighborhood level social and
physical infrastructure(5%)– Land Bank for Urban Poor (10%)– Land for Financing of infrastructure
(15%)
New Public Housing – Through TP scheme mechanism

14
E Q U I T A B L E C I T I E S
BUILT-UP AREA = 36.5 SQM
CARPET AREA = 26.77 SQM
NET COST OF ONE DU = RS 1,53,802
GROSS COST OF ONE DU = RS. 1,78,578
NET COST PER SQM = RS 4214.00
GROSS COST PER SQM. = RS. 4893.00
CONTRIBUTION:
GOI (50%) = RS. 89,289.00
GOG (20%) = RS. 35,716.00
BENEFICIARY/ULB (30%) = RS. 53,573.00
DRAWING RM.3.00 x 3.00
BED RM.3.00 x 3.00
OTT
A
D1
D2
D2W
V
VW1
W1
D
D
1.58
2
1
0.4 2
3
W.C.0.90 x0.90 BATH
0.90x 1.50
KITCHEN 2.10 X 1.90
.91x.90
DETAIL OF TYPICAL DWELLING UNIT
NEW PUBLIC HOUSING
1 GBP = 80 INR (approx.)
E Q U I T A B L E C I T I E S
AMENITIES AND INFRASTRUCTURE FACILITIES
The following infrastructure is provided :(1) Roads (2) Water Supply(3) Sewerage (4) Storm Water Disposal(5) Solid Waste Collection and Disposal(6) Paved Surface within Compound Area to make houses free from dust & Street Lights & Garden
Land Use
Housing40%
Roads25%
Parking15%
Common Plot10%
Community Facilities
10%
Amenities to be provided :
• Common Plot (Open Space)
• Parking
• School
• Health Care Centre
• Garden
For plots with more than 500 DUs
NEW PUBLIC HOUSING

15
E Q U I T A B L E C I T I E S
INNOVATIVE TECHNOLOGY FOR BUILDING CONSTRUCTION
Advantages :• Monolithic Construction- good finish• No need to plaster walls.• High speed of construction
–2 days per floor• Geometrical Accuracy• Leak-proof joint less construction• Multi Hazard Resistant
AMC/AUDA has adopted a new type of housing construction technology using Aluminum alloy shuttering/ MESCON Technology
NEW PUBLIC HOUSING
E Q U I T A B L E C I T I E S
• Land Ownership AMC-40% PVT-60%
• 50% area to be used for housing slum dwellers
• 50% for Commercial/other development
• Profit if any to be shared in proportion of land- AMC & Developer
Land Sharing through Private-Public Participation -Slums on Private Land

16
E Q U I T A B L E C I T I E S
Part C: Sustainability
E Q U I T A B L E C I T I E S
– Identification of beneficiaries
– Socio-economic groups
– Financial
– Legal
– Private Land
– Prevent leakages
– Ensure proximity to the respective work places
– Services Management Framework
– Scaling Up
CHALLENGES FACED
17
E Q U I T A B L E C I T I E S
PartnershipAMC as well as partners including the community to share their views and facilitate the implementation of the programme.
Joint PlanningThe layout plans of the design prepared by AMC/private partners discussed
Trainingto orient the community on the technical aspects to ensure community consent and support for smooth programme implementation.
Interaction with PublicOpen interaction with community and partners.
TRANSPARENT DEVELOPMENT PROCESS
E Q U I T A B L E C I T I E S
• Long Term Commitment
• Community Involvement
• Demand based innovations
• Financial Viability
• Inbuilt Mechanisms for maintenance
SUSTAINABILITY
18
E Q U I T A B L E C I T I E S
• The Slum Improvement Partnership concept is fully replicable. Several other communities are now eager to join the project and transform their quality of life.
• Within next five years the physical improvement and the community development will be provided to 24,368 households benefiting 1,21,840 people in 120 slums of the Ahmedabad City.
• The Vadodara Municipal Corporation (VMC), another major city in the state of Gujarat has adopted the same concept for slum development and is upgrading the slum of Sonianagar on a pilot basis with increased community contribution from Rs. 2,100 per household to Rs. 3,100.
TRANSFERABILITY
E Q U I T A B L E C I T I E S
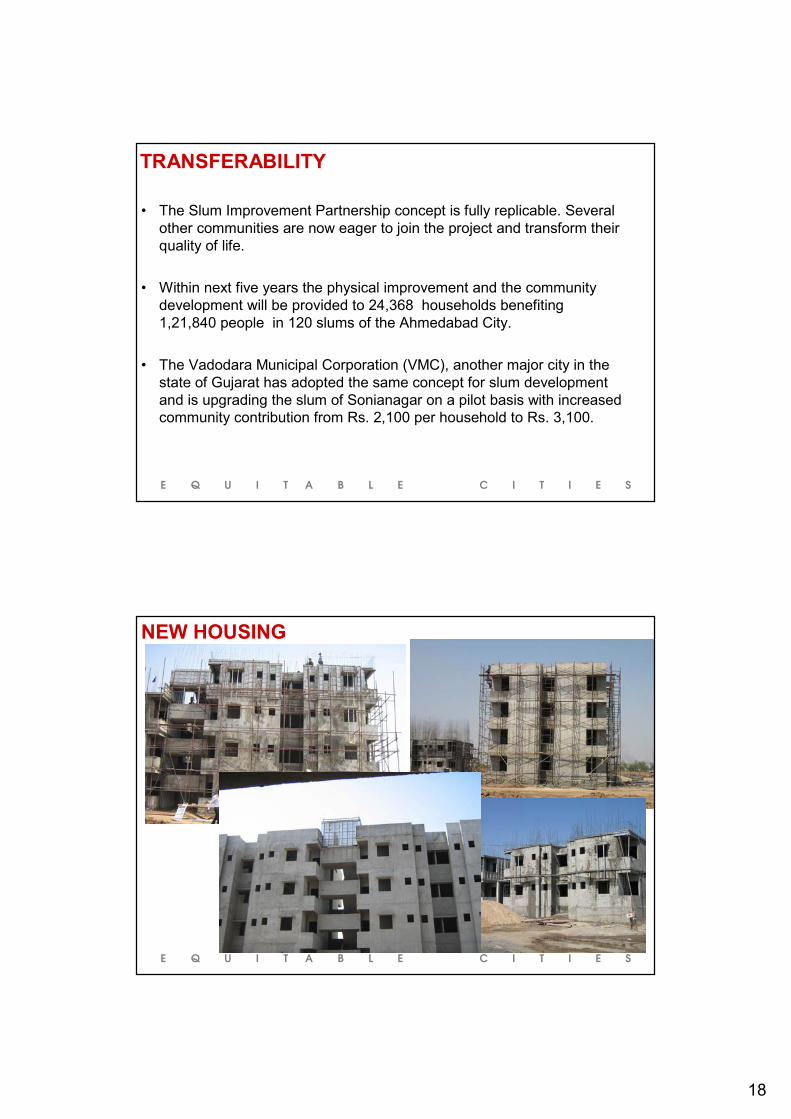
NEW HOUSING
19
E Q U I T A B L E C I T I E S
Thank you..Mr. I.P. Gautam
Municipal Commissioner, Ahmedabad