part 1 as level - cambridge university...
TRANSCRIPT

Part 1AS Level
© Cambridge University Press www.cambridge.org
Cambridge University Press978-0-521-70306-2 - As Level and a Level: BiologyMary Jones, Richard Fosbery, Dennis Taylor, and Jennifer GregoryExcerptMore information

Cell structure
1 describe and interpret drawings and photographs of typical animal and plant cellsas seen using the light microscope and make microscopical measurements;
2 explain the meanings of, and distinguish between, the terms resolution andmagnification and calculate the linear magnification of drawings;
3 describe and interpret drawings and photographs of typical animal and plant cellsas seen using the electron microscope, recognising rough and smoothendoplasmic reticulum (ER), Golgi apparatus, mitochondria, ribosomes,lysosomes, chloroplasts, plasma (cell surface) membrane, centrioles, cilia and thenucleus, including the nuclear envelope and nucleolus;
4 outline the functions of the structures listed in 3;
5 describe the structure of a prokaryotic cell, and compare and contrast thestructure of prokaryotic cells with eukaryotic cells;
6 explain how cells are organised into tissues and organs, with reference to atransverse section of a dicotyledonous leaf.
By the end of this chapter you should be able to:
I n the early days of microscopy an English scientist, Robert Hooke, decided to examinethin slices of plant material and chose cork as
one of his examples. On looking down the micro-scope he was struck by the regular appearance ofthe structure and in 1665 he wrote a book containing the diagram shown in figure 1.1.
If you examine the diagram you will see the‘pore-like’ regular structures that he called ‘cells’.Each cell appeared to be an empty box surroundedby a wall. Hooke had discovered and described,without realising it, the fundamental unit of allliving things.
Although we now know that the cells of cork aredead, further observations of cells in living materi-als were made by Hooke and other scientists.However, it was not until almost 200 years later thata general cell theory emerged from the work of twoGerman scientists. In 1838 Schleiden, a botanist,suggested that all plants are made of cells, and ayear later Schwann, a zoologist, suggested the same
for animals. The cell theory states that the basicunit of structure and function of all living
CHAPTER 1
● Figure 1.1 Drawing of cork cells published byRobert Hooke in 1665.
© Cambridge University Press www.cambridge.org
Cambridge University Press978-0-521-70306-2 - As Level and a Level: BiologyMary Jones, Richard Fosbery, Dennis Taylor, and Jennifer GregoryExcerptMore information

organisms is the cell. Now, over 150years later, this idea is one of the mostfamiliar and important theories in biology. To it has been added Virchow’stheory of 1855 that all cells arise frompre-existing cells by cell division.
Why cells?A cell can be thought of as a bag inwhich the chemistry of life is allowedto occur, partially separated from theenvironment outside the cell. The thinmembrane which surrounds all cells isessential in controlling exchangebetween the cell and its environment.It is a very effective barrier, but alsoallows a controlled traffic of materialsacross it in both directions. The membrane istherefore described as partially permeable. If itwere freely permeable, life could not existbecause the chemicals of the cell would simplymix with the surrounding chemicals by diffusion.
Cell biology and microscopyThe study of cells has given rise to an importantbranch of biology known as cell biology. Cells cannow be studied by many different methods, butscientists began simply by looking at them, usingvarious types of microscope.
There are two fundamentally different types ofmicroscope now in use: the light microscope andthe electron microscope. Both use a form of radia-tion in order to create an image of the specimenbeing examined. The light microscope uses lightas a source of radiation, while the electron microscope uses electrons, for reasons which are discussed later.
Light microscopyThe ‘golden age’ of light microscopy could be saidto be the nineteenth century. Microscopes hadbeen available since the beginning of the seven-teenth century but, when dramatic improvementswere made in the quality of glass lenses in theearly nineteenth century, interest among scientistsbecame widespread. The fascination of the micro-
scopic world that opened up in biology inspiredrapid progress both in microscope design and,equally importantly, in preparing material forexamination with microscopes. This branch ofbiology is known as cytology. By 1900, all thestructures shown in figures 1.2, 1.3 and 1.4, exceptlysosomes, had been discovered.
Figure 1.2 shows the structure of a generalisedanimal cell and figure 1.4 the structure of a gener-alised plant cell as seen with a light microscope.(A generalised cell shows all the structures that
Cell structure 3
● Figure 1.3 Cells from the lining of the human cheek(× 300), showing typical animal cell characteristics: acentrally placed nucleus and many organelles suchas mitochondria. The cells are part of a tissue knownas squamous (flattened) epithelium.
● Figure 1.2 Structure of a generalised animal cell(diameter about 20 µm) as seen with a very highquality light microscope.
© Cambridge University Press www.cambridge.org
Cambridge University Press978-0-521-70306-2 - As Level and a Level: BiologyMary Jones, Richard Fosbery, Dennis Taylor, and Jennifer GregoryExcerptMore information
are typically found in a cell.) Figure 1.3 shows someactual human cells.
SAQ 1.1 Using figures 1.2 and 1.4, name the structures thatanimal and plant cells have in common and thosewhich are special only to animal or plant cells.
Animal and plant cells have features in commonIn animals and plants each cell is surrounded by avery thin, plasma (cell surface) membrane whichis too thin to be seen with a light microscope.Many of the cell contents are colourless and trans-parent so they need to be stained to be seen. Eachcell has a nucleus which is a relatively large struc-ture that stains intensely and is therefore veryconspicuous. The deeply staining material in thenucleus is called chromatin and is a mass ofloosely coiled threads. This material collectstogether to form visible separate chromosomesduring nuclear division (see page 82). It containsDNA (deoxyribonucleic acid), a molecule whichcontains the instructions that control the
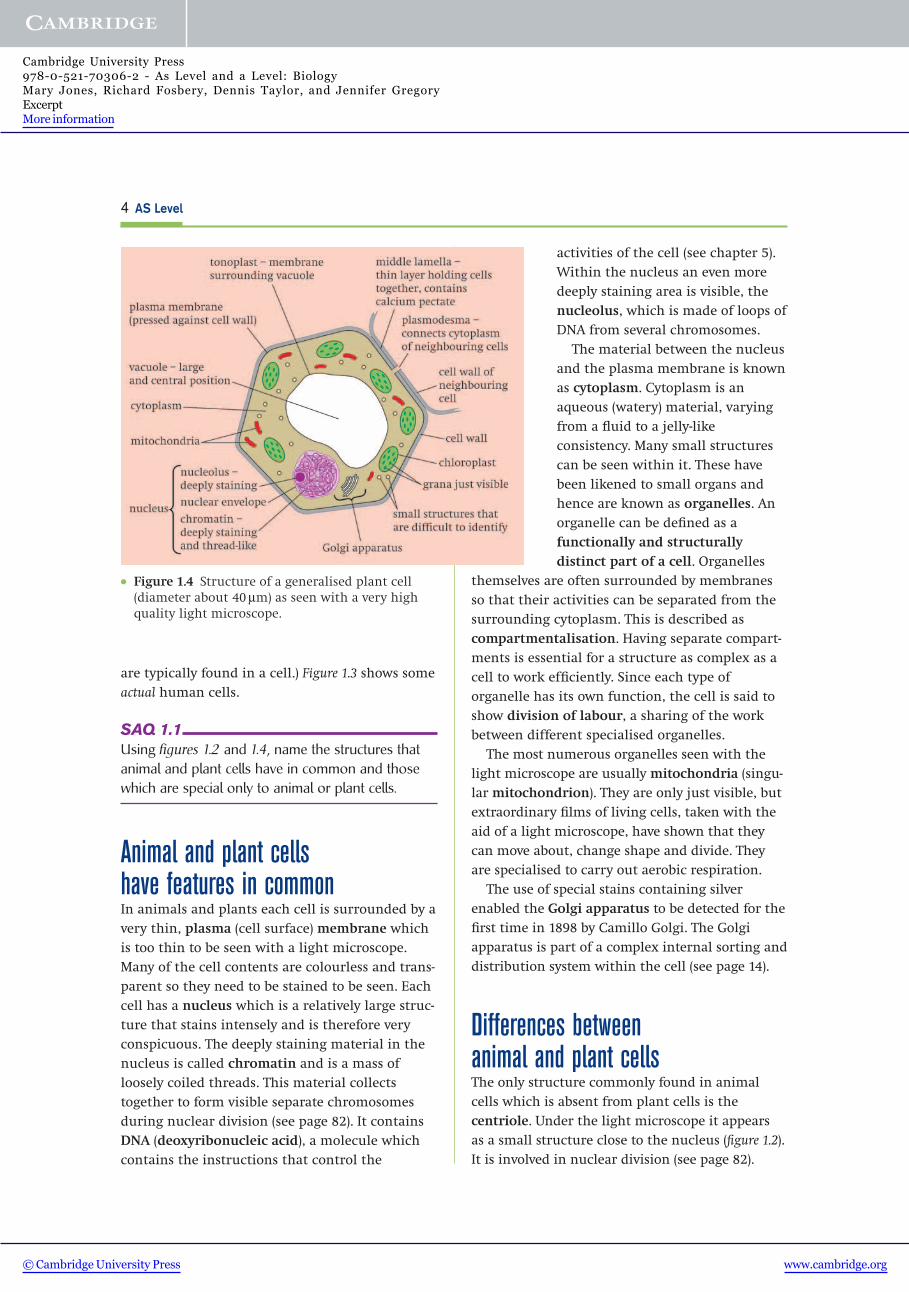
activities of the cell (see chapter 5).Within the nucleus an even moredeeply staining area is visible, thenucleolus, which is made of loops ofDNA from several chromosomes.
The material between the nucleusand the plasma membrane is knownas cytoplasm. Cytoplasm is an aqueous (watery) material, varyingfrom a fluid to a jelly-like consistency. Many small structurescan be seen within it. These havebeen likened to small organs andhence are known as organelles. Anorganelle can be defined as a functionally and structurally distinct part of a cell. Organelles
themselves are often surrounded by membranesso that their activities can be separated from thesurrounding cytoplasm. This is described as compartmentalisation. Having separate compart-ments is essential for a structure as complex as acell to work efficiently. Since each type oforganelle has its own function, the cell is said toshow division of labour, a sharing of the workbetween different specialised organelles.
The most numerous organelles seen with thelight microscope are usually mitochondria (singu-lar mitochondrion). They are only just visible, butextraordinary films of living cells, taken with theaid of a light microscope, have shown that theycan move about, change shape and divide. Theyare specialised to carry out aerobic respiration.
The use of special stains containing silverenabled the Golgi apparatus to be detected for thefirst time in 1898 by Camillo Golgi. The Golgi apparatus is part of a complex internal sorting and distribution system within the cell (see page 14).
Differences between animal and plant cellsThe only structure commonly found in animalcells which is absent from plant cells is the centriole. Under the light microscope it appears as a small structure close to the nucleus (figure 1.2).It is involved in nuclear division (see page 82).
4 AS Level
● Figure 1.4 Structure of a generalised plant cell(diameter about 40 µm) as seen with a very highquality light microscope.
© Cambridge University Press www.cambridge.org
Cambridge University Press978-0-521-70306-2 - As Level and a Level: BiologyMary Jones, Richard Fosbery, Dennis Taylor, and Jennifer GregoryExcerptMore information

Individual plant cells are more easily seen witha light microscope than animal cells are becausethey are usually larger and surrounded by a relatively rigid cell wall outside the plasma mem-brane. The cell wall gives the cell a definite shape.It prevents the cell from bursting when waterenters by osmosis, allowing large pressures todevelop inside the cell (see page 56). Cell wallsmay also be reinforced for extra strength. Plantcells are linked to neighbouring cells by means offine strands of cytoplasm called plasmodesmata(singular plasmodesma) which pass through pore-like structures in the walls of these neighbouringcells. Movement through the pores is thought tobe controlled by their structure.
Apart from a cell wall, mature plant cells differfrom animal cells in often possessing a large central vacuole and, if the cell carries out photo-synthesis, in containing chloroplasts. The vacuoleis surrounded by a membrane, the tonoplast,which controls exchange between the vacuole andthe cytoplasm. The fluid in the vacuole is a solution of mineral salts, sugars, oxygen, carbondioxide, pigments, enzymes and other organiccompounds, including some waste products.Vacuoles help to regulate the osmotic propertiesof cells (the flow of water inwards and outwards)as well as having a wide range of other functions.For example, the pigments which colour thepetals of certain flowers and parts of some vegetables, such as the red pigment of beetroots,are sometimes located in vacuoles.
Chloroplasts are relatively large organelleswhich are green in colour due to the presence ofchlorophyll. At high magnifications small ‘grains’,or grana, can be seen in them. During the processof photosynthesis light is absorbed by these grana,which actually consist of stacks of membranes.Starch grains may also be visible within
chloroplasts. Chloroplasts are found in the greenparts of the plant, mainly in the leaves.
Points to note■ You can think of a plant cell as being very simi-
lar to an animal cell but with extra structures.■ Plant cells are often larger than animal cells,
although cell size varies enormously.■ Do not confuse the cell wall with the plasma
membrane. Cell walls are relatively thick andphysically strong, whereas plasma membranesare very thin. All cells have a plasma membrane.
■ Vacuoles are not confined to plant cells; animalcells may have small vacuoles, such as phagocytic vacuoles (see page 59), althoughthese are often not permanent structures.
We return to the differences between animal andplant cells as seen using the electron microscopeon page 15.
Units of measurement in cell studiesIn order to measure objects in the microscopicworld, we need to use very small units of measure-ment which are unfamiliar to most people.According to international agreement, theInternational System of Units (SI units) should beused. In this system the basic unit of length is themetre, symbol m. Additional units can be createdin multiples of a thousand times larger orsmaller, using standard prefixes. For example, theprefix kilo means 1000 times. Thus 1 kilometre =1000 metres. The units of length relevant to cellstudies are shown in table 1.1.
It is difficult to imagine how small these unitsare, but, when looking down a microscope andseeing cells clearly, we should not forget howamazingly small the cells actually are. Figure 1.5shows the sizes of some structures. The smallest
Cell structure 5
µ is the Greek letter mu1 micrometre is a thousandth of a millimetre1 nanometre is a thousandth of a micrometre
● Table 1.1 Units of measurement relevant to cell studies.
Fraction of a metre Unit Symbol
one thousandth = 0.001 = 1/1000 = 10–3 millimetre mmone millionth = 0.000 001 = 1/1000 000 = 10–6 micrometre µmone thousand millionth = 0.000 000 001 = 1/1000 000 000 = 10–9 nanometre nm
© Cambridge University Press www.cambridge.org
Cambridge University Press978-0-521-70306-2 - As Level and a Level: BiologyMary Jones, Richard Fosbery, Dennis Taylor, and Jennifer GregoryExcerptMore information

6 AS Level
● Figure 1.5 Sizes of some biological structures.
© Cambridge University Press www.cambridge.org
Cambridge University Press978-0-521-70306-2 - As Level and a Level: BiologyMary Jones, Richard Fosbery, Dennis Taylor, and Jennifer GregoryExcerptMore information

structure visible with only the human eye is about50–100 µm in diameter. Your body contains about60 million million cells, varying in size from about5 µm to 40 µm. Try to imagine structures like mitochondria, which have an average diameter of1 µm, or bacteria with an average diameter of0.5 µm. The smallest cell organelles we deal within this book, ribosomes, are only about 20 nm indiameter! When we consider processes such as diffusion (chapter 4), it is also helpful to have anappreciation of the distances involved.
Measuring cells Cells and organelles can be measured with amicroscope by means of an eye-piece graticule(see figure 1.6a). This is a transparent scale, usuallywith 100 divisions, which is placed in the micro-scope eyepiece so that it can be seen at the sametime as the object to be measured (see figure 1.6b).
The human cheek epithelial cell (see figure 1.3)shown superimposed on the scale measures 20 units in diameter. We do not know the actualvalue of these units until the eyepiece graticulescale is calibrated.
Calibrating the eyepiece graticule scale is doneby placing a miniature transparent ruler called astage micrometer scale on the microscope stageand focussing on it. This scale may be etched ontoa glass slide or printed on a transparent film. Itcommonly has subdivisions of 0.1 and 0.01 mm.The images of the two scales can then be superim-posed as shown in figure 1.6c.
In the figure, 100 eyepiece graticule divisionsmeasure 0.25 mm. Hence, the value of each eyepiece graticule division is
0.25= 0.0025 mm
100
or 0.25 × 1000= 2.5 µm.
100
The diameter of the cell shown superimposed onthe scale in figure 1.6b measures 20 eyepiece graticule units and so its actual diameter is
20 × 2.5 µm = 50 µm.
This diameter is greater than that of many humancells because the cell is a flattened epithelial cell.
Cell structure 7
● Figure 1.6 Microscopical measurement. Threefields of view seen using a high power (× 40)objective lens. a An eyepiece graticule scale.b Superimposed images of human cheekepithelial cells and the eyepiece graticule scale.c Superimposed images of the eyepiece graticulescale and the stage micrometer scale.
a
b
c
© Cambridge University Press www.cambridge.org
Cambridge University Press978-0-521-70306-2 - As Level and a Level: BiologyMary Jones, Richard Fosbery, Dennis Taylor, and Jennifer GregoryExcerptMore information

Electron microscopes Earlier in this chapter it was stated thatby 1900 almost all the structures shownin figures 1.2 and 1.4 had been discovered.There followed a time of frustration formicroscopists because they realised thatno matter how much the design of lightmicroscopes improved, there was a limit to how much could ever be seenusing light.
In order to understand the problem, it is necessary to know something aboutthe nature of light itself and to under-stand the difference betweenmagnification and resolution.
Magnification and resolutionMagnification is the number of timeslarger an image is compared with thereal size of the object.
size of imagemagnification =
actual size of specimen
Figure 1.7 shows two photographs of sections through the same group of plantcells. The magnifications of the two photographs are the same. The reallength of the central plant cell was about150 µm. In the photographs, the lengthappears to be about 60 mm.
To calculate the magnification, it is easiest if we convert all the measure-ments to the same units, in this casemicrometres. 60 mm is 60 000 µm, therefore
magnification = 60 000
150
= × 400
SAQ 1.2a Calculate the magnification of the drawing of the
animal cell in figure 1.2.b Calculate the actual length of the chloroplast in
figure 1.23.
Although both photographs in figure 1.7 are shownat the same magnification, you can see that b, theelectron micrograph, is much clearer. (An electronmicrograph is a picture taken with an electronmicroscope.) This is because it has greater resolution. Resolution is defined as the ability todistinguish between two separate points. If thetwo points cannot be resolved, they will be seen asone point. The maximum resolution of a light
8 AS Level
● Figure 1.7 Photographs of the same plant cellsseen a with a light microscope, b with anelectron microscope, both shown at amagnification of about × 400.
a
b
© Cambridge University Press www.cambridge.org
Cambridge University Press978-0-521-70306-2 - As Level and a Level: BiologyMary Jones, Richard Fosbery, Dennis Taylor, and Jennifer GregoryExcerptMore information

Cell structure 9
microscope is 200 nm. This means that if two points or objects arecloser together than 200 nm they cannot be distinguished as separate.
It is possible to take a photograph such as figure 1.7a and to magnify (enlarge) it, but we see no more detail; in other words, we do not improve resolution, even though we often enlarge photographs because they are easier to see when larger. Thus anincrease in magnification is not necessarily accompanied by anincrease in resolution. With a microscope, magnification up to thelimit of resolution can reveal further detail, but any furthermagnification increases blurring as well as the size of the picture.
The electromagnetic spectrumHow is resolution linked with the nature of light? One of the prop-erties of light is that it travels in waves. The length of the waves ofvisible light varies, ranging from about 400 nm (violet light) toabout 700 nm (red light). The human eye can distinguish betweenthese different wavelengths, and in the brain the differences areconverted to colour differences. (Colour is an invention of thebrain!) Some animals can see wavelengths that humans cannot.Bees, for example, can see ultraviolet light. Flowers that to us donot appear to have markings often have ultraviolet markings thatguide bees to their nectaries (figure 1.8). If you happen to be sharinga dark room with a cobra, the cobra will be able to see you, eventhough you cannot see it, because warm bodies give off (radiate)infrared radiation which cobras can see.
The whole range of different wavelengths is called the electro-magnetic spectrum. Visible light is only one part of this spectrum.Figure 1.9 shows some of the parts of the electromagnetic spectrum.The longer the electromagnetic waves, the lower their frequency(all the waves travel at the same speed, so imagine them passing apost: shorter waves pass at higher frequency).
In theory, there is no limit to how short or how long the wavescan be. Wavelength changes with energy: the greater the energy,
● Figure 1.9 Diagram of the electromagnetic spectrum (the waves are not drawn to scale). The numbersindicate the wavelengths of the different types of electromagnetic radiation. Visible light is a form ofelectromagnetic radiation.
● Figure 1.8 The eye of a bee issensitive to ultraviolet light andcan see the guides which lead tothe nectaries at the centre ofthe flower. a In normal light,the nectar guides of thePotentilla flower cannot be seenby the human eye. b Inultraviolet, they appear as darkpatches.
a
b
© Cambridge University Press www.cambridge.org
Cambridge University Press978-0-521-70306-2 - As Level and a Level: BiologyMary Jones, Richard Fosbery, Dennis Taylor, and Jennifer GregoryExcerptMore information