parking and traffic impacts of park slope asp suspension · · 2008-12-30parking and traffic...
TRANSCRIPT
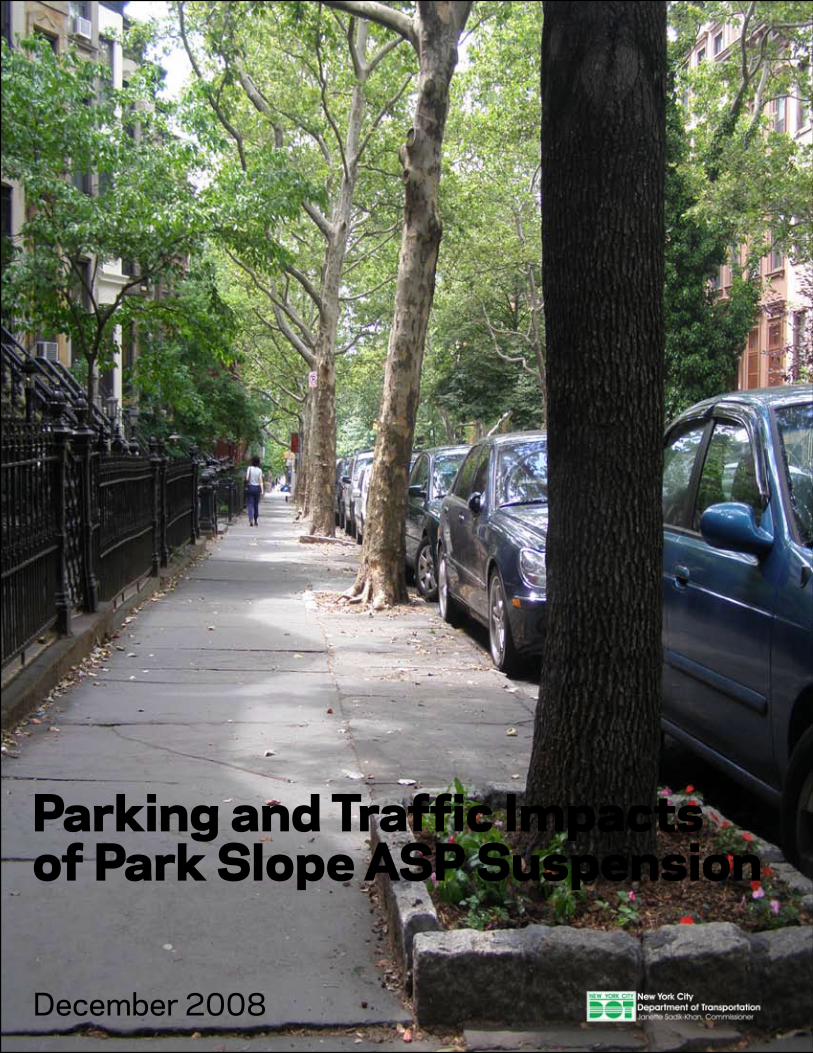
Parking and Traffic Impacts of Park Slope ASP Suspension
December 2008

Park SloPe aSP SuSPenSion evaluation i
Table of Contents
Executive Summary................................................................................................... 1
Methodology............................................................................................................... 3
Parking EvaluationParking Space Occupancy Rates............................................................... 5Parking Space Turnover............................................................................... 7Non-Residential Parkers.............................................................................. 9
Traffic Volume Analysis.............................................................................................. 11
Web Survey Findings.................................................................................................. 13Web Survey Results..................................................................................... 14
List of FiguresMap 1 - Study Area................................................................................................... 2Map 2 - Data Collection Locations............................................................................ 4Graph 1 - Tuesday Traffic Volumes............................................................................ 12Graph 2 - Wednesday Traffic Volumes...................................................................... 12Graph 3 - Thursday Traffic Volumes.......................................................................... 12
List of TablesTable 1 - General ASP Regulation Changes............................................................. 3Table 2 - Parking Space Occupancy Rates.............................................................. 6Table 3 - Summary of Turnover.................................................................................. 8Table 4 - Summary of Residential Parkers................................................................ 10
1 Park SloPe aSP SuSPenSion evaluation
Executive Summary
In May 2008, the New York City Department of Transportation (NYCDOT) suspended street cleaning/alternate side parking (ASP) regulations for the purpose of changing ASP regulation signs in Park Slope, Brooklyn (shown in Map 1). ASP regulations apply to most residential streets in the city to clear the curb for street sweepers. During the suspension, ASP regulations in Park Slope were generally reduced from 3 hour to 90 minute durations, and from twice a week to just once a week.
The suspension provided NYCDOT with an opportunity to compare parking and traffic conditions in a residential neighborhood with and without ASP regulations. To that end, three separate surveys were performed: an on-street license plate survey to capture changes in parking space occupancy and turnover; traffic counts to measure any changes in traffic volumes; and a web-based community survey.
Parking Space Occupancy & TurnoverOn-street parking availability did not change significantly during the ASP regulation •suspension (98% occupancy when ASP regulations were suspended, 98% when ASP was not suspended), indicating that on-street parking was saturated with or without ASP regulations.
There was no change in turnover rates of vehicles parked at the curb during afternoon, •and afternoon/overnight periods. (Longer-term turnover rates were not measured).
The percentage of observed vehicles registered in the local ZIP code increased from •37% to 49%, indicating that non-residents did not store vehicles in the neighborhood during the ASP suspension.
Traffic VolumesTraffic volumes were higher during the morning on days when ASP was in effect than •when ASP was not in effect. Traffic volumes were 19% higher between 8 AM and 9 AM on days ASP was in effect, as compared with days that ASP was not in effect (either during the suspension or on non-ASP days). There were no differences in afternoon or evening traffic volumes.
Web SurveyResidents were mixed on whether ASP suspension made it easier to find a parking •space on weekdays: 47% said it was easier on weekdays while 31% said ASP suspension made finding parking harder. (The remainder said ASP had no effect.) Results were similar for weekends.

Park SloPe aSP SuSPenSion evaluation 2
6A
V
5A
V
4A
V
7A
V
8A
V
3A
V
16 ST
3 ST
7 ST
6 ST
8 ST
9 ST
1 ST
2 ST
5 ST
11 ST
10 ST
12 ST
14 ST
13 ST
15 ST
4 ST
PARK PL
DEAN ST
BERGEN ST
UNION ST
STERLING PL
PROSPECT PL
CARROLL ST
ST MARK'S AV
PRESIDENT ST
WE
ST
DR
GARFIELD PLP
RO
SP
EC
TP
KW
WINDSOR PL
PACIFIC ST
EAST DR
ATLANTIC AV
BERKELEY PL
UN
DE
RH
ILL
AV
WASH
ING
TON
AV
CA
RLT
ON
AV
VA
ND
ER
BILT
AV
BALTIC ST
ST JOHN'S PL
PROSPECT AV
FLATBUSH AV
EASTERN PY
SACKETT ST
DE GRAW ST
WARREN ST
10A
V
11A
V
BUTLER ST
GR
AN
DA
V
DOUGLASS ST
LINCOLN PL
ST MARK'S PL
PROSPECT PK SW
PLAZAST
E
PLAZA
STW
FIS
KE
PL
GRANDARMY PZ
MONTGOMERY PL
DE
NT
ON
PL
PO
LH
EM
US
PL
WH
ITW
EL
LP
L
TIM
ES
PZ
GR
EG
OR
YP
L ST JOHN'S PL
FLATBUSH AV
LINCOLN PL
ST MARK'S AV
PACIFIC ST
¯Park Slope ASP Suspension Area
MAP 1 - Park Slope Street Cleaning/Alternate Side Parking Regulation Suspension Area
^
ASP suspension tended to either have no effect on how often respondents used their •cars on weekdays (47%) or caused residents to use their cars less (39%).
30% of respondents said curbs were less clean during ASP suspension, 45% said •cleanliness was about the same, and 24% said that they didn’t know/were unsure.

3 Park SloPe aSP SuSPenSion evaluation
Methodology
Parking Space Occupancy and Turnover
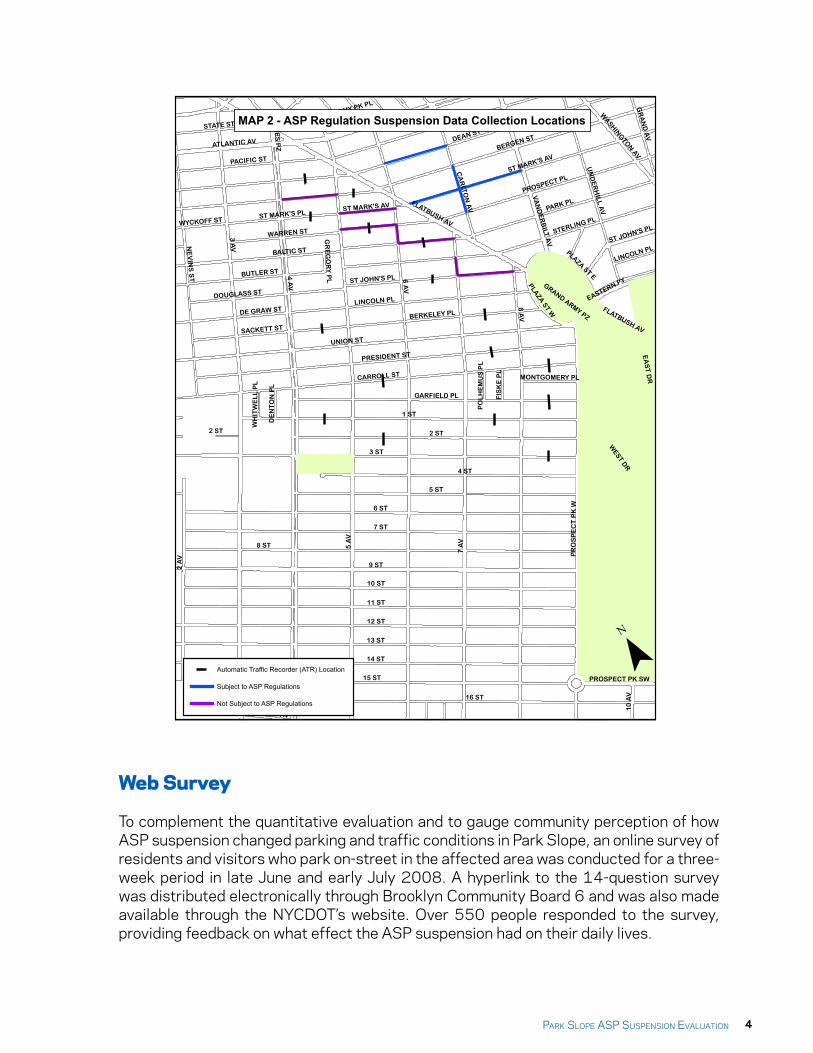
To analyze parking space occupancy and turnover, a license plate survey was conducted prior to ASP suspension and during the suspension. Parking data collected in December 2007 for the PlaNYC Parking Management Study was used for the pre-ASP suspension period. This sample of 13 block faces (shown in Map 2) was collected in December 2007 on a Tuesday afternoon and evening and a Wednesday morning (ASP regulations were not in effect on Wednesdays).
Another round of license plate surveys was performed in June 2008 during ASP suspension. Data were collected while schools were in session to be comparable to the December 2007 data. The survey was conducted on three consecutive days (Tuesday, Wednesday and Thursday) for the same block faces as in December 2007. During Tuesday and Thursday in June 2008, ASP was in effect for blockfaces north of Flatbush Avenue, which served as a control, but was suspended on blockfaces south of Flatbush Avenue (Table 1). Alternate side parking was not in effect for the study area on Wednesdays in December 2007 and June 2008. The license plate data was then used to assess parking conditions with and without ASP regulations.
TABLE 1 - GENERAL ASP REGULATION CHANGES
Street Location (St. Side) December 2008 June 2008 September 2008
S. of Flatbush Avenue (N/S) 11 AM - 2 PM MON SUSPENDED 11 AM - 12:30 PM WED
S. of Flatbush Avenue (S/S) 11 AM - 2 PM TUE SUSPENDED 11:30 AM - 1 PM TUE
N. of Flatbush Avenue (N/S) 11 AM - 2 PM MON/THUR 11 AM - 2 PM MON/THUR 11 AM - 2 PM MON/THUR
N. of Flatbush Avenue (S/S) 8 AM - 11 AM MON/THUR 8 AM - 11 AM MON/THUR 8 AM - 11 AM MON/THUR
Type of Data Collected Parking occupancy/turnover
Parking occupancy/turnover and traffic
volumesTraffic volumes
Note: ASP regulations were suspended from May 19th to July 14th during signage replacement
Traffic Volumes
In order to estimate the effect of drivers searching for a parking space on overall traffic volumes, Automatic Traffic Recorders (ATR) were installed on 16 one-way street segments (shown in Map 2). Traffic volume data was collected for a 7-day/24-hour period in June 2008, during the suspension of ASP regulations and for another 7-day/24-hour period in September 2008, after ASP regulations had been re-introduced. Street segments near schools were intentionally avoided so as not to record pick up/drop traffic. These traffic volumes were then compared to determine if traffic volumes were affected by the ASP suspension.
Park SloPe aSP SuSPenSion evaluation 4
3 A
V
6 A
V
5 A
V
4 A
V
7 A
V
8 A
V
3 ST
9 ST
8 ST
7 ST
6 ST
16 ST
1 ST
11 ST
10 ST
12 ST
14 ST
13 ST
15 ST
2 ST
5 ST
4 ST
DEAN ST
2 A
V
BERGEN ST
UNION ST
WEST D
R
PARK PL
CARROLL ST
PRESIDENT ST
NE
VIN
S S
T
STERLING PL
PROSPECT PL
ATLANTIC AV
PR
OS
PE
CT
PK
W
GARFIELD PL
PACIFIC ST
ST MARK'S AV
BALTIC ST
LINCOLN PL
BERKELEY PL
SACKETT ST
DE GRAW ST
BUTLER STST JOHN'S PL
UN
DE
RH
ILL
AV
CA
RLT
ON
AV
VA
ND
ER
BILT
AV
DOUGLASS ST
STATE ST
WARREN ST
EA
ST
DR
ST MARK'S PL
GR
AN
D A
V
WASH
ING
TON
AV
10
AV
PLAZA ST EPLA
ZA ST W FLATBUSH AV
EASTERN PY
PROSPECT EP PROSPECT AV
WYCKOFF ST
PROSPECT PK SW
FIS
KE
PL
GRAND ARMY PZ
MONTGOMERY PL
DE
NT
ON
PL
PO
LH
EM
US
PL
WH
ITW
EL
L P
L
TIM
ES
PZ
GR
EG
OR
Y P
L
ACADEMY PK PL
ST MARK'S AV FLATBUSH AV
PACIFIC ST
ST JOHN'S PL
2 ST
LINCOLN PL
¯
MAP 2 - ASP Regulation Suspension Data Collection Locations
Not Subject to ASP Regulations
Subject to ASP Regulations
Automatic Traffic Recorder (ATR) Location
Web Survey
To complement the quantitative evaluation and to gauge community perception of how ASP suspension changed parking and traffic conditions in Park Slope, an online survey of residents and visitors who park on-street in the affected area was conducted for a three-week period in late June and early July 2008. A hyperlink to the 14-question survey was distributed electronically through Brooklyn Community Board 6 and was also made available through the NYCDOT’s website. Over 550 people responded to the survey, providing feedback on what effect the ASP suspension had on their daily lives.
5 Park SloPe aSP SuSPenSion evaluation
Parking Evaluation
Parking Space Occupancy Rates
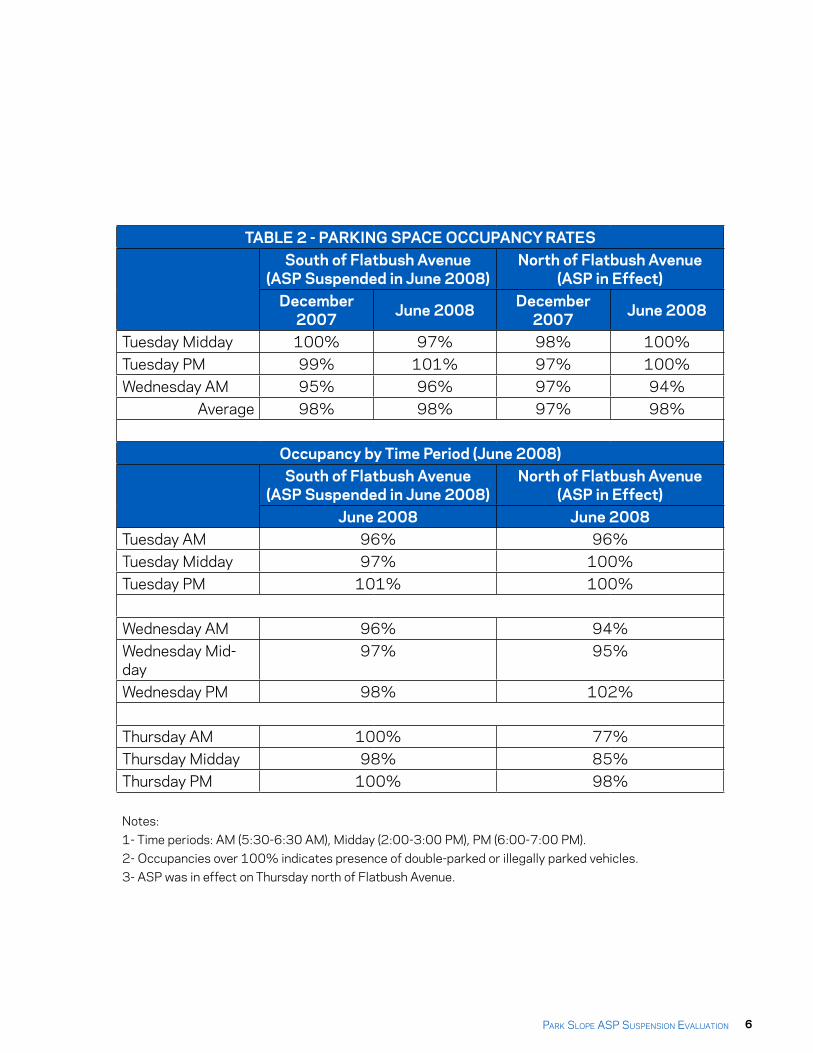
A summary of parking space occupancy is shown in Table 2.
Key Findings
Parking availability did not change during the ASP regulation suspension (98% •occupancy prior to the suspension, 98% during the suspension).
Parking availability was the same north of Flatbush Avenue and south of Flatbush •Avenue, both prior to and during the suspension of ASP regulations south of Flatbush Avenue.
Park SloPe aSP SuSPenSion evaluation 6
TABLE 2 - PARKING SPACE OCCUPANCY RATESSouth of Flatbush Avenue
(ASP Suspended in June 2008)North of Flatbush Avenue
(ASP in Effect)December
2007 June 2008 December 2007 June 2008
Tuesday Midday 100% 97% 98% 100%Tuesday PM 99% 101% 97% 100%Wednesday AM 95% 96% 97% 94%
Average 98% 98% 97% 98%
Occupancy by Time Period (June 2008)South of Flatbush Avenue
(ASP Suspended in June 2008)North of Flatbush Avenue
(ASP in Effect)June 2008 June 2008
Tuesday AM 96% 96%Tuesday Midday 97% 100%Tuesday PM 101% 100%
Wednesday AM 96% 94%Wednesday Mid-day
97% 95%
Wednesday PM 98% 102%
Thursday AM 100% 77%Thursday Midday 98% 85%Thursday PM 100% 98%
Notes:1- Time periods: AM (5:30-6:30 AM), Midday (2:00-3:00 PM), PM (6:00-7:00 PM).2- Occupancies over 100% indicates presence of double-parked or illegally parked vehicles. 3- ASP was in effect on Thursday north of Flatbush Avenue.
7 Park SloPe aSP SuSPenSion evaluation
Parking Evaluation
Parking Space Turnover
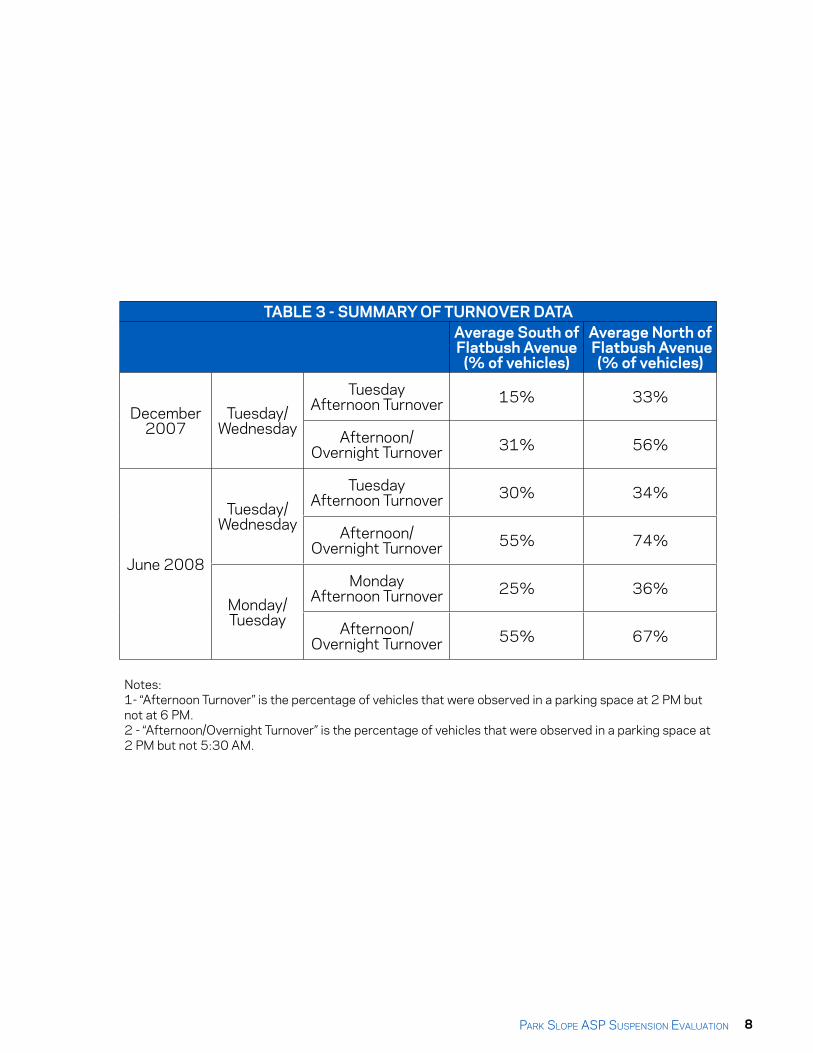
A summary of parking space turnover is shown in Table 3. “Afternoon Turnover” is the percentage of vehicles that were observed in a parking space at 2 PM but not at 6 PM. “Afternoon/Overnight Turnover” is the percentage of vehicles that were observed in a parking space at 2 PM, but not 5:30 AM the following day. Because ASP was not in effect during these times in the study area, Tuesday/Wednesday data from December 2007 and June 2008 are used in the turnover analysis.
The results show significant increases in turnover from December 2007 to June 2008 - afternoon/overnight turnover percentages in the area north of Flatbush Avenue rose from 56% in December 2007 to 74% in June 2008 and south of Flatbush Avenue from 31% in December 2007 to 55% in June 2008. Since turnover increased in both areas, one with ASP suspension and one without, it appears that seasonal or other factors -- but not ASP suspension -- produced the increase in parking turnover. The turnover data thus do not support any effect on parking turnover rates from the suspension of ASP.
Key Findings
There is no discernible change in turnover rates that can be attributed to the ASP •suspension.
The data show an increase in overnight turnover from December 2007 to June 2008 •in areas both with and without the ASP suspension.
Park SloPe aSP SuSPenSion evaluation 8
TABLE 3 - SUMMARY OF TURNOVER DATA Average South of Flatbush Avenue
(% of vehicles)
Average North of Flatbush Avenue
(% of vehicles)
December 2007
Tuesday/Wednesday
Tuesday Afternoon Turnover 15% 33%
Afternoon/Overnight Turnover 31% 56%
June 2008
Tuesday/Wednesday
Tuesday Afternoon Turnover 30% 34%
Afternoon/Overnight Turnover 55% 74%
Monday/Tuesday
Monday Afternoon Turnover 25% 36%
Afternoon/Overnight Turnover 55% 67%
Notes:1- “Afternoon Turnover” is the percentage of vehicles that were observed in a parking space at 2 PM but not at 6 PM.2 - “Afternoon/Overnight Turnover” is the percentage of vehicles that were observed in a parking space at 2 PM but not 5:30 AM.
9 Park SloPe aSP SuSPenSion evaluation
Parking Evaluation
Non-Residential Parkers
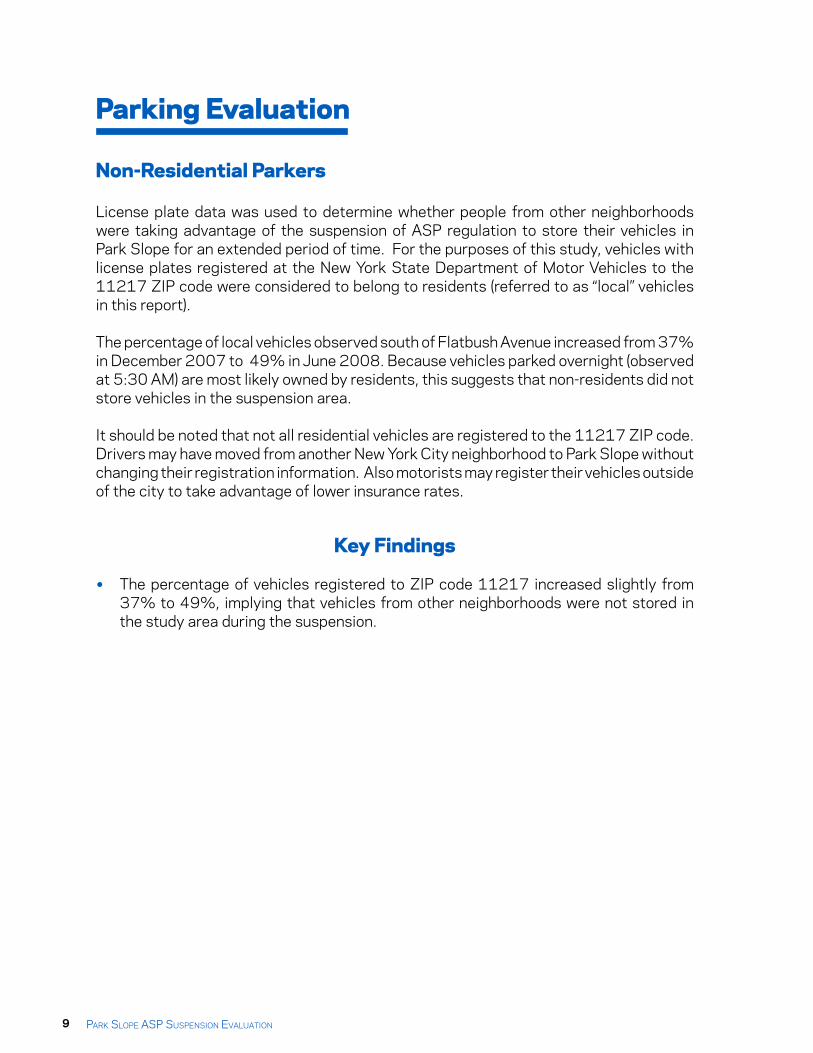
License plate data was used to determine whether people from other neighborhoods were taking advantage of the suspension of ASP regulation to store their vehicles in Park Slope for an extended period of time. For the purposes of this study, vehicles with license plates registered at the New York State Department of Motor Vehicles to the 11217 ZIP code were considered to belong to residents (referred to as “local” vehicles in this report).
The percentage of local vehicles observed south of Flatbush Avenue increased from 37% in December 2007 to 49% in June 2008. Because vehicles parked overnight (observed at 5:30 AM) are most likely owned by residents, this suggests that non-residents did not store vehicles in the suspension area.
It should be noted that not all residential vehicles are registered to the 11217 ZIP code. Drivers may have moved from another New York City neighborhood to Park Slope without changing their registration information. Also motorists may register their vehicles outside of the city to take advantage of lower insurance rates.
Key Findings
The percentage of vehicles registered to ZIP code 11217 increased slightly from •37% to 49%, implying that vehicles from other neighborhoods were not stored in the study area during the suspension.
Park SloPe aSP SuSPenSion evaluation 10
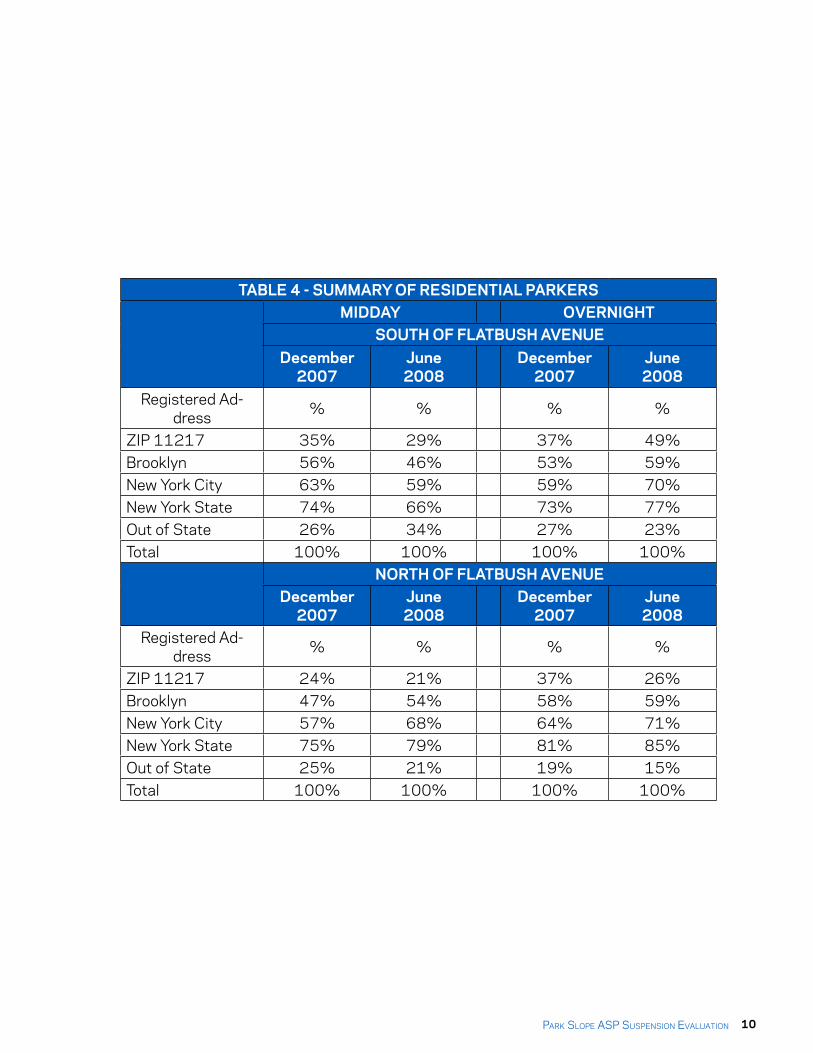
TABLE 4 - SUMMARY OF RESIDENTIAL PARKERSMIDDAY OVERNIGHT
SOUTH OF FLATBUSH AVENUEDecember
2007June 2008
December 2007
June 2008
Registered Ad-dress % % % %
ZIP 11217 35% 29% 37% 49%Brooklyn 56% 46% 53% 59%New York City 63% 59% 59% 70%New York State 74% 66% 73% 77%Out of State 26% 34% 27% 23%Total 100% 100% 100% 100%
NORTH OF FLATBUSH AVENUEDecember
2007June 2008
December 2007
June 2008
Registered Ad-dress % % % %
ZIP 11217 24% 21% 37% 26%Brooklyn 47% 54% 58% 59%New York City 57% 68% 64% 71%New York State 75% 79% 81% 85%Out of State 25% 21% 19% 15%Total 100% 100% 100% 100%
11 Park SloPe aSP SuSPenSion evaluation
Traffic Volume Analysis
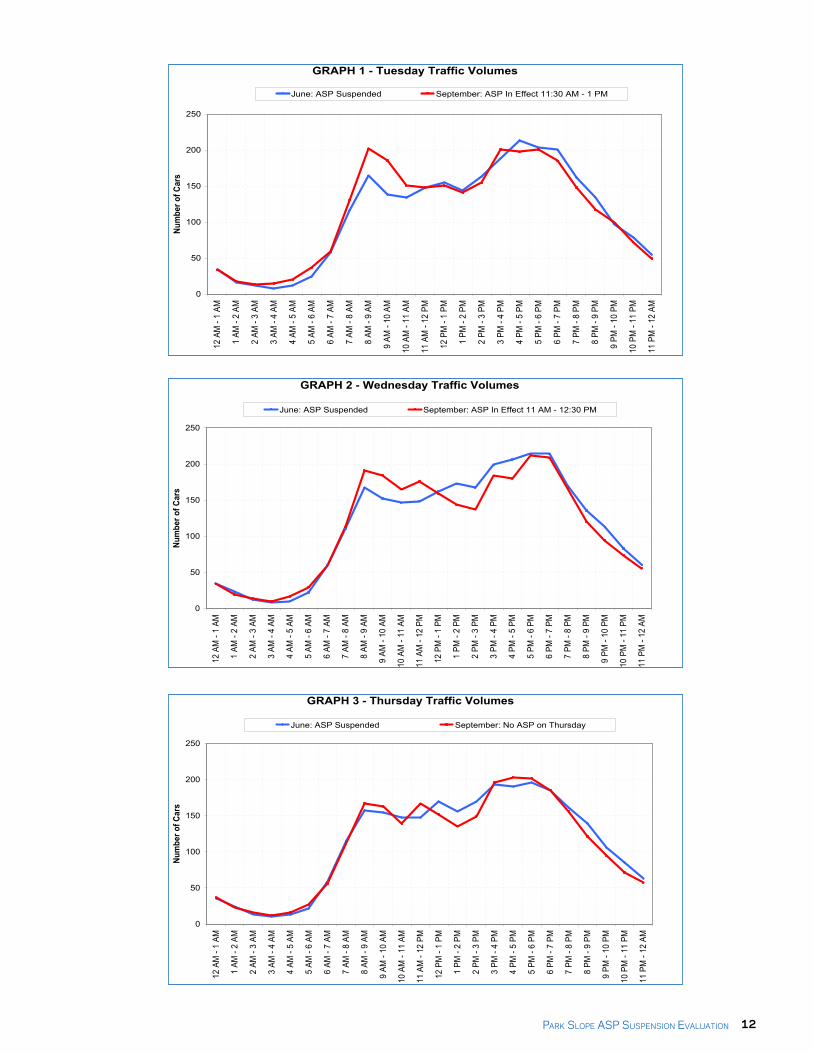
The near-saturation of on-street parking spaces in Park Slope means that drivers often spend considerable time searching for a parking space. Search traffic is likely to be higher on days alternate side regulations reduce the number of spaces that are available for all day parking. Alternate side parking was in effect on Mondays and Thursdays before the suspension and in effect Tuesdays and Wednesdays after the new ASP regulations were implemented. Graphs 1 and 2 show the effect of ASP regulations on traffic volumes on Tuesday and Wednesday, respectively. Graph 3 shows traffic volumes without ASP on Thursday. Traffic volumes were higher between 7 AM and 11 AM on days that ASP was in effect compared with days that ASP was not in effect or was suspended.
Traffic volumes have been adjusted for any seasonal variations using the seasonal adjustment factors provided by the New York State Department of Transportation.
Key Findings
Traffic volumes were similar on days that ASP was not in effect (Graph 3).•
Traffic volumes were higher in the morning on days when ASP was in effect (Graphs 1 •and 2). This difference is most likely due to motorists searching for a parking space that is good for the entire day.
The largest difference in traffic volumes was from 8 a.m. to 9 a.m. (19%).•
Park SloPe aSP SuSPenSion evaluation 12
GRAPH 1 - Tuesday Traffic Volumes
0
50
100
150
200
250
12 A
M -
1 AM
1 AM
- 2
AM
2 AM
- 3
AM
3 AM
- 4
AM
4 AM
- 5
AM
5 AM
- 6
AM
6 AM
- 7
AM
7 AM
- 8
AM
8 AM
- 9
AM
9 AM
- 10
AM
10 A
M -
11 A
M
11 A
M -
12 P
M
12 P
M -
1 PM
1 PM
- 2
PM
2 PM
- 3
PM
3 PM
- 4
PM
4 PM
- 5
PM
5 PM
- 6
PM
6 PM
- 7
PM
7 PM
- 8
PM
8 PM
- 9
PM
9 PM
- 10
PM
10 P
M -
11 P
M
11 P
M -
12 A
M
Num
ber o
f Car
s
June: ASP Suspended September: ASP In Effect 11:30 AM - 1 PM
GRAPH 2 - Wednesday Traffic Volumes
0
50
100
150
200
250
12 A
M -
1 AM
1 AM
- 2
AM
2 AM
- 3
AM
3 AM
- 4
AM
4 AM
- 5
AM
5 AM
- 6
AM
6 AM
- 7
AM
7 AM
- 8
AM
8 AM
- 9
AM
9 AM
- 10
AM
10 A
M -
11 A
M
11 A
M -
12 P
M
12 P
M -
1 PM
1 PM
- 2
PM
2 PM
- 3
PM
3 PM
- 4
PM
4 PM
- 5
PM
5 PM
- 6
PM
6 PM
- 7
PM
7 PM
- 8
PM
8 PM
- 9
PM
9 PM
- 10
PM
10 P
M -
11 P
M
11 P
M -
12 A
M
Num
ber o
f Car
s
June: ASP Suspended September: ASP In Effect 11 AM - 12:30 PM
GRAPH 3 - Thursday Traffic Volumes
0
50
100
150
200
250
12 A
M -
1 AM
1 AM
- 2
AM
2 AM
- 3
AM
3 AM
- 4
AM
4 AM
- 5
AM
5 AM
- 6
AM
6 AM
- 7
AM
7 AM
- 8
AM
8 AM
- 9
AM
9 AM
- 10
AM
10 A
M -
11 A
M
11 A
M -
12 P
M
12 P
M -
1 PM
1 PM
- 2
PM
2 PM
- 3
PM
3 PM
- 4
PM
4 PM
- 5
PM
5 PM
- 6
PM
6 PM
- 7
PM
7 PM
- 8
PM
8 PM
- 9
PM
9 PM
- 10
PM
10 P
M -
11 P
M
11 P
M -
12 A
M
Num
ber o
f Car
s
June: ASP Suspended September: No ASP on Thursday
13 Park SloPe aSP SuSPenSion evaluation
Web Survey Findings
The following section reports results from the 568 responses received from the web survey concerning the perceived impact of the ASP suspension on parking conditions in Park Slope.
Key Findings
80% of respondents were Park Slope residents. •
Respondents spend an average of 27 minutes looking for parking in Park Slope.•
47% of respondents reported that it was easier to find a parking space during the •ASP suspension, 31% harder and 22% about the same.
The ASP suspension did not affect how often most respondents used their vehicles.•
Most perceived that the cleanliness of curbs and stormwater drains was about the •same during the ASP suspension, although about 30% perceived that curbs and stormwater drains were less clean during the ASP suspension.
Park SloPe aSP SuSPenSion evaluation 14
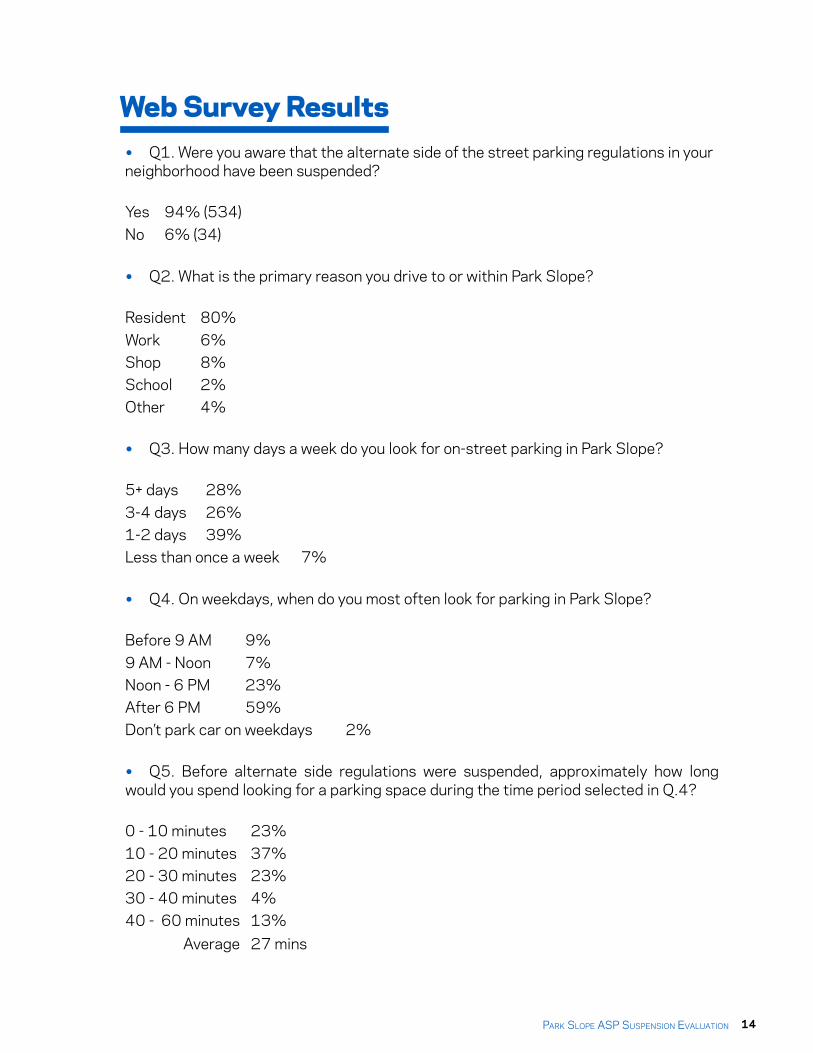
Web Survey ResultsQ1. Were you aware that the alternate side of the street parking regulations in your •
neighborhood have been suspended?
Yes 94% (534) No 6% (34)
Q2. What is the primary reason you drive to or within Park Slope?•
Resident 80%Work 6%Shop 8%School 2%Other 4%
Q3. How many days a week do you look for on-street parking in Park Slope?•
5+ days 28%3-4 days 26%1-2 days 39%Less than once a week 7%
Q4. On weekdays, when do you most often look for parking in Park Slope?•
Before 9 AM 9%9 AM - Noon 7%Noon - 6 PM 23%After 6 PM 59%Don’t park car on weekdays 2%
Q5. Before alternate side regulations were suspended, approximately how long •would you spend looking for a parking space during the time period selected in Q.4?
0 - 10 minutes 23%10 - 20 minutes 37%20 - 30 minutes 23%30 - 40 minutes 4%40 - 60 minutes 13%
Average 27 mins
15 Park SloPe aSP SuSPenSion evaluation
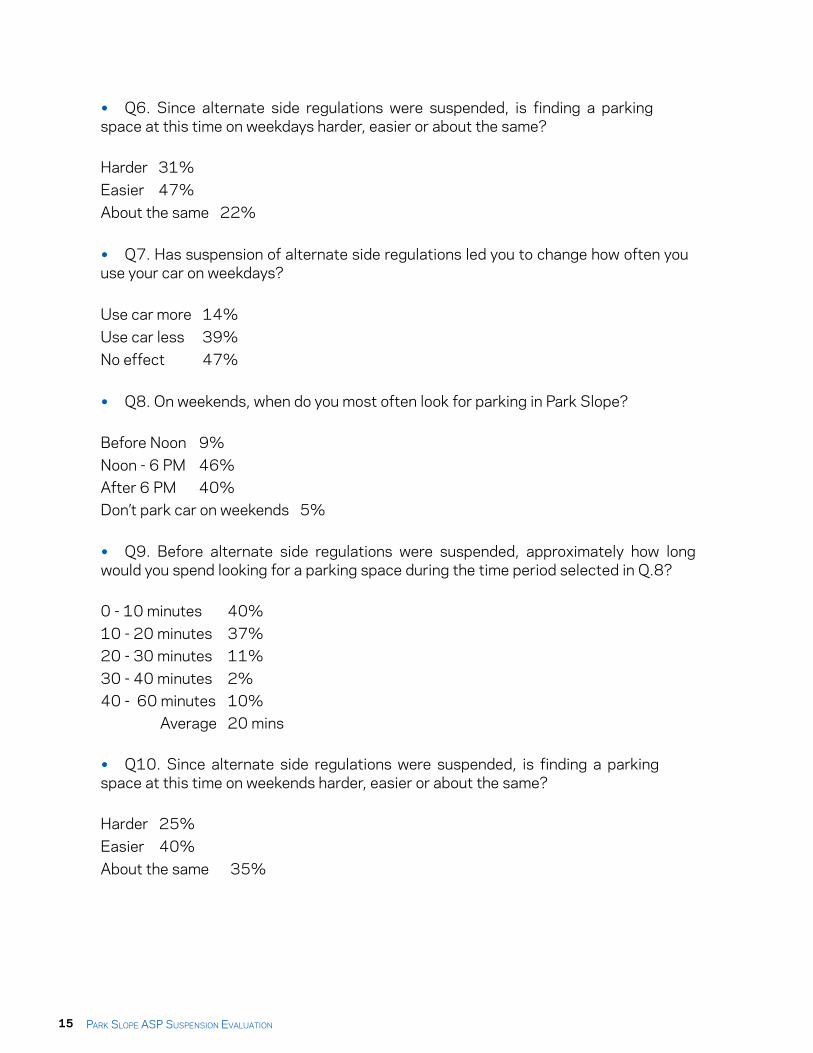
Q6. Since alternate side regulations were suspended, is finding a parking •space at this time on weekdays harder, easier or about the same?
Harder 31%Easier 47%About the same 22%
Q7. Has suspension of alternate side regulations led you to change how often you •use your car on weekdays?
Use car more 14%Use car less 39%No effect 47%
Q8. On weekends, when do you most often look for parking in Park Slope?•
Before Noon 9%Noon - 6 PM 46%After 6 PM 40%Don’t park car on weekends 5%
Q9. Before alternate side regulations were suspended, approximately how long •would you spend looking for a parking space during the time period selected in Q.8?
0 - 10 minutes 40%10 - 20 minutes 37%20 - 30 minutes 11%30 - 40 minutes 2%40 - 60 minutes 10%
Average 20 mins
Q10. Since alternate side regulations were suspended, is finding a parking •space at this time on weekends harder, easier or about the same?
Harder 25%Easier 40%About the same 35%
Park SloPe aSP SuSPenSion evaluation 16
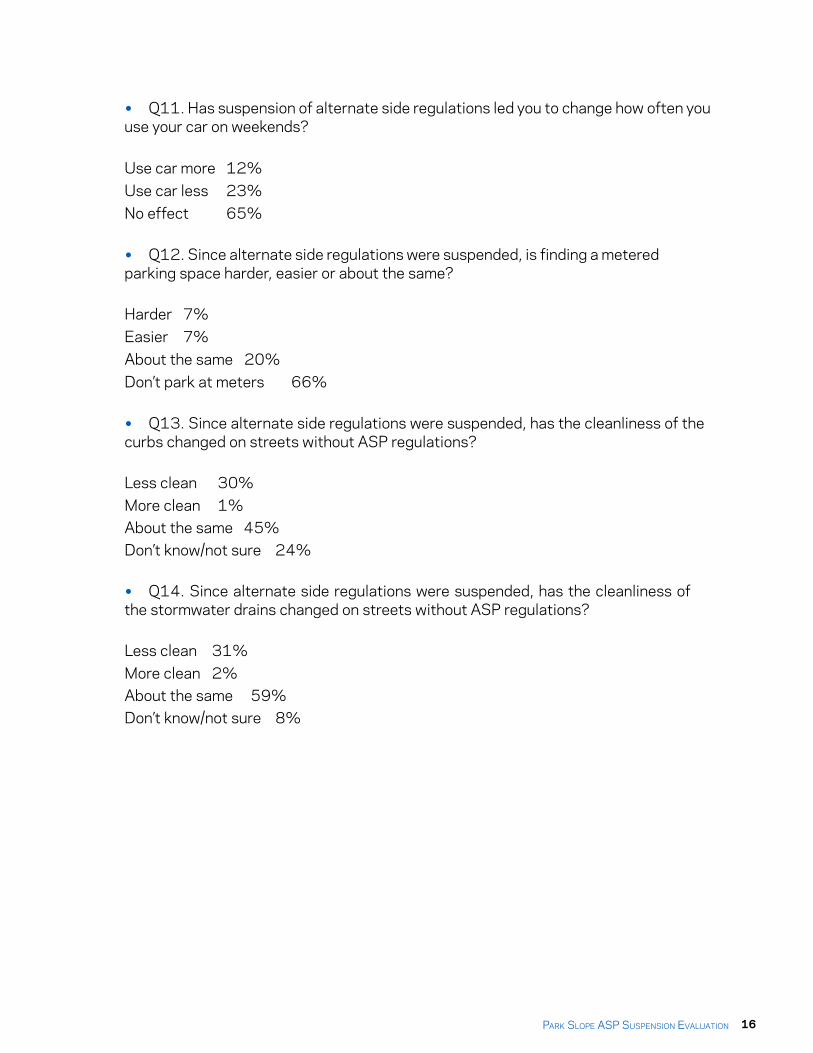
Q11. Has suspension of alternate side regulations led you to change how often you •use your car on weekends?
Use car more 12%Use car less 23%No effect 65%
Q12. Since alternate side regulations were suspended, is finding a metered •parking space harder, easier or about the same?
Harder 7%Easier 7%About the same 20%Don’t park at meters 66%
Q13. Since alternate side regulations were suspended, has the cleanliness of the •curbs changed on streets without ASP regulations?
Less clean 30%More clean 1%About the same 45%Don’t know/not sure 24%
Q14. Since alternate side regulations were suspended, has the cleanliness of •the stormwater drains changed on streets without ASP regulations?
Less clean 31%More clean 2%About the same 59%Don’t know/not sure 8%
Janette Sadik-KhanCommissioner
Bruce SchallerDeputy Commissioner Steven WeberAssistant Commissioner
Dalila HallDirector of Planning Studies
Willa NgSenior Project Manager
Adam ZarankoProject Manager
New York CityDepartment ofTransportation
This report was prepared by the New York City Department of Transportation’s Division of Planning and Sustainability.
Special thanks to Brooklyn Community Board 6 for their help in distributing the web survey.
The preparation of this report was financed in part with funds from the U.S. Department of Transportation, Federal Highway Administration, under the Federal Highway Act of 1956, as amended, and the Urban Mass Transportation Act of 1964, as amended. This document is disseminated by the New York City Department of Transportation in the interest of information exchange. It reflects the views of the New York City Department of Transportation (NYCDOT), which is responsible for the facts and the accuracy of the data presented herein. The report does not necessarily reflect any official views or policies of the Federal Transit Administration, the Federal Highway Administration, or the State of New York. The report does not constitute a standard, specification, or regulation.
PlaNYC Comprehensive Vision Study
2008-2009: PTDT08D00.G21
