paris, march 5 - engie · 2019-11-27 · germany month ahead forward curve as of the 23-feb-2009...
TRANSCRIPT

20Paris, March 5ANNUAL RESULTS
GDF SUEZ08

22008 Annual Results - March 5, 2009
DISCLAIMER
Forward-Looking statementsThis communication contains forward-looking information and statements. These statements include financial projections, synergies, cost-savings and estimates and their underlying assumptions, statements regarding plans, objectives, savings, expectations and benefits from the transactions and expectations with respect to future operations, products and services, and statements regarding future performance. Although the management of GDF SUEZ believes that the expectations reflected in such forward-looking statements are reasonable, investors and holders of GDF SUEZ ordinary shares are cautioned that forward-looking information and statements are not guarantees of future performances and are subject to various risks and uncertainties, many of which are difficult to predict and generally beyond the control of GDF SUEZ, that could cause actual results, developments, synergies, savings and benefits from the transaction to differ materially from those expressed in, or implied or projected by, the forward-looking information and statements. These risks and uncertainties include those discussed or identified in the public filings made by GDF SUEZ with the Autorité des marchés financiers (AMF) and/or with the United States Securities and Exchange Commission (SEC), including those listed under “Facteurs de Risques” (Risk factors) sections in the Document deRéférence filed by Gaz de France with the AMF on May 15, 2008 (under no: R.08-056), in the Document deRéférence filed by SUEZ on March 18, 2008 (under no: D.08-0122) and its update filed on June 13, 2008 (under no: 08-0122-A01), in section 3 of the prospectus prepared for the issue and admission for listing of GDF SUEZ shares resulting from the merger takeover of Suez by Gaz de France filed with the AMF on June 13, 2008 (under n°: 08-126) and the Form F4 registered with the SEC on June 16, 2008. Investors and holders of GDF SUEZ securities should consider that the occurrence of some or all of these risks may have a material adverse effect on GDF SUEZ.

Introduction2008 Annual Results
GDF SUEZ
Gérard Mestrallet

42008 Annual Results - March 5, 2009
A leader in Energy and Environment
2008 results advanced strongly and exceeded targets
A long-term industrial vision,a strong Group standing up to the economic crisis
A proactive Group, with consitent and realistic goals
Industrial strategy on track, ambitions in nuclear revival
A strong business model aiming at creating value over the long term

52008 Annual Results - March 5, 2009
2007 2008 ∆∆∆∆ 08/07 ∆∆∆∆ Organic
EBITDA 12.5 13.9 + 10.7% + 12.5%
Current operating income 7.8 8.6 + 9.4% + 12.6%
Net income, Group share 5.8 6.5 + 13.0%
Net Capex 7.7 11.8 + 53.2%
Ordinary dividend (in € per share) €1.26 €1.40(1) + 11.1%
2008 results advanced stronglyand exceeded targets
(1) To be proposed at the AGM scheduled for May 4, 2009
In €bn Pro forma unaudited data

62008 Annual Results - March 5, 2009
* Revenues growth
2008 sales: €83,053mGrowth: +17%
Energy Europe& International
+ 21.2%
Infrastructures+ 37.8%
Energy France+ 16.9%
Energy Services+ 8.5%
Global Gas& LNG
+ 33.7%
Environment+ 2.7%
Energy Europe+ 32.4%
EnergyInternational
+ 14.1%
EnergyBenedelux
+ 18.9%
FranceBelgium+ 14.7%
Rest of Europe+ 19.8%
North America
+ 7.7%
Rest of the World
+ 23.9%
Business lines* Geographic areas*
2008: strong growth across all business linesand geographic areas

72008 Annual Results - March 5, 2009
GDF SUEZ: a long-term industrial vision A strong Group standing up to the crisis
The right strategy and positioning for profitable long term growth
Long term growthin Energy andEnvironment
Dynamic €30bn*long-term industrialinvestment programme
A diversified and profitable industrial platform
A strong andwell-balanced Group
* Net investments in 2008-10

82008 Annual Results - March 5, 2009
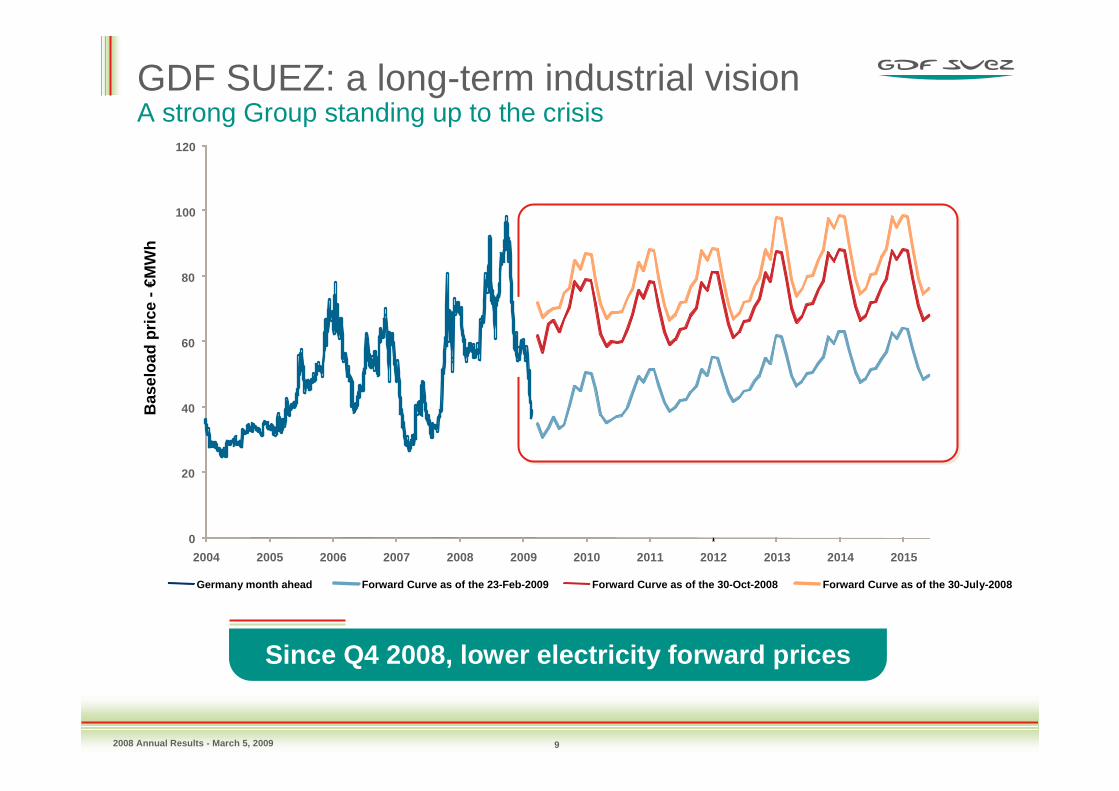
GDF SUEZ: a long-term industrial visionA strong Group standing up to the crisis
Source: Bloomberg, March 2, 2009
Since Q4 2008, lower brent forward prices
0
20
40
60
80
100
120
140
160
1998 1999 2000 2001 2002 2003 2004 2005 2006 2007 2008 2009 2010 2011 2012 2013 2014 2015 2016
($/b
bl)
Spot Forward Curve as of 2-Mar-2009 Forward Curve as of 2-Nov-2008 Forward Curve as of 25-Jul-2008
92008 Annual Results - March 5, 2009
GDF SUEZ: a long-term industrial visionA strong Group standing up to the crisis
Since Q4 2008, lower electricity forward prices
Bas
eloa
d pr
ice
-€M
Wh
0
20
40
60
80
100
120
2004 2005 2006 2007 2008 2009 2010 2011 2012 2013 2014 2015
Germany month ahead Forward Curve as of the 30-July-2008Forward Curve as of the 30-Oct-2008Forward Curve as of the 23-Feb-2009

102008 Annual Results - March 5, 2009
GDF SUEZ:a proactive Group standing up to the crisis
September 2008 November 2008 March 2009
• Communicationof detailed industrial targetsduring "Investor Day"
• Publication of main medium-term sensitivity parameters
• Confirmation of ambitious medium-term goals
• Short-term EBITDA growth profile
• Launch of the Efficioperformance plan (€1.8bn by 2011)
• Heightened capexselectivity
• Enhancement of liquidity and extension of debt maturities (~ €10bn debt issued) to ensure the funding for industrial investment programme

112008 Annual Results - March 5, 2009
GDF SUEZ:consistent and realistic targets(1)
2011 EBITDA: within a €17bn to €18bn range(vs €13.9bn in 2008), consistent with:
� industrial development programme
� implementation of the Efficio performance plan
� “strong A” credit rating target and a dynamic and co mpetitive shareholder remuneration policy
� Commodities forward prices (2) evolution
- Average brent 09/10/11: 50/58/62 $/bbl
- Electricity Benedelux 09/10/11: 52/52/54 €/MWh
2009e EBITDA > EBITDA 2008
(1) at average weather conditions, excluding significant regulatory changes and based upon macro economic, brentand electricity prices scenarii at end January 09(2) end January 09

122008 Annual Results - March 5, 2009
Industrial strategy on track as of 2008
Reinforcement along the entire energyvalue chain• Europe Electricity: UK,Italy, France, etc.• Upstream gas: Netherlands, Libya, Azerbaijan• Midstream: Italy, Gulf of Mexico, Germany,etc.• Infrastructures: GrTgaz, GrDF, Elengy, Storengy
Confirmed global leadership in 3 sectors• LNG: arbitrages, Singapore• IPP: Gulf Countries, Brazil, Chile, Thailand, North America• Energy Services: France, Benelux, Italy, launching of Cofely, etc.
Energy-Environment synergy • Oman, Bahrain
A portfolio of projects, firmly underway and with s ecuredfunding, which feed through to 2009-10 EBITDA growt h

132008 Annual Results - March 5, 2009
Industrial strategy on track as of 2008A new brand and organization within the Energy Services Business Line
The European leader in Energyand Environmental Efficiency services…
� €8Bn in revenues in 2008(out of €14Bn for the business line),
� 36,000 staff(out of 80,000 for the business line),
� For 15 countries(out of 30 for the business line).

142008 Annual Results - March 5, 2009
Industrial strategy on track as of 2008 Supported by asset swaps in Europe
Strenghtened industrial presence in Italy and Germany,with cash neutral transactions
ENI Assets (May 08) E.on Assets (Dec. 08)1,700 MW in Europe
• 1,100 MW VPP in Italyfor a 20-year period
• Supply contracts (Italy, Germany)
• E&P assets: UK, Gulf of Mexico,Egypt, Indonesia
• Agreement on the sale of the gas distribution network (City of Rome)
• 991 MW in Germany: 132 MW hydraulic, 2 coal-fired plants, 1 gas-fired plant and 1 biomass
• 700 MW of nuclear energy drawing rights (Gundrellingen B&C, Unterweser and Krümmel)

152008 Annual Results - March 5, 2009
Nuclear ambitions for a long-term balanceof the energy mix
• 6 GW installed nuclear capacity (Tihange, Doel, Chooz B, Tricastin, 700 MW* in Germany)
• Know-how and skills right along the value chain
• Partnership-based growth (CEA, Total, Areva, EDF, Iberdrola/SSE, SCK.CEN)
A strong historic positionin our home markets
• Operate existing nuclear plants for as long as technical and economic conditions allow, with safety as absolute priority
• Develop new capacity: third-generation plant by 2020, grow in key markets outside Europe as well
• Engineering and services: support the Group’s development and participate in major nuclear projects for external clients
The Group’s nuclear strategy
Target: to keep the share of nuclear power in the G roup’s energy mix at approximately 20% over the long term
* After E.on transaction

162008 Annual Results - March 5, 2009
The Group’s nuclear ambitions in France
A strong position as France’s second ranking electricity company: strong local presence in the Energy, Environment and Services businesses in FranceLong-standing cooperation with EDF, giving the Group 1.1 GWdrawing rights on Chooz B and Tricastin5% interest in the Georges Besse II and 11% in the Eurodif enrichment plantsResearch partnership with France’s Atomic Energy Commissionand Belgium’s SCK.CENRecognized expertise and skills, built up over more than 40 years,to support the development of France’s second EPR in PenlyFrench State has acknowledged the will of GDF SUEZ to buildand operate France's 3rd EPR reactor
France, an obvious priority for the Group’s growth in nuclear energy

172008 Annual Results - March 5, 2009
A strong business model creating valueover the long term
A Utilities at the heart of Europe with a flexibleand diversified energy mix, and a strong customer b ase
Gas-electricity convergence
Presence on the “copper plate”
Nuclear, gas, renewable
energies, coal, etc.
Gas transport, storage,
distribution
+3 world-leading skills sets:
strong platform for development
LNG and gas supplyIndependent Power
ProductionEnergy services and
energy efficiency
Energy-Environment
synergy

Financial Highlights
GDF SUEZ2008 Annual Results
Gérard Lamarche

192008 Annual Results - March 5, 2009
A balanced business model delivering profitable growth
A solid set of 2008 results
Sustained cash flow generation
A strong balance sheet
2008 targets exceeded
Consistent and realistic targets

202008 Annual Results - March 5, 2009
A solid set of 2008 resultsDouble digit organic growth
(1) See appendices for reconciliation with the 2007 proforma data published for the Investor Day on 26 November 2008(2) Excluding contributions by Distrigaz, Fluxys, SPE and Coriance which are identified in a specific line on the P&L for 2007 and 2008(3) Definition : Industrial capex (maintenance and development) + financial capex (acquisitions) – disposals(4) Net debt excluding Distrigaz and Fluxys in 2007
46.1%31.3%Gearing
28.917.3Net debt(4)
2007(1&2) 2008 (2) 08/07∆∆∆∆
08/07organic ∆∆∆∆
Revenues 71.2 83.1 + 16.6% + 17.5%
EBITDA 12.5 13.9 + 10.7% + 12.5%
Current Operating Income 7.8 8.6 + 9.4% + 12.6%
Net income, Group share 5.8 6.5 + 13.0%
Net CAPEX(3) 7.7 11.8
Ordinary dividend per share €1.26 €1.40 + 11.1%
In €bnProforma unaudited data

212008 Annual Results - March 5, 2009
A solid set of 2008 resultsA sustained EBITDA growth in a volatile commodity price environment …
12,539
FXScopeEnergyFrance
2007
(156)(9)275
(147)
+ 12.5% of organic growthEBITDA in €mProforma unaudited data
* Incl. Other: -€354m
Energy Europe &
International
GlobalGas &LNG
Energy France
Energy Europe& International
Global Gas & LNG
Infrastructures
13,886*1,388(157)
28
Infra-structures
EnergyServices
Environ-ment
Others
2996
Energy Services
Environment
+10.7% growth
2,878
3,715
4,395
246
2,102
904
2008

222008 Annual Results - March 5, 2009
A solid set of 2008 results… supported by a balanced business mix
EBITDA in €bnProforma unaudited data
Energy France
Breakdown per business line* Geographic breakdown
EnergyServices
Global Gas& LNG
EnvironmentEnergy Europe
EnergyInternational
EnergyBenedelux
Infrastructures
15%
27%
21%
13%
13%
6%2%
7%
France
Other Europe
North America
Rest of the world
41%5%
31%
11%12%
Belgium
* Incl. Other: -€354m

232008 Annual Results - March 5, 2009
A solid set of 2008 resultsEnergy France: good industrial and commercial performance mitigated by gas tariff shortfall
873
198
368
12,368
2007
1,094Total CAPEX
Energy France 2008 08/07∆∆∆∆
08/07organic ∆
Revenues 14,457 + 16.9% + 16.3%
EBITDA 246 - 33.1% - 40.1%
Current Operating Income 92 - 53.6% - 54.0%
In €mProforma unaudited data
2%
EBITDA
- 679
29.8
31.8
+0.4
294
2008
Gas tariff shorfall in €m
Electricity generation output in TWh
Electricity sales* in TWh
Climate adjustment in TWh(« - » � warmer than average)
Gas sales in TWh
Key Performance Indicators
+ 14.6-14.2
-763+ 84
+1.328.5
+3.428.4
+5289
∆∆∆∆2007
* In contribution

242008 Annual Results - March 5, 2009
834
1,477
1,796
11,907
2007
992Total CAPEX
Energy Benedelux 2008 08/07∆∆∆∆
08/07organic ∆
Revenues 14,156 + 18.9% + 22.2%
EBITDA 1,752 - 2.5% + 2.2%
Current Operating Income 1,187 - 19.6% - 15.8%
A solid set of 2008 resultsEnergy Benedelux: a year of consolidation impacted by one-offs
In €mProforma unaudited data
EBITDA
13%
≥ 60%≥ 30%Hedge ratio 2010
84.8%90.3%Availability of nuclear plants
≥ 90%≥ 65%Hedge ratio 2009
76
84
113
2008
78
89
118
2007
-2Gas sales in TWh
-5Electricity generation output in TWh*
-5Electricity sales in TWh
∆∆∆∆Key Performance Indicators
* group share and excluding pumped storage

252008 Annual Results - March 5, 2009
385
456
709
6,609
2007
1,937Total CAPEX
Energy Europe 2008 08/07∆∆∆∆
08/07organic ∆
Revenues 8,749 + 32.4% + 23.8%
EBITDA 844 + 19.1% + 11.4%
Current Operating Income 513 + 12.6% + 8.1%
A solid set of 2008 resultsEnergy Europe: accelerated industrial developmentto deliver sustained growth
In €mProforma unaudited data
EBITDA
6%
*100%
Key Performance Indicators 2007 2008 ∆∆∆∆ o/wItaly
o/wWesternEurope
o/wCentral & EasternEurope
Electricity sales in TWh 45 52 +7 19 24 9
Gas sales in TWh 119 130 +11 29 35 66
Gas volume conveyed in TWh 84 81 -3 81
Installed electricity capacity* in GW 10.9 12.8 +1.9 4.7 4.8 3.3

262008 Annual Results - March 5, 2009
855
1,286
1,673
6,682
2007
3,314Total CAPEX
Energy International 2008 08/07∆∆∆∆
08/07organic ∆
Revenues 7,623 + 14.1% + 18.4%
EBITDA 1,799 + 7.5% + 9.7%
Current Operating Income 1,397 + 8.6% + 11.4%
A solid set of 2008 resultsEnergy International: strong growth in buoyant markets
In €mProforma unaudited data
EBITDA
13%
Middle East, Asia, Africa11.1
7.11269.04
10.144.8
2008
7.4
5.61306.86
9.644
2007
+3.7Installed electricity capacity * in GW
+1.5-4
+2.2
North AmericaInstalled electricity capacity* in GWGas sold or transported in TWhNYMEX ($/MMBTU)
+0.5+0.8
Latin AmericaInstalled electricity capacity* in GWElectricity generation output in TWh
∆∆∆∆Key Performance Indicators
*100%

272008 Annual Results - March 5, 2009
826
1,189
2,345
17,2848,096
2007
2,289Total CAPEX
Global Gas & LNG 2008 08/07∆∆∆∆
08/07organic ∆
Revenues incl. intra-groupRevenues
22,39410,827
+ 29.6%+ 33.7% + 35.7%
EBITDA 3,715 + 58.4% + 60.5%
Current Operating Income 2,352 + 97.7% + 103.7%
A solid set of 2008 resultsGlobal Gas & LNG: record results supported by higher average oil prices
In €mProforma unaudited data
EBITDA
27%
+73831LNG arbitrage operations in TWh
169
51.3
26.2
97
2008
152
42.4
14.5
73
2007
+8.9Hydrocarbon production (Mboe)
+17Key account sales* in TWh
+11.7NBP average (€/MWh)
+24Brent average ($/bbl)
∆∆∆∆Key Performance Indicators
* Excluding sales to municipal distribution companies in France

282008 Annual Results - March 5, 2009
+ 34.5%+ 6.9%+ 37.8%
5,498896
5,142650
Revenues incl. intra-groupRevenues
1,509
1,848
2,847
2007
1,901Total CAPEX
Infrastructures 2008 08/07∆∆∆∆
08/07organic ∆
EBITDA 2,878 + 1.1% + 1.0%
Current Operating Income 1,891 + 2.3% + 2.7%
A solid set of 2008 resultsInfrastructures: solid and sustainable growth
In €mProforma unaudited data
EBITDA
21%
0.40.4LNG terminals average RAB in €bn
+2108106Storage capacity sold in TWh
+0.25.85.6Transmission average RAB in €bn
+0.313.513.2Distribution average RAB in €bn
9,148
327
2008
8,959
311
2007
+189Transmission capacity sold in GWh/d
+16Gas volume conveyed by GrDF in TWh
∆∆∆∆Key Performance Indicators

292008 Annual Results - March 5, 2009
473
539
854
12,798
2007(1)
603Total CAPEX
Energy Services 2008 08/07∆∆∆∆
08/07organic ∆
Revenues 13,993 + 9.3% + 8.8%
EBITDA 904 + 5.8% + 3.4%
Current Operating Income 586 + 8.7% + 6.9%
A solid set of 2008 resultsEnergy Services : strong order backlog and sustained developmentof core energy efficiency activities
In €mProforma unaudited data
EBITDA
7%
(1) Excluding 2007 Snovhit impact: revenues: +€96m; EBITDA: +€92m, COI:+ €84m
4,114
7.5
215
2008
3,588
7.5
130
2007
+15%EngineeringBacklog in hours (000)
InstallationsBacklog in €bn
+85ServicesNet commercial development in €m
∆∆∆∆Key Performance Indicators
302008 Annual Results - March 5, 2009
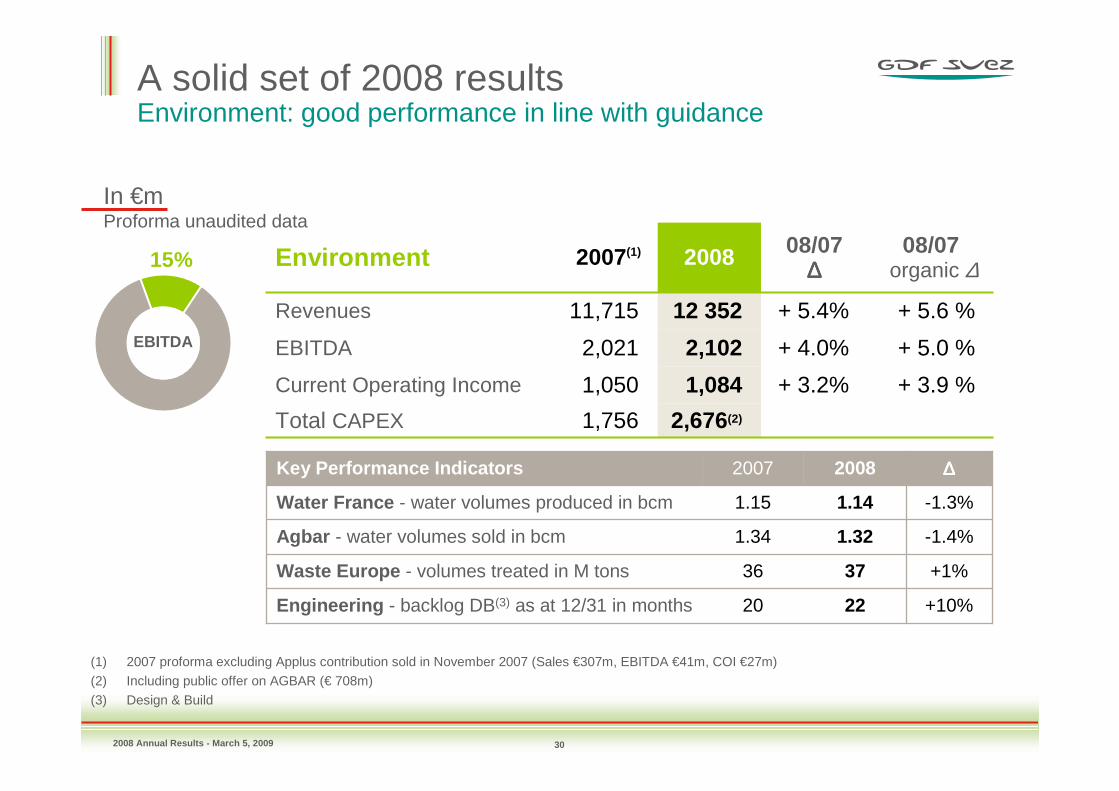
1,756
1,050
2,021
11,715
2007(1)
2,676(2)Total CAPEX
Environment 2008 08/07∆∆∆∆
08/07organic ∆
Revenues 12 352 + 5.4% + 5.6 %
EBITDA 2,102 + 4.0% + 5.0 %
Current Operating Income 1,084 + 3.2% + 3.9 %
A solid set of 2008 resultsEnvironment: good performance in line with guidance
In €mProforma unaudited data
EBITDA
15%
(1) 2007 proforma excluding Applus contribution sold in November 2007 (Sales €307m, EBITDA €41m, COI €27m)
(2) Including public offer on AGBAR (€ 708m)
(3) Design & Build
22
37
1.32
1.14
2008
20
36
1.34
1.15
2007
+10%Engineering - backlog DB(3) as at 12/31 in months
+1%Waste Europe - volumes treated in M tons
-1.4%Agbar - water volumes sold in bcm
-1.3%Water France - water volumes produced in bcm
∆∆∆∆Key Performance Indicators

312008 Annual Results - March 5, 2009
A solid set of 2008 resultsNon-recurring items impacting income from operating activities
(479)(662)Purchase Price Allocation
84415Asset disposals
8,2048,121Income from operating activities
2007 2008
EBITDA 12,539 13,886
Depreciation and amortization (3,695) (4,406)
Concessions (235) (241)
Other (123) (199)
Current Operating Income 7,824 8,561
MtM 29 555
Impairment (122) (811)
Restructuring costs (24) (187)
In €mProforma unaudited data

322008 Annual Results - March 5, 2009
A solid set of 2008 resultsFrom income from operating activities to net income
2,141301Remedies (1)
(1,737)(28)
(2,089)758
o/w current income tax o/w deferred income tax
(1,476)(572)
437
(882)(545)
524
o/w cost of net debt o/w unwinding of discounting adjustments to provisionso/w dividends and others
(911)(1 080)Minority interests
2007 2008
Income from operating activities 8,121 8,204
Financial result (903) (1,611)
Income tax (1,331) (1,765)
Share in the income of associates 646 447
o/w minority interests on remedies (127) (99)
Net income group share 5,754 6,504
In €mProforma unaudited data
(1) Contributions of Distrigaz, SPE and Coriance / Fluxys: capital gains on the disposal of the 12.5% stake in 2008

332008 Annual Results - March 5, 2009
A balanced business model delivering profitable growth
A solid set of 2008 results
Sustained cash flow generation
A strong balance sheet
2008 targets exceeded
Consistent and realistic targets

342008 Annual Results - March 5, 2009
In €bnProforma unaudited data
Operating cash flow
EBITDA Renewals,restructuring,
charges
A sustained cash flow generation
13.913.3
Taxes ∆ WCR
(3.1)
(2.5)
Other
0.5
(0.6)
8.2
Cash flow

352008 Annual Results - March 5, 2009
A sustained cash flow generation Industrial development including targeted acquisitions
In €bn
Proforma unaudited data
IndustrialCapex
Disposals Acquisitions Net Capex
10.5
11.8
(3.6)4.9
7.8
2.7
DevelopmentCapex
MaintenanceCapex
of which: • First Light: €0.7bn• Senoko: €0.5bn• Nogat (NAM): €0.2bn• Teesside: €0.2bn• Ponte de Pedra: €0.2bn• Agbar: €0.7bn
mainly "remedies":• Distrigaz: €2.7bn• Fluxys: €0.2bn• Chehalis : €0.2bn
Net Capex: +53% vs 2007

362008 Annual Results - March 5, 2009
A sustained cash flow generation A competitive and attractive shareholder remuneration policy
(1) Dividends and share buy backs for SUEZ + Gaz de France, including dividends paid to minorities (€ 0.5bn in 2008)(2) Based on : 2008 ordinary dividend (€1.40/share) and share price as at March 3, 2009(3) Share buybacks of Gaz de France (€1.0bn), SUEZ (€0.2bn) and GDF SUEZ (€0.5bn)
Dividends (1) Share buy backs (1)
2007 2008
4.2
6.8
interim div.
1.7
5.1
In €bn – cash based
Proforma unaudited data
No additional share buy back in 2009
Dividend yield
6.1%(2)
3.43.1
1.1
1.7 (3)

372008 Annual Results - March 5, 2009
A balanced business model delivering profitable growth
A solid set of 2008 results
Sustained cash flow generation
A strong balance sheet
2008 targets exceeded
Consistent and realistic targets

382008 Annual Results - March 5, 2009
A strong balance sheet
(1) Including IAS 39
Net debt 12/31/07
Net Capex Return toshareholders
Net debt 12/31/08
Cash flow FX, scope, capital
increase & other
17.3(1)
(8.2)
28.9(1)
6.81.2
11.8
In €bnProforma unaudited data
Net Debt / EBITDA= x2.08

392008 Annual Results - March 5, 2009
In €bn
A strong balance sheetSupported by a rigorous cash flow management strategy
(1) Net of commercial paper (€ 8,7bn)(2) Cash and Cash equivalents (€ 14bn) net of bank overdrafts (€1,3bn)
Cash flowas of 31 Dec. 2008
including 2009 issuances
Debt and credit line maturities for
2009 year end
Debt and credit line maturities for 2010 year end
Expiration ofundrawn credit lines
Debt maturities
Net cash(2)
€17,4bn after 2009 issuances vs €11.3bn at the end of 2008
Undrawn credit lines(1)
5.1 4.4
4.7
12.7
1.2
3.92.9
1.5

402008 Annual Results - March 5, 2009
A balanced business model delivering profitable growth
A solid set of 2008 results
Sustained cash flow generation
A strong balance sheet
2008 targets exceeded
Consistent and realistic targets

412008 Annual Results - March 5, 2009
2008 targets exceeded
Strong A
€30bn over 2008-2010
≥≥≥≥10%
2008 targets
�€11.8bnNet industrial Capex
�
�
Strong ARating
+10.7%
2008 actuals
EBITDA growth

422008 Annual Results - March 5, 2009
A balanced business model delivering profitable growth
A solid set of 2008 results
Sustained cash flow generation
A strong balance sheet
2008 targets exceeded
Consistent and realistic targets

432008 Annual Results - March 5, 2009
EBITDA *EBITDA *
Efficiency planEfficiency plan
Net industrialcapex
over 2008-10
Net industrialcapex
over 2008-10
Financial structureFinancial structure
€30bn
"Strong A" credit rating
20092009 20112011
€650m €1.8bn by 2011
* This objective assumes average weather conditions, no significant regulatory changes and macro economic,brent and electricity prices scenarii at end January 09
Consistent and realistic targets
EBITDA from €17bn to €18bnEBITDA from €17bn to €18bn2009 EBITDA > 20082009 EBITDA > 2008
Underlying assumptions 2009/10/11:Average brent $/bbl: 50/58/62
Electricity baseload Benedelux €/MWh: 52/52/54
Underlying assumptions 2009/10/11:Average brent $/bbl: 50/58/62
Electricity baseload Benedelux €/MWh: 52/52/54

442008 Annual Results - March 5, 2009
2009Interim
dividend
Balance2008
dividend
Consistent and realistic targetsAn attractive shareholder remuneration
Dividends related to 2008:• Ordinary dividend: €1.40 per share
– Interim dividend of €0.80 per share paid on November 27, 2008– Balance of €0.60 to be paid on May 11, 2009
• Special dividend: €0.80 per share– At shareholders’option, payment in shares at a 10% discount to 20 day
average share price before General Meeting*– 0,80€ per share or payment in share to be paid on June 4
November 272008 2009
AGM May H2
€0.80
€0.80
2008 Interim
Dividend
2008 specialDividend
€0.60€0.80
* Minus the balance on ordinary dividend and special dividend

Rigorous and efficient long term development2008 Annual Results
GDF SUEZ
Jean-François Cirelli

462008 Annual Results - March 5, 2009
30
40
50
60
70
80
90
100
Jan-
08
Feb
-08
Mar
-08
Apr
-08
May
-08
Jun-
08
Jul-0
8
Aug
-08
Sep
-08
Oct
-08
Nov
-08
Dec
-08
Jan-
09
Feb
-09
Mar
-09
Q2-
09
Q3-
09
Q4-
09
2010
Germany France Belgium
Lower commodity pricesin the short term
Electricity(baseload - in €/MWh)
Oil(in US$/bbl)
Source: Powernext / EEX / Belpex, forward prices as of 02/23/08 Source: Brent IPE, forward prices as of 02/23/08
0
20
40
60
80
100
120
140
160
Jan-
08
Mar
-08
May
-08
July
-08
Sep
t-08
Nov
-08
Jan-
09
Mar
-09
May
-09
July
-09
Sep
t-09
Nov
-09
Jan-
10
Mar
-10
May
-10

472008 Annual Results - March 5, 2009
15%7%
31%
32%
19%
A balanced and resilient business modelwell positioned to face current market conditions
Breakdown* of 2008 EBITDA
Services
6%
Mostlysecuredrevenue
assets
Energy production sold on the market
Low exposure to change in commodity prices
in the short term
~ 2/3 of EBITDA generated by businesses with low exposureto short term commodity pricefluctuation
Hedging ratio on electricity**
• 2009 ���� ≥ 90%
• 2010 ���� ≥ 60%
Energy sales to end-users
Environment
* Incl. Other: -€354m** Mainly "copper plate" in Europe

482008 Annual Results - March 5, 2009
Attractive market drivers in long term
0
5000
10000
15000
20000
25000
30000
35000
2006 2030
Global demand for LNGin bcm
0
100
200
300
400
500
600
700
800
2006 2015 2030
+ 5.1% p.a.on average
Change in the electricitygeneration mix World
in TWh
OtherrenewablesBiomass and waste
Hydro
Nuclear
Oil
Coal
+ 2.4% p.a.on average
Gas
Source: IEA, World Energy Outlook 2008 – reference scenario

492008 Annual Results - March 5, 2009
Investment programme underpinslong term growth
€0.5bnOthers
€15.4bn
€2.7bn*
€0.6bn
€1.9bn
€2.3bn
€6.3bn
€1.1bn
Gross capex in 08
TOTAL
• Wastewater treatment plants (Cannes, Noumea, Yuelai, etc.)• Incinerators (Sleco, Baviro, etc.)• Composting and sorting plants (Fr., Ger., UK, etc.) • Networks, maintenance capex, etc.
Environment
• London Olympics• Italy: acquisition of co-generation plantsEnergy Services
• LNG terminals: Fos Cavaou • Storage: France, UK, Germany• Maintenance and development of transmission and distribution networks
Infrastructures
• Developments in E&P: Norway (Gjoa), Algeria (Touat)• E&P acquisitions: Egypt, Libya, The Netherlands • ENI gas supply contracts: Italy (4 bcm per annum over 20 years), Germany (option on
2.5 bcm per annum over 11 years), Gulf of Mexico ( 0.9 bcm per annum over 20 years)• Singapore terminal
Global Gas& LNG
• Developments in electricity: UK, Italy, Brazil, US, Singapore• Developments in natural gas: Chile (Neptune)
Energy Europe& International
• Combined-cycle gas plants under construction (Montoir, Cycofos, CombiGolfe)• Renewable energy (wind …)• Ecoconfort services
Energy France
Main investments in 2008Business lines
* Including Agbar takeover

502008 Annual Results - March 5, 2009
Increase in managed generation capacity
Installed electricity capacity*
60 GWo/w 23 ex-Europe
2007
+ 0.6
100 GW
20132008
+ 0.1+ 1.9
+ 5.7 + 0.2
EnergyFrance
Benedelux Europe International Services
68 GWo/w 28 ex-
Europe
Cycofos tests(0.4 GW)
Wind energy
Teesside(1.9 GW)
Senoko (3.3 GW)First Light (1.4 GW)
Astoria (0.6 GW)
9%11%
54%
19%
7%
Renewables and others
Coal
Nuclear
Natural gas
Hydro
* installed capacities at 100%
Target: 100 GW by 2013 and maintain balanced diversi fied generation mix
Of which:• Jirau (3.3 GW)• Estreito (1.1 GW)• Marafiq (2.7 GW)• Ras Laffan (2.7 GW)• Gheco (0.7 GW)• Barka (0.3 GW)• Montoir (0.4 GW)• Combigolfe (0.4 GW)• Flevo (0.9 GW)• Wilhelmshaven (0.8 GW)• …
Of which:• Jirau (3.3 GW)• Estreito (1.1 GW)• Marafiq (2.7 GW)• Ras Laffan (2.7 GW)• Gheco (0.7 GW)• Barka (0.3 GW)• Montoir (0.4 GW)• Combigolfe (0.4 GW)• Flevo (0.9 GW)• Wilhelmshaven (0.8 GW)• …

512008 Annual Results - March 5, 2009
Ongoing diversification of gas supplyand E&P
Gas long term supply portfolio Estimated at end-2008
Norway23%
Algeria11%
Russia14%
Trinidad and Tobago8%
Egypt 6%
Libya 2%
United Kingdom 4%
Netherlands15%
909 TWh
Hydrocarbon production
2007 2008
Others
Norway
Germany
Netherlands
United Kingdom
1%
42.4 Mbep
51.3** Mbep
10%
27%
28%
34%
20%
20%
22%
36%
2%
+ 20%
Middle East-Asia*12%
Others5%
2P reserves 2008: 704 Mboe* including LT tolling agreements** Including 1.1 Mboe from assets acquired from Nam (Netherlands)

522008 Annual Results - March 5, 2009
Efficio: a performance plan to enhance profitability
Jean-François Cirelli / General ManagementJean-François Cirelli / General Management
Strong experience in performance programmewithin the Group
Strong experience in performance programmewithin the Group
over 80 people in charge of performanceenhancing actions in Divisions and Business Lines
over 80 people in charge of performanceenhancing actions in Divisions and Business Lines
Over 400 action plans identified and definedOver 400 action plans identified and defined
Emmanuel HeddeDirector of Integration, Synergies & Performance
Emmanuel HeddeDirector of Integration, Synergies & Performance
Cross-businessprojects
Cross-businessprojects
Finance, HumanRessources, IT,
Procurement functions
Finance, HumanRessources, IT,
Procurement functions
Performances byother functions
Performances byother functions
1 32
Operating performanceOperating
performance
4
Europe & Inter. Jean-François CoralloFrance Olivier FeistServices Frédéric De ParisotGlobal Gas & LNG Bernard BrelleInfrastructures Didier EngelsEnvironment Alex Boursier
Executive CommitteeExecutive Committee

532008 Annual Results - March 5, 2009
2011 target confirmedAdditional effort for 2009
(*) : Excluding implementation costs
EFFICIO TARGET
2008 2009 2010 2011
€650m
€1,100m
€1,800m
Previous forecast New forecast
€500m
EBITDA impact*in €m
New initiatives• Improved industrial
performance
• Marketing efficiency
• Pooling, etc.
€35m
• Synergies already secured

542008 Annual Results - March 5, 2009
2011 target confirmedContribution from all businesses
Estimated contributionsin % of 2011 target
Action plan progressin % of 2011 target
EnergyEurope & International30%
Infrastructures8%
Energy France12%
Energy Services6%
Global Gas & LNG8%
Environment12%
Support Functionsand cross-business
projects24%
Target committed,actions identified
78%
Targetcommitted
5%
Estimated target17%

552008 Annual Results - March 5, 2009
Conclusion
We are confident in long term prospects
In the short term,we have strong assets to face the crisis

Conclusion2008 Annual Results
GDF SUEZ
Gérard Mestrallet

572008 Annual Results - March 5, 2009
A business model combining performanceand Economic & Corporate Social Responsibility
* Capex and acquisitions, net of disposals** Personnel expenses
� ca 32,000 new hires in 2008 - o/w ca 13,000 in France and ca 3,700 in Belgium
� Since 2007, all Group's 200,000 employees have benefite d from a worldwidefree share distribution program
In 2008Unaudited proforma data
Capex*
€11.8bn
Dividends
€5.1bn- o/w €1.7bn
extraordinary- o/w €0.5bn
to minorities
Personnel**
€11.0bn

582008 Annual Results - March 5, 2009
Conclusion
2008: solid operationnal performance and one ofthe healthiest balance sheets in the sector
Strategic vision and industrial program unchanged
The crisis was anticipated: liquidity enhancedand Efficio program launched in September 2008
The direction for 2011 has been set
GDF SUEZ: a leadership strategy for the long term

APPENDICESGDF SUEZ

602008 Annual Results - March 5, 2009
Appendices - Index
Corporate Governance 61
Financial appendices 64- Change in scope and FX 65- Balance sheet, P/L and cash flow statement 71- Financial indicators 76- Tax position 92- Dividend 94- Accounting impacts from the merger 96- 2007 proforma 98- Credit appendices 102
Business appendices 110- Nuclear 114- Sustainable Development 118- CO2 position 122- Renewable Energy 125- Market conditions 128- Energy France Business Line 131- Energy Europe & International Business Line 138- Global Gas & LNG Business Line 154- Infrastructures Business Line 162- Energy Services Business Line 165
Pages
Financial appendices
Shareholding

622008 Annual Results - March 5, 2009
Change in number of shares
2,111,140Capital increase
2,193,643,820Existing shares at 12/31/08
2,191,532,680Existing shares at 07/22/08
* Proforma 2008, excluding treasury stock
Average number of shares 2,161 millions*
Corporate governance

632008 Annual Results - March 5, 2009
Shareholding structure at the end ofDecember 2008
5.5%5.3%Groupe Bruxelles Lambert (GBL)
% of voting rights (2)
% of share capital (1)
-2.2%Treasury stocks
0.7%0.7%Sofina
50.3%49.3%Others
1.1%1.1%CNP Assurances Group
1.2%1.2%Areva
2.0%1.9%CDC Group
2.7%
35.6%
2.8%
36.4%
Employee shareholders
French State
(1) 2,194 million shares listed at 12/31/2008(2) 2,145 million voting rights as at 12/31/2008
Corporate governance

FINANCIAL APPENDICESGDF SUEZ

Financial appendices
Change in scope and FXChange in scope and FX

662008 Annual Results - March 5, 2009
2008 / 2007: main changesin consolidation scope (1/3)
AcquisitionsChanges in method
Gasag (Energy Benelux Germany)Proportional consolidation (31.57%) until 12/31/07Equity method (31.57%) as of 01/01/08
Gpe Vendite (Energy Europe)Equity method (40%) from 01/01/07 until 06/30/07Proportional consolidation (40%) from 06/30/07until 09/30/07Full consolidation (60%) as of 10/01/07
Sohar (Energy International)Equity method accounting (50%) until 05/17/07Full consolidation (55%) as of 05/17/07
EFOG (Global Gas & LNG)Equity method (22.5%) until 02/01/07Proportional consolidation (22.5%) as of 02/01/07
Electrabel Full consolidation – Ownership from 98,6% to 100% since07/09/07Eole Generation (ex-NASS & WIND) (Energy France)Full consolidation (100%) since 03/10/08Sté de la Haute Lys (Energy France) Full consolidation (100%) since 12/11/07Compagnie du Vent (Energy France) Full consolidation (56.8%) since 12/31/07Erelia (Energy France)Full consolidation (95%) since 11/05/07Sté de Production d’électricité de Montoir(Energy France)Full consolidation (100%) since 01/01/08Fraganlys (Energy France) Full consolidation (100%) since 01/01/08Teesside (Energy Europe)Full consolidation(100%) since 04/01/08 Depomures (Energy Europe) Full consolidation (59%) since 01/01/08Elettrogreen (Energy Europe) Full consolidation (82%) since 01/01/08
Change in scope and FX
672008 Annual Results - March 5, 2009
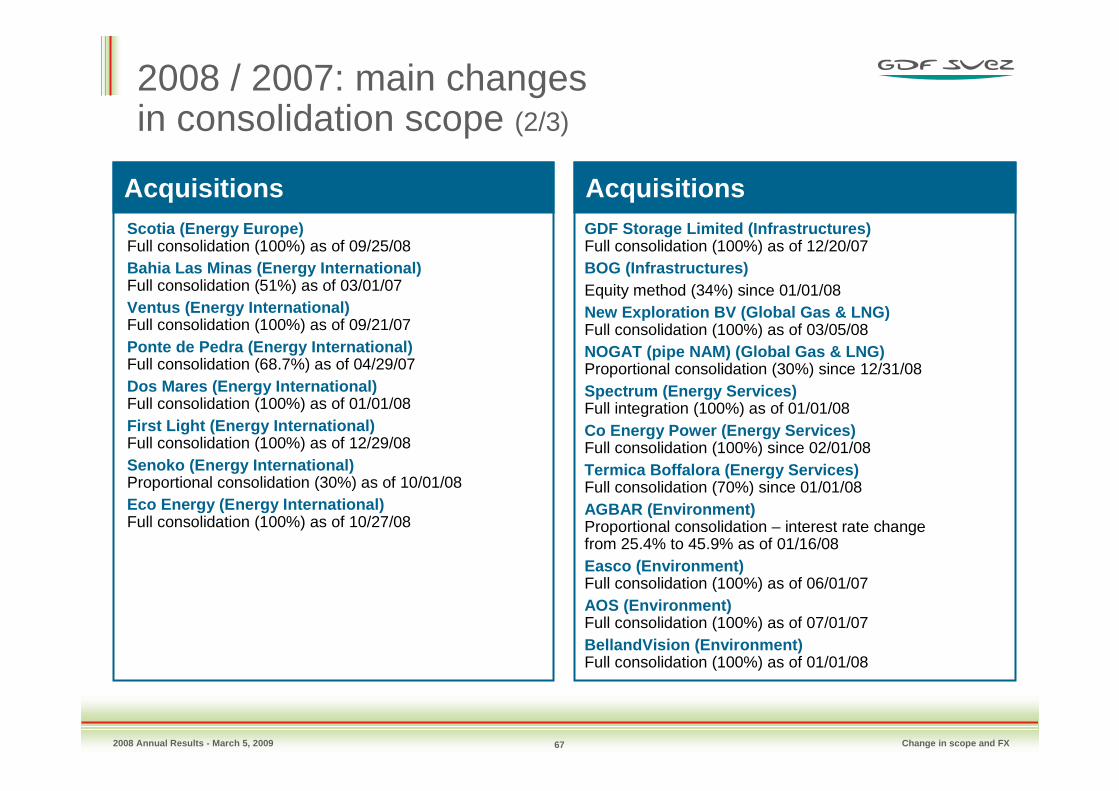
2008 / 2007: main changesin consolidation scope (2/3)
AcquisitionsAcquisitionsGDF Storage Limited (Infrastructures)Full consolidation (100%) as of 12/20/07BOG (Infrastructures) Equity method (34%) since 01/01/08New Exploration BV (Global Gas & LNG)Full consolidation (100%) as of 03/05/08NOGAT (pipe NAM) (Global Gas & LNG)Proportional consolidation (30%) since 12/31/08Spectrum (Energy Services)Full integration (100%) as of 01/01/08Co Energy Power (Energy Services)Full consolidation (100%) since 02/01/08Termica Boffalora (Energy Services)Full consolidation (70%) since 01/01/08AGBAR (Environment)Proportional consolidation – interest rate changefrom 25.4% to 45.9% as of 01/16/08Easco (Environment)Full consolidation (100%) as of 06/01/07AOS (Environment)Full consolidation (100%) as of 07/01/07BellandVision (Environment)Full consolidation (100%) as of 01/01/08
Scotia (Energy Europe)Full consolidation (100%) as of 09/25/08Bahia Las Minas (Energy International)Full consolidation (51%) as of 03/01/07Ventus (Energy International)Full consolidation (100%) as of 09/21/07Ponte de Pedra (Energy International)Full consolidation (68.7%) as of 04/29/07Dos Mares (Energy International)Full consolidation (100%) as of 01/01/08First Light (Energy International)Full consolidation (100%) as of 12/29/08Senoko (Energy International)Proportional consolidation (30%) as of 10/01/08Eco Energy (Energy International)Full consolidation (100%) as of 10/27/08
Change in scope and FX

682008 Annual Results - March 5, 2009
2008 / 2007: main changesin consolidation scope (3/3)
DisposalsRemedies
Distrigaz: disposal on 10/31/08Contribution until 10/31/2008 identified on a specific P&L line « Remedies » in 2007 and 2008 for 100%of the result.Gain on disposal of € 1.7bn identified on the same P&L line.
SPE Contribution identified on a specific P&L line « Remedies »in 2007 and 2008 (25.5%)
Coriance (Energy Services)Contribution identified on a specific P&L line « Remedies »in 2007 and 2008 (100%).
Fluxys (Infrastructures)Contribution in associates at 100% until 06/30/2008 and at44.8% since 07/01/2008. Gain on disposal of € 0.2bn identified on a specific P&L line « Remedies ».
Calidda (Energy International)Full consolidation until 06/29/07
Chehalis (Energy International)Full consolidation until 09/30/08
Applus (Environment)Proportional consolidation until 11/30/07
Change in scope and FX

692008 Annual Results - March 5, 2009
Impact of USD evolution
The average rate applies to the income statement and to the statement of cash flows
The closing rate applies to the balance sheet
144Total equity
(59)
(364)
∆∆∆∆ 08/07
EBITDA
Revenue
In €m
+ 5.8%∆ Closing rate 2008/2007
0.68
0.72
- 6.8%
0.73
0.68
USD
Closing rate at 12/31/07
Closing rate at 12/31/08
∆ aver. rate 2008/2007
2007 average rate
2008 average rate
USD vs EUR
0,60
0,65
0,70
0,75
0,80
0,85
12/31/2007 12/29/2008
Change in scope and FX

702008 Annual Results - March 5, 2009
Impact of GBP evolution
GBP vs EUR
The average rate applies to the income statement and to the statement of cash flows
The closing rate applies to the balance sheet
(343)Total equity
(79)
(515)
∆∆∆∆ 08/07
EBITDA
Revenue
In €m
- 23.0%∆ Closing rate 2008/2007
1.36
1.05
- 14.1%
1.46
1.26
GBP
Closing rate at 12/31/07
Closing rate at 12/31/08
∆ aver. rate 2008/2007
2007 average rate
2008 average rate
1
1,05
1,1
1,15
1,2
1,25
1,3
1,35
1,4
12/31/2007 12/29/2008
Change in scope and FX

Financial appendices
Balance sheet,P/L and cash flow statement

722008 Annual Results - March 5, 2009
Summary balance sheet
TOTAL ASSETS
ASSETS 12/31/08 LIABILITIES 12/31/08
NON CURRENT ASSETS 115.2Equity, group share 57.7
Minority interests 5.1
CURRENT ASSETS 52.0 TOTAL EQUITY 62.8
o/w financial assets valued at fair value through profit/loss
0.8 Provisions 14.8
o/w cash & equivalents 9.0 Financial debt 38.8
Other liabilities 50.8
167.2 TOTAL LIABILITIES 167.2
In €bn
Balance sheet,P/L and cash flow statement

732008 Annual Results - March 5, 2009
Details of some assets and provisions
Loans toassociates €3.7bn
€10,1bn assets at 12/31/08
Assetsavailable
for sale€3.3bn
Stakes inassociates€3.1bn
Others€2.7bn
Recyclingand storage€4.4bn
Dismantling€3.5bn
Pensions€4.2bn
€14.8bn provisions at 12/31/08
Balance sheet,P/L and cash flow statement

742008 Annual Results - March 5, 2009
Summary income statement
2,141301Remedies(911)(1 080)Minority interests
447646Share in net income of associates
(99)(127)o/w minority interests on remedies
6,5045,754Net income – group share
(358)297MtM, impairment, restructuring and disposals
(14,394)(13,942)Other operating incomes and expenses
(11,015)(10,576)Personnel costs(44,198)(34,776)Purchases
13,88612,539EBITDA
(1,765)(1,737)
(28)
(1,331)(2,089)
758
Income taxo/w current income tax o/w deferred income tax
(1,611)(1,476)
(572)437
(903)(882)(545)
524
Financial result (expense)o/w cost of net debt o/w unwinding of discounting adjustments to provisionso/w dividends and others
8,2048,121Income from operating activities
8,5617,824Current operating income
(4,885)(4,110)Amortization depreciation and provisions
83,05371,228Revenues20082007Pro forma unaudited data
In €m
Balance sheet,P/L and cash flow statement

752008 Annual Results - March 5, 2009
Cash flow statement
3,110Remedies
3,084CASH FLOW FROM FINANCIAL ACTIVITIES
(14,176)CASH FLOW FROM INVESTMENT ACTIVITIES
7,726CASH FLOW FROM OPERATING ACTIVITIES
9,049CASH AND CASH EQUIVALENTS AT THE END OF THE PERIOD
(54)TOTAL CASH FLOWS FOR THE PERIOD
311Impact of currency, accounting practices and other
8,995CASH AND CASH EQUIVALENTS AT THE BEGINNING OF THE P ERIOD
(5,137)(1,663)10,409(1,626)
261840
Dividends paidShare buy backBalance of reimbursement of debt / new debtInterests paid on financial activitiesCapital increaseOther cash flows
(10,498)(4,628)
950
Net tangible and intangible investmentsFinancial investmentsDisposals and other investment flows
13,287(2,531)(3,030)
Gross cash flow before financial loss and income taxIncome tax paid (excl. income tax paid on disposals)Change in operating working capital
12/31/08Pro forma unaudited dataIn €m
Balance sheet,P/L and cash flow statement

Financial appendices
Financial indicators

772008 Annual Results - March 5, 2009
* Total sales revenue, including inter-company services, came to 22 394 m€ for the Global Gas and LNG business line and5 498 m€ for the Infrastructures business line
Breakdown of revenues (by destination)
In €m
+19.8%+19.6%2,0641,725o/w South America
+17.8%+24.2%1,3461,084o/w Asia & Middle East
+18.1%+8.9%3,9403,618o/w North America
+17.5%+16.6%83,05371,228TOTAL
+5.6%+2.7%12,35212,022Environment
+8.8%+8.5%13,99312,894Energy Services
+34.5%+37.8%896*650Infrastructures
+35.7%+33.7%10,827*8,096Global Gas & LNG
+18.4%+14.1%7,6236,682International Division
+23.8%+32.4%8,7496,609Europe division
+22.2%+18.9%14,15611,907Benedelux division
+21.6%+21.2%30,52825,198BEEI
+16.3%+16.9%14,45712,368Energy France
∆ Organic∆ 08/0720082007Pro forma unaudited data
Financial indicators

782008 Annual Results - March 5, 2009
Breakdown of 2008 revenues*: €83.1bn
Breakdown of revenues by business line
Energy Europe& International
€30.5bn
Infrastructures€0.9bn
Energy France€14.5bn
Energy Services€14.0bn
Global Gas & LNG€10.8bn
Environment€12.4bn
EnergyInternational
€7.6bn
EnergyBenedelux
€14.2bn
* unaudited proforma data – Adjusted preliminary PPA
15%
17%
9%
17%13%
1%
Energy Europe€8.7bn 11%
17%
Financial indicators

792008 Annual Results - March 5, 2009
Revenues by geographic region
In €m
+ 11.4%30,34527,230France
+ 16.6%71,29861,135Sub-total Europe
+ 7.7%5,0184,659North America
+ 8.4%1,2671,169Other European countries
+ 20.4%26,65822,136Other EU countries
+ 14.7%43,37237,830Sub-total France-Belgium
+ 12.9%831737Africa
+ 16.6%83,05371,228TOTAL
+ 19.0%2,6242,204South America
+ 31.7%3,2832,493Asia, Middle-East and Oceania
+ 16.0%76,31665,794Sub-total Europe & North America
+ 22.9%13,02710,600Belgium
08/07 ∆20082007Pro forma unaudited data
Financial indicators

802008 Annual Results - March 5, 2009
Breakdown of EBITDA
In €m
+ 15.2%+ 16.0%1,004865o/w South America
- 5.6%- 6.3%268286o/w Asia & Middle East
+ 18.3%+ 10.4%526476o/w North America
--(354)(206)Others
+12.5%+ 10.7%13,88612,539TOTAL
+ 4.9%+ 2.0%2,1022,061Environment
+ 3.4%- 4.4%904946Energy Services
+ 1.0%+ 1.1%2,8782,847Infrastructures
+ 60.5%+ 58.5%3,7152,345Global Gas & LNG
+ 9.7%+ 7.5%1,7981,673International division
+ 11.4%+ 19.1%844709Europe division
+ 2.2%- 2.5%1,7521,796Benedelux division
+ 6.8%+ 5.2%4,3954,178BEEI
- 40.1%- 33.1%246368Energy France
∆ Organic∆ 08/0720082007Pro forma unaudited data
Financial indicators

812008 Annual Results - March 5, 2009
+ 17.8%+ 17.5%859731o/w South America
- 7.1%- 8.4%189207o/w Asia & Middle East
+ 23.1%+ 14.9%385335o/w North America
--(539)(329)Others
+ 12.6%+ 9.4%8,5617,824TOTAL
+ 3.9%+ 0.7%1,0841,077Environment
+ 6.9%- 6.0%586624Energy Services
+ 2.7%+ 2.3%1,8911,848Infrastructures
+ 103.7%+ 97.7%2,3521,189Global Gas & LNG
+ 11.4%+ 8.6%1,3971,286International division
+ 8.1%+ 12.6%513456Europe division
- 15.8%- 19.6%1,1871,477Benedelux division
- 1.5%- 3.8%3,0963,218BEEI
- 54.0%- 53.6%92198Energy France
∆ Organic∆ 08/0720082007Pro forma unaudited data
Breakdown of current operating income
In €m
Financial indicators

822008 Annual Results - March 5, 2009
Divisional reconciliation between EBITDAand current operating income
1,286
(6)
(381)
1,673
BEEIInternational
456
(20)
(233)
709
BEEIEurope
(235)-(208)(26)Concessionsrenewal expenses
624
(13)
(6)
(277)
946
EnergyServices
1,077
(22)
(755)
2,061
Environ-ment
(329)
(73)
16
(66)
(206)
Others
1,848
77
(1 077)
2,847
Infrastructures
1,189
(755)
(400)
2,344
Global Gas& LNG
1,477
(9)
(311)
1,796
BEEIBenedelux
7,824198CURRENT OPERATING INCOME
(123)Share based payments
(662)26PurchasePrice Allocation
(3,695)(196)Depreciationandamortization
12,539368EBITDA
2007EnergyFrance
In €mPro forma unaudited data
Financial indicators

832008 Annual Results - March 5, 2009
Divisional reconciliation between EBITDAand current operating income
1,397
(8)
(394)
1,799
BEEIInternational
513
(1)
(7)
(324)
844
BEEIEurope
(241)(213)(27)Concessionsrenewal expenses
586
(18)
(1)
(271)
904
EnergyServices
1,084
(28)
(778)
2,102
Environ-ment
(539)
(130)
(2)
(54)
(354)
Others
1,891
105
(1,092)
2,878
Infrastructures
2,351
(782)
(581)
3,715
Global Gas& LNG
1,187
(12)
(553)
1,752
BEEIBenedelux
8,56192CURRENT OPERATING INCOME
(199)(1)Share based payments
(479)206PurchasePrice Allocation
(4,406)(359)Depreciationandamortization
13,886246EBITDA
2008EnergyFrance
In €mPro forma unaudited data
Financial indicators

842008 Annual Results - March 5, 2009
Breakdown of share in the income of associates
(10)2Others
447646Share in net income of associates
3423Environnement
(1)16Energy Services
131136Infrastructures
4649Global Gas & LNG
175365o/w Intermunicipalities
247420Energy Europe and International
20082007
In €mPro forma unaudited data
Financial indicators

852008 Annual Results - March 5, 2009
Breakdown of remedies contributions
En M€
82SPE Contribution
2 141301Remedies
163naGain on sale - Fluxys
232299Distrigas contribution
1 738naGain on sale – Distrigas
20082007
Financial indicators
Pro forma unaudited data

862008 Annual Results - March 5, 2009
Reconciliation between EBITDA and operating cash flow
In €m
13,28712,451OPERATIONAL CASH FLOW
(170)221Dividends and others
(241)(234)Concessions renewal expenses
(188)(75)Restructuring costs cashed out
13,88612,539EBITDA
20082007Pro forma unaudited data
Financial indicators

872008 Annual Results - March 5, 2009
Breakdown of investments
6,422
1,398
1,013
254
760
814
772
227
449
1,448
736
Development and financial investments
1,45759Others
8,9692,547TOTAL
1,756743Environment
473219Energy Services
1,509749Infrastructures
82612Global Gas & LNG
85584International division
385158Europe division
834385Benedelux division
2,075627BEEI
873137Energy France
2007Maintenance investments
Pro forma unaudited data
In €m
Financial indicators

882008 Annual Results - March 5, 2009
Breakdown of investments
12,733
552
2,012
383
989
2,247
3,197
1,758
650
5,605
946
Development and financial investments
61765Others
15,4212,689TOTAL
2,676664Environment
603220Energy Services
1,901912Infrastructures
2,28942Global Gas & LNG
3,314117International division
1,937179Europe division
992342Benedelux division
6,243638BEEI
1,094148Energy France
2008Maintenance investments
Pro forma unaudited data
In €m
Financial indicators

892008 Annual Results - March 5, 2009
Detail of 2008 investments
€ 15.4bn
4.9
7.8
2.7
Acquisitions
Development
Maintenance
• VPP in Italy (€ 1.2bn) • E&P NAM (€ 0.8bn) • GRTGaz (€0.4bn) • Gjoa (€ 0.4bn)• Coal plants in Germany (€ 0.2bn)• CCGT in the Netherlands (€ 0.2bn)• Estreito (€ 0.2bn)• Glow (€ 0.2bn) • GRDF (€0.2bn)
• Storengy (€ 0.2bn)• San Salvador (€ 0.1bn)• Neptune (€ 0.1bn)• Montoir (€0.1bn)• Fos Cavaou (€ 0.1bn)• E&P Lybia (€ 0.1bn)• Other investments < € 0.1bn each
In €bn
• FirstLight (€ 0.7bn)• Senoko (€ 0.5bn)• Tricastin (€ 0.3bn)• Teesside (€ 0.2bn)• Nogat (€ 0.2bn) • Ponte de Pedra (€ 0.2bn)• Agbar minorities (€ 0.7bn
• Fox (€ 0.2bn)• Utility Services Group (€ 0.2bn)• Boone (€ 0.2bn)• Eole generation (€ 0.1bn)• Co Energy (€ 0.1bn)• Other investments < € 0.1bn each
Pro forma unaudited data
Financial indicators

902008 Annual Results - March 5, 2009
Reconciliation between 2008 published by SUEZ Environment and its GDF SUEZ contribution
25
(12)
∆
1,084
12,352
2008in GDF SUEZ contribution
2008 published bySUEZ environment
Revenues 12,364
Current operating income 1,059
Intercompanies operationsIntercompanies operations
Share – basedpayments (IFRS2)
accounted for at SE level
Share – basedpayments (IFRS2)
accounted for at SE level
In €mPro forma unaudited data
Financial indicators

912008 Annual Results - March 5, 2009
Focus on the €1bn share buy back program announced on September 1rst, 2008
34.8
12.4
432
1,000
Share buy back achieved at the end of 2008 (in million euros)
Average price (in € / share)
Number of shares bought back (in millions)
Initial share buy back target (in million euros)
Financial indicators

Financial appendices
Tax position

932008 Annual Results - March 5, 2009
Tax position
* Excluding disposals and impairment
In €m
25.1%19.5%Adjusted effective tax rate*
(28)758Deferred income tax
6,5937,219Consolidated income before taxand share in associates
26.8%
(1,737)
(1,765)
20082007
Effective tax rate
Current income tax
Consolidated income tax
(2,089)
18.4%
(1,331)
Pro forma unaudited data
Tax position

Financial appendices
Dividend

952008 Annual Results - March 5, 2009
Focus on payment of special dividend
� At shareholders’option, payment of the special dividend of 0,80€/share in share at a 10% discount to 20 day average share price before Gener al Meeting minus the balance on ordinary dividend and special dividend
� Indicative agenda for payment of special dividend:
4 May1st April 09
Reference period for the calculation of the 10% discount on the opening
prices average
Reference period for the calculation of the 10% discount on the opening
prices average
11 May
Payment of balance on
ordinary dividend
22 May
Decision period to exercise option
20 trading days
1 business
day
11 business days
4 June
Payment ofspecial
dividend
7 business days
6 May
2trading days
Decision of AGM
- Removal of coupon- Start of decision period
for special dividend
Dividend

Financial appendices
Accounting impacts from the merger

972008 Annual Results - March 5, 2009
Temporary allocation of goodwill at the end of 2008
In €bn
(1) Financial assets, associates, inventories(2) Financial liabilities
40.2
24.4
15.8
13.7
3.6
0.8
(0.1)
2.6
40.2 40.2
36.4
3.8
(7.5)11.4
28.8
Tandgible assets Intangible assets Other assets (1) Oth er liabilities (2) Provisions Deferred tax liabilities
Average depreciation period estimated at
18.2 years
Of which replacement provision on concessive gas distribution
in France 4.3
Net assets at historical
cost
Residualgoodwill
Net assets at fair value
Initial goodwill
Accounting impacts from the merger

Financial appendices
2007 proforma

992008 Annual Results - March 5, 2009
2007 proforma data
-9371,22871,321TOTAL
12,02212,022Environment
12,89412,893Energy Services
-93650743Infrastructures
8,0968,096Global Gas & LNG
6,6826,682International Division
6,6096,609Europe division
11,90711,907Benedelux division
25,19825,197BEEI
12,36812,368Energy France
AdjustmentsNew 2007 proforma data2007 proforma data released at the
11/26/08 Investor DayProforma unaudited data
Revenues in €m
2007 proforma

1002008 Annual Results - March 5, 2009
2007 proforma data
AdjustmentsNew 2007 proforma data2007 proforma data released at the
11/26/08 Investor DayProforma unaudited data
2,0612,061Environment
+1012,53912,529TOTAL
(206)(204)Others
-3946949Energy Services
+112,8472,836Infrastructures
2,3452,344Global Gas & LNG
1,6731,673International Division
709709Europe division
1,7961,796Benedelux division
4,1784,178BEEI
+3368365Energy France
EBITDA in €m
2007 proforma

1012008 Annual Results - March 5, 2009
2007 proforma data
AdjustmentsNew 2007
proforma data
2007 proforma data released at the
11/26/08 Investor DayProforma unaudited data
1,0771,077Environment
-987,8247,922TOTAL
-7(329)(322)Others
624624Energy Services
+531,8481,795Infrastructures
-2491,1891,438Global Gas & LNG
-11,2861,287International Division
+15456441Europe division
+11,4771,476Benedelux division
+153,2183,204BEEI
+93198105Energy France
COI in €m
2007 proforma
• Increase in amortization on some assets : change to a graduated amortisation versus linear
Main explanations
• Other reallocations between business line
• Fine-tuning of hypothesis

Appendices
Credit appendices

1032008 Annual Results - March 5, 2009
(1) Estimated proforma, (2) Without IAS 39(3) Included INC bank over draft
GDF SUEZ situation
4.87%
28.9 Mds€
+0.5 Md€
12.7 Mds€
41.1 Mds€
62.8 Mds€
46.1%
12/31/2008
Post recent issues
ND
15.8 Mds€
-0.6 Mds€
8.6 Mds€
25.0 Mds€
67.0 Mds€
23.6%
31/12/2007 (1)
Gearing
Total equity
Gross Debt(2)
Net cash position(3)
IAS 39
Net debt
Average cost of gross debt
Annexes credits

1042008 Annual Results - March 5, 2009
(*) without IAS 39 (+€0.5bn) and bank over draft (€1.3bn )
Other bankborowings 10
In bn€
Split of gross debt*
Leasing 1.5Drawn creditlignes1.1
BT/CP 8.7
Bonds 19.8
€41bn
Annexes credits

1052008 Annual Results - March 5, 2009
Debt maturity profile*
Proforma GDF SUEZ
Gross debt total41€bn
Gross debt total41€bn
Average net debt maturity: 5.8 yearsAverage net debt maturity: 5.8 years
CP : 3.5
2009 2010 2011 2012 2013 2014 2015 2016and beyond*
13
3.4
1.4
4.12.6 2.8 2.7
11.1
CP : 0.1
In €bn
Short-term drawings on confirmed long-term credit l ines are classifiedat the final maturity of the credit line
Average gross debt maturity: 8 years
Annexes credits
*Post recently issues(*) without IAS 39 (+€0.5bn) and bank over draft (€1.3bn )
8.6 BT / CP
0.1BT / CP

1062008 Annual Results - March 5, 2009
Debt breakdown by rate and currency
(1) Excluding IAS 39
Euro63%
USD23%
Others13%
GBP1%
Floating rates25%
Fixed rates66%
Net debt (1)
Capped rates9%
Annexes credits

1072008 Annual Results - March 5, 2009
A large scope of financing instruments on different markets
Amount Maturity S&P Moody’s Issuer
EMTN Programme €15bn A Aa3 GDF SUEZ or
Electrabel
French CP €5bn A-1 P-1 GDF SUEZ
US CP USD 3bn A-1 P-1 GDF SUEZ
Belgian CP €6bn P-1 Electrabel
Syndicated facilities
€4.5bn€3bn
€1.4bn€1bn
2012201220122014
A
n.a.
Aa3Aa3A2A2
GDF SUEZGDF SUEZElectrabelElectrabel
Other facilities €2.5bn n.a. n.a. GDF SUEZElectrabel
Annexes credits

1082008 Annual Results - March 5, 2009
Bonds of the Group
Annexes credits
Aucune
Aucune
SIX
Luxembourg
Luxembourg
Luxembourg
Luxembourg
Luxembourg
Luxembourg
Luxembourg
Luxembourg
Luxembourg
Luxembourg
Luxembourg
Luxembourg
SIX
Luxembourg
Luxembourg
Luxembourg
Luxembourg
Luxembourg
Aucune
Euronext ParisBourse de Luxembourg
Euronext ParisBourse de Luxembourg
Listing market
FR001071820518 00005/02/201405/02/20093m+ 120bpJPYGDF SUEZ*
FR001069719315 00018/12/202318/12/20083,180%JPYGDF SUEZ*
CH004850687497519/12/201219/12/20083,500%CHFGDF SUEZ*
FR001072170470011/02/202111/02/20096,125%GBPGDF SUEZ*
FR001068004150030/10/202830/10/20087,000%GBPGDF SUEZ*
FR001071818975023/02/201523/02/20095,000%EURGDF SUEZ*
FR00107094511 00018/01/202116/01/20096,375%EUR GDF SUEZ*
FR00107092791 50018/01/201616/01/20095,625%EURGDF SUEZ*
FR00107092611 75016/01/201216/01/20094,375%EURGDF SUEZ*
FR00106781851 20024/01/201924/10/20086.875%EURGDF SUEZ*
FR00106781511 40024/01/201424/10/20086,250%EURGDF SUEZ*
FR000047423150026/04/201024/04/20033m + 60bpCZKSFSA *
FR00004757581 00024/06/202324/06/20035,750%EURGIE
FR000047105430026/11/201226/11/20025,500%EURGIE*
BE093426053160010/04/201510/04/20084,750%EURElectrabel
CH003584489034022/12/201427/12/20073,250%CHFBelgelec
FR001046364640003/05/201103/05/20073m +12,5bpEURBelgelec*
FR000047573365024/06/201024/06/20034,250%EURBelgelec
FR00004958481 22013/10/200913/10/19995,875%EURBelgelec
FR000048820750420/02/200920/02/20025,500%EURBelgelec
FR000047574175024/06/201524/06/20035,125%EURBelgelec
FR00100695343 000 26/03/200926/03/20040,658%JPYGDF
FR0000472334750 19/02/201819/02/20035,125%EurosGDF
FR00004723261 250 19/02/201319/02/20034,750%EurosGDF
ISIN codeOutstanding
amount (curency) (million)
MaturityIssue dateCouponCurrenc
yIssuer
* Emissions réalisées dans le cadre du programme EMTN de 15 milliards d’euros

1092008 Annual Results - March 5, 2009
New Group ratings
GDF SUEZ rating has been confirmed once the merger was completedin July 2008
Electrabel rating is on a stand alone basis
Ratings Moody’s S&P
GDF SUEZ SAAa3/P-1
(stable outlook)A/A-1
(positive outlook)
ElectrabelA2/P1
(stable outlook)n.a.
Annexes credits

BUSINESS APPENDICESGDF SUEZ

1112008 Annual Results - March 5, 2009
GDF SUEZ: generation capacity Total installed capacity as of 12/31/2008
At 100% in MW In operation Under construction TOTAL
Benedelux 18,512 1,989 20,501
France* 6,482 1,146 7,628
Other Europe 12,840 825 13,665
Energy International 28,324 16,259 44 583
Energy Services 2,282 175 2,457
TOTAL 68,441 20.394 88.835
* Including Cycofos currently under testing period
Business Lines

1122008 Annual Results - March 5, 2009
GDF SUEZ: generation capacity By fuel
Nuclear
Coal
Natural gas
Hydro
Biomassand biogas
Wind
Other non-renewables
Breakdown of installed capacity (at 100%) Breakdown of installed capacity (group share*)
Generation output (at 100%) Generation output (group share*)
9%
10%
54%
19%
1%5%
2%11%
11%
50%
21%
1% 4%2%
17%
12%
50%
18%
1%1%1%
20%
12%
46%
19%
1%1%1%
68.4 GW 57.2 GW
276 TWh 238 TWh
*% of consolidation for globely et proportionally consolidated afiliates and holding stakes for equity consolidated
Business Lines

1132008 Annual Results - March 5, 2009
GDF SUEZ: generation mix By geographic area
Breakdown of installed capacity (at 100%) Breakdown of installed capacity (group share)
Generation output (at 100%) Generation output (group share)
27%
12%
19%
10%
15%
17%
32%
14%19%
11%
14%
10%
32%
11%
18%
8%
16%
15%
36%
13%17%
8%
15%
11%
Benedelux
France
Other Europe
North America
Latin America
Middle EastAsia-Pacific
68.4 GW 57.2 GW
276 TWh 238 TWh
Business Lines
Appendices
Nuclear

1152008 Annual Results - March 5, 2009
Know-how and expertise right along the nuclear value chain and across the Group’s various business lines
EngineeringEngineering ConstructionConstruction DismantlingDismantling
Power station cycle
Operations
Maintenance
Power station/Nuclear site
Mineral extractionMineral extraction Preparation of fuel
Preparation of fuel
Managing spent fuel
Managing spent fuel
Fuel cycle
Treatment of fuelTreatment of fuel
Energy Europe & InternationalBusiness Line
Energy France Business Line
Energy Services Business Line
Our experts: Axima, Corys, Coyne&Bellier, Electrabel, Endel, Fabricom-GTI,Itena, Laborelec, Synatom, Tecnubel, Tractebel Engineering
Nuclear

1162008 Annual Results - March 5, 2009
Nuclear safety: our absolute priority
High-level safety culture • Protection of employees, the population and the environment• Present at all stages (design, construction, operation, dismantling)
Continuous improvement process • Objectives and associated action plans• Self-evaluation • External audits (WANO Peer Reviews)
Permanent appraisals by nuclear authorities• Periodic safety services every ten years• OSART audits by the International Atomic
Energy Agency (IAEA)
���� Tihange (2007/09) and Doel (2010)
Nuclear

1172008 Annual Results - March 5, 2009
The Group’s human skills in nuclear power
Currently 3,500 employees with skills and know-how in nuclear power
Recruitment drive for the 2006-2008 period successfully completed, with 700 engineers and technicians hired �
1,000 people (including 450 engineers) to be hired in the coming five years to replace people taking retirement and to keep up with the development of the Group’s nuclear projects
Action plans • In Belgium: reinforcement of contacts with universities and other higher
education institutions, BNEN• In France: development of contacts with higher education institutions and
universities, INSTN (Atomic Energy Commission)• Special training programmes for experienced staff• Continuation of the 1-year Nuclear Trainees Programme aimed at GDF
SUEZ’s young nuclear engineers
Nuclear

Appendices
Sustainable Development

1192008 Annual Results - March 5, 2009
Strategic positioning in sustainable development The strategic thrusts of our sustainable development ambitions
“Follow andanticipate market
trends”
“Develop the Group’s
attractiveness, professionalism and
cultural cohesiveness”
“Guaranteethe sustainability
and local acceptabilityof our facilities”
1
23
ConfidenceConfidence
AttractivenessAttractiveness AcceptabilityAcceptability
DevelopmentDevelopment
MARCHÉSMARKETS
SALARIÉSEMPLOYEESPARTIES PRENANTES
EXTERNESEXTERNAL STAKE-
HOLDERS
Corporate strategy
Utilities playerstrategy
Industrial strategy
Sustainable Development

1202008 Annual Results - March 5, 2009
Strategic positioning in sustainable development � reducing our risk exposure
Allowing our activities to be rolled out and operated over the long term:
• Environmental management (risk prevention, resource protection, action against pollution and climate change, protection of biodiversity)
• Social innovation (solidarity, diversity, insertion, access to essential goods for underprivileged people)
• Healthcare policy – safety of our installations, for our employees and local residents
Annual appraisals:
• Comprehensive financial/environmental/social reporting vetted by auditors
• Sustainable development action plan covering the entire Group
Sustainable Development

1212008 Annual Results - March 5, 2009
Strategic positioning in sustainable development � creating opportunities
Allowing us to provide our customers with innovative solutions and differentiating offerings
• Customised solutions integrating energy efficiency and renewable energies
– Business market, industrial zones
– Eco-districts, new towns
– Individual offers
• Circular economy combining know-how from all business lines
– Re-use, desalination
– Biomethanation
An economic, environmental and social gain for local authorities and industries
Sustainable Development

Appendices
CO2 position

1232008 Annual Results - March 5, 2009
0 100 200 300 400 500 600 700 800 900
RWE
Drax
CEZ
SSE
Union Fenosa
Endesa
Enel
EDP
Vattenfall
E.on
GDF SUEZ Monde
GDF SUEZ Europe
Iberdrola
EDF
Leadership position in gas and electricity Competitive electricity generation with low CO2 emissions
Source: PWC
Europe’s main electricity companies
kg CO2/MWhe
Carbon factor in Europe in 2007373 kg CO2/MWhe
No excessive reliance on a single fuel source Generation costs structurally balanced
CO2 position

1242008 Annual Results - March 5, 2009
CO2: Reduced emissions
Trading activities
Acquisition of projects generating emission rights and ERPAs(acquisition of Econergy)
Improvement in the energy efficiency of production units
Substantial investments in renewable energies (hydro, wind, biomass) and cogeneration
Reduction in natural gas T&D emissions
Improved yields on NG compressors
Mandatory reductions via energy saving certificates
Green offering for customers – offsetting emissions
CO2 position

Appendices
Renewable Energy

1262008 Annual Results - March 5, 2009
Renewable energies at the heart of the Group’s sustainable development strategy (1/2)
A clear focus on investments (energy efficiency, nuclear and renewable energies) that reduce greenhouse gas emissions, thereby helping control the impact of CO2 on our economies
International presence in all renewable energies: hydro, biomass, wind, solar, etc. (+38% in wind energy in 1 year, new dam in Brazil and first solar power station to be commissioned soon). Renewable energiespreserve natural and fossil resources, help secure energy supplies, contribute to energy independence and foster price stability
A balanced range of fuels for generating electricity and heat, with renewable energies taking their rightful place in the existing generation portfolio
Renewable Energy

1272008 Annual Results - March 5, 2009
Renewable energies at the heart of the Group’s sustainable development strategy (2/2)
Hydroelectricity : 10,577 MW
Wind:1340 MW
Biomass and biogas: 755.7 MW (of which the proportion of biomass in cogeneration, generally with coal, 462.4 MW)
Hydroelectricity: 4,762 MW
• 20% of the Group’s installed capacity (figures at 100%)
• A significant pipeline of projects underway
• Clear ambitions:To double our renewable energy generation capacity in the 2007-2013 period by focusing on profitable organic growth and to at least maintain the proportion of our renewable energy capacity in the years to 2020
Municipal wasteand solar: 5.2 MW
Wind: 580 MW
Biomass and biogas: 18.3
Solar: 1.5 MW
Renewable Energy

Appendices
Market conditions

1292008 Annual Results - March 5, 2009
20
40
60
80
100
120
140
160
J-08
F-08
M-0
8
A-0
8
M-0
8
J-08
J-08
A-0
8
S-0
8
O-0
8
N-0
8
D-0
8
J-09
Brent 1st nearby in USD/b
Brent 1st nearby in EUR/b
40
50
60
70
80
90
100
110
120
130
J-08 F-08 M-08 A-08 M-08 J-08 J-08 A-08 S-08 O-08 N-08 D-08 J-09
EU
R/M
Wh
(ele
ctric
ity)
18
22
26
30
34
38
42
46
50
54
58
62
EU
R/M
Wh
(gas
)
Electricity France month-ahead
Gas Zeebrugge month-ahead
Gas long-term month-ahead
A year of high prices on average,but extremely volatile
• 57% increase in Brent between January and July, then a 75% drop until December, with an all-time high of $146.06/b in July
• Gas Zeebrugge Cal 09 set a new record of €43.3/MWh in July, before falling back below €19.5/MWh by year’s end
• Electricity Cal 09 baseload France above €92/MWhin mid-year but less than €59/MWh in December
Sources: brokers & Gaselys
Energy prices followed in the wake of oil markets
Market conditions

1302008 Annual Results - March 5, 2009
2009 prices Primary energy/commodities prices
Market conditions

Appendices
Energy France Business Line
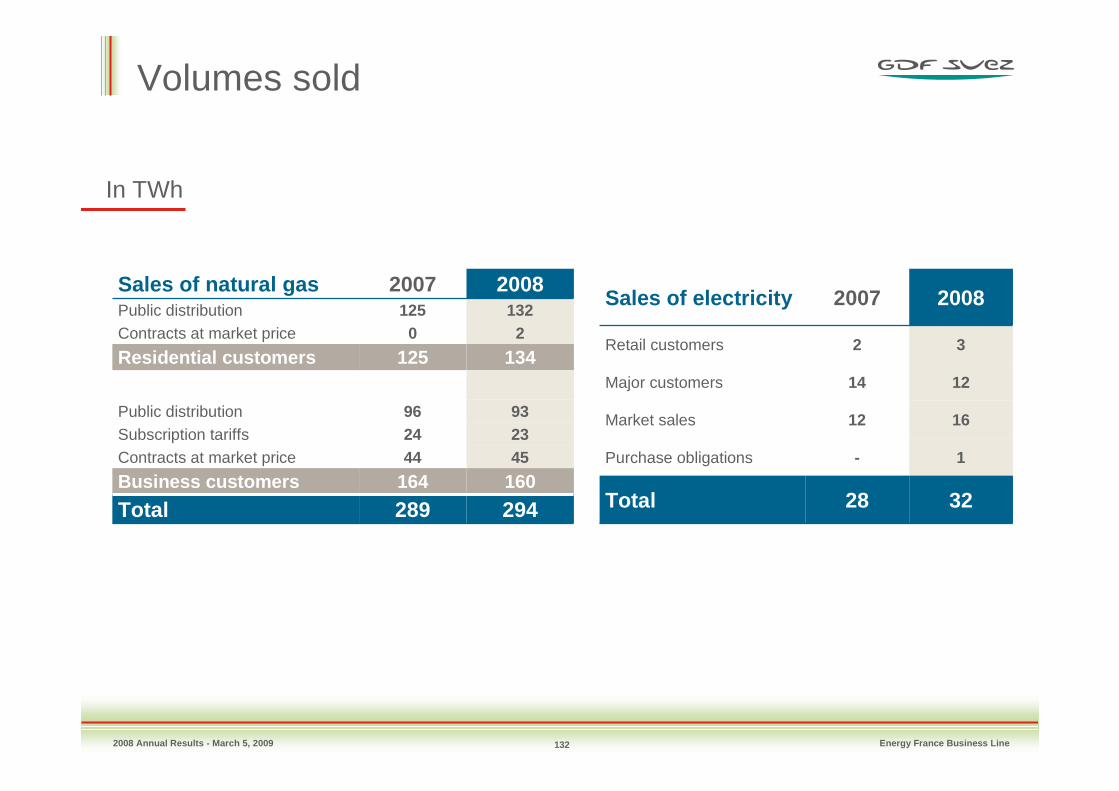
1322008 Annual Results - March 5, 2009
In TWh
Sales of natural gas 2007 2008Public distribution 125 132Contracts at market price 0 2
Residential customers 125 134
Public distribution 96 93Subscription tariffs 24 23Contracts at market price 44 45
Business customers 164 160
Total 289 294
Sales of electricity 2007 2008
Retail customers 2 3
Major customers 14 12
Market sales 12 16
Purchase obligations - 1
Total 28 32
Energy France Business Line
Volumes sold

1332008 Annual Results - March 5, 2009 Energy France Business Line
COOLER
WARMER
AVERAGE CLIMATE
* Distribution France scope
In TWh
-25.3
H1 2007
10.7
H2 2007
H1 2008
-7.7
8.3
H2 2008
More favourable climatic conditions in 2008 Climate adjustment* in France

1342008 Annual Results - March 5, 2009
14%26%
11%
32%
59%
29%
54%
15%
60%
93%
2%5%
All sites(523 TWh)
Non-residential sitesTransport (175 TWh)
Non-residential sitesDistribution (205 TWh)
Residential sites(143 TWh)
Alternative suppliers - market price Historic suppliers - market price Contracts under regulated tariffs
Market share in terms of gas consumptionfor France as at 12/31/08Breakdown by type of offer
Source: French energy regulation commission, French observatory of the electricity and gas markets, 2008
Historic suppliers: include Gaz de France, Tegaz, local distribution companies and their subsidiaries.A historic supplier is not considered as an alternative supplier outside of its historic service area.
Energy France Business Line

1352008 Annual Results - March 5, 2009
French energy markets opening up gradually
Number of residential customers who have switched to an alternative supplier
An even pace in the opening up of both markets• electricity: 692,000 residential sites have switched to an alternative supplier and 6,500 sites have chosen market
offers from historic suppliers • gas: 416,000 residential site have switched to an alternative supplier and 442,000 sites have chosen market offers
from historic suppliers Regulated tariffs still clearly dominate
• electricity: 96% of sites in all categories are still on regulated tariffs (including TarTAM, the transitory regulated market adjusted tariff)
• gas: 91% of sites in all categories are still on regulated tariffs
Source: network managers - Analysis: CRE - data at month-end
Energy France Business Line
Sept 07 Dec 07 March 08 Jun 08 Sept 08 Dec 08
Electricity Gas
5 31
112
288
515
692
654
128203
310
416
0
100
200
300
400
500
600
700
800
Sept 07 Dec 07 Mars 08 Juin 08 Sept 08 Dec 08
Electricité Gaz

1362008 Annual Results - March 5, 2009
6,482* MW of installed capacityas of 31 December 2008
DK6
Montoir
Fos
Chooz B
Tricastin
Main assets A flexible electricity generation portfolio, using predominantly renewable sources with low CO2 emissions
1,146 MW under construction
N°1 player in wind energy in Francewith an estimated 10% of the French market (Maïa Eolis, La Compagnie du Vent, Erelia, Eoliennes de la Haute Lys, Nass&Wind (renamed Eole Generation), CN’Air, Great)
N°2 player in hydroelectricitywith more than 25% of France’s hydroelectricity generation (CNR and SHEM)
CCGT
1,210* MW
CCGT
1,210* MWWIND
450 MW
WIND
450 MW
HYDRO
3,714 MW
HYDRO
3,714 MWNUCLEAR**
1,108 MW
NUCLEAR**
1,108 MW
CCGT
920 MW
CCGT
920 MWWIND
226 MW
WIND
226 MW
* Including Cycofos currently under testing period** Not including 555 MW nuclear release contract with EDF until 2022
Energy France Business Line

1372008 Annual Results - March 5, 2009
A leading player in wind energy in France
GDF SUEZ consolidates the biggest installed wind portfolio in France
• 450 MW operating as of 31 December 2008, or market share of ~10%
• 226 MW under construction
GDF SUEZ has a rich and diversified expansion portfolio
• More than 8 GW in wind energy under development, bringing capacity up to 2 to 3 GW by 2013
• ~150 MW of solar power under development
La Haute Lys (100%)
38 MW installed
Eole Generation (100%)ex-Nass & Wind
23 MW installed(of which 10 MW for the Group’s own use )4 MW under construction
Great (100%)
10 MW installed
Maia Eolis (49%)
130 MW installed (of which GDF Suez’s share is 64 MW)20 MW under construction
Erelia (95%)
106 MW installed92 MW under construction
CN’Air (49,9%)
73 MW installed25 MW under construction
La Compagnie du Vent (56%)
121 MW operating 85 MW under construction
Energy France Business Line

Appendices
Energy Europe & International Business Line

Appendices
Benedelux Energy Division

1402008 Annual Results - March 5, 2009
Benedelux Energy DivisionInstalled generation capacity as of 12/31/2008
In MW In operation Under construction Total
Belgium 13,532 410 13,942
The Netherlands 4,337 872 5,209
Germany 267 707 974
Luxemburg 376 0 376
TOTAL 18,512 1,989 20,501
Benelux/Germany Energy Division

1412008 Annual Results - March 5, 2009
A diversified, flexible and sustainable generation portfolioInstalled capacity as of 12/31/2008
Wind &Solar
1%Hydro 7%
Natural Gas48%
Coal11%
Nuclear28%
Biomass & Biogas2%
Breakdown of generation capacityat 100% by fuel type
Breakdown of electricity outputat 100% by fuel type
Wind 0%
Hydro 2%
Natural Gas39%
Coal11%
Nuclear44%
Biomass & Biogas2%
A balanced portfolio mix with nuclear assets as base load units and a diversified fuel mix of mid merit and peak units allowing the capture of the best opportunities in the market.
49% of the generated electricity is CO 2 free and not exposed to fuels prices variation
Benelux/Germany Energy Division
Other nonrenewable3%
Other nonrenewable2%

1422008 Annual Results - March 5, 2009
Business modelOptimization of gas supply & power generation portfolio and sales portfolio via a centralized portfolio management
Benelux/Germany Energy Division
Electricity : 113 TWh
Natural Gas : 152 TWh
25 TWh 46 TWh
Retail : 47 TWhECS gas (Distrigas) : 57 TWhLT Gas 49 TWh Business : 25 TWh
106 TWh 76 TWhWholesale : 4 TWh
76 TWh Retail : 22 TWh
Business : 74 TWh
113 TWh88 TWh Wholesale : 17 TWh
GENERATION
PortfolioManagement
Commodity market(Purchases)
100 %

1432008 Annual Results - March 5, 2009
The Netherlands
• Installed capacity 4,337 MW
• Elec sales* 23 TWh
• Gas sales 13 TWh
Belgium
• Installed capacity 13,532 MW
• Elec sales* 70 TWh
• Gas sales 59 TWh
Luxemburg
• Installed capacity 376 MW
• Elec sales* 4 TWh
A diversified, flexible and sustainablegeneration portfolioStrong local presence in Belux and in the NetherlandsDevelopment perspective in Germany
Germany
• Installed capacity 267 MW
• Elec sales* 11 TWh
• Gas sales 3 TWh
Benelux/Germany Energy Division
• Excluded 4 TWh sold in France• Excluded 1 TWh sold in UK

1442008 Annual Results - March 5, 2009
Electricity Price Sensitivity(1)
(1) including transport costs, excluding scope effects and non-recurring elements
12%
33%
55%
Part of BeNeDeLux sales portfolio2008 (€m)
Pricing still coherentwith regulated prices. Nc indexation with time delay(3-6 months)
Low sensitivity
RetailMarket positions accordingto the hedging policy
High sensitivity
Wholesale
Contract price coherent w/market price at inception.Fixed or Nc indexed price1 to 3 years duration
High sensitivity at inception.Afterwards: medium to low sensitivity
Business & Resellers
Benelux/Germany Energy Division

Appendices
Energy Europe Division

1462008 Annual Results - March 5, 2009 Energy Europe Division
In GW In operation Under construction Total
Western Europe 4.8 0 4.8
Central andEastern Europe
3.3 0.4 3.8
Italy 4.7 0.4 5.1
TOTAL 12.8 0.8 13.7
Installed capacity by fuel* Predominance of natural gas and a significant share of renewables

1472008 Annual Results - March 5, 2009
WindHydro 2%
Natural Gas
Coal
12.8 GW
Biomass & Biogas1%
16%
75%
5%
Energy Europe Division
Power generation capacity Installed capacity by fuel type as of 12/31/2008
Other renewable1%

1482008 Annual Results - March 5, 2009
GDF SUEZ has acquired 100% of the capital of IZGAZ for €232m
IZGAZ owns and operate a 2,900 km long gas distribution network
In 2008, the company supplied 1.5 billion cubic meters of natural gas, mainly to industries and also to 200,000 residential customers
Energy Europe Division
Energy EuropeAcquisition of IZGAZ (turkey) in January 2009

Appendices
Energy International Division

1502008 Annual Results - March 5, 2009
Geographic scopeOrganization based on 3 regions: North America, Latin America,Middle-East-Asia-Africa
Energy North
America
Energy Latin
America
Energy Middle East Asia Africa
Capacity: 11 GWElec production: 41 TWhElec sales: 22 TWh
Capacity: 11 GWElec production: 41 TWhElec sales: 22 TWh
GDF SUEZEnergy
International
GDF SUEZEnergy
International
Capacity: 7 GWElec production: 21 TWhElec sales: 45 TWhGas sold or transported: 126 TWhGas customers: 379,000
Capacity: 7 GWElec production: 21 TWhElec sales: 45 TWhGas sold or transported: 126 TWhGas customers: 379,000
Capacity: 10 GWElec production: 45 TWhElec sales: 44 TWhGas sold or transported: 41 TWh Gas customers: 576,000
Capacity: 10 GWElec production: 45 TWhElec sales: 44 TWhGas sold or transported: 41 TWh Gas customers: 576,000
Capacity and number of gas customers are as of December 31, 2008, all other information is for the year 2008. Installed capacities and electricity production are consolidated at 100%; sales and transportation figures are consolidated according to accounting rules
Energy International Division

1512008 Annual Results - March 5, 2009
In MW In operation Under construction Total
North America 7,117 849 7,966
South America 10,063 5, 493 15,556
Middle East – Asia – Africa 11,145 9,916 21,061
TOTAL 28, 324 16,259 44,583
* Installed capacity is operational capacity managed by the GDF SUEZ Energy International and is accounted for 100%Projects under construction are those approved by GDF SUEZ that the company is contractually bound to construct or acquire,and include planned retirements.
GDF SUEZ Energy InternationalInstalled capacity* at 12/31/08
Energy International Division

1522008 Annual Results - March 5, 2009
A diversified generation portfoliowith significant CO2 free or CO2 light assetsInstalled capacity by fuel type as of 12/31/2008
Hydro
Natural Gas
Coal
28,324 MW
Biomass, Wind 1%
Energy International Division
10%
54%
27%
8%
Other nonrenewable

1532008 Annual Results - March 5, 2009
New power generation capacities under construction and required globally by 2030
New power generation capacities under construction and required globally by 2030
(°) Including replacement capacities
Source: Reference Scenario - IEA World Energy Outlook 2008
13.6
Biofuels : 0.2Coal : 0.7
5.5
6.3
Gas
Oil
Power$26,300Billions
2007-2030 Global investments needs in energy: Power comes first
Emerging countries will make up
2/3 of future new power generation capacities
GDF SUEZ Energy InternationalSizeable growth opportunities in emerging countries
Latin America270
Africa150
TransitionEconomies296
Developing Asia1951
OECD Europe686
4,527GW
OECD Pacific 241
OECD North America695
Middle East238
Required investments in power, $ bn
Required investments in gas, $ bn
01234
T&D LNG E&P0
2
4
6
8
T&D GENERATION
Energy International Division

Appendices
Global Gas & LNG Business Line

1552008 Annual Results - March 5, 2009
Geographic breakdown of production
Geographic breakdown of oil and gas production and reserves
51.3 Mboe produced in 2008(*)
74% gas, 26% oil
51.3 Mboe produced in 2008(*)
74% gas, 26% oil
Production
704 Mboe as of 12/31/08
70% gas, 30% oil
704 Mboe as of 12/31/08
70% gas, 30% oil
Reserves
Geographic breakdown of 2P reserves
22%
20%
20%
36%
2%
(*) including 1.1 Mbep from assets acquired from NAM
21%
49%
11%
17%
2%(@31/12/08)
Germany
Norway
UK
Netherlands
Others
Global Gas & LNG Business Line

1562008 Annual Results - March 5, 2009
Exploration-Production: organic growth
Strong efforts in explorationand reserves evaluation
In 2008, 27 wells were drilled, corresponding to exploration expenditure of €174m, with 12 successes, of which 3 currently undergoing commercial evaluation
Strong efforts in explorationand reserves evaluation
In 2008, 27 wells were drilled, corresponding to exploration expenditure of €174m, with 12 successes, of which 3 currently undergoing commercial evaluation
Production renewed by reserves and resources discovered thanks to exploration activities
RRR
Discoveries, Revisions & Aquisition/Divestures
Production sold
Global Gas & LNG Business Line
-60
-40
-20
0
20
40
60
80
100
120
2004 2005 2006 2007 2008M
boe
-300%
-200%
-100%
0%
100%
200%
300%
400%
RR
R

1572008 Annual Results - March 5, 2009
Sales portfolio breakdown (% production):
0%
20%
40%
60%
80%
100%
2004 2005 2006 2007 2008
Gas contracts based on oil and fuel indexes (gas) Market price NBP-TTF- ZBG (gas) Brent related (oil) PSC contracts
• GDF SUEZ mainly operates concession contracts • PSC* account for approx. 2% of production and reserves
E&P sales breakdown
* PSC: Production Sharing Contracts
Global Gas & LNG Business Line

1582008 Annual Results - March 5, 2009
LIQUEFACTIONLIQUEFACTION TRANSPORTTRANSPORT TERMINALSTERMINALSE&P
LNG tankers owned by GDF SUEZ
TellierSuez Matthew
Gaz de France energYProvalys
Gaselys (40%)
LNG tankers owned by GDF SUEZ
TellierSuez Matthew
Gaz de France energYProvalys
Gaselys (40%)
ExistingEverett, Fos Tonkin, Montoir
Zeebrugge (60%)Dahej (10%)
Under constructionFos Cavaou (70%)
NeptuneGNL Mejillones (50%)
Kochi (10%)
Projects currently being developed
Singapore (30%)Triton, Rabaska (33%)
ExistingEverett, Fos Tonkin, Montoir
Zeebrugge (60%)Dahej (10%)
Under constructionFos Cavaou (70%)
NeptuneGNL Mejillones (50%)
Kochi (10%)
Projects currently being developed
Singapore (30%)Triton, Rabaska (33%)
Idku (train 1.5%)Snøhvit (12%)Atlantic LNG(train 1.10%)
Idku (train 1.5%)Snøhvit (12%)Atlantic LNG(train 1.10%)
Marketing and
Distribution
GDF SUEZ and the LNG value chain Directly owned positions
Global Gas & LNG Business Line

1592008 Annual Results - March 5, 2009
GDF SUEZ operates 15 LNG tankers(total capacity:
1.8 Mm3 of LNG)Average age: 13 yrs
5 vessels being built (including 2
regasifying tankers)
GDF SUEZ operates 15 LNG tankers(total capacity:
1.8 Mm3 of LNG)Average age: 13 yrs
5 vessels being built (including 2
regasifying tankers)
EuropeZeebrugge: 1.4 mtpa
Montoir: 6.8 mtpaFos Tonkin: 5.6 mtpa
Fos Cavaou °: 4.1 mtpaHuelva: 0.4 mtpa
Cartagena: 1.2 mtpaIsle of Grain: 2.4 mtpa
North America Everett: 5 mtpa
Freeport: 3 mtpaSabine Pass: 0.8 mtpaPuerto Rico°°: 0.5 mtpa
Algeria: 7.5 mtpaEgypt: 3.6 mtpa
Nigeria:0.4 + 0.4 (+1.7*) mtpa
Norway: 0.5 mtpa Trinidad and Tobago:
2.2 + 2.8** mtpaYemen *** : 2.55 mtpa
Algeria: 7.5 mtpaEgypt: 3.6 mtpa
Nigeria:0.4 + 0.4 (+1.7*) mtpa
Norway: 0.5 mtpa Trinidad and Tobago:
2.2 + 2.8** mtpaYemen *** : 2.55 mtpa
Marketing and Distribution
* Brass LNG: contract to be finalised ** Trinidad and Tobago: of which 2.8 mtpa maturing in April 2009*** Yemen LNG: COD scheluded in 2009
°Fos Cavaou: COD scheluded in 2009 °°Puerto Rico: long-term supply contract
GDF SUEZ and the LNG value chain Contractual positions
SUPPLY SUPPLY TERMINALSTERMINALSTRANSPORTTRANSPORT
Global Gas & LNG Business Line

1602008 Annual Results - March 5, 2009
The LNG tanker fleet
BW Suez Boston
Gaz de France energY
(Chartered for different lengths of time, from a few months up to 20 years)
15 vessels in service and 5 being built at end-200815 vessels in service and 5 being built at end-2008
Name Owner Capacity (in m 3 of LNG)
Shipyard Delivery
Existing vesselsSCF Polar Sovcomflot (chartered to Gas Natural) 71,500 Kockums (Sweden) 01/1969
Tellier GDF SUEZ 40,081 La Ciotat (France) 01/1974
Suez Matthew Suez LNG NA 126,540 Newport News (USA) 06/1979
Ramdane Abane Sonatrach 126,130 Atlantique (France) 07/1981
Tenaga Satu MISC 130,000 Dunkirk (France) 09/1982
LNG Lerici ENI/SNAM 65,000 Italcantieri Sestri (Italy) 03/1998
BW Suez Boston Bergesen (51%) / Fluxys (49%) 138,000 Daewoo (Korea) 01/2003
Catalunya Spirit Teekay LNG 138,000 IZAR (Spain) 03/2003
BW Suez Everett Bergesen 138,000 Daewoo (Korea) 06/2003
Excel Exmar 138,000 Daewoo (Korea) 09/2003
Provalys GDF SUEZ 154,500 Atlantique (France) 11/2006
Gaz de France energY GDF SUEZ 74,130 Atlantique (France) 12/2006
Gaselys GDF SUEZ (40%) / NYK (60%) 154,500 Atlantique (France) 03/2007Maran Gas Coronis Maran Gas 145,800 Daewoo (Korea) 07/2007
Grace Cosmos NYK 149,700 Hyundai Heavy Industries 05/2008
Vessels on orderBW Suez Paris Bergesen 162,400 Daewoo (Korea) 07/2009
BW Suez Brussels Bergesen 162,400 Daewoo (Korea) 07/2009
Suez Point Fortin Trinity LNG (MOL, Sumimoto, LNG Japan) 154,200 Imabari (Japan) early 2010Suez Neptune Hoegh LNG/MOL 145,000 (SRV) Samsung (Korea) 10/2009
Suez Cape Ann Hoegh LNG/MOL 145,000 (SRV) Samsung (Korea) 04/2010
Global Gas & LNG Business Line

1612008 Annual Results - March 5, 2009
• Nearly 200 TWh* sold to Very Large Customers in 2008
• 47% of sales made outside France
• Revenue up sharply: +15% compared with 2007
21.943.2
68.6 80.1 77.7
125.0 123.0 130.0132.0
124.0
123.8 109.194.7
2000 2001 2002 2003 2004 2005 2006 2007
France*Other target countries in Europe* (excl. UK)
7.0 5.7
Big growth in sales to Very Large Customers
In TWhs
92.9
105.9
2008
* Sales in France including municipalities (8.6 TWh in 2008, 7.8 TWh in 2007) and including intragroup sales – Sales in Europe including intragroup sales
Global Gas & LNG Business Line

Appendices
Infrastructures Business Line

1632008 Annual Results - March 5, 2009
Regulation and asset bases in France
Period of regulation
2007 invest-ments(in €m)
2008 invest-ments(in €m)
RAB remuneration(real pre-tax)
Average 2008
regulated asset base*
(in €bn)
Type of tariff
Distribution1 July 20081 July 2012
724 658 6.75% 13.5Tariff N+1:
Inflation -1.3%
Transport1 Jan. 20091 Jan. 2012
367 6007.25%
+ incentives up to 300bp over 10 years
5.8
OPEX N+1:Inflation +1.1% (+2.1% capacity; -1% efficiency)
LNG terminalsTariff project
underway171 146
9.25% and 10.5%
0.4 Cost +
TOTAL 1,262 1,404 19.7
* Estimate
Infrastructures Business Line

1642008 Annual Results - March 5, 2009
A balanced business portfolio
In €bn
Transport
Distribution in France
Storage
LNG terminals
2.9
Breakdown of 2008 EBITDA
Infrastructures Business Line

Appendices
Energy Services Business Line

1662008 Annual Results - March 5, 2009
Revenues and result by Business Units
Revenue breakdownby Business Units
Current operating income breakdown by geographic zone
* pro forma 2008
€m
Energy Services Business Line
BU FranceEnergyServices: 25%
BU France Inst. & Rel.Serv.: 27%
BU Belgium : 12%BU Netherlands : 9%
BU InternationalNorth : 9%
BU TBLEngineering : 3%
BU Power& Gas: 3%
BUInternationalSouth : 12%
0
50
100
150
200
250
300
350
BUs France BUs Benelux Other BUs

1672008 Annual Results - March 5, 2009
Breakdown of revenues by country (2008)
European leader in energy services
Energy Services Business Line
France49%
Netherlands 10%
Belgium 9%
Italy 9%
UK 4%
Spain 3%
Others 16%

1682008 Annual Results - March 5, 2009
EngineeringElectrical and HVAC
installation and maintenance
0.4 5.9 7.3 0.4
Energy servicesPower
distribution
2008revenue
in bn€
• A diversified portfolio• A balanced portfolio between installation and services• A global offer throughout the whole clients’ value chain
• A diversified portfolio• A balanced portfolio between installation and services• A global offer throughout the whole clients’ value chain
Key figures in 2008:€14bn Revenues
€586m Current Operating Income77,000 employees
Key figures in 2008:€14bn Revenues
€586m Current Operating Income77,000 employees
Energy Services Business Line
GDF SUEZ Energy Services Leader in multitechnical services

1692008 Annual Results - March 5, 2009
OLYMPIC PARK IN LONDON (UK)Elyo UK won a 40-year contract for the building, financing and operation of urban heating and air conditioning networks (€1,500 M)
OVERHOEKS (NETHERLANDS)GTI will handle the design, building, maintenance a nd operation of renewable energy systems for the new Amsterdam district
GRT GAZ (FRANCE)Ineo will install automation systems for two gas compression stations for € 35 M
DUNAMENTI EROMU ZRT (HUNGARY)Tractebel Engineering will supply engineer services for the repowering of a 420 MW unit
HOSPITALS IN SARDINIA (ITALY)Cofathec Italy obtained a 27-year contract for the maintenance of 3 hospitals and 2 healthcare centers (€600 M)
BIOELECTRICITY PROJECTS WITH TOTAL, SAIPOL AND CASCADE (FRANCE)Elyo and Cofathec will build and manage 3 projects under the CRE II agreements
MISUBISHI HEAVY INDUSTRIES (BELGIUM)Fabricom GTI has been awarded, within a Joint Venture with IREM and Ponticelli, a € 250 M contract for the entire management of the installation of th e future ‘multi fuel’ plant Nuon Magnum (1300 MW)
Energy Services Business Line
Some recent successes