parietalinfluenceontemporalencodingindexedby ... · subjects participated in two separate sessions...
TRANSCRIPT

Behavioral/Systems/Cognitive
Parietal Influence on Temporal Encoding Indexed bySimultaneous Transcranial Magnetic Stimulation andElectroencephalography
Martin Wiener,1 Dasha Kliot,1 Peter E. Turkeltaub,2 Roy H. Hamilton,1 David A. Wolk,1 and H. Branch Coslett1
1Department of Neurology, Perelman School of Medicine of the University of Pennsylvania, Philadelphia, Pennsylvania 19104, and 2Department ofNeurology, Georgetown University School of Medicine, Washington, DC 20007
Previous studies have suggested that contingent negative variation (CNV), as recorded by electroencaphalography (EEG), may serve as anindex of temporal encoding. The interpretation of these studies is complicated by the fact that, in a majority of studies, the CNV signal wasobtained at a time when subjects were not only registering stimulus duration but also making decisions and preparing to act. Previously,we demonstrated that repetitive transcranial magnetic stimulation (rTMS) of the right supramarginal gyrus (rSMG) in humans length-ened the perceived duration of a visual stimulus (Wiener et al., 2010a), suggesting the rSMG is involved in basic encoding processes. Here,we report a replication of this effect with simultaneous EEG recordings during the encoding of stimulus duration. Stimulation of the rSMGled to an increase in perceived duration and the amplitude of N1 and CNV components recorded from frontocentral sites. Furthermore,the size of the CNV amplitude, but not N1, positively correlated with the size of the rTMS effect but negatively correlated with bias (thebaseline tendency to report a comparison stimulus as shorter), suggesting that the CNV indexes stimulus duration. These results suggestthat a feedforward mechanism from parietal to prefrontal regions mediates temporal encoding and demonstrate a dissociation betweenearly and late phases of encoding processes.
IntroductionTemporal expectation, the ability to predict the onset of an up-coming stimulus, is intrinsically bound to the perception of tem-poral duration. Humans possess a remarkable ability to bothreact to upcoming stimuli and perceive duration across a widerange of timescales (Buhusi and Meck, 2005); however, the bio-logical underpinnings of this ability have yet to be fully eluci-dated. Both expectation and temporal duration may be indexedby contingent negative variation (CNV), a slow cortical potentialcharacterized by a developing negative polarity at frontocentralscalp locations (Walter et al., 1964; Macar and Vidal, 2004; Fan etal., 2007). The CNV signal develops while a subject is either ex-plicitly or implicitly encoding stimulus duration (Macar andVidal, 2004; Praamstra et al., 2006) or expecting the temporallypredictable onset of a cued imperative stimulus (Scheibe et al.,2010).
Numerous studies have investigated the role of the CNV inexplicit temporal processing (Macar and Vidal, 2004; Xuan et al.,2009; Tarantino et al., 2010). A number of these studies suggestthat CNV amplitude indexes a temporal accumulation process,
with higher amplitudes associated with subjectively longer inter-vals (Macar et al., 1999; but see Kononowicz and van Rijn, 2011).However, the majority of these studies have focused on activityduring temporal comparison during which the subject mustcompare the currently elapsing duration with a memory repre-sentation and prepare a motor response. As such, CNV activityduring this time period may reflect multiple processes (Ikeda etal., 1997). The interpretation of CNV activity is further con-founded by evidence suggesting an involvement in expectancyand preparatory processes (van Rijn et al., 2011).
Recently, we (Wiener et al., 2010a) demonstrated that repeti-tive transcranial magnetic stimulation (rTMS) of the right supra-marginal gyrus (rSMG) selectively increased the perceivedduration of a visual stimulus during temporal discrimination.The increase in perceived length did not depend on a motorresponse and occurred with stimulation during both the standardand comparison intervals, suggesting an involvement in tempo-ral encoding processes. Although our results demonstrated thatthe rSMG stimulation modulates encoding of stimulus duration,they do not reveal possible downstream effects at distal neuralsites.
In the present study, we further examined the effect of rTMSstimulation of the rSMG using simultaneous electroencephalo-graphic (EEG) recordings. Subjects received stimulation beforethe onset of the standard stimulus, when temporal encoding isengaged. This allowed us to investigate the effects on subsequentcomponents free from motor preparation and decision pro-cesses. We reasoned that, if the rSMG and the medial frontalstructures that generate the CNV are part of the neural circuitry
Received May 24, 2012; revised July 2, 2012; accepted July 11, 2012.Author contributions: M.W. and D.A.W. designed research; M.W., D.K., P.E.T., R.H.H., and H.B.C. performed
research; D.A.W. and H.B.C. contributed unpublished reagents/analytic tools; M.W. analyzed data; M.W. wrote thepaper.
This project was supported by National Institute of Mental Health Grant MH076227 (H.B.C.).Correspondence should be addressed to Dr. Martin Wiener, Department of Neurology, University of Pennsylva-
nia, 3720 Walnut Street, Philadelphia, PA 19104-6241. E-mail: [email protected]:10.1523/JNEUROSCI.2511-12.2012
Copyright © 2012 the authors 0270-6474/12/3212258-10$15.00/0
12258 • The Journal of Neuroscience, August 29, 2012 • 32(35):12258 –12267
that encodes temporal duration, stimulation of the rSMG wouldlead to a prolongation of perceived duration, and this increasewould be accompanied by a larger CNV amplitude during inter-val encoding. In contrast, if the CNV indexes other factors, suchas memory or decision-making (Macar and Vidal, 2003;Kononowicz and van Rijn, 2011), one would not expect rTMS toinduce a change in CNV amplitude during temporal encoding.
Materials and MethodsParticipants. Nineteen right-handed healthy volunteers (10 males, 9 fe-males; mean age, 25 years; range, 21–35 years) who met inclusion criteriafor rTMS participated in the experiment. All subjects gave their informedconsent as approved by the University of Pennsylvania Institutional Re-view Board.
Baseline scaling. To maximize the effects of rTMS on behavior, weindividually scaled task difficulty according to level of performance(Wiener et al., 2010a). Before receiving rTMS, each subject performed abaseline temporal discrimination task. Temporal discrimination re-quires subjects to judge whether a comparison duration is longer orshorter than a standard duration presented on every trial. In this baselinetesting, we used the parameter estimation by sequential testing (PEST)algorithm (Pentland, 1980) that provides a continuously updatedmaximum-likelihood estimate of the threshold for detecting a differencebetween the comparison and standard durations (Lieberman and Pent-land, 1983). With this procedure, the range and frequency of comparisonstimuli are different for each subject, thus allowing task difficulty to bescaled to individual performance. We set the initial lower (LT) and upper(UT) thresholds to equal 50 and 150% of the standard interval duration,respectively. At the onset of each trial, subjects were presented with afixation point for 1000 ms, followed by the presentation of a red square(4 � 4 cm) for 600 ms (standard duration). After the target interval wasreached, the red square extinguished for a 1 s interstimulus interval (ISI).A second red square was then presented for a variable duration of time(comparison duration) as determined by the maximum-likelihood pro-cedure of the PEST algorithm. The initial stepsize for adjustments in thecomparison duration was set to 15% of the standard duration for the first20 trials and then to 5% for the remaining 40 trials. Subjects were re-quired to indicate on a keyboard whether the second stimulus wasshorter or longer than the first stimulus; the key mappings used forlonger and shorter were counterbalanced between subjects. Once a re-sponse was detected, the next trial began immediately. All subjects weregiven 30 practice trials with a standard interval of 1000 ms and thencompleted 60 trials of the baseline task with the 600 ms standard dura-tion. Subjects were not told the range of stimulus durations and were notgiven feedback regarding accuracy. Stimulus presentation and the PESTalgorithm were performed using MATLAB (MathWorks) with the Psy-chophysics Toolbox extensions (Brainard, 1997).
The probability of the subject making a “longer” response choice wasplotted as a function of the comparison interval (for a demonstration ofthe technique, see Wiener et al., 2010a). These data were then fit with asigmoidal, psychometric curve using the psignifit version 2.5.6 softwarepackage (see http://bootstrap-software.org/psignifit/) for MATLAB,which implements the maximum-likelihood method described by Wich-mann and Hill (2001a). UTs and LTs, the approximate points at whichthe subject is 25 or 75% likely to judge the stimulus as longer, werecalculated using the bias-corrected bootstrap method implemented bypsignifit, based on 4999 simulations (Wichmann and Hill, 2001b). Theresults of this analysis yield the point of subjective equality (PSE; the timevalue at which subjects were equally likely to judge the stimulus as longeror shorter) and the difference limen [DL; the difference between the UT(75%) and LT (25%) values]. A third measure derived from this proce-dure is the constant error term (CE; PSE � standard duration); thismeasure was included to index the subjective bias a subject may have inbaseline responses. The CE provides an index of time-order error, withnegative values indicating a bias to respond “longer” and positive valuesa bias to respond “shorter” (Hellstrom, 1985).
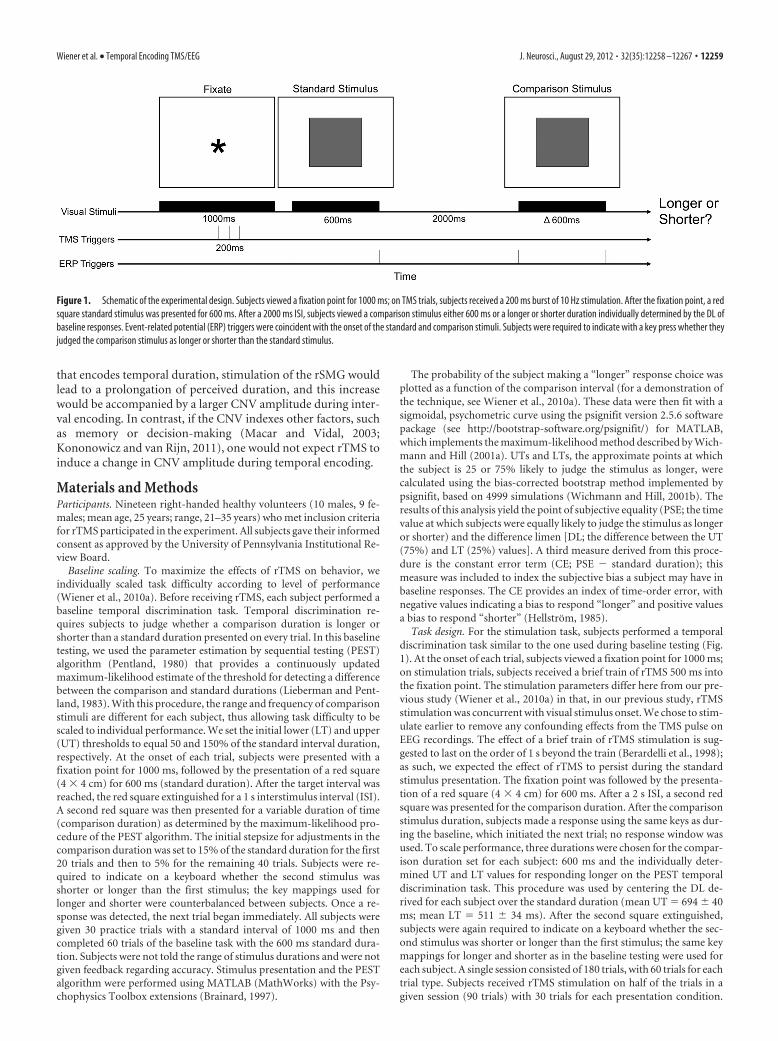
Task design. For the stimulation task, subjects performed a temporaldiscrimination task similar to the one used during baseline testing (Fig.1). At the onset of each trial, subjects viewed a fixation point for 1000 ms;on stimulation trials, subjects received a brief train of rTMS 500 ms intothe fixation point. The stimulation parameters differ here from our pre-vious study (Wiener et al., 2010a) in that, in our previous study, rTMSstimulation was concurrent with visual stimulus onset. We chose to stim-ulate earlier to remove any confounding effects from the TMS pulse onEEG recordings. The effect of a brief train of rTMS stimulation is sug-gested to last on the order of 1 s beyond the train (Berardelli et al., 1998);as such, we expected the effect of rTMS to persist during the standardstimulus presentation. The fixation point was followed by the presenta-tion of a red square (4 � 4 cm) for 600 ms. After a 2 s ISI, a second redsquare was presented for the comparison duration. After the comparisonstimulus duration, subjects made a response using the same keys as dur-ing the baseline, which initiated the next trial; no response window wasused. To scale performance, three durations were chosen for the compar-ison duration set for each subject: 600 ms and the individually deter-mined UT and LT values for responding longer on the PEST temporaldiscrimination task. This procedure was used by centering the DL de-rived for each subject over the standard duration (mean UT � 694 � 40ms; mean LT � 511 � 34 ms). After the second square extinguished,subjects were again required to indicate on a keyboard whether the sec-ond stimulus was shorter or longer than the first stimulus; the same keymappings for longer and shorter as in the baseline testing were used foreach subject. A single session consisted of 180 trials, with 60 trials for eachtrial type. Subjects received rTMS stimulation on half of the trials in agiven session (90 trials) with 30 trials for each presentation condition.
Figure 1. Schematic of the experimental design. Subjects viewed a fixation point for 1000 ms; on TMS trials, subjects received a 200 ms burst of 10 Hz stimulation. After the fixation point, a redsquare standard stimulus was presented for 600 ms. After a 2000 ms ISI, subjects viewed a comparison stimulus either 600 ms or a longer or shorter duration individually determined by the DL ofbaseline responses. Event-related potential (ERP) triggers were coincident with the onset of the standard and comparison stimuli. Subjects were required to indicate with a key press whether theyjudged the comparison stimulus as longer or shorter than the standard stimulus.
Wiener et al. • Temporal Encoding TMS/EEG J. Neurosci., August 29, 2012 • 32(35):12258 –12267 • 12259
Subjects participated in two separate sessionson 2 different days with different stimulationsites on each day.
rTMS stimulation. Stimulation was adminis-tered with a Magstim Rapid magnetic stimula-tor connected to a figure-of-eight air-cooledcoil with a diameter of 70 mm. Motor thresh-olds (MTs) were collected for each subject bydetermining the stimulation output that elic-ited a motor response from the contralateralhand on at least 50% of pulses. The EEG capintroduced a small gap (7 mm) between thecoil and scalp surface; as such, all MT measureswere taken after the cap and electrodes wereapplied. Stimulation remained at this outputfor the remainder of the experiment.
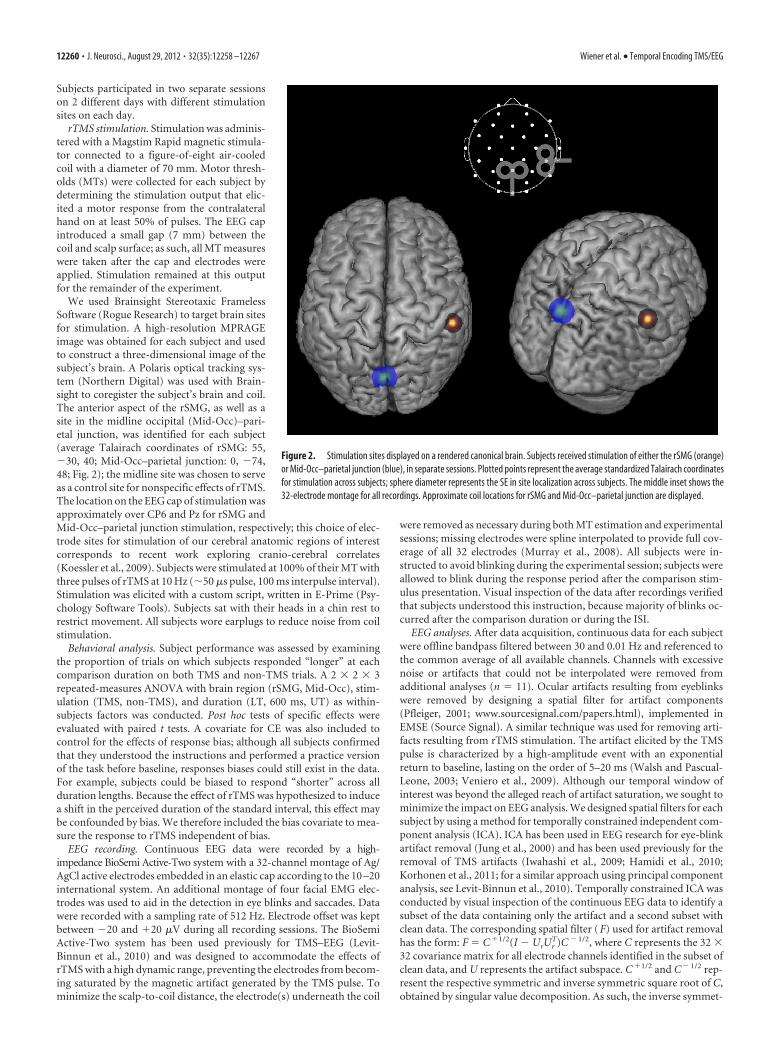
We used Brainsight Stereotaxic FramelessSoftware (Rogue Research) to target brain sitesfor stimulation. A high-resolution MPRAGEimage was obtained for each subject and usedto construct a three-dimensional image of thesubject’s brain. A Polaris optical tracking sys-tem (Northern Digital) was used with Brain-sight to coregister the subject’s brain and coil.The anterior aspect of the rSMG, as well as asite in the midline occipital (Mid-Occ)–pari-etal junction, was identified for each subject(average Talairach coordinates of rSMG: 55,�30, 40; Mid-Occ–parietal junction: 0, �74,48; Fig. 2); the midline site was chosen to serveas a control site for nonspecific effects of rTMS.The location on the EEG cap of stimulation wasapproximately over CP6 and Pz for rSMG andMid-Occ–parietal junction stimulation, respectively; this choice of elec-trode sites for stimulation of our cerebral anatomic regions of interestcorresponds to recent work exploring cranio-cerebral correlates(Koessler et al., 2009). Subjects were stimulated at 100% of their MT withthree pulses of rTMS at 10 Hz (�50 �s pulse, 100 ms interpulse interval).Stimulation was elicited with a custom script, written in E-Prime (Psy-chology Software Tools). Subjects sat with their heads in a chin rest torestrict movement. All subjects wore earplugs to reduce noise from coilstimulation.
Behavioral analysis. Subject performance was assessed by examiningthe proportion of trials on which subjects responded “longer” at eachcomparison duration on both TMS and non-TMS trials. A 2 � 2 � 3repeated-measures ANOVA with brain region (rSMG, Mid-Occ), stim-ulation (TMS, non-TMS), and duration (LT, 600 ms, UT) as within-subjects factors was conducted. Post hoc tests of specific effects wereevaluated with paired t tests. A covariate for CE was also included tocontrol for the effects of response bias; although all subjects confirmedthat they understood the instructions and performed a practice versionof the task before baseline, responses biases could still exist in the data.For example, subjects could be biased to respond “shorter” across allduration lengths. Because the effect of rTMS was hypothesized to inducea shift in the perceived duration of the standard interval, this effect maybe confounded by bias. We therefore included the bias covariate to mea-sure the response to rTMS independent of bias.
EEG recording. Continuous EEG data were recorded by a high-impedance BioSemi Active-Two system with a 32-channel montage of Ag/AgCl active electrodes embedded in an elastic cap according to the 10 –20international system. An additional montage of four facial EMG elec-trodes was used to aid in the detection in eye blinks and saccades. Datawere recorded with a sampling rate of 512 Hz. Electrode offset was keptbetween �20 and �20 �V during all recording sessions. The BioSemiActive-Two system has been used previously for TMS–EEG (Levit-Binnun et al., 2010) and was designed to accommodate the effects ofrTMS with a high dynamic range, preventing the electrodes from becom-ing saturated by the magnetic artifact generated by the TMS pulse. Tominimize the scalp-to-coil distance, the electrode(s) underneath the coil
were removed as necessary during both MT estimation and experimentalsessions; missing electrodes were spline interpolated to provide full cov-erage of all 32 electrodes (Murray et al., 2008). All subjects were in-structed to avoid blinking during the experimental session; subjects wereallowed to blink during the response period after the comparison stim-ulus presentation. Visual inspection of the data after recordings verifiedthat subjects understood this instruction, because majority of blinks oc-curred after the comparison duration or during the ISI.
EEG analyses. After data acquisition, continuous data for each subjectwere offline bandpass filtered between 30 and 0.01 Hz and referenced tothe common average of all available channels. Channels with excessivenoise or artifacts that could not be interpolated were removed fromadditional analyses (n � 11). Ocular artifacts resulting from eyeblinkswere removed by designing a spatial filter for artifact components(Pfleiger, 2001; www.sourcesignal.com/papers.html), implemented inEMSE (Source Signal). A similar technique was used for removing arti-facts resulting from rTMS stimulation. The artifact elicited by the TMSpulse is characterized by a high-amplitude event with an exponentialreturn to baseline, lasting on the order of 5–20 ms (Walsh and Pascual-Leone, 2003; Veniero et al., 2009). Although our temporal window ofinterest was beyond the alleged reach of artifact saturation, we sought tominimize the impact on EEG analysis. We designed spatial filters for eachsubject by using a method for temporally constrained independent com-ponent analysis (ICA). ICA has been used in EEG research for eye-blinkartifact removal (Jung et al., 2000) and has been used previously for theremoval of TMS artifacts (Iwahashi et al., 2009; Hamidi et al., 2010;Korhonen et al., 2011; for a similar approach using principal componentanalysis, see Levit-Binnun et al., 2010). Temporally constrained ICA wasconducted by visual inspection of the continuous EEG data to identify asubset of the data containing only the artifact and a second subset withclean data. The corresponding spatial filter ( F) used for artifact removalhas the form: F � C �1/2(I � UrUr
T)C � 1/2, where C represents the 32 �32 covariance matrix for all electrode channels identified in the subset ofclean data, and U represents the artifact subspace. C �1/2 and C� 1/2 rep-resent the respective symmetric and inverse symmetric square root of C,obtained by singular value decomposition. As such, the inverse symmet-
Figure 2. Stimulation sites displayed on a rendered canonical brain. Subjects received stimulation of either the rSMG (orange)or Mid-Occ–parietal junction (blue), in separate sessions. Plotted points represent the average standardized Talairach coordinatesfor stimulation across subjects; sphere diameter represents the SE in site localization across subjects. The middle inset shows the32-electrode montage for all recordings. Approximate coil locations for rSMG and Mid-Occ–parietal junction are displayed.
12260 • J. Neurosci., August 29, 2012 • 32(35):12258 –12267 Wiener et al. • Temporal Encoding TMS/EEG
ric square root spatially whitens the data by the clean subset, whereas thesymmetric square roots spatially unwhitens the output. The result thusaccentuates artifact-containing data while attenuating clean EEG data.Because of the large-amplitude difference between artifact and clean da-tasets, components resulting from TMS were easily distinguishable fromthose with clean data. Components resulting from the TMS artifact wereidentified and spatially filtered from the continuous data, reducing boththe TMS artifact and resulting high-amplitude noise (for a demonstra-tion of the technique, see Iwahashi et al., 2009).
After artifact correction, continuous data were separately epochedwith respect to the onset of the standard and comparison stimuli (�100ms prestimulus onset to 1000 ms poststimulus onset). All epochs werebaseline and DC corrected to the mean of the 100 ms prestimulus inter-val. Trials with voltage �90 �V from baseline were discarded. To inter-rogate the CNV signal, grand-averaged waveforms across subjects wereconstructed for frontocentral electrode sites (Fz, Cz, FC1, FC2), in whichthe CNV signal is reported to be maximal (Macar and Vidal, 2004; Bruniaet al., 2011). To identify measurement windows, we used global fieldpower (GFP; Lehmann and Skrandies, 1980), calculated as the root meansquare of the amplitude difference across all electrodes. GFP thus pro-vides a polarity and reference-free measure of the electrical field (Murrayet al., 2008). Using the GFP from the non-TMS trial data for both stim-ulation sites, we identified two distinct peaks of GFP activity. We thusdivided our analyses between “early” (50 –180 ms) and “late” (280 –740ms) EEG responses. When projected back onto the referenced data, theearly time window encompassed the N1 visual onset response, whereasthe late time window encompassed the CNV. This technique has beenused previously to identify the CNV time window during time percep-tion (Ng et al., 2011); furthermore, we note that the onset of the late timewindow corresponds to those used by previous studies of the CNV dur-ing standard duration encoding (Gontier et al., 2007; Le Dantec et al.,2007; Chen et al., 2010).
Correlational analyses. To evaluate the effect of rTMS at the individuallevel, we conducted correlational analyses between the behavioral effectsof rTMS and changes in CNV amplitude. For behavioral analyses, wecalculated the mean difference in the proportion of longer trials, col-lapsed across duration length [P( L)non-TMS � P( L)TMS]. For EEG anal-yses, we calculated the mean difference in EEG amplitude for early andlate measurement windows (EEGTMS � EEGnon-TMS).
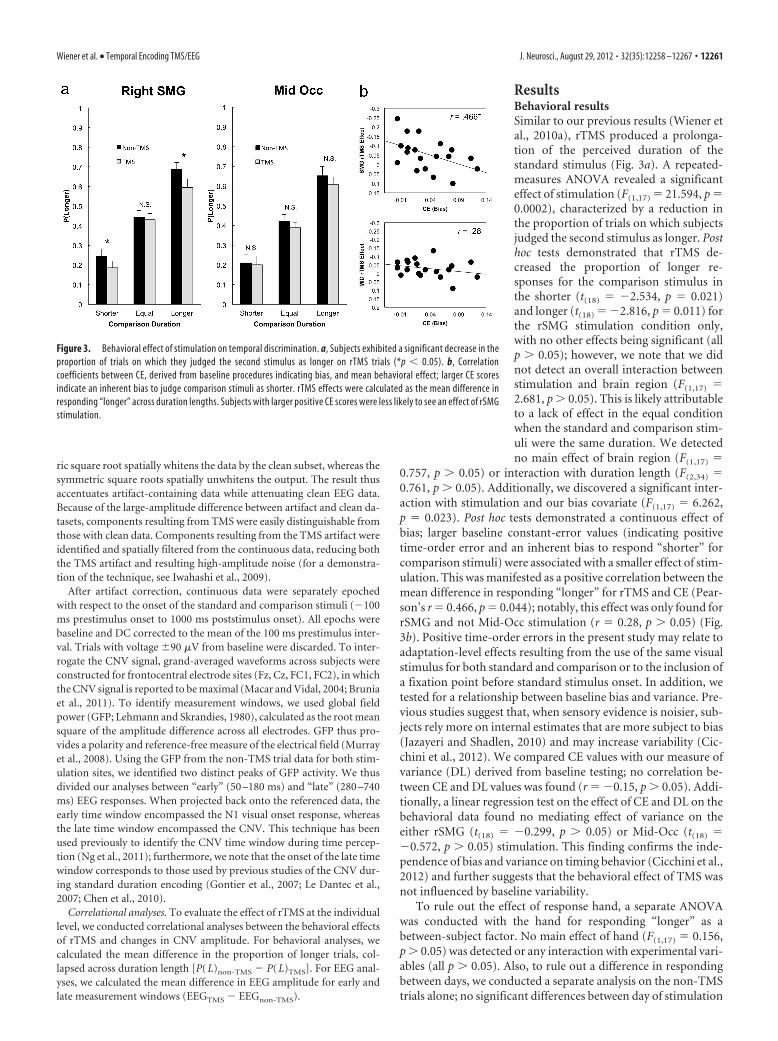
ResultsBehavioral resultsSimilar to our previous results (Wiener etal., 2010a), rTMS produced a prolonga-tion of the perceived duration of thestandard stimulus (Fig. 3a). A repeated-measures ANOVA revealed a significanteffect of stimulation (F(1,17) � 21.594, p �0.0002), characterized by a reduction inthe proportion of trials on which subjectsjudged the second stimulus as longer. Posthoc tests demonstrated that rTMS de-creased the proportion of longer re-sponses for the comparison stimulus inthe shorter (t(18) � �2.534, p � 0.021)and longer (t(18) � �2.816, p � 0.011) forthe rSMG stimulation condition only,with no other effects being significant (allp � 0.05); however, we note that we didnot detect an overall interaction betweenstimulation and brain region (F(1,17) �2.681, p � 0.05). This is likely attributableto a lack of effect in the equal conditionwhen the standard and comparison stim-uli were the same duration. We detectedno main effect of brain region (F(1,17) �
0.757, p � 0.05) or interaction with duration length (F(2,34) �0.761, p � 0.05). Additionally, we discovered a significant inter-action with stimulation and our bias covariate (F(1,17) � 6.262,p � 0.023). Post hoc tests demonstrated a continuous effect ofbias; larger baseline constant-error values (indicating positivetime-order error and an inherent bias to respond “shorter” forcomparison stimuli) were associated with a smaller effect of stim-ulation. This was manifested as a positive correlation between themean difference in responding “longer” for rTMS and CE (Pear-son’s r � 0.466, p � 0.044); notably, this effect was only found forrSMG and not Mid-Occ stimulation (r � 0.28, p � 0.05) (Fig.3b). Positive time-order errors in the present study may relate toadaptation-level effects resulting from the use of the same visualstimulus for both standard and comparison or to the inclusion ofa fixation point before standard stimulus onset. In addition, wetested for a relationship between baseline bias and variance. Pre-vious studies suggest that, when sensory evidence is noisier, sub-jects rely more on internal estimates that are more subject to bias(Jazayeri and Shadlen, 2010) and may increase variability (Cic-chini et al., 2012). We compared CE values with our measure ofvariance (DL) derived from baseline testing; no correlation be-tween CE and DL values was found (r � �0.15, p � 0.05). Addi-tionally, a linear regression test on the effect of CE and DL on thebehavioral data found no mediating effect of variance on theeither rSMG (t(18) � �0.299, p � 0.05) or Mid-Occ (t(18) ��0.572, p � 0.05) stimulation. This finding confirms the inde-pendence of bias and variance on timing behavior (Cicchini et al.,2012) and further suggests that the behavioral effect of TMS wasnot influenced by baseline variability.
To rule out the effect of response hand, a separate ANOVAwas conducted with the hand for responding “longer” as abetween-subject factor. No main effect of hand (F(1,17) � 0.156,p � 0.05) was detected or any interaction with experimental vari-ables (all p � 0.05). Also, to rule out a difference in respondingbetween days, we conducted a separate analysis on the non-TMStrials alone; no significant differences between day of stimulation
Figure 3. Behavioral effect of stimulation on temporal discrimination. a, Subjects exhibited a significant decrease in theproportion of trials on which they judged the second stimulus as longer on rTMS trials (*p � 0.05). b, Correlationcoefficients between CE, derived from baseline procedures indicating bias, and mean behavioral effect; larger CE scoresindicate an inherent bias to judge comparison stimuli as shorter. rTMS effects were calculated as the mean difference inresponding “longer” across duration lengths. Subjects with larger positive CE scores were less likely to see an effect of rSMGstimulation.
Wiener et al. • Temporal Encoding TMS/EEG J. Neurosci., August 29, 2012 • 32(35):12258 –12267 • 12261

(first or second) was found (F(1,17) � 1.961, p � 0.179) or inter-action with duration (F(1,17) � 0.755, p � 0.05).
We also tested for the effect of rTMS click trains on the behav-ioral responses. Previous reports have demonstrated that a seriesof rapid auditory clicks can induce longer estimations of per-ceived intervals (Penton-Voak et al., 1996). The discharge of therTMS unit in our paradigm elicited a click for each pulse, whichmay have influenced the observed effect; indeed, in our previousreport, stimulation of the vertex induced a shift similar to butsmaller than right rSMG stimulation. Previous investigations onthe effect of click trains demonstrated that the loudness of theclicks increases the size of the perceptual shift, suggesting an im-pact on arousal mechanisms (Burle and Casini, 2001). In thepresent study, the level of TMS stimulation was scaled to theindividual MT; higher MTs are associated with louder clicks dur-ing rTMS. Therefore, the effect of click trains constituted a natu-ral experiment within our study that would permit us to explorethe effect of click loudness. When MT was included as a covariate,an interaction with the effect of rTMS was found only for Mid-Occ (F(1,17) � 8.988, p � 0.008) and not rSMG (F(1,17) � 0.07, p �0.05) stimulation. The effect for control site stimulation was alsocontinuous, with higher MT values associated with largershifts in reporting the second stimulus as shorter (Pearson’sr � �0.588, p � 0.008). This finding suggests that the effect ofclick trains did influence the behavioral effect of rTMS butthat the effect was restricted to control site stimulation. Fur-thermore, this finding demonstrates that, in addition to taskdifficulty, individual differences in the impact of click trainson timing ability were also scaled between subjects. Notably,when we included both the bias and MT covariates in ouroriginal analysis, thus controlling for the influence of eachparameter, we detected a significant brain region by stimula-tion interaction (F(1,16) � 4.553, p � 0.049), suggesting thatthe effect of rSMG stimulation on behavior was not attribut-able to the influence of subject bias and click trains.
EEG resultsWe examined both standard and comparison stimulus intervalwaveforms (Fig. 4a). Consistent with previous reports, grand-averaged waveforms constructed for both visual stimuli exhib-ited sustained negative potentials that were maximal atfrontocentral sites (Fig. 4b). To examine the effect of rTMS onCNV amplitude, we first ruled out any effect of rTMS on theCNV waveforms during the comparison stimulus interval, forwhich we predicted no effect of rTMS. A repeated-measuresANOVA with Greenhouse–Geiser correction on the mean am-plitude measures collapsed across frontocentral sites revealedno main effect of brain region (F(1,18) � 0.109, p � 0.05),stimulation (F(1,18) � 0.0005, p � 0.05), or interaction(F(1,18) � 0.025, p � 0.05), indicating that rTMS effects did notextend into the comparison stimulus duration. A significantmain effect of measurement window was detected, with theCNV portion exhibiting higher negative amplitudes than theearly N1 portion (F(1,18) � 29.803, p � 0.00002), consistentwith previous data (Chen et al., 2010). No other interactionswere significant (all p � 0.05). A second analysis demonstratedno difference in either measurement window in non-TMSconditions between the days of stimulation (all p � 0.05).
For the standard stimulus duration, we did not detect a maineffect of brain region (F(1,18) � 1.793, p � 0.05) or stimulation(F(1,18) � 2.458, p � 0.05); however, we did detect a brain re-gion � stimulation interaction (F(1,18) � 5.046, p � 0.037). Stim-ulation of the right rSMG, but not the Mid-Occ region, induced a
large deviation in both the N1 and CNV components of the earlyand late measurement windows, characterized by significantlyhigher negative amplitudes (Fig. 4a). Similar to the comparisonstimulus, negative amplitudes were larger during the CNV por-tion than the early N1 portion (F(1,18) � 9.883, p � 0.03), but nointeraction with brain region, stimulation, and measurementwindow was detected (F(1,18) � 0.023, p � 0.05), indicating thatthe effect of rSMG stimulation was not larger for one window. Asecond analysis demonstrated no difference in either measure-ment window in non-TMS conditions between the day of stim-ulation (all p � 0.05).
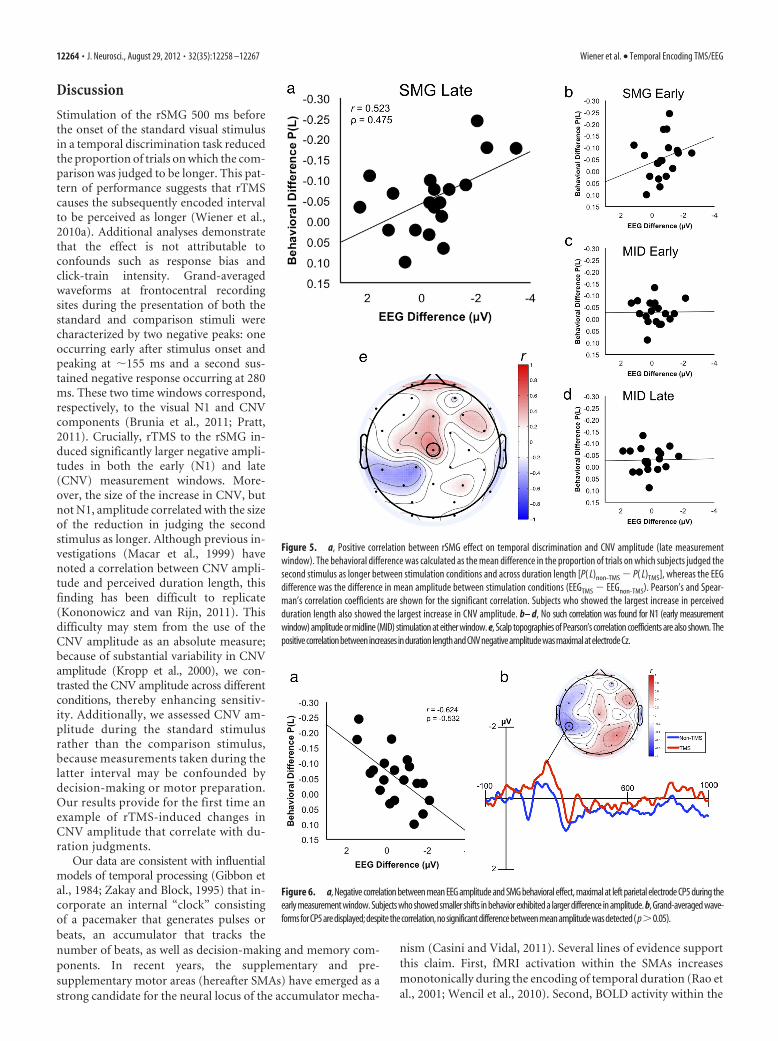
Correlation resultsWe reasoned that, if rTMS induces a change in performance onthe duration judgment task and this change is indexed by theCNV, one would expect a correlation between the tendency torespond “longer” and the magnitude of the CNV differences be-tween rTMS and non-rTMS trials. Consistent with this predic-tion, we found a significant correlation between the size of thedifference in the late measurement window waveforms and thedifference in behavioral performance for rSMG stimulationacross subjects (Pearson’s r � 0.526, p � 0.021) (Fig. 5a). Asignificant Spearman’s nonparametric correlation was alsofound, indicating that the result was not attributable to outliers(Spearman’s � � 0.476, p � 0.04). A similar analysis for Mid-Occstimulation did not reveal a significant correlation (Pearson’s r �0.016, p � 0.05; Spearman’s � � �0.004, p � 0.05) (Fig. 5d).Furthermore, a significant correlation was not found for the earlymeasurement window, encompassing the N1 waveform, and be-havioral performance for either rSMG (Pearson’s r � 0.273, p �0.05; Spearman’s � � 0.395, p � 0.05) (Fig. 5b) or Mid-Occ(Pearson’s r � 0.009, p � 0.05; Spearman’s � � �0.125, p � 0.05)stimulation (Fig. 5c), indicating that the effect was specific to thelate measurement window and the CNV waveform. Thus, thedata demonstrate that, for rSMG stimulation, subjects whoshowed the largest increase in CNV amplitude between stimula-tion and no-stimulation trials also showed the largest decrease inreporting the second stimulus as longer.
We additionally calculated scalp topographies to investigatethe spatial extent of rTMS-induced correlations by measuring thesame correlation at other electrode sites. The results of this ex-ploratory analysis revealed that the positive correlation betweenbehavioral shifts and CNV amplitude resulting from rTMS wasmaximal at the frontocentral sites of interest, at electrode Cz (Fig.5e). Furthermore, we found a negative correlation for left parietalelectrodes, maximal at CP5 (Pearson’s r � �0.624, p � 0.004;Spearman’s � � �0.532, p � 0.019) (Fig. 6a), and within the earlymeasurement window (uncorrected for multiple comparisons).Accordingly, this negative correlation demonstrated that sub-jects who showed little or no behavioral differences resultingfrom rTMS exhibited an increase in negative amplitude atthese sites. Although the effect was outside our hypothesizedregion of interest, waveforms at this site exhibited an increasein negative amplitude during the early measurement window(Fig. 6b). However, no significant difference between TMSand no-TMS was detected during this time period (t(18) �1.642, p � 0.05); therefore, we stress caution in the interpre-tation of this finding.
Because bias modulates the effect of rSMG stimulation, aneffect of bias should also be present on the CNV if this waveformserves as an index of temporal encoding. We subsequently rean-alyzed our EEG data to include the bias covariate; consistent with
12262 • J. Neurosci., August 29, 2012 • 32(35):12258 –12267 Wiener et al. • Temporal Encoding TMS/EEG

our behavioral analysis, we found a three-way interaction be-tween brain region, stimulation, and bias (F(1,17) � 5.317, p �0.034) during the standard interval encoding. Specifically, wefound a significant positive correlation (Pearson’s r � 0.447, p �0.055; Spearman’s � � 0.536, p � 0.018) between our bias cova-riate and the difference in amplitude for rSMG stimulation in the
late measurement window; larger inherent bias to judge the sec-ond stimulus as shorter was associated with a smaller differencein CNV amplitude between stimulation conditions. No signifi-cant effects were found for the early measurement window, vari-ance measures, or for either window after Mid-Occ stimulation(all p � 0.05).
Figure 4. a, Grand-averaged waveforms for all subjects, averaged across frontocentral scalp recording sites for standard and comparison stimulus presentations in rTMS and non-rTMS conditionsfor rSMG and Mid-Occ–parietal junction (Mid) stimulation sites. Shaded areas represent the measurement windows derived from global estimates and encompass early and late processingcomponents. rSMG stimulation trials demonstrated a significantly larger negative amplitude N1 and CNV during standard stimulus presentation; no changes were detected for comparison stimuluspresentation in either condition. Comparison stimulus waveforms are depicted for the average of all three comparison durations. Negativity is plotted upward. b, Scalp topographies for both the earlyand late measurement windows for both stimulation conditions. Negativity was maximal at frontocentral sites.
Wiener et al. • Temporal Encoding TMS/EEG J. Neurosci., August 29, 2012 • 32(35):12258 –12267 • 12263
Discussion
Stimulation of the rSMG 500 ms beforethe onset of the standard visual stimulusin a temporal discrimination task reducedthe proportion of trials on which the com-parison was judged to be longer. This pat-tern of performance suggests that rTMScauses the subsequently encoded intervalto be perceived as longer (Wiener et al.,2010a). Additional analyses demonstratethat the effect is not attributable toconfounds such as response bias andclick-train intensity. Grand-averagedwaveforms at frontocentral recordingsites during the presentation of both thestandard and comparison stimuli werecharacterized by two negative peaks: oneoccurring early after stimulus onset andpeaking at �155 ms and a second sus-tained negative response occurring at 280ms. These two time windows correspond,respectively, to the visual N1 and CNVcomponents (Brunia et al., 2011; Pratt,2011). Crucially, rTMS to the rSMG in-duced significantly larger negative ampli-tudes in both the early (N1) and late(CNV) measurement windows. More-over, the size of the increase in CNV, butnot N1, amplitude correlated with the sizeof the reduction in judging the secondstimulus as longer. Although previous in-vestigations (Macar et al., 1999) havenoted a correlation between CNV ampli-tude and perceived duration length, thisfinding has been difficult to replicate(Kononowicz and van Rijn, 2011). Thisdifficulty may stem from the use of theCNV amplitude as an absolute measure;because of substantial variability in CNVamplitude (Kropp et al., 2000), we con-trasted the CNV amplitude across differentconditions, thereby enhancing sensitiv-ity. Additionally, we assessed CNV am-plitude during the standard stimulusrather than the comparison stimulus,because measurements taken during thelatter interval may be confounded bydecision-making or motor preparation.Our results provide for the first time anexample of rTMS-induced changes inCNV amplitude that correlate with du-ration judgments.
Our data are consistent with influentialmodels of temporal processing (Gibbon etal., 1984; Zakay and Block, 1995) that in-corporate an internal “clock” consistingof a pacemaker that generates pulses orbeats, an accumulator that tracks thenumber of beats, as well as decision-making and memory com-ponents. In recent years, the supplementary and pre-supplementary motor areas (hereafter SMAs) have emerged as astrong candidate for the neural locus of the accumulator mecha-
nism (Casini and Vidal, 2011). Several lines of evidence supportthis claim. First, fMRI activation within the SMAs increasesmonotonically during the encoding of temporal duration (Rao etal., 2001; Wencil et al., 2010). Second, BOLD activity within the
Figure 5. a, Positive correlation between rSMG effect on temporal discrimination and CNV amplitude (late measurementwindow). The behavioral difference was calculated as the mean difference in the proportion of trials on which subjects judged thesecond stimulus as longer between stimulation conditions and across duration length [P( L)non-TMS � P( L)TMS], whereas the EEGdifference was the difference in mean amplitude between stimulation conditions (EEGTMS � EEGnon-TMS). Pearson’s and Spear-man’s correlation coefficients are shown for the significant correlation. Subjects who showed the largest increase in perceivedduration length also showed the largest increase in CNV amplitude. b– d, No such correlation was found for N1 (early measurementwindow) amplitude or midline (MID) stimulation at either window. e, Scalp topographies of Pearson’s correlation coefficients are also shown. Thepositivecorrelationbetweenincreases indurationlengthandCNVnegativeamplitudewasmaximalatelectrodeCz.
Figure 6. a, Negative correlation between mean EEG amplitude and SMG behavioral effect, maximal at left parietal electrode CP5 during theearly measurement window. Subjects who showed smaller shifts in behavior exhibited a larger difference in amplitude. b, Grand-averaged wave-formsforCP5aredisplayed;despitethecorrelation,nosignificantdifferencebetweenmeanamplitudewasdetected( p�0.05).
12264 • J. Neurosci., August 29, 2012 • 32(35):12258 –12267 Wiener et al. • Temporal Encoding TMS/EEG

SMAs has been found to positively covary with CNV amplitude(Nagai et al., 2004). Third, single-cell recordings in the SMAs inmonkeys exhibit ramping firing-rate patterns during temporalencoding (Mita et al., 2009). Finally, the SMAs exhibit a highlikelihood of activation across all explicit time perception tasks(Wiener et al., 2010b).
The finding that stimulation of the rSMG alters the CNV, awaveform generated at least in part by the SMAs, suggests that therSMG and SMAs are closely interconnected components of thedistributed neural system that mediates temporal processing. In-deed, there is both anatomic (Eickhoff et al., 2010) and physio-logic (Battelli et al., 2007) evidence of interactions between therSMG and SMA. Furthermore, neuroimaging studies using si-multaneous fMRI and EEG also demonstrate that parametricvariations in CNV amplitude, which activate the SMAs, also in-clude a frontoparietal network of structures encompassing theright inferior parietal lobe (Nagai et al., 2004; Scheibe et al.,2010).
One might envision at least two mechanisms by whichrSMG stimulation leads to a change in temporal processing inthe SMAs. First, neurons in the rSMG may serve as the pace-maker for the internal clock; rTMS would thus increase thefiring rate of the pacemaker, leading to a larger number ofpulses entering the accumulator, subserved by the SMAs, anda longer judgment of duration. The resultant increase in accu-mulation in the SMAs would manifest as a larger-amplitudeCNV. Alternatively, on the basis of studies demonstrating thattemporal processing is influenced by attention (Zakay andBlock, 1995), one might speculate that the rSMG serves as anattentional “gate” that modulates input to the accumulator,subserved by the SMAs.
An additional finding in the present study is that rSMGstimulation induced an increase in amplitude during the early(N1) time window. Several previous studies have notedchanges in the N1 response during temporal discriminationand attention tasks (Bendixen et al., 2005; Correa and Nobre,2008; Chen et al., 2010). These studies demonstrate that theN1 effect is enhanced when subjects attend to temporal fea-tures or judge stimuli to be longer. Consistent with this find-ing, the visual N1 component has commonly been associatedwith attentional orienting (Vogel and Luck, 2000). In the pres-ent study, the N1 effect at frontocentral electrodes did notcorrelate with duration judgments. This suggests that the en-hancement of the early N1 reflects a general increase in theattentional allocation to time, whereas the late CNV reflectsthe accumulation of temporal information toward an estimateof duration. This finding is consistent with the suggestion thatattention to time and temporal accumulation are separateprocesses, with attention influencing the subsequent level ofaccumulation. In conjunction with the effect on CNV ampli-tude, we suggest that the combination of N1 and CNV effectsimplicates the rSMG in the attentional allocation of resourcesto time and that this mechanism is accomplished by functionalconnectivity between this region and the SMAs. Consistentwith this notion, parietal activity commonly precedes frontalactivation when directing attention (Green and MacDonald,2008) and prefrontal–parietal coactivations, including theSMAs, are essential for sustaining attention (Ojeda et al.,2002).
The dissociation between early and late effects also demon-strated a differential effect of the early response window at aregion outside the frontocentral cluster of interest. We found anegative correlation with duration judgments; larger amplitudes
at CP5 after rTMS were associated with less of a behavioral effect.One possibility, then, is that variability in the EEG response torTMS in the present study represents individual differences instrategy. Because the left hemisphere has been associated withimplicit temporal attention (Coull and Nobre, 2008; Wiener etal., 2010c), differences at this site may reflect changes in atten-tional orienting to temporal features. However, we note therewere no significant differences in the mean amplitude betweenconditions at this site, and so this effect must be interpreted withcaution.
A second novel finding of the present study is the modulationof behavioral and EEG results by bias, as derived from the base-line psychometric task. Decision bias in time perception may takethe form of positive or negative time-order errors, in which thesubject displays an inherent predilection to judge the comparisonstimuli as shorter or longer, respectively (Hellstrom, 1985). Mostsubjects in our study displayed some form of bias, with the ma-jority of subjects exhibiting a positive time-order error, indicat-ing a preference to judge the comparison stimulus as shorteracross all interval variations. We found that subjects who werestrongly biased to judge the second stimulus as shorter do notshow as large an effect as those with less bias. We note that onepossibility for this difference is that subjects with greater inherentbias rely less on sensory evidence in generating temporal esti-mates (Jazayeri and Shadlen, 2010). Therefore, parietal stimula-tion may have little effect in those subjects if rTMS led to adisruption of sensory encoding.
Additionally, EEG analyses demonstrated an effect of bias. Wefound that, for the CNV, but not N1, larger positive bias scoreswere associated with smaller differences induced by rSMG stim-ulation. This finding is also consistent with the hypothesis thatthe CNV serves as an index of temporal encoding. Previous stud-ies have demonstrated that the CNV signal covaries with theprobability of an upcoming decision (Scheibe et al., 2010), sug-gesting that the CNV is influenced by previous expectations. Biasto judge the comparison stimulus as short is thus likely reflectedin the CNV signal if it represents an index of the temporal accu-mulation. Two hypothetical neural mechanisms for the influenceof bias have been suggested, with bias influencing either the start-ing point of accumulation or the drift rate to a threshold bound-ary (Diederich and Busemeyer, 2006). Because the influence ofbias on the starting point would occur early in stimulus encodingand we found no effect of bias on N1, this seems an unlikelyaccount for our data. Our data are more consistent with the no-tion of a change in drift rate, as hypothesized recently by Simen etal. (2011).
ConclusionsWe demonstrate that rTMS-induced alterations in CNV am-plitude index the state of temporal encoding, with larger am-plitudes associated with longer perceived durations. Theseresults are independent of changes in decision-making, bias,click trains, and motor preparation and occur at the late stageof temporal encoding rather than the initial registration of avisual event. We propose that temporal encoding of subsecondintervals entails the attending of sensory information by asso-ciation cortices. By virtue of connections between these corti-ces and the SMAs, this input is integrated to generate arepresentation of duration, which can be indexed by changesin the CNV.
ReferencesBattelli L, Pascual-Leone A, Cavanagh P (2007) The “when” pathway of the
right parietal lobe. Trends Cogn Sci 11:204 –210.
Wiener et al. • Temporal Encoding TMS/EEG J. Neurosci., August 29, 2012 • 32(35):12258 –12267 • 12265

Bendixen A, Grimm S, Schroger E (2005) Human auditory event-relatedpotential predict duration judgments. Neurosci Lett 383:284 –288.
Berardelli A, Inghilleri M, Rothwell JC, Romeo S, Curr a A, Gilio F, ModugnoN, Manfredi M (1998) Facilitation of muscle evoked responses after re-petitive cortical stimulation in man. Exp Brain Res 122:79 – 84.
Brainard DH (1997) The psychophysics toolbox. Spat Vis 10:433– 436.Brunia CH, van Boxtel GJ, Bocker KB (2011) Negative slow waves as indices
of anticipation: the Bereitschaftspotential, the contingent negative varia-tion, and the stimulus-preceding negativity. In: The Oxford handbook ofevent-related potential components (Luck SA, Kappenman E, eds). Ox-ford, UK: Oxford UP.
Buhusi CV, Meck WH (2005) What makes us tick? Functional and neuralmechanisms of interval timing. Nat Rev Neurosci 6:755–765.
Burle B, Casini L (2001) Dissociation between activation and attention ef-fects in time estimation: implications for internal clock models. J ExpPsychol Hum Percept Perform 27:195–205.
Casini L, Vidal F (2011) The SMAs: neural substrate of the temporal accu-mulator? Front Integr Neurosci 5:35.
Chen Y, Huang X, Yang B, Jackson T, Peng C, Yuan H, Liu C (2010) Anevent-related potential study of temporal information encoding and de-cision making. Neuroreport 21:152–155.
Cicchini GM, Arrighi R, Cecchetti L, Giusti M, Burr DC (2012) Optimalencoding of interval timing in expert percussionists. J Neurosci32:1056 –1060.
Correa A, Nobre AC (2008) Neural modulation by regularity and passage oftime. J Neurophysiol 100:1649 –1655.
Coull J, Nobre A (2008) Dissociating explicit timing from temporal expec-tation with fMRI. Curr Opin Neurobiol 18:137–144.
Diederich A, Busemeyer JR (2006) Modeling the effects of payoff on re-sponse bias in a perceptual discrimination task: bound-change, drift-rate-change, or two-stage-processing hypothesis. Percept Psychophys 68:194 –207.
Eickhoff SB, Jbabdi S, Caspers S, Laird AR, Fox PT, Zilles K, Behrens TE(2010) Anatomical and functional connectivity of cytoarchitectonic ar-eas within the human parietal operculum. J Neurosci 30:6409 – 6421.
Fan J, Kolster R, Ghajar J, Suh M, Knight RT, Sarkar R, McCandliss BD(2007) Response anticipation and response conflict: an event-related po-tential and functional magnetic resonance imaging study. J Neurosci27:2272–2282.
Gibbon J, Church RM, Meck WH (1984) Scalar timing in memory. Ann NYAcad Sci 423:52–77.
Gontier E, Le Dantec C, Leleu A, Paul I, Charvin H, Bernard C, Lalonde R,Reba ï M (2007) Frontal and parietal ERPs associated with durationdiscriminations with or without task interference. Brain Res 1170:79 – 89.
Green JJ, MacDonald JJ (2008) Electrical neuroimaging reveals timing ofattentional control in human brain. PLoS Biol 6:730 –738.
Hamidi M, Slagter HA, Tononi G, Postle BR (2010) Brain responses evokedby high-frequency repetitive transcranial magnetic stimulation: an event-related potential study. Brain Stimul 3:2–14.
Hellstrom A (1985) The time-order error and its relatives: mirrors of cog-nitive processes in comparing. Psych Bull 97:35– 61.
Ikeda A, Shibasaki H, Kaji R, Terada K, Nagamine T, Honda M, Kimura J(1997) Dissociation between contingent negative variation (CNV) andBereitschaftspotential (BP) in patients with parkinsonism. Electroen-cephalogr Clin Neurophysiol 102:142–151.
Iwahashi M, Katayama Y, Ueno S, Iramina K (2009) Effect of transcranialmagnetic stimulation on P300 of event-related potential. Conf Proc IEEEEng Med Biol Soc 2009:1359 –1362.
Jazayeri M, Shadlen MN (2010) Temporal context calibrates interval tim-ing. Nat Neurosci 13:1020 –1026.
Jung TP, Makeig S, Westerfield M, Townsend J, Courchesne E, Sejnowski TJ(2000) Removal of eye activity artifacts from visual event-related poten-tials in normal and clinical subjects. Clin Neurophysiol 111:1745–1758.
Koessler L, Maillard L, Benhadid A, Vignal JP, Felblinger J, Vespignani H,Braun M (2009) Automated cortical projection of EEG sensors: ana-tomical correlation via the international 10 –10 system. Neuroimage46:64 –72.
Kononowicz TW, van Rijn H (2011) Slow potentials in time estimation: therole of temporal accumulation and habituation. Front Integr Neurosci5:48.
Korhonen RJ, Hernandez-Pavon JC, Metsomaa J, Maki H, Ilmoniemi RJ,Sarvas J (2011) Removal of large muscle artifacts from transcranial mag-
netic stimulation-evoked EEG by independent component analysis. MedBiol Eng Comput 49:397– 407.
Kropp P, Kiewitt A, Gobel H, Vetter P, Gerber WD (2000) Reliability andstability of contingent negative variation. Appl Psychophysiol Biofeed-back 25:33– 41.
Le Dantec C, Gontier E, Paul I, Charvin H, Bernard C, Lalonde R, Rebai M(2007) ERPs associated with visual duration discriminations in prefron-tal and parietal cortex. Acta Psychol (Amst) 125:85–98.
Lehmann D, Skrandies W (1980) Reference-free identification of compo-nents of checkerboard-evoked multichannel potential fields. Electroen-cephalogr Clin Neurophysiol 48:609 – 621.
Levit-Binnun N, Litvak V, Pratt H, Moses E, Zaroor M, Peled A (2010)Differences in TMS-evoked responses between schizophrenia patientsand healthy controls can be observed without a dedicated EEG system.Clin Neurophysiol 121:332–339.
Lieberman HR, Pentland AP (1983) Microcomputer-based estimation ofpsychophysical thresholds: the best PEST. Behav Res Methods 14:21–25.
Macar F, Vidal F (2003) The CNV peak: an index of decision making andtemporal memory. Psychophysiology 40:950 –954.
Macar F, Vidal F (2004) Event-related potentials as indices of time process-ing: a review. J Psychophysiol 18:89 –104.
Macar F, Vidal F, Casini L (1999) The supplementary motor area in motorand sensory timing: evidence from slow brain potentials. Exp Brain Res125:271–280.
Mita A, Mushiake H, Shima K, Matsuzaka Y, Tanji J (2009) Interval timecoding by neurons in the presupplementary and supplementary motorareas. Nat Neurosci 12:502–507.
Murray MM, Brunet D, Michel CM (2008) Topographic ERP analyses: astep-by-step tutorial review. Brain Topogr 20:249 –264.
Nagai Y, Critchley HD, Featherstone E, Fenwick PB, Trimble MR, Dolan RJ(2004) Brain activity relating to the contingent negative variation: anfMRI investigation. Neuroimage 21:1232–1241.
Ng KK, Tobin S, Penney TB (2011) Temporal accumulation and decisionprocesses in the duration bisection task revealed by contingent negativevariation. Front Integr Neurosci 5:77.
Ojeda N, Ortuno F, Arbizu J, Lopez P, Martí-Climent JM, Penuelas I,Cervera-Enguix S (2002) Functional neuroanatomy of sustained atten-tion in schizophrenia: contribution of parietal cortices. Hum Brain Mapp17:116 –130.
Pentland A (1980) Maximum likelihood estimation: the best PEST. PerceptPsychophys 28:377–379.
Penton-Voak IS, Edwards H, Percival A, Wearden JH (1996) Speeding upan internal clock in humans? Effects of click trains on subjective duration.J Exp Psychol Hum Percept Perform 22:307–320.
Pflieger ME (2001) Theory of a spatial filter for removing ocular artifactswith preservation of EEG. EMSE Workshop, Princeton, September 7– 8.
Praamstra P, Kourtis D, Kwok HF, Oostenveld R (2006) Neurophysiologyof implicit timing in serial choice reaction-time performance. J Neurosci26:5448 –5455.
Pratt H (2011) Sensory ERP components. In: The Oxford handbook ofevent-related potential components (Luck SA, Kappenman E, eds). Ox-ford, UK: Oxford UP.
Rao SM, Mayer AR, Harrington DL (2001) The evolution of brain activa-tion during temporal processing. Nat Neurosci 4:317–323.
Scheibe C, Ullsperger M, Sommer W, Heekeren HR (2010) Effects of para-metrical and trial-to-trial variation in prior probability processingrevealed by simultaneous electroencephalogram/functional magnetic res-onance imaging. J Neurosci 30:16709 –16717.
Simen P, Balci F, de Souza L, Cohen JD, Holmes P (2011) A model of inter-val timing by neural integration. J Neurosci 31:9238 –9253.
Tarantino V, Ehlis AC, Baehne C, Boreatti-Huemmer A, Jacob C, Bisiacchi P,Fallgatter AJ (2010) The time course of temporal discrimination: anERP study. Clin Neurophysiol 121:43–52.
van Rijn H, Kononowicz TW, Meck WH, Ng KK, Penney TB (2011) Con-tingent negative variation and its relation to time estimation: a theoreticalevaluation. Front Integr Neurosci 5:91.
Veniero D, Bortoletto M, Miniussi C (2009) TMS-EEG co-registration: onTMS-induced artifact. Clin Neurophysiol 120:1392–1399.
Vogel EK, Luck SJ (2000) The visual N1 component as an index of a dis-crimination process. Psychophysiology 37:190 –203.
Walsh V, Pascual-Leone A (2003) Transcranial magnetic stimulation: a
12266 • J. Neurosci., August 29, 2012 • 32(35):12258 –12267 Wiener et al. • Temporal Encoding TMS/EEG

neurochronometrics of mind. Cambridge, MA: Massachusetts Instituteof Technology.
Walter WG, Cooper R, Aldridge VJ, McCallum WC, Winer AL (1964) Con-tingent negative variation: an electric sign of sensorimotor associationand expectancy in the human brain. Nature 25:380 –384.
Wencil EB, Coslett HB, Aguirre GK, Chatterjee A (2010) Carving the clockat its component joints: neural bases for interval timing. J Neurophysiol104:160 –168.
Wichmann FA, Hill NJ (2001a) The psychometric function. I. Fitting, sam-pling, and goodness of fit. Percept Psychophys 63:1293–1313.
Wichmann FA, Hill NJ (2001b) The psychometric function. II. Bootstrap-based confidence intervals and sampling. Percept Psychophys 63:1314 –1329.
Wiener M, Hamilton R, Turkeltaub P, Matell MS, Coslett HB (2010a) Fastforward: rSMG stimulation alters time measurement. J Cogn Neurosci22:23–31.
Wiener M, Turkeltaub P, Coslett HB (2010b) The image of time: a voxel-wise meta-analysis. Neuroimage 49:1728 –1740.
Wiener M, Turkeltaub PE, Coslett HB (2010c) Implicit timing activates theleft inferior parietal cortex. Neuropsychologia 48:3967–3971.
Xuan B, Chen XC, He S, Zhang DR (2009) Numerical magnitude modulatestemporal comparison: an ERP study. Brain Res 1269:135–142.
Zakay D, Block RA (1995) An attentional gate model of prospective timeestimation. In: Time and the dynamic control of behavior (Richelle M, DeKeyser V, D’Ydewalle G, Vandierendonck A, eds), pp 167–178. Liege,Belgium: Universite de Liege.
Wiener et al. • Temporal Encoding TMS/EEG J. Neurosci., August 29, 2012 • 32(35):12258 –12267 • 12267