packaged food in south korea - izvozno okno · south korea is a net food and beverage importer as...
TRANSCRIPT

1
PACKAGED FOOD
IN SOUTH KOREA Market Analysis Report
AUGUST 2012

2
CONTENTS
EXECUTIVE SUMMARY
1 GLOBAL FOOD MARKET 4
2 KOREA’S FOOD MARKET 5
3 CONSUMER PROFILE 6
4 CONSUMER TRENDS 7
5 MAJOR SUBSECTORS 8
6 MARKET STRUCTURE 10
7 TRADE 11
8 DISTRIBUTION CHANNELS 12
9 KEY RETAILERS 13
10 DISTRIBUTION TRENDS 14
11 OPPORTUNITIES IN PACKAGED FOOD 14
12 NO CHALLENGES IN PACKAGED FOOD 15
13 CONCLUSION 15
3
South Korea’s packaged food market is ranked 15th
largest in the world, with a value of US$20.0 billion in
2010. Rising incomes have driven market growth and pushed consumer agri-food imports to US$5.7 billion. At
the same time, consumer demand has evolved with recent socioeconomic changes. An aging population,
growing income disparity, and busier lifestyles have
generated interest in health and wellness and convenience-oriented food products. These
developments have fostered the trends of product premiumization and value consciousness.
The packaged food market is fairly concentrated, with
major South Korean manufacturers controlling significant
portions of their respective subsectors. The retail sector that imports and distributes packaged food is similarly
concentrated. Hypermarkets and supermarkets distribute the vast majority of packaged food and compete against
brand names with their own private labels. European
firms thus face no entry barriers in terms of South Korea-EU FTA, but also have opportunities to supply
distributors and capitalize on present market trends.
Executive Summary
4
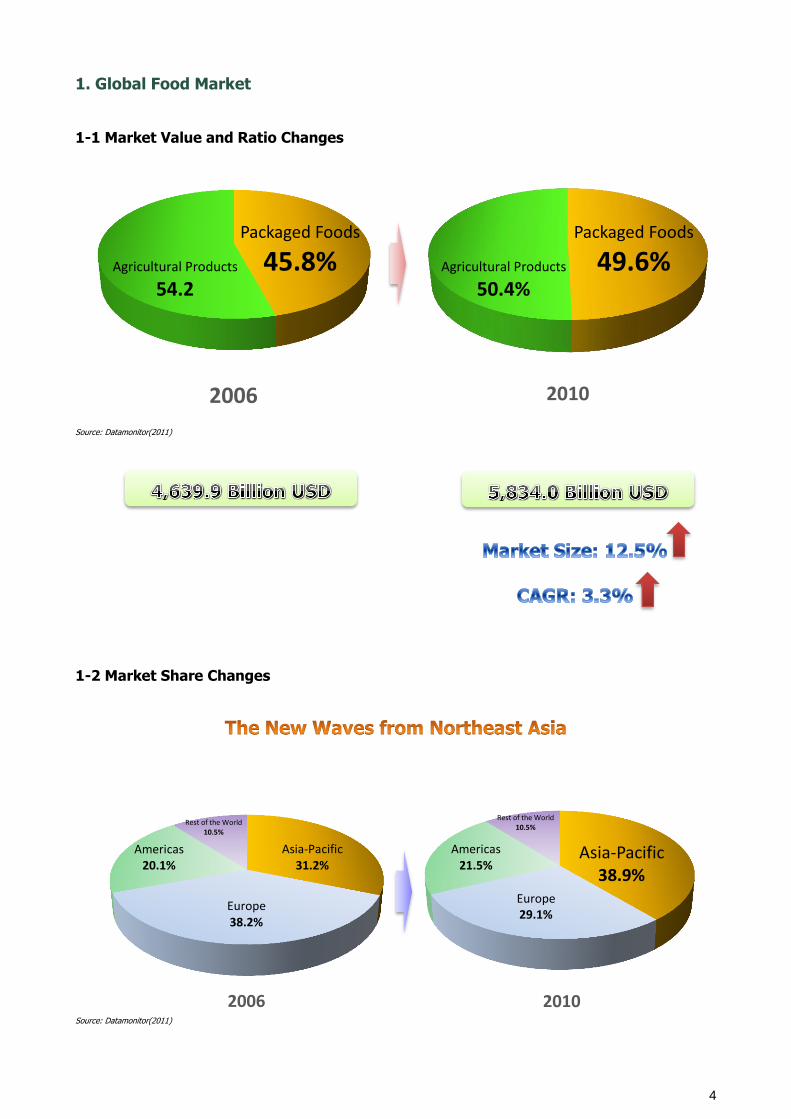
1. Global Food Market 1-1 Market Value and Ratio Changes
2006
2010
Source: Datamonitor(2011)
1-2 Market Share Changes
Source: Datamonitor(2011)
Rest of the World 10.5%
Asia-Pacific 31.2%
Europe 38.2%
Americas 20.1%
Asia-Pacific 38.9%
Europe 29.1%
Americas 21.5%
Rest of the World 10.5%
2006 2010
Agricultural Products
54.2
Packaged Foods
45.8% Agricultural Products
50.4%
Packaged Foods
49.6%

5
1-3 Packaged/Processed Food Market Growth Rate in Northeast Asia
▣ As of 2011, in terms of market value, packaged food market of Northeast Asia stands for…
about 25% of whole global packaged food market
about 80% of whole Asian packaged food market
about 55% of whole European packaged food market
Global Market
European Market
Whole Asian Market
Northeast Asian Market
Rest of the Asia
2007 3.3% 2.6% 4.9% 5.0% 4.6
2008 3.3% 2.6% 4.8% 4.9% 4.7
2009 3.3% 2.6% 4.9% 5.0% 4.8
2010 3.3% 2.6% 4.9% 5.0% 4.7
2011 3.3% 2.6% 4.9% 5.0% 3.7
2012 3.3% 2.6% 4.8% 5.0% 3.2
2. Korea’s Food Market
South Korea is a net food and beverage importer as the country is only self-sufficient in a limited number of
key agricultural commodities (e.g. rice). The country’s GDP per capita is US$23,639.
The Korean food market is currently $45.7 Billion and expects to grow at 5.6% to $53.5 Billion by 2013.
• Growth of per capita expenditure on food
• Increased needs for high quality products-organic and premium food
• Rapid growth of mass grocery retail
Source: Business Monitor
Source: Business Monitor
39 40.9 45.7
47.9 49.4 53.5
2008 2009 2010 2011 2012 2013
Market Size
830 835 921 940
989 1069
2008 2009 2010 2011 2012 2013
Per Capita Food Consumption
Unit : $
The Asia-Pacific area, especially Northeast Asia, is one of the most attractive markets for Packaged/Processed Food

6
3 Consumer Profile
3-1 Income
South Koreans have rising incomes but also face increasing costs of living. Per capita disposable income rose
35.3% from US$9,574 in 2000 to US$12,955 in 2010, and household disposable income increased 11.2% from US$31,447 to US$34,955. There are now more upper and upper-middle class households than ever
before. However, the household cost of living rose by 6.8% to reach US$28,567. Income is increasingly spent on housing, communications, and alcoholic beverages and tobacco. Household debt has similarly reached
record levels, due in large part to higher housing costs.
3-2 Households
Overall, household size is on the decline in South Korea. An increasing number of people live alone, and
fewer couples are having children. Between 2000 and 2010, single-person households increased by 38.8%, reflecting the trends of later marriage and rising divorce rates. In addition, couples are delaying child-rearing,
and the number of empty nesters (couples whose children have moved out) is rising.
Household Type Imports 2010 Growth 2005-2010 Growth
2000-2010 2000 2010 2000 2010
Single Person 2,450 3,401 15.5% 18.5% 38.8%
Single-Parent Family 1,047 1,142 6.6% 6.2% 9.1%
Couple Without Children 2,306 3,514 14.6% 19.2% 52.4%
Couple With Children 7,665 8,663 48.6% 47.2% 13.0%
Others 2,297 1,618 14.6% 8.8% -29.6%
Total 15,765 18,338 100.0% 100.0% 16.3%
Source: Euromonitor International
3-3 Health
Health awareness is growing, as aging South Koreans are keen to pursue longevity. Consumers have become
increasingly cognizant of the importance of exercise, as well as the risks associated with diseases and rising obesity rates. Between 2000 and 2010, the obesity rate rose from 2.9% to 11.4%, while the overweight
proportion of the population reached 39.8%. In addition, health expenditure tripled to US$1,350 per capita. Recent incidents involving food contamination have drawn further attention to the safety and quality of food.
3-4 Food Expenditure South Koreans are spending more on food, with food representing 14.2% of total consumer spending. From 2005 to 2010, food expenditure grew by 11.1% to reach US$73.3 billion. This came largely from the increased consumption of bread and cereals, meat, vegetables, and fruit – which account for a combined 59.6% of food expenditure. In the coming years, food expenditure is expected to grow by 17.5%, with the largest gains coming from fruits and vegetables.
Consumer Expenditure on Food in US$ millions
Segment
Expenditure % Growth
Value Share 2005-2010
Total 2010-2015
Total
Bread and Cereals 12,000 16.4% 8.5% 8.1%
Meat 11,135 15.2% 8.7% 14.0%
Vegetables 10,851 14.8% 10.8% 21.1%
Fruit 9,675 13.2% 17.5% 20.5%
Fish and Seafood 8,327 11.4% 5.9% 11.2%
Milk, Cheese and Eggs 6,462 8.8% 17.7% 20.3%

7
Sugar and Confectionery 6,078 8.3% 11.8% 26.1%
Oils and Fats 4,739 6.5% 11.0% 18.0%
Other Food 4,071 5.5% 13.3% 32.8%
Total 73,339 100.0% 11.1% 17.5%
Source: Euromonitor International
4. Consumer Trends 4-1 Convenience
Time constraints are driving the demand for convenience products and more timely ways of shopping. The increase in single-person households, the rising numbers of women in the workforce, and longer work
commutes have reduced the time available for grocery shopping and home meal preparation. Convenience
foods in smaller packages, such as ready-meals and instant noodles, have gained popularity. Moreover, this trend has stimulated the growth of one-stop shopping at hypermarkets, and has spurred internet retailing.
4-2 Health and Wellness Increased health awareness has generated demand for health food. South Koreans have shown interest in
foods made with natural ingredients, fewer preservatives, and an absence of monosodium glutamate (MSG). There has been a shift toward chilled processed foods, as they are perceived to be fresher than frozen and
dehydrated foods. South Koreans have also gravitated toward organic and domestically produced food, and
have demonstrated a willingness to pay more for higher quality.
4-3 Consumption Polarization
Income disparity among households has influenced the recent consumption patterns of product
premiumization and value consciousness. In general, households without children have more disposable
income per member than households with children. As such, they have a willingness to pay more for health,
convenience, and quality. Indeed, households with children are more price-sensitive, thus contributing to the
emergence of private label products.
4-4 Product Innovation
Packaged food innovation reflects the trends described above. Of the 2,759 new product launches between
2000 and 2010 in South Korea, 1,568 (56.8%) had natural/health claims and 981 (35.6%) had convenience
claims. Products under the “demographic” category largely represented products aimed at children, the
health-conscious and premium buyers. Popular demand grew quickly, as the number of launches in 2010
was much larger than the number in 2005.
Product Launches of Packaged Food by Claim Category
Claim Category Total
Launches 2000-2010
Share of Total
Launches
2005 2010
Natural 1,568 56.8% 47 439
Demographic 1,049 38.0% 55 266
Convenience 981 35.6% 39 317
Functional 434 15.7% 27 214
Ethical and Environmental 138 5.0% 2 48
Source: MINITEL

8
Product Launches of Packaged Food by Top Ten Claims
Claim Category Total
Launches 2000-2010
Share of Total
Launches
2005 2010
No Additives/Preservatives 1,070 38.8% 25 316
Vitamin/Mineral Fortified 771 27.9% 77 84
Premium 680 24.6% 26 185
Children (5-12) 613 22.2% 43 119
Microwaveable 555 20.1% 37 160
Added Calcium 405 14.7% 33 32
Organic 321 11.6% 13 79
Low/Reduced Sugar 312 11.3% 26 58
Time/Speed 227 8.2% 0 69
Digestive 157 5.7% 11 88
Source: MINTEL
5. Major Subsectors
5-1 Overview
South Korea is the fifteenth-largest packaged food market in the world. The nutritional food and staples
category accounts for over half of this sector, while impulse and indulgence food makes up over one quarter.
In recent years, price competition and reduced demand have cut sales by 4.3%. Between 2010 and 2015,
this sector will likely experience further downward pressure on prices, as sales growth is forecast to be
negative despite volume gains. Meal solutions are the only subsector expected to grow in both sales and
volume.
Sales of Packaged Food, in US$ millions and % Growth
Subsector
Sales 2010 Value Growth Volume Growth
Value Share 2005-2010
Total 2010-2015
Total 2005-2010
Total 2010-2015
Total
Nutritional Food and Staples 11,491.3 54.0% -7.4% -4.1% -7.2% -0.3%
Impulse and Indulgence Food 5,849.5 27.5% -2.4% -0.5% 3.6% 4.8%
Meal Solutions 3,942.2 18.5% 2.7% 5.6% 6.9% 10.8%
Total 21,283.0 100.0% -4.3% -1.3% -4.4% 1.7%
Source: Euromonitor International
5-2 Nutritional Food and Staples
Valued at US$11.5 billion in 2010, nutritional food and staples is the largest subsector, with dairy, rice, and
noodles as its major segments. Sales shrank by 7.4% between 2005 and 2010, especially in rice and baby
food. The reduction in the child population and the growth of smaller households will likely lead to further
decline in dairy and baby food sales. Despite government promotion of rice-based products (rice chips and
rice bread, for example), the demand for rice is diminishing, as South Koreans have recently shown greater
interest in Western cuisine. Meal replacement products are the segment with the highest sales growth
forecast.

9
Sales of Nutritional Food and Staples by Segment, in US$ millions and % Growth
Subsector
Sales 2010 Value Growth Volume Growth
Value Share 2005-2010
Total 2010-2015
Total 2005-2010
Total 2010-2015
Total
Dairy 4,459.2 38.8% -3.7% -0.5% -5.6% 1.8%
Rice 3,135.7 27.3% -24.5% -20.6% -14.1% -7.3%
Noodles 2,138.5 18.6% 5.9% 2.1% 15.0% 13.2%
Oils and Fats 672.7 5.9% 7.4% 12.7% 12.0% 19.4%
Baby Food 523.8 4.6% -10.4% -7.3% -5.7% -8.9%
Meal Replacement 252.5 2.2% 249.2% 47.8% 33.3% 12.5%
Breakfast Cereals 155.4 1.4% -7.1% -7.1% -3.4% 1.0%
Spreads 145.1 1.3% -6.0% -5.4% 3.5% 4.1%
Pasta 8.4 0.1% 6.6% 10.3% 17.2% 17.6%
Total 11,491.3 100.0% -7.4% -4.1% -4.1% -0.3%
Source: Euromonitor International
5-3 Impulse and Indulgence Food
Driven by ice cream and baked goods sales, the impulse and indulgence food subsector is valued at US$5.8
billion. Sales decreased by 2.4% between 2005 and 2010 despite volume growth. Major segments include
ice cream, baked goods, and confectionery, as these segments account for three quarters of total sales.
Future decline is likely, given the health concerns about sugar and the shrinking market of child consumers.
Snack bars and ice cream, however, are expected to experience growth.
Sales of Impulse and Indulgence Food by Segment, in US$ millions and % Growth
Subsector
Sales 2010 Value Growth Volume Growth
Value Share 2005-2010
Total 2010-2015
Total 2005-2010
Total 2010-2015
Total
Ice Cream 1,801.8 30.8% 2.0% 6.5% 2.1% 9.6%
Baked Goods 1,531.6 26.2% 4.7% 2.6% 11.6% 8.2%
Confectionery 993.1 17.0% -11.4% -10.2% -4.2% -0.9%
Biscuits 795.8 13.6% -10.2% -6.1% -3.6% 2.6%
Sweet and Savory Snacks 719.7 12.3% -3.8% -4.6% 1.9% -3.7%
Snack Bars 7.5 0.1% -2.3% 8.1% 0.0% 16.7%
Total 5,849.5 100.0% -2.4% -0.5% 3.6% 4.8%
Source: Euromonitor International
5-4 Meal Solutions
Meal solutions are the smallest subsector at US$3.9 billion in sales, yet it grew the most at 2.7 % over the
past five years. The major segments are sauces, dressings and condiments, chilled processed food, and
canned/preserved food. This subsector is a beneficiary of recent health and convenience trends. There has
been a shift toward chilled processed food, since it is perceived as being healthier and fresher than frozen
and dehydrated foods. Popular interest in convenience has generated demand for ready meals. In the next
few years, meal solutions is expected to be the fastest-growing subsector at 5.6% in sales and
10.8% in volume.

10
Sales of Meal Solutions by Segment, in US$ millions and % Growth
Subsector
Sales 2010 Value Growth Volume Growth
Value Share 2005-2010
Total 2010-2015
Total 2005-2010
Total 2010-2015
Total
Sauces, Dressings and Condiments 1,290.0 32.7% 8.3% 8.3% 8.3% 11.0%
Chilled Processed Food 1,191.1 30.2% 1.1% 7.5% 7.9% 13.6%
Canned/Preserved Food 747.4 19.0% -2.2% 1.9% 2.0% 9.4%
Frozen Processed Food 541.7 13.7% -1.9% -3.2% 5.8% 2.7%
Ready Meals 118.5 3.0% 15.3% 26.1% 21.4% 27.1%
Soup 53.5 1.4% 5.8% -5.0% -6.0% -6.4%
Total 3,942.2 100.0% 2.7% 5.6% 6.9% 10.8%
Source: Euromonitor International
6. Market Structure
The packaged food manufacturing sector has a four-firm concentration ratio (the market share held by the
top four firms, abbreviated to CR4) of 27.2%. While this gives the appearance of a competitive sector, some
subsectors and the segments within them are highly concentrated, with ratios that exceed three-quarters.
The category of nutritional food and staples is fairly competitive with a CR4 of 32.2%, while meal solutions
maintain 52.2%, and impulse and indulgence food has 61.4%. Segments with high CR4s indicate difficult
market entry, as incumbents likely have extensive supply chain networks and the ability to outlast new
entrants in price-competitive situations. Several companies dominate multiple segments, and since 2005,
market concentration has only increased across subsectors and in the sector as a whole.
Four-Firm Concentration Ratios (CR4)
Subsector CR4
Top Companies, 2009 2005 2009 Change
Nutritional and Staples 29.2 32.2 3.0 Seoul Dairy, Nong Shim, Maeil Dairy, Namyang Dairy
Impulse and Indulgence 59.9 61.4 1.5 Lotte Confectionery, Orion, Haitai Confectionery, Artisanal
Meal Solutions 42.4 52.2 9.8 CJ Cheil Jedang, Daesang, Dongwon F&B, Lotte Ham & Milk
Overall 21.7 27.2 5.5 Lotte Confectionery, Nong Shim, Seoul Dairy, CJ Cheil Jedang
Source: Euromonitor International
6-1 Key Manufacturers
CJ Cheil Jedang is largely a producer of meal solutions, with leading market shares in ready meals, chilled
processed food, and sauces, dressings, and condiments. It had sales of US$3.0 billion in 2009, and operates
eighteen factories. The company has a reputation for product innovation. It does not manufacture for private
labels.
Nong Shim is the leading manufacturer of instant noodles and sweet and savory snacks, both of which make
up 60% of its sales. The company had sales of US$2.0 billion in 2007. Nong Shim is known for its
development of instant noodle cups. It maintains six factories in South Korea.
Lotte Confectionery produces impulse and indulgence products, and is the market leader in confectionery,
bakery products, ice cream, and sweet and savory snacks. Its sales in 2009 were US$1.0 billion. It has four
factories in South Korea.

11
7. Trade
7-1 South Korea’s Imports
South Korea’s goal of agricultural self-sufficiency has been unattainable thus far. A lack of arable land, low
agricultural productivity, and increasing urbanization has kept the country a net importer of food. Despite
high tariffs and import quotas, agri-food imports have increased substantially in recent years.
Top Five Agri-food Suppliers in US$ millions
Country Imports Share
2005 2010 Growth 2005 2010
United States 718.5 1,577.3 119.5% 19.9% 27.7%
China 541.4 861.2 59.1% 15.0% 15.1%
Australia 655.2 771.6 17.8% 18.1% 13.5%
New Zealand 292.4 286.2 -2.1% 8.1% 5.0%
Philippines 177.0 284.9 61.0% 4.9% 5.0%
World 3,616.6 5,695.0 57.5% 100.0% 100.0%
Source: Global Trade Atlas
In 2010, South Korea imported over US$5.7 billion of consumer agri-food from around the world, up 57.5%
over imports in 2005. Imports from the United States, China, and Australia accounted for more than half of
this amount. The United States raised its share of South Korean imports to 27.7% between 2005 and 2010.
Beef, pork, and fruits and nuts account for half of South Korea’s consumer agri-food imports. These
commodities have experienced significant sales and volume growth in recent years, with high double-digit
growth in some cases.
South Korea’s Top Consumer Agri-food Imports, in US$ millions
Commodity Imports 2010 Growth 2005-2010
Value Share Value Volume
Beef Products 1,185.6 20.8% 61.3% 48.5%
Fruits and Nuts 887.3 15.6% 71.2% 23.7%
Pork Products 712.5 12.5% 15.2% 9.1%
Vegetable Products 620.9 10.9% 71.9% 15.3%
Dairy Products 379.8 6.7% 70.6% 17.8%
All Commodities 5,695.0 100.0% 57.5% -
Source: Global Trade Atlas Imports Status of the Top Five Countries in 2011
(Unit: cases, thousand tons, million US dollars)
No Country Case Rate Country Weight Rate Country Amount Rate
1 China 92,955 29.7 USA 3,644 27.1 USA 2,734 20.7
2 USA 48,798 15.6 China 2,497 18.5 China 2,683 20.3
3 Japan 36,090 11.5 Australia 2,212 16.4 Australia 1,082 8.2
4 France 13,538 4.3 Thailand 721 5.4 Thailand 651 4.9
5 Italy 12,304 3.9 Brazil 673 5.0 Brazil 571 4.3
sum of
five
countries
203,685 65.1
sum of
five
countries
9,747 72.4
sum of
five
countries
7,721 58.4
Total 312,724 100 Total 13,471 100 Total 13,212 100
Source: Korea Food & Drug Administration(KFDA)

12
Inspection Status of Imported Foods by Food Category: 2007-2011
(Unit: cases, %)
Classification 2007 2008 2009 2010 2011
Agricultural Products 39,277
(14.5)
35,026
(13.7)
33,118
(13.0)
39,413
(13.4)
42,416
(13.6)
Processed Foods 165,129
(61.1)
155,536
(61.0)
139,782
(54.7)
157,570
(53.6)
167,085
(53.4)
Health Functional Foods 6,988
(2.6)
6,533
(2.6)
7,062
(2.8)
6,555
(2.2)
8,017
(2.5)
Food Additives 31,073
(11.5)
31,423
(12.3)
31,111
(12.2)
33,503
(11.4)
32,155
(10.3)
Utensils, Containers & Packages 27,696
(10.3)
26,291
(10.4)
44,268
(17.3)
56,947
(19.4)
63,051
(20.2)
Total 270,163 254,809 255,341 293,988 312,724
Source: Korea Food & Drug Administration(KFDA)
8. Distribution Channels
8-1 Overview
Supermarkets and hypermarkets sell the majority of South Korea’s packaged food. Two-thirds of ales are
made through supermarkets and hypermarkets, and small grocery retailers take up another 21.8%. There
has been a trend toward the consolidation of distributors to achieve economies of scale. The growth of
hypermarkets in recent years has taken away market share from small grocery retailers. Over the next five
years, supermarket sales are expected to decline by 4.9%.
Shares of Packaged Food Sales
Distribution Format Exhibitor Booth Change
Supermarkets and Hypermarkets 65.1% 66.3% 1.2%
Small Grocery Stores 23.0% 21.8% -1.2%
Other Grocery Retailers 5.9% 6.0% 0.1%
Non-Grocery Retailers 3.6% 3.3% -0.3%
Non-Store Retailing 2.3% 2.6% -0.3%
Source: Euromonitor International Supermarkets and hypermarkets rely heavily on packaged foods to generate sales. Packaged food accounts
for 84.5% of supermarket sales and 37.4% of hypermarket sales. The growth of supermarkets and
hypermarkets will further push demand for packaged food, whether they are recognized brands or private
labels.
Canadian packaged food exporters work predominately with independent importers and distributors, as
South Korean retailers are reluctant to import unless high product volumes are involved. All distribution
channel stakeholders, including agents, importers, distributors, and retailers, are known to seek substantial
discounts to handle and market foreign products. Overall, South Korea is a highly competitive and price-
sensitive market for imported goods.
8-2 Market Structure
Market concentration among South Korean grocers has increased over the past five years. Between 2005
and 2009, the four-firm concentration ratio (CR4) grew from 31.0 % to 44.6 %, due in large part to the

13
consolidation and expansion of major retailers, such as Shinsegae, Samsung Tesco, Lotte Shopping, and GS
Retail. This growth came at the expense of small, independent retailers, many of whom were absorbed by
these national chains. The concentration ratios in the hypermarket and supermarket subsectors are
sufficiently high for these subsectors to be oligopolies.
Four-Firm Concentration Ratios (CR4) by Distribution Format in US$ billions, 2007*
Distribution Format Exhibitor Sales Top Companies
Hypermarkets 87.2% 19.8 Shinsegae, Samsung Tesco, Lotte Shopping
Supermarkets 86.2% 1.7 GS Retail, Lotte Shopping, Samsung Tesco
Convenience Stores 82.8% 3.1 Bokwang Familymart, GS Retail, Korea Seven
Department Stores 75.4% 11.1 Lotte Shopping, Shinsegae, Hyundai
Online Retailers 68.8% 1.4 GS Home Shopping, CJ Home Shopping, Hyundai
Source: USDA Foreign Agricultural Service
*Note: Retail and distribution data can lag by several years, depending on the source. However, market shares and concentration ratios do not vary significantly on a yearly basis.
9. Key Retailers
Four-Firm Concentration Ratios (CR4) by Distribution Format in US$ billions, 2007*
Distribution Format Sales
US$ millions
% of Grocery
Sales
Number of Outlets
Market Share (%)
Hypermarket Supermarket Department
Store Convenience
Store
Lotte Shopping 8,317 46 203 16 8 47 -
Shinsegae 7,006 70 165 35 2 17 -
Samsung Tesco 4,083 90 326 26 7 - -
GS Retail 2,537 85 3,512 2 9 2 31
Hyundai Dept Store 634 15 11 - - 22 -
Source: Euromonitor International
Lotte Shopping is the largest packaged food retailer in South Korea, with sales of US$8.3 billion in 2008. It is
the market leader in the department store channel but also operates hypermarkets and supermarkets.
Grocery products make up less than half of the company’s revenues, as it is also in the businesses of
foodservice, entertainment, and toy and apparel retailing. The company has a private label that offers
packaged food, beverages, fresh food, and household goods.
Shinsegae is primarily a hypermarket retailer but also operates supermarkets and department stores. In
2009, it generated US$7.0 billion in sales, of which 70% came from grocery products. Shinsegae acquired
Wal-Mart Korea in 2006, converting those outlets into E-Mart discount stores. Shinsegae has a private label
that offers a variety of food and household products.
Samsung Tesco is a joint venture between Samsung Corporation and Tesco Holdings, and is considered the
only foreign grocery retailer to have successfully adapted to the South Korean market. It is present in the
hypermarket and supermarket channels, and maintains an extensive line of private label products. Samsung
Tesco had sales of US$4.1 billion in 2008, of which 90% came from grocery products.
GS Retail is the market leader in the supermarket channel and also a major convenience store chain. It had
sales of approximately US$2.5 billion in 2008, of which 85% came from grocery products. GS Retail also
earns revenues from foodservice outlets and drugstores, and has a private label that markets packaged food
and household goods.
Hyundai Department Store operates only in the department store channel and positions itself as a high-end
retailer. It had sales of US$634 million in 2008, of which only 15% came from grocery products. It does not
have a private label.

14
10. Distribution Trends
10-1 Private Labels
South Korean retailers, primarily hypermarkets and supermarkets, are increasingly offering private label
products to their customers. At the same time, consumers are visiting hypermarkets and supermarkets more
often for their grocery needs. The economic downturn has made consumers price sensitive, so private labels
have grown quite popular. To attract customers, retailers are expanding their product lines and promoting
loyalty programs. Private label penetration in packaged food is currently 1.9% but was only 0.7% five years
ago. Penetration is higher in dried processed food (6.2%) and ready meals (4.9%). Retailers such as Lotte
Shopping, Samsung Tesco, and GS Retail already have thousands of private label items.
10-2 Consolidation
Large grocery retailers are absorbing smaller retailers in an effort to expand their number of outlets and
diversify their retail formats. Retailers want multiple channels including hypermarkets, supermarkets,
convenience stores, department stores, and online businesses. For instance, Lotte Super purchased Big Mart
and Nice Mart, and Shinsegae bought the hypermarket division of E. Land Group.
10-3 Internet Retailing
With over 80% of South Korea’s population connected to the Internet, online grocery shopping is the fastest
growing retail segment. Online grocery shopping offers lower prices than store-based retailing and are
compatible with the busy lifestyle of South Koreans. Internet retailers have extended delivery service to
more areas. Its growth has taken market share away from small, independent retailers. Many hypermarkets
and supermarkets have recently opened up internet shopping websites.
10-4 Regulation
The dominance of major grocery retailers in South Korea has led to the consideration of two regulatory bills
that would limit their expansion. One bill requires local government approval for the development of large
retail establishments (1,000 to 3,000 square meters in size) within 500 meters of traditional markets. The
other bill would allow small retailers to claim uncompetitive conditions as a reason to force the temporary
closure of supermarkets and hypermarkets. The passage of such legislation could restrain packaged food
growth and distribution.
11. Opportunities in Packaged Food
11-1 Growth of Private Labels
The expansion and dominance of South Korea’s major grocery retailers have
contributed to the emerging presence of private label products. Increasing price
sensitivity among consumers and their growing preference for one-stop shopping at
hypermarkets and supermarkets have further driven private label demand. Canadian
packaged food companies can leverage their manufacturing experience and expertise
to supply these private labels.
Premium Iced Green Tea 7-Eleven’s Private Label, South Korea

15
11-2 Changing Consumer Lifestyles
Rising household incomes, busier lifestyles, and concerns over food safety and quality have generated
demands for premium products, convenience products, and health foods. Since these demands are similar to
those found in most Westernized countries, western companies can capitalize on their existing knowledge to
better market these products to South Koreans.
12. No Challenges in Packaged Food
12-1 No Trade Barrier
The substantial market concentration in both of the product and retail
markets, as well as the linkages between them, could serve as no entry
barriers for European packaged food manufacturers. Some subsectors
have highly uncompetitive conditions, especially for foreign entrants. In
retail, the major grocery distributors have considerable bargaining
power that could be used to extract significant discounts from European
exporters.
13. Conclusion
South Korea represents an affluent market of packaged food consumers. Socioeconomic changes have led to
growing demand for convenience products and an interest in health and wellness. Rising income disparity
has further contributed to the dual trends of product premiumization and value consciousness. Canadian
companies can thus prosper by leveraging their positive reputation and manufacturing abilities to supply
private label products, and capitalize on emerging consumer trends. Since both the manufacturing and
retailing markets are concentrated, Canadian firms need to work with South Korean distributors in order to
obtain wider product exposure.
New packaged food product introductions to
South Korea, July 2011
Source: Mintel
16
Bibliography
Business Monitor International (2010). South Korea: Food & Drink Report – Q1 2011.
Central Intelligence Agency (2010). World Factbook – South Korea.
Euromonitor International (2010).
Euromonitor International (2010). CJ Cheil Jedang Corp – Retailing – South Korea.
Euromonitor International (2010). Consumer Lifestyles – South Korea.
Euromonitor International (2010). Country Factfile – South Korea.
Euromonitor International (2010). GS Retail Co Ltd – Retailing – South Korea.
Euromonitor International (2010). Hyundai Department Store Co Ltd – Retailing – South Korea.
Euromonitor International (2010). Lotte Confectionery Co Ltd – Packaged Food – South Korea.
Euromonitor International (2010). Lotte Shopping Co Ltd – Retailing – South Korea.
Euromonitor International (2010). Nong Shim Co Ltd – Packaged Food – South Korea.
Euromonitor International (2010). Packaged Food – South Korea.
Euromonitor International (2010). Samsung Tesco Co Ltd – Retailing – South Korea.
Euromonitor International (2010). Shinsegae Co Ltd – Retailing – South Korea.
Euromonitor International (2010). Retailing – South Korea.
Foreign Affairs and International Trade Canada (2010). A Free Trade Agreement with Korea: Agriculture Opportunities.
Global Trade Atlas (2010).
Mintel (2010).
Planet Retail (2010). South Korea.
United States Department of Agriculture (2009). Briefing Room – South Korea.
United States Foreign Agriculture Service (2009). Republic of Korea: Retail Food Sector, Biennial Brief.
Disclaimer:
This publication is provided to you as a free service and is intended to flag to you market opportunities and possibilities.
Use of and reliance on the information/products/technology/concepts discussed in this publication, and the suitability of
these for your business is entirely at your own risk. You are advised to carry out your own independent assessment of
this opportunity. The information in this publication is general; it was prepared by Korea Trade-Investment Promotion
Agency (KOTRA) from publicly available and/or subscription database sources. Whereas every effort has been made to
ensure that the information given in this document is accurate, neither KOTRA nor its officers accept liability for any
errors or omissions or any opinion/s expressed, and no responsibility is accepted with respect to the standing of any
firm/s, company/ies or individual/s mentioned. Korea Trade-Investment Promotion Agency is not responsible for any
adverse consequences arising out of such use. Korean policy and regulation are subject to occasional change and
revision. Please check for updated reports and verify Korean import requirements with your Korean customers to ensure
you have the most up-to-date information prior to shipping. Final Import approval of any product is subject to the
importing country’s rules and regulations as interpreted by border officials at the time of product entry. You release Korea
Trade-Investment Promotion Agency from all claims arising from this publication. Korea Trade-Investment Promotion
Agency reserves the right to reuse any general market information contained in its reports.