package ‘mschart’ ‘mschart’ april 20, 2018 type package title chart generation for...
TRANSCRIPT

Package ‘mschart’April 20, 2018
Type Package
Title Chart Generation for 'Microsoft Word' and 'Microsoft PowerPoint'Documents
Version 0.2.3
Description Create native charts for 'Microsoft PowerPoint' and 'Microsoft Word' documents.These can then be edited and annotated. Functions are provided to let users create charts, modifyand format their content. The chart's underlying data is automatically saved within the'Word' document or 'PowerPoint' presentation. It extends package 'officer' that doesnot contain any feature for 'Microsoft' native charts production.
License MIT + file LICENSE
Encoding UTF-8
LazyData true
Depends R (>= 2.10)
Imports stats, data.table, officer (>= 0.2.0), R6,cellranger,writexl,grDevices, xml2 (>= 1.1.0), htmltools
URL https://ardata-fr.github.io/mschart/
BugReports https://github.com/ardata-fr/mschart/issues
RoxygenNote 6.0.1.9000
Suggests knitr, rmarkdown,magrittr
VignetteBuilder knitr
NeedsCompilation no
Author David Gohel [aut, cre],YouGov [fnd]
Maintainer David Gohel <[email protected]>
Repository CRAN
Date/Publication 2018-04-19 23:13:16 UTC
1
2 as_bar_stack
R topics documented:
as_bar_stack . . . . . . . . . . . . . . . . . . . . . . . . . . . . . . . . . . . . . . . . . 2body_add_chart . . . . . . . . . . . . . . . . . . . . . . . . . . . . . . . . . . . . . . . 3browser_data . . . . . . . . . . . . . . . . . . . . . . . . . . . . . . . . . . . . . . . . 4browser_ts . . . . . . . . . . . . . . . . . . . . . . . . . . . . . . . . . . . . . . . . . . 4chart_ax_x . . . . . . . . . . . . . . . . . . . . . . . . . . . . . . . . . . . . . . . . . . 5chart_data_fill . . . . . . . . . . . . . . . . . . . . . . . . . . . . . . . . . . . . . . . . 7chart_data_labels . . . . . . . . . . . . . . . . . . . . . . . . . . . . . . . . . . . . . . 7chart_data_line_width . . . . . . . . . . . . . . . . . . . . . . . . . . . . . . . . . . . . 8chart_data_size . . . . . . . . . . . . . . . . . . . . . . . . . . . . . . . . . . . . . . . 9chart_data_stroke . . . . . . . . . . . . . . . . . . . . . . . . . . . . . . . . . . . . . . 10chart_data_symbol . . . . . . . . . . . . . . . . . . . . . . . . . . . . . . . . . . . . . 10chart_labels . . . . . . . . . . . . . . . . . . . . . . . . . . . . . . . . . . . . . . . . . 11chart_labels_text . . . . . . . . . . . . . . . . . . . . . . . . . . . . . . . . . . . . . . 12chart_settings . . . . . . . . . . . . . . . . . . . . . . . . . . . . . . . . . . . . . . . . 12ms_linechart . . . . . . . . . . . . . . . . . . . . . . . . . . . . . . . . . . . . . . . . . 14ph_with_chart . . . . . . . . . . . . . . . . . . . . . . . . . . . . . . . . . . . . . . . . 17print.ms_chart . . . . . . . . . . . . . . . . . . . . . . . . . . . . . . . . . . . . . . . . 18set_theme . . . . . . . . . . . . . . . . . . . . . . . . . . . . . . . . . . . . . . . . . . 18
Index 21
as_bar_stack set a barchart as a stacked barchart
Description
Apply settings to an ms_barchart object to produce a stacked barchart. Options are available touse percentage instead of values and to choose if bars should be vertically or horizontally drawn.
Usage
as_bar_stack(x, dir = "vertical", percent = FALSE, gap_width = 50)
Arguments
x an ms_barchart object
dir the direction of the bars in the chart, value must one of "horizontal" or "vertical".
percent should bars be in percent
gap_width gap width between the bar for each category on a bar chart, in percent of the barwidth. It can be set between 0 and 500.
body_add_chart 3
Examples
library(officer)
my_bar_stack_01 <- ms_barchart(data = browser_data, x = "browser",y = "value", group = "serie")
my_bar_stack_01 <- as_bar_stack( my_bar_stack_01 )
my_bar_stack_02 <- ms_barchart(data = browser_data, x = "browser",y = "value", group = "serie")
my_bar_stack_02 <- as_bar_stack( my_bar_stack_02, percent = TRUE,dir = "horizontal" )
doc <- read_pptx()doc <- add_slide(doc,
layout = "Title and Content", master = "Office Theme")doc <- ph_with_chart(doc, chart = my_bar_stack_01)print(doc, target = "bar_stack.pptx")
body_add_chart add chart into a Word document
Description
add a ms_chart into an rdocx object, the graphic will be inserted in an empty paragraph.
Usage
body_add_chart(x, chart, style = NULL, pos = "after", width = 5,height = 3)
Arguments
x an rdocx object
chart an ms_chart object.
style paragraph style
pos where to add the new element relative to the cursor, one of "after", "before","on".
height, width height and width in inches.
Examples
library(officer)my_barchart <- ms_barchart(data = browser_data,
x = "browser", y = "value", group = "serie")my_barchart <- chart_settings( my_barchart, grouping = "stacked",
gap_width = 50, overlap = 100 )
4 browser_ts
doc <- read_docx()doc <- body_add_chart(doc, chart = my_barchart, style = "centered")print(doc, target = "barchart_example.docx")
browser_data Dummy dataset for barchart
Description
A dataset containing 2 categorical and an integer variables:
Usage
data(browser_data)
Format
A data frame with 18 rows and 3 variables
Details
• browser web browser• serie id of series• value integer values
browser_ts Dummy dataset for barchart
Description
A dataset containing a date, a categorical and an integer variables:
Usage
data(browser_ts)
Format
A data frame with 36 rows and 3 variables
Details
• date date values• browser web browser• freq values in percent
chart_ax_x 5
chart_ax_x axis settings
Description
Define settings for an x or y axis.
Usage
chart_ax_x(x, orientation, crosses, cross_between, major_tick_mark,minor_tick_mark, tick_label_pos, display, num_fmt, rotation, limit_min,limit_max, position, second_axis = FALSE)
chart_ax_y(x, orientation, crosses, cross_between, major_tick_mark,minor_tick_mark, tick_label_pos, display, num_fmt, rotation, limit_min,limit_max, position, second_axis = FALSE)
## S3 method for class 'ms_chart'chart_ax_x(x, orientation, crosses, cross_between,major_tick_mark, minor_tick_mark, tick_label_pos, display, num_fmt, rotation,limit_min, limit_max, position, second_axis = FALSE)
## S3 method for class 'ms_chart'chart_ax_y(x, orientation, crosses, cross_between,major_tick_mark, minor_tick_mark, tick_label_pos, display, num_fmt, rotation,limit_min, limit_max, position, second_axis = FALSE)
Arguments
x an ms_chart object.orientation axis orientation, one of ’maxMin’, ’minMax’.crosses specifies how the axis crosses the perpendicular axis, one of ’autoZero’, ’max’,
’min’.cross_between specifies how the value axis crosses the category axis between categories, one
of ’between’, ’midCat’.major_tick_mark, minor_tick_mark
tick marks position, one of ’cross’, ’in’, ’none’, ’out’.tick_label_pos ticks labels position, one of ’high’, ’low’, ’nextTo’, ’none’.display should the axis be displayed (a logical of length 1).num_fmt number formatting. See section for more details.rotation rotation angle. Value should be between ‘-360‘ and ‘360‘.limit_min minimum value on the axis.limit_max maximum value on the axis.position position value that cross the other axis.second_axis unused
6 chart_ax_x
Methods (by class)
• ms_chart: chart_ax_x method for ms_chart objects
• ms_chart: chart_ax_y method for ms_chart objects
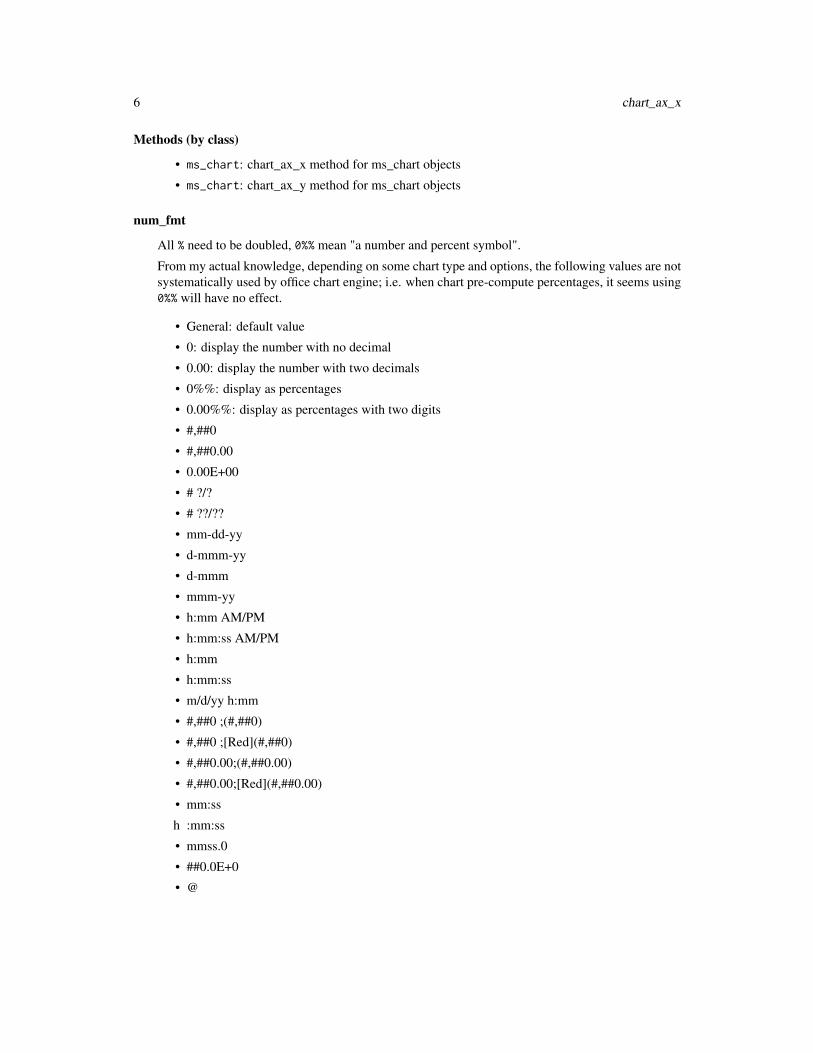
num_fmt
All % need to be doubled, 0%% mean "a number and percent symbol".
From my actual knowledge, depending on some chart type and options, the following values are notsystematically used by office chart engine; i.e. when chart pre-compute percentages, it seems using0%% will have no effect.
• General: default value
• 0: display the number with no decimal
• 0.00: display the number with two decimals
• 0%%: display as percentages
• 0.00%%: display as percentages with two digits
• #,##0
• #,##0.00
• 0.00E+00
• # ?/?
• # ??/??
• mm-dd-yy
• d-mmm-yy
• d-mmm
• mmm-yy
• h:mm AM/PM
• h:mm:ss AM/PM
• h:mm
• h:mm:ss
• m/d/yy h:mm
• #,##0 ;(#,##0)
• #,##0 ;[Red](#,##0)
• #,##0.00;(#,##0.00)
• #,##0.00;[Red](#,##0.00)
• mm:ss
h :mm:ss
• mmss.0
• ##0.0E+0
• @
chart_data_fill 7
chart_data_fill Modify fill colour
Description
Specify mappings from levels in the data to displayed fill colours.
Usage
chart_data_fill(x, values)
Arguments
x an ms_chart object.
values ‘character(num of series|1)‘: a set of colours values to map data values to. It isa named vector, the values will be matched based on the names. If it containsonly one colour, this colour will be associated to all existing series.
See Also
chart_data_stroke, chart_data_symbol, chart_data_size
Examples
my_scatter <- ms_scatterchart(data = iris, x = "Sepal.Length",y = "Sepal.Width", group = "Species")
my_scatter <- chart_data_fill(my_scatter,values = c(virginica = "#6FA2FF", versicolor = "#FF6161", setosa = "#81FF5B") )
chart_data_labels Modify data labels settings
Description
Data labels show details about data series. This function indicate that data labels should be dis-played. See link{chart_labels_text} for modifying text settings associated with labels.
Usage
chart_data_labels(x, num_fmt = "General", position = "ctr",show_legend_key = FALSE, show_val = FALSE, show_cat_name = FALSE,show_serie_name = FALSE, show_percent = FALSE, separator = ", ")
8 chart_data_line_width
Arguments
x an ms_chart object.
num_fmt ‘character(1)‘: number formatting specifies number format properties which in-dicate how to format and render the numeric values. It can be "General", "0.00","#,##0", "#,##0.00", "mm-dd-yy", "m/d/yy h:mm", etc.
position ‘character(1)‘: it specifies the position of the data label. It should be one of ’b’,’ctr’, ’inBase’, ’inEnd’, ’l’, ’outEnd’, ’r’, ’t’. When grouping is ’clustered’, itshould be one of ’ctr’,’inBase’,’inEnd’,’outEnd’. When grouping is ’stacked’, itshould be one of ’ctr’,’inBase’,’inEnd’. When grouping is ’standard’, it shouldbe one of ’b’,’ctr’,’l’,’r’,’t’.
show_legend_key
show legend key if TRUE.
show_val show values if TRUE.
show_cat_name show categories if TRUE.
show_serie_name
show names of series if TRUE.
show_percent show percentages if TRUE.
separator separator for displayed labels.
chart_data_line_width Modify line width
Description
Specify mappings from levels in the data to displayed line width between symbols.
Usage
chart_data_line_width(x, values)
Arguments
x an ms_chart object.
values ‘double(num of series)‘: a set of size values to map data values to. It is a namedvector, the values will be matched based on the names. If it contains only onesize, this size will be associated to all existing series.
See Also
chart_data_fill, chart_data_stroke, chart_data_symbol
chart_data_size 9
Examples
my_scatter <- ms_scatterchart(data = iris, x = "Sepal.Length",y = "Sepal.Width", group = "Species")
my_scatter <- chart_settings(my_scatter, scatterstyle = "lineMarker")my_scatter <- chart_data_fill(my_scatter,
values = c(virginica = "#6FA2FF", versicolor = "#FF6161", setosa = "#81FF5B") )my_scatter <- chart_data_stroke(my_scatter,
values = c(virginica = "black", versicolor = "black", setosa = "black") )my_scatter <- chart_data_symbol(my_scatter,
values = c(virginica = "circle", versicolor = "diamond", setosa = "circle") )my_scatter <- chart_data_size(my_scatter,
values = c(virginica = 20, versicolor = 16, setosa = 20) )my_scatter <- chart_data_line_width(my_scatter,
values = c(virginica = 2, versicolor = 3, setosa = 6) )
chart_data_size Modify symbol size
Description
Specify mappings from levels in the data to displayed size of symbols.
Usage
chart_data_size(x, values)
Arguments
x an ms_chart object.values ‘double(num of series)‘: a set of size values to map data values to. It is a named
vector, the values will be matched based on the names. If it contains only onesize, this size will be associated to all existing series.
See Also
chart_data_fill, chart_data_stroke, chart_data_symbol
Examples
my_scatter <- ms_scatterchart(data = iris, x = "Sepal.Length",y = "Sepal.Width", group = "Species")
my_scatter <- chart_data_fill(my_scatter,values = c(virginica = "#6FA2FF", versicolor = "#FF6161", setosa = "#81FF5B") )
my_scatter <- chart_data_stroke(my_scatter,values = c(virginica = "black", versicolor = "black", setosa = "black") )
my_scatter <- chart_data_symbol(my_scatter,values = c(virginica = "circle", versicolor = "diamond", setosa = "circle") )
my_scatter <- chart_data_size(my_scatter,values = c(virginica = 20, versicolor = 16, setosa = 20) )
10 chart_data_symbol
chart_data_stroke Modify marker stroke colour
Description
Specify mappings from levels in the data to displayed marker stroke colours.
Usage
chart_data_stroke(x, values)
Arguments
x an ms_chart object.
values ‘character(num of series)‘: a set of colours values to map data values to. It isa named vector, the values will be matched based on the names. If it containsonly one colour, this colour will be associated to all existing series.
See Also
chart_data_fill, chart_data_symbol, chart_data_size
Examples
my_scatter <- ms_scatterchart(data = iris, x = "Sepal.Length",y = "Sepal.Width", group = "Species")
my_scatter <- chart_data_fill(my_scatter,values = c(virginica = "#6FA2FF", versicolor = "#FF6161", setosa = "#81FF5B") )
my_scatter <- chart_data_stroke(my_scatter,values = c(virginica = "black", versicolor = "black", setosa = "black") )
chart_data_symbol Modify symbol
Description
Specify mappings from levels in the data to displayed symbols.
Usage
chart_data_symbol(x, values)
chart_labels 11
Arguments
x an ms_chart object.
values ‘character(num of series)‘: a set of symbol values to map data values to. It is anamed vector, the values will be matched based on the names. Possible valuesare: ’circle’, ’dash’, ’diamond’, ’dot’, ’none’, ’plus’, ’square’, ’star’, ’triangle’,’x’, ’auto’. If it contains only one symbol, this symbol will be associated to allexisting series.
See Also
chart_data_fill, chart_data_stroke, chart_data_size
Examples
my_scatter <- ms_scatterchart(data = iris, x = "Sepal.Length",y = "Sepal.Width", group = "Species")
my_scatter <- chart_data_fill(my_scatter,values = c(virginica = "#6FA2FF", versicolor = "#FF6161", setosa = "#81FF5B") )
my_scatter <- chart_data_stroke(my_scatter,values = c(virginica = "black", versicolor = "black", setosa = "black") )
my_scatter <- chart_data_symbol(my_scatter,values = c(virginica = "circle", versicolor = "diamond", setosa = "circle") )
chart_labels Modify axis and plot labels
Description
Add labels to a chart, labels can be specified for x axis, y axis and plot.
Usage
chart_labels(x, title = NULL, xlab = NULL, ylab = NULL)
Arguments
x an ms_chart object.title, xlab, ylab
Text to add
Examples
mylc <- ms_linechart(data = browser_ts, x = "date", y = "freq",group = "browser")
mylc <- chart_labels(mylc, title = "my title", xlab = "my x label",ylab = "my y label")
12 chart_settings
chart_labels_text Modify labels font settings
Description
Specify mappings from levels in the data to displayed text font settings.
Usage
chart_labels_text(x, values)
Arguments
x an ms_chart object.
values a named list of fp_text objects to map data labels to. It is a named list, thevalues will be matched based on the names. If it contains only one fp_textobject, it will be associated to all existing series.
Examples
library(officer)
fp_text_settings <- list(serie1 = fp_text(font.size = 7, color = "red"),serie2 = fp_text(font.size = 0, color = "purple"),serie3 = fp_text(font.size = 19, color = "wheat")
)
barchart <- ms_barchart(data = browser_data,x = "browser", y = "value", group = "serie")
barchart <- chart_data_labels(barchart, show_val = TRUE)barchart <- chart_labels_text( barchart,
values = fp_text_settings )
chart_settings set chart options
Description
Set chart properties.
chart_settings 13
Usage
chart_settings(x, ...)
## S3 method for class 'ms_barchart'chart_settings(x, vary_colors, gap_width, dir, grouping,overlap, ...)
## S3 method for class 'ms_linechart'chart_settings(x, vary_colors, ...)
## S3 method for class 'ms_areachart'chart_settings(x, vary_colors = FALSE,grouping = "standard", ...)
## S3 method for class 'ms_scatterchart'chart_settings(x, vary_colors = FALSE,scatterstyle = "lineMarker", ...)
Arguments
x an ms_chart object.
... unused parameter
vary_colors if TRUE the data points in the single series are displayed the same color.
gap_width A gap appears between the bar or clustered bars for each category on a barchart. The default width for this gap is 150 percent of the bar width. It can beset between 0 and 500 percent of the bar width.
dir the direction of the bars in the chart, value must one of "horizontal" or "vertical".
grouping grouping for a barchart, a linechart or an area chart. must be one of "per-centStacked", "clustered", "standard" or "stacked".
overlap In a bar chart having two or more series, the bars for each category are clusteredtogether. By default, these bars are directly adjacent to each other. The bars canbe made to overlap each other or have a space between them using the overlapproperty. Its values range between -100 and 100, representing the percentage ofthe bar width by which to overlap adjacent bars. A setting of -100 creates a gapof a full bar width and a setting of 100 causes all the bars in a category to besuperimposed. The default value is 0.
scatterstyle The Style for the scatter chart. One of ’none’, ’line’, ’lineMarker’, ’marker’,’smooth’, ’smoothMarker’.
Methods (by class)
• ms_barchart: barchart settings
• ms_linechart: linechart settings
• ms_areachart: linechart settings
• ms_scatterchart: linechart settings
14 ms_linechart
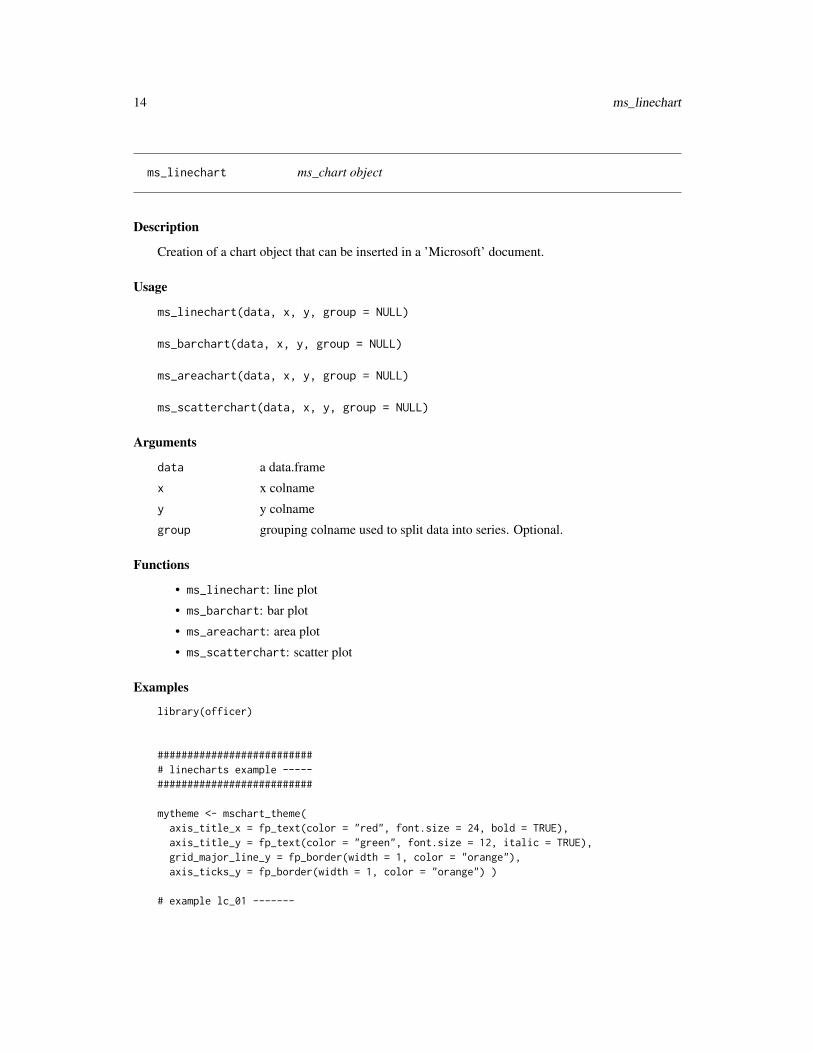
ms_linechart ms_chart object
Description
Creation of a chart object that can be inserted in a ’Microsoft’ document.
Usage
ms_linechart(data, x, y, group = NULL)
ms_barchart(data, x, y, group = NULL)
ms_areachart(data, x, y, group = NULL)
ms_scatterchart(data, x, y, group = NULL)
Arguments
data a data.frame
x x colname
y y colname
group grouping colname used to split data into series. Optional.
Functions
• ms_linechart: line plot
• ms_barchart: bar plot
• ms_areachart: area plot
• ms_scatterchart: scatter plot
Examples
library(officer)
########################### linecharts example -----##########################
mytheme <- mschart_theme(axis_title_x = fp_text(color = "red", font.size = 24, bold = TRUE),axis_title_y = fp_text(color = "green", font.size = 12, italic = TRUE),grid_major_line_y = fp_border(width = 1, color = "orange"),axis_ticks_y = fp_border(width = 1, color = "orange") )
# example lc_01 -------
ms_linechart 15
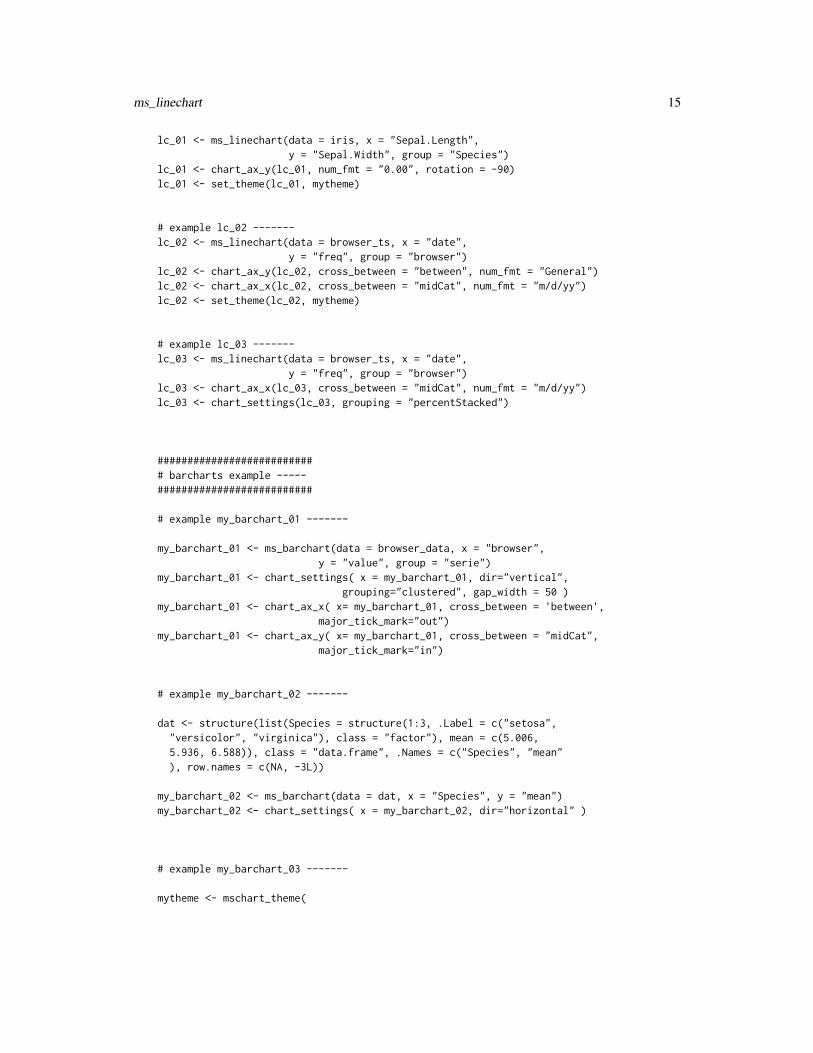
lc_01 <- ms_linechart(data = iris, x = "Sepal.Length",y = "Sepal.Width", group = "Species")
lc_01 <- chart_ax_y(lc_01, num_fmt = "0.00", rotation = -90)lc_01 <- set_theme(lc_01, mytheme)
# example lc_02 -------lc_02 <- ms_linechart(data = browser_ts, x = "date",
y = "freq", group = "browser")lc_02 <- chart_ax_y(lc_02, cross_between = "between", num_fmt = "General")lc_02 <- chart_ax_x(lc_02, cross_between = "midCat", num_fmt = "m/d/yy")lc_02 <- set_theme(lc_02, mytheme)
# example lc_03 -------lc_03 <- ms_linechart(data = browser_ts, x = "date",
y = "freq", group = "browser")lc_03 <- chart_ax_x(lc_03, cross_between = "midCat", num_fmt = "m/d/yy")lc_03 <- chart_settings(lc_03, grouping = "percentStacked")
########################### barcharts example -----##########################
# example my_barchart_01 -------
my_barchart_01 <- ms_barchart(data = browser_data, x = "browser",y = "value", group = "serie")
my_barchart_01 <- chart_settings( x = my_barchart_01, dir="vertical",grouping="clustered", gap_width = 50 )
my_barchart_01 <- chart_ax_x( x= my_barchart_01, cross_between = 'between',major_tick_mark="out")
my_barchart_01 <- chart_ax_y( x= my_barchart_01, cross_between = "midCat",major_tick_mark="in")
# example my_barchart_02 -------
dat <- structure(list(Species = structure(1:3, .Label = c("setosa","versicolor", "virginica"), class = "factor"), mean = c(5.006,5.936, 6.588)), class = "data.frame", .Names = c("Species", "mean"), row.names = c(NA, -3L))
my_barchart_02 <- ms_barchart(data = dat, x = "Species", y = "mean")my_barchart_02 <- chart_settings( x = my_barchart_02, dir="horizontal" )
# example my_barchart_03 -------
mytheme <- mschart_theme(
16 ms_linechart
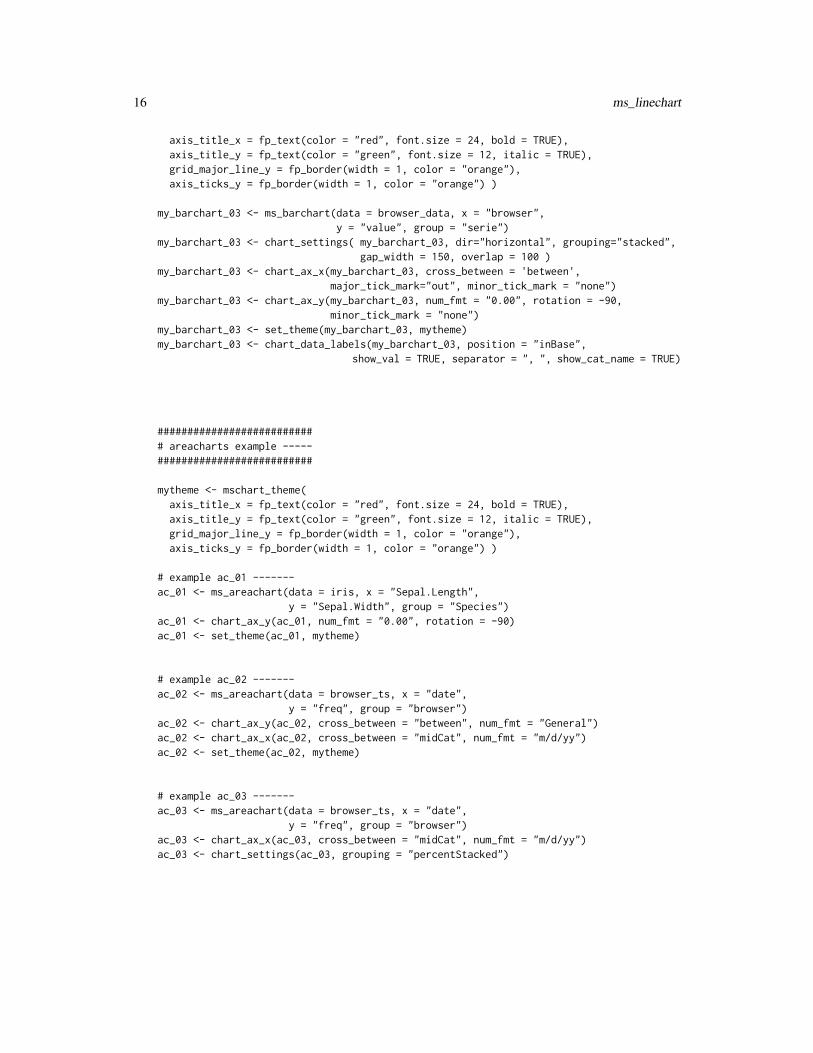
axis_title_x = fp_text(color = "red", font.size = 24, bold = TRUE),axis_title_y = fp_text(color = "green", font.size = 12, italic = TRUE),grid_major_line_y = fp_border(width = 1, color = "orange"),axis_ticks_y = fp_border(width = 1, color = "orange") )
my_barchart_03 <- ms_barchart(data = browser_data, x = "browser",y = "value", group = "serie")
my_barchart_03 <- chart_settings( my_barchart_03, dir="horizontal", grouping="stacked",gap_width = 150, overlap = 100 )
my_barchart_03 <- chart_ax_x(my_barchart_03, cross_between = 'between',major_tick_mark="out", minor_tick_mark = "none")
my_barchart_03 <- chart_ax_y(my_barchart_03, num_fmt = "0.00", rotation = -90,minor_tick_mark = "none")
my_barchart_03 <- set_theme(my_barchart_03, mytheme)my_barchart_03 <- chart_data_labels(my_barchart_03, position = "inBase",
show_val = TRUE, separator = ", ", show_cat_name = TRUE)
########################### areacharts example -----##########################
mytheme <- mschart_theme(axis_title_x = fp_text(color = "red", font.size = 24, bold = TRUE),axis_title_y = fp_text(color = "green", font.size = 12, italic = TRUE),grid_major_line_y = fp_border(width = 1, color = "orange"),axis_ticks_y = fp_border(width = 1, color = "orange") )
# example ac_01 -------ac_01 <- ms_areachart(data = iris, x = "Sepal.Length",
y = "Sepal.Width", group = "Species")ac_01 <- chart_ax_y(ac_01, num_fmt = "0.00", rotation = -90)ac_01 <- set_theme(ac_01, mytheme)
# example ac_02 -------ac_02 <- ms_areachart(data = browser_ts, x = "date",
y = "freq", group = "browser")ac_02 <- chart_ax_y(ac_02, cross_between = "between", num_fmt = "General")ac_02 <- chart_ax_x(ac_02, cross_between = "midCat", num_fmt = "m/d/yy")ac_02 <- set_theme(ac_02, mytheme)
# example ac_03 -------ac_03 <- ms_areachart(data = browser_ts, x = "date",
y = "freq", group = "browser")ac_03 <- chart_ax_x(ac_03, cross_between = "midCat", num_fmt = "m/d/yy")ac_03 <- chart_settings(ac_03, grouping = "percentStacked")
ph_with_chart 17
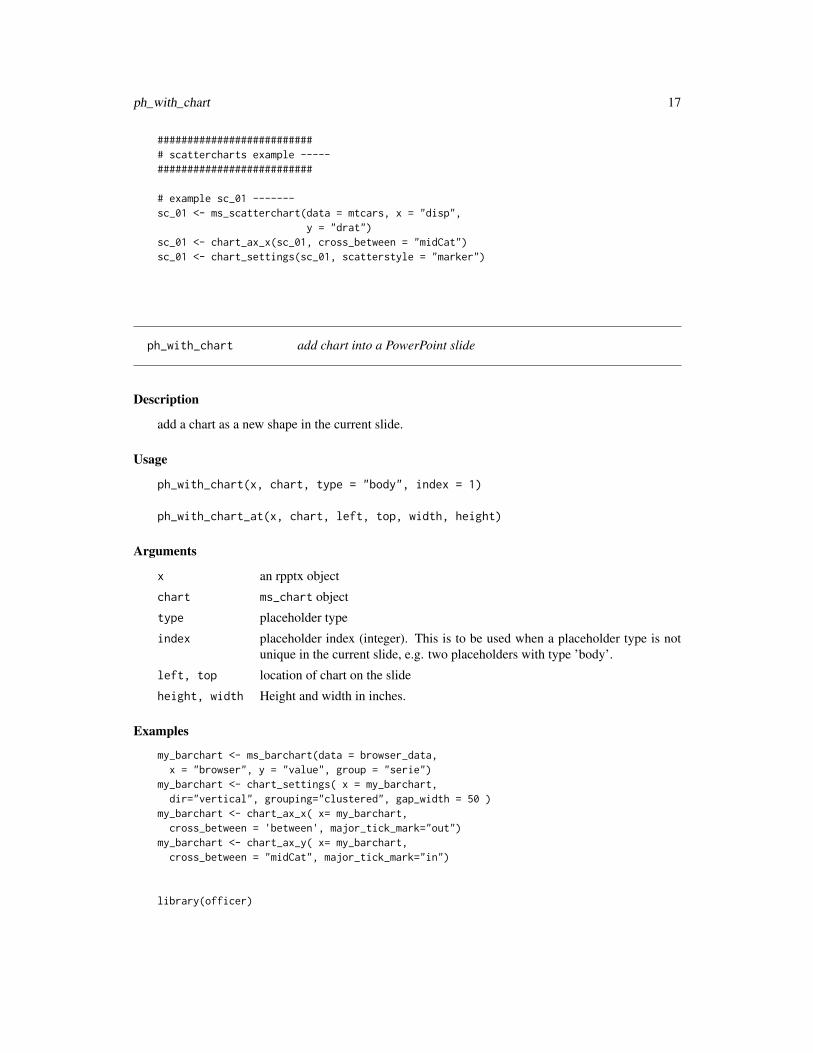
########################### scattercharts example -----##########################
# example sc_01 -------sc_01 <- ms_scatterchart(data = mtcars, x = "disp",
y = "drat")sc_01 <- chart_ax_x(sc_01, cross_between = "midCat")sc_01 <- chart_settings(sc_01, scatterstyle = "marker")
ph_with_chart add chart into a PowerPoint slide
Description
add a chart as a new shape in the current slide.
Usage
ph_with_chart(x, chart, type = "body", index = 1)
ph_with_chart_at(x, chart, left, top, width, height)
Arguments
x an rpptx object
chart ms_chart object
type placeholder type
index placeholder index (integer). This is to be used when a placeholder type is notunique in the current slide, e.g. two placeholders with type ’body’.
left, top location of chart on the slide
height, width Height and width in inches.
Examples
my_barchart <- ms_barchart(data = browser_data,x = "browser", y = "value", group = "serie")
my_barchart <- chart_settings( x = my_barchart,dir="vertical", grouping="clustered", gap_width = 50 )
my_barchart <- chart_ax_x( x= my_barchart,cross_between = 'between', major_tick_mark="out")
my_barchart <- chart_ax_y( x= my_barchart,cross_between = "midCat", major_tick_mark="in")
library(officer)
18 set_theme
doc <- read_pptx()doc <- add_slide(doc, layout = "Title and Content", master = "Office Theme")doc <- ph_with_chart(doc, chart = my_barchart)
print(doc, target = "barchart_example.pptx")
print.ms_chart ms_chart print method
Description
an ms_chart object can not be rendered in R. The default printing method will only display simpleinformations about the object. If argument preview is set to TRUE, a pptx file will be producedand opened with function browseURL.
Usage
## S3 method for class 'ms_chart'print(x, preview = FALSE, ...)
Arguments
x an ms_chart object.
preview preview the chart in a PowerPoint document
... unused
set_theme set chart theme
Description
Modify chart theme with function set_theme.
Use mschart_theme() to create a chart theme.
Use chart_theme() to modify components of the theme of a chart.
set_theme 19
Usage
set_theme(x, value)
mschart_theme(axis_title = fp_text(bold = TRUE, font.size = 16),axis_title_x = axis_title, axis_title_y = axis_title,main_title = fp_text(bold = TRUE, font.size = 20),legend_text = fp_text(font.size = 14), axis_text = fp_text(),axis_text_x = axis_text, axis_text_y = axis_text, title_rot = 0,title_x_rot = 0, title_y_rot = 270, axis_ticks = fp_border(color ="#99999999"), axis_ticks_x = axis_ticks, axis_ticks_y = axis_ticks,grid_major_line = fp_border(color = "#99999999", style = "dashed"),grid_major_line_x = grid_major_line, grid_major_line_y = grid_major_line,grid_minor_line = fp_border(width = 0),grid_minor_line_x = grid_minor_line, grid_minor_line_y = grid_minor_line,date_fmt = "yyyy/mm/dd", str_fmt = "General", double_fmt = "#,##0.00",integer_fmt = "0", legend_position = "b")
chart_theme(x, axis_title_x, axis_title_y, main_title, legend_text, title_rot,title_x_rot, title_y_rot, axis_text_x, axis_text_y, axis_ticks_x,axis_ticks_y, grid_major_line_x, grid_major_line_y, grid_minor_line_x,grid_minor_line_y, date_fmt, str_fmt, double_fmt, integer_fmt,legend_position)
Arguments
x an ms_chart object.
value a mschart_theme object.axis_title, axis_title_x, axis_title_y
axis title formatting properties (fp_text)
main_title title formatting properties (fp_text)
legend_text legend text formatting properties (fp_text)axis_text, axis_text_x, axis_text_y
axis text formatting properties (fp_text)title_rot, title_x_rot, title_y_rot
rotation angleaxis_ticks, axis_ticks_x, axis_ticks_y
axis ticks formatting properties (fp_border)grid_major_line, grid_major_line_x, grid_major_line_y
major grid lines formatting properties (fp_border)grid_minor_line, grid_minor_line_x, grid_minor_line_y
minor grid lines formatting properties (fp_border)
date_fmt date format
str_fmt string or factor format
double_fmt double format
integer_fmt integer format
20 set_theme
legend_position
it specifies the position of the legend. It should be one of ’b’, ’tr’, ’l’, ’r’, ’t’, ’n’(for ’none’).
Examples
library(officer)mytheme <- mschart_theme(
axis_title = fp_text(color = "red", font.size = 24, bold = TRUE),grid_major_line_y = fp_border(width = 1, color = "orange"),axis_ticks_y = fp_border(width = .4, color = "gray") )
my_bc <- ms_barchart(data = browser_data, x = "browser",y = "value", group = "serie")
my_bc <- chart_settings( my_bc, dir="horizontal", grouping="stacked",gap_width = 150, overlap = 100 )
my_bc <- set_theme(my_bc, mytheme)
my_bc_2 <- ms_barchart(data = browser_data, x = "browser",y = "value", group = "serie")
my_bc_2 <- chart_theme(my_bc_2,grid_major_line_y = fp_border(width = .5, color = "cyan") )
Index
∗Topic datasetsbrowser_data, 4browser_ts, 4
as_bar_stack, 2
body_add_chart, 3browser_data, 4browser_ts, 4
chart_ax_x, 5chart_ax_y (chart_ax_x), 5chart_data_fill, 7, 8–11chart_data_labels, 7chart_data_line_width, 8chart_data_size, 7, 9, 10, 11chart_data_stroke, 7–9, 10, 11chart_data_symbol, 7–10, 10chart_labels, 11chart_labels_text, 12chart_settings, 12chart_theme (set_theme), 18
fp_border, 19fp_text, 19
ms_areachart (ms_linechart), 14ms_barchart, 2ms_barchart (ms_linechart), 14ms_linechart, 14ms_scatterchart (ms_linechart), 14mschart (ms_linechart), 14mschart_theme (set_theme), 18
ph_with_chart, 17ph_with_chart_at (ph_with_chart), 17print.ms_chart, 18
set_theme, 18
21