pace of population growth slows across asia and the pacific72 key indicators for asia and the...
TRANSCRIPT

72 Key Indicators for Asia and the Pacific 201972
I. People
People brings together standard demographic indicators such as population size and age structure, as well as primary education attainment levels. The regional tables in this section present data on birth, death, and fertility rates; age dependency ratios; urbanization and employment; poverty and inequality; health and education resources; international migration; and the Human Development Index.
Pace of population growth slows across Asia and the Pacific
The total population of the Asia and Pacific region reached 4,180 million in 2018, up from 3,435 million in 2000. The region’s share of the global population gradually decreased from 55.9% in 2000 to 54.8% in 2018, as annual population growth rates over the review period slowed in all the subregions within Asia and the Pacific, except in Central and West Asia (Figure 2.1.1).
In 2018, annual population growth rates in the Pacific (2.6%), Central and West Asia (2.5%), and South Asia (1.2%) exceeded the global average (1.1%), while annual population growth was 1.1% in Southeast Asia and 0.4% in East Asia. Populations in developed ADB member economies expanded at an average of only 0.1% in 2018.
The most populous subregion in 2018 was South Asia (1,549 million). This was followed by East Asia (1,481 million), Southeast Asia (649 million), Central and West Asia (332 million), and the Pacific (13 million). In 2018, the aggregate population of the region’s three developed member economies—Australia, Japan, and New Zealand—was 156 million.
1 For more information on education issues in Asia and the Pacific, go to https://www.adb.org/sectors/education/issues.2 The primary education attainment ratios for boys and girls are defined as the gross intake levels for the last grade of primary education for both males
and females. These calculations include all new entrants, by sex, regardless of age. Therefore, the ratios for boys and girls can exceed 100% due to inclusion in the numerator, but not in the denominator, of overaged and underaged children who enter school late or early, and/or repeat grades. For the full definition and data specifications, go to http://uis.unesco.org/en/glossary-term/gross-intake-ratio-last-grade-primary-education.
According to the United Nations (UN), India is projected to overtake the People’s Republic of China (PRC) as the world’s most populous economy by 2027 (UN 2019a). Together, the two economies’ populations comprised 35.7% of the global total in 2018. Among the world’s 10 most populous countries in 2018, 6 were located in Asia and the Pacific: the PRC (1,395 million), India (1,332 million), Indonesia (265 million), Pakistan (213 million), Bangladesh (165 million), and Japan (127 million). The ADB member economies with the smallest populations in 2018 were all located in the Pacific: Niue (1,700), Nauru (11,400), and Tuvalu (11,600).
Girls are benefitting from education expansion across the region
In the 1970s, Asia and the Pacific was home to two-thirds of the world’s out-of-school children. Today, about 90% of children, on average, are enrolled at the primary school level in economies across the region.1
In 2017 (or the most recent year for which data are available), 30 of the 35 ADB developing member economies with available data had a primary education attainment ratio that met or exceeded 90% for both boys and girls.2 By comparison, in 2000 (or

73Regional Trends and Tables
73
the earliest year for which data are available), only 20 of the 35 economies had achieved this same measure of primary education attainment (Table 2.1.11).
During the review period, 28 economies increased their overall primary education attainment level (Table 2.1.11). Of these, 19 economies reported that the increase for girls exceeded that for boys, for which data are available. The largest gains in primary education attainment for girls, achieved over the review period, were observed in Nepal (60.9 percentage points), Bangladesh (56.2 percentage points), and Bhutan (53.4 percentage points) (Figure 2.1.2).
Data Issues and Comparability
Demographic data are based on vital registration records, censuses, and surveys. Since vital registration records in many ADB developing member economies are incomplete, they cannot be used for statistical purposes. In most economies, population censuses, which are used to provide more accurate estimates of population sizes, are conducted every 10 years. Population numbers in between census years are
Figure 2.1.1: Distribution of Population by Global Region and by Economy in Asia and the Pacific, 2018 (%)
Africa, 16.7
Europe, 10.9
North America, 7.6
South America, 5.6
West Asia, 3.3 Rest of the world, 1.1
People's Republic of China,
18.3
India, 17.5
Indonesia, 3.5
Pakistan, 2.8
Bangladesh, 2.2
Japan, 1.7Philippines, 1.4
Viet Nam, 1.2Thailand, 0.9
Others, 5.4
Asia and the Pacific,
54.8
Note: The aggregate for the West Asia region was adjusted to exclude Armenia, Azerbaijan, and Georgia, which are included in the total for Asia and the Pacific.Source: Table 2.1.1, Key Indicators for Asia and the Pacific 2019.
Figure 2.1.2: Primary Education Completion Rate, by Sex: (percentage point difference between earliest and most recently
available annual data)
-40 -20 0 20 40 60
FemaleMale
NepalBangladesh
BhutanCambodia
Lao PDRIndia
NauruPapua New Guinea
AzerbaijanTimor-Leste
GeorgiaMyanmar
KazakhstanPakistan
Kyrgyz RepublicPRC
ThailandFiji
KiribatiViet Nam
SamoaIndonesia
VanuatuTonga
MongoliaPhilippines
MalaysiaArmenia
UzbekistanBrunei Darussalam
Sri LankaRepublic of Korea
TuvaluNiue
Marshall Islands
Lao PDR = Lao People’s Democratic Republic, PRC = People’s Republic of China.Note: Earliest year refers to the period 2000 to 2008, while latest year refers to
2009 to 2018, where data are available. Only economies with available data for both earliest and latest years are included.
Source: Table 2.1.11, Key Indicators for Asia and the Pacific 2019.

74 Key Indicators for Asia and the Pacific 201974
products of imputation methods that use various population distributional assumptions.
The UN Department of Economics and Social Affairs’ Population Division uses future trends on fertility, mortality, and international migration to project population numbers through to 2100. The medium-fertility variant included in World Population Prospects 2019 Revision assumes, over the remainder of the century, a decline of fertility in economies where large families are still prevalent, a slight increase of fertility in several economies where women have fewer than two live births on average over a lifetime, and continued reductions in mortality at all ages.
Urban population statistics are compiled according to each economy’s national definition, as there is no agreed international standard for defining an urban area, which poses constraints in the comparability of urban and city indicators across economies. Data from World Urbanization Prospects are used when national estimates are not available.
Household surveys, which are the best source of labor force data, are not carried out in all economies on a regular basis. Some economies rely on census data supplemented by enterprise surveys and unemployment registration records, which are often incomplete and may refer only to formal employment. Furthermore, a breakdown by economic activities also may not be available. An initiative is underway to adopt new standards for work and employment statistics, following the recommendations of the 19th International Conference of Labour Statisticians in 2013, which included the need for more in-depth statistics on forced labor, cooperatives, and labor migration, as well as guidelines on a statistical definition of employment in the environment sector. The conceptual definitions used here are, however, based on the traditional framework.

75PeopleRegional Trends and Tables
Population
Table 2.1.1: Midyear Population
ADB Regional MemberPopulation
(million)Population Growth Ratesa
(%)2000 2005 2010 2018 2000 2005 2010 2018
Developing ADB Member Economies Central and West Asia 230.0 251.7 276.8 331.9 2.1 1.8 2.0 2.5
Afghanistanb 19.5 22.1 24.5 30.1 5.0 1.9 2.1 6.6Armenia 3.2 3.1 3.0 3.0 * -0.3 -0.6 -0.7 -0.3 *Azerbaijan 8.1 8.5 9.1 9.9 1.0 1.2 1.2 0.9Georgia 4.1 3.9 3.8 3.7 -1.9 -0.6 -0.7 -0.0Kazakhstan 14.9 15.1 16.3 18.3 -0.3 0.9 1.4 1.3Kyrgyz Republicb 4.9 5.1 5.4 6.3 1.4 1.2 1.3 1.9Pakistan 140.0 156.0 173.5 212.8 2.4 2.2 2.1 2.4Tajikistan 6.2 6.8 7.5 9.0 2.3 1.2 2.5 2.1Turkmenistan 4.5 4.8 5.1 5.9 1.1 1.1 1.6 1.6Uzbekistan 24.7 26.2 28.6 33.0 1.4 1.2 2.9 1.8
East Asia 1,345.7 1,387.8 1,423.4 1,481.2 0.8 0.6 0.5 0.4China, People’s Republic ofb 1,267.4 1,307.6 1,340.9 1,395.4 0.8 0.6 0.5 0.4Hong Kong, China 6.7 6.8 7.0 7.5 0.9 0.4 0.7 0.8Korea, Republic of 47.0 48.2 49.6 51.6 0.8 0.2 0.5 0.4Mongolia 2.4 2.5 2.7 3.2 1.3 1.1 1.8 1.9Taipei,China 22.2 22.7 23.1 23.6 0.8 0.4 0.3 0.1
South Asia 1,189.6 1,290.5 1,382.6 1,548.6 1.6 1.5 1.4 1.2Bangladesh 129.3 138.6 148.6 164.6 1.4 1.4 1.3 1.2Bhutan 0.6 0.6 0.7 0.7 1.3 1.3 1.8 1.0Indiab 1,019.0 1,106.0 1,186.0 1,332.0 1.8 1.5 1.4 1.2Maldives 0.3 0.3 0.4 0.5 1.5 3.3 2.3 4.2Nepal 21.0 25.3 26.3 29.1 3.0 2.3 1.4 1.4Sri Lanka 19.4 19.6 20.7 21.7 1.3 0.9 1.0 1.1
Southeast Asia 512.3 547.8 588.0 648.9 1.4 1.3 1.9 1.1Brunei Darussalam 0.3 0.4 0.4 0.4 2.5 1.8 1.8 3.0Cambodia 12.5 13.3 14.1 15.6 1.3 1.3 1.3 1.3Indonesia 206.3 219.9 237.6 265.0 1.2 1.3 2.7 1.3Lao People’s Democratic Republic 5.1 5.6 6.0 6.8 2.0 2.0 1.5 1.4Malaysia 23.5 26.0 28.6 32.4 2.5 2.1 1.8 1.1Myanmarb 46.1 48.5 50.2 53.9 1.2 0.9 0.7 0.9Philippines 76.8 84.7 93.1 106.6 2.3 1.9 2.3 1.6Singapore 4.0 4.3 5.1 5.6 1.7 2.4 1.8 0.5Thailand 60.7 63.2 65.9 67.8 0.8 0.8 0.8 0.3Viet Nam 77.1 81.9 86.9 94.7 1.4 1.2 1.1 1.0
The Pacificc 8.0 9.2 10.4 12.8 4.5 2.7 2.8 2.6Cook Islands 18.0 21.5 23.7 18.6 9.1 5.9 4.9 -4.6Fiji 802.0 827.0 850.7 886.2 0.6 0.7 0.6 0.6Kiribatib 84.5 92.5 103.1 113.0 1.7 1.8 2.2 -0.1Marshall Islands 51.2 51.2 52.9 54.6 0.8 1.4 1.2 0.4Micronesia, Federated States ofb 107.0 105.6 102.8 102.6 (2017) 0.2 -0.3 -0.5 0.1 d
Nauru 10.1 9.5 9.7 11.4 1.0 -2.2 1.9 1.6Niueb 1.9 1.6 (2006) 1.6 (2011) 1.7 (2017) -3.7 e ... ... 1.1 d
Palau 18.9 19.8 18.3 17.5 0.3 0.8 -1.9 -2.0Papua New Guinea 5,190.8 6,051.7 7,055.4 9,018.9 3.3 3.1 3.1 3.1Samoa 175.2 179.9 186.4 197.7 0.9 0.5 0.8 0.7Solomon Islands 418.6 470.1 555.5 667.0 2.3 2.3 2.6 f 2.1Timor-Leste 871.6 1,026.5 1,109.6 1,324.0 1.0 3.0 1.6 2.1Tonga 99.1 101.2 102.8 99.6 0.4 0.4 0.2 -0.5Tuvalu 9.5 10.3 11.1 11.6 1.3 3.1 0.5 1.2Vanuatu 190.9 214.0 239.7 284.6 2.3 2.3 2.4 2.2
Developed ADB Member Economies 149.7 152.1 154.5 156.4 0.3 0.2 0.3 0.1Australia 19.0 20.2 22.0 25.0 1.2 1.2 1.6 1.6Japan 126.8 127.8 128.1 126.5 0.2 0.0 0.0 -0.2New Zealand 3.9 4.1 4.4 4.9 0.6 1.1 1.1 1.9
DEVELOPING ADB MEMBER ECONOMIESg
3,285.6 3,487.0 3,681.2 4,023.4 1.3 1.1 1.2 1.0
ALL ADB REGIONAL MEMBERSg 3,435.3 3,639.1 3,835.6 4,179.9 1.2 1.1 1.1 1.0WORLD 6,143.5 6,541.9 6,956.8 7,631.1 1.3 1.2 1.2 1.1
0.0 = magnitude is less than half of unit employed, * = preliminary, ADB = Asian Development Bank.
a The annual population growth rate is calculated as the percentage change in population when comparing the reference year with the year prior. For example, the population growth rates under the column heading “2018” refer to population growth from 2017 to 2018.
b Estimates of population size are as of 1 January for Kyrgyz Republic; 11 March for Niue; 10 June for Afghanistan; 1 April for 2000, 4 April for 2010, and 30 September for 2005 and 2017 for the Federated States of Micronesia; 1 October for India and Myanmar; 7 November for Kiribati; and 31 December for the People’s Republic of China.
c Estimates of population size for ADB developing member economies in the Pacific are expressed in thousands, while the total population for the Pacific region is expressed in millions.
d Refers to 2017 annual population growth rate. e Refers to 2001 annual population growth rate.f Refers to 2011 annual population growth rate.g For reporting economies only.
Sources: Economy sources; and United Nations. World Population Prospects 2019. https://population.un.org/wpp/Download/Standard/Population/ (accessed 22 July 2019).

76 Key Indicators for Asia and the Pacific 2019Population
Table 2.1.2: Migration and Urbanization
ADB Regional MemberNet International Migration Ratea
(per 1,000 population)Urban Population
(% of total population)2000–2005 2005–2010 2010–2015 2015–2020 2000 2005 2010 2018
Developing ADB Member Economies Central and West Asia
Afghanistan 6.4 -7.6 3.3 -1.7 21.3 21.5 23.2 25.0Armenia -10.6 -12.5 -2.1 -1.7 64.8 64.0 63.5 63.8Azerbaijan 0.9 1.2 0.2 0.1 51.1 52.5 53.0 52.9Georgia -6.9 -5.8 -4.7 -2.5 55.1 56.5 56.5 58.5Kazakhstan 0.6 -0.4 1.9 -1.0 56.5 57.1 54.5 58.0Kyrgyz Republic -6.9 -2.9 -3.3 -0.6 34.7 34.8 34.1 33.9Pakistan -0.9 -0.4 -1.1 -1.1 33.0 34.6 36.3 36.4Tajikistan -4.5 -4.1 -3.4 -2.2 26.6 26.4 26.4 27.1Turkmenistan -5.4 -2.5 -1.9 -0.9 45.9 47.1 48.5 51.6Uzbekistan -1.9 -1.0 -0.4 -0.3 37.2 36.1 51.3 50.6
East AsiaChina, People’s Republic of -0.3 -0.3 -0.2 -0.2 36.2 43.0 50.0 59.6Hong Kong, China 1.9 2.6 2.1 4.0 100.0 100.0 100.0 100.0Korea, Republic of 0.3 -0.6 1.6 0.2 79.6 81.3 81.9 81.5Mongolia -1.2 -0.8 -0.3 -0.3 56.6 61.9 69.2 67.9Taipei,Chinab 1.8 2.2 1.5 1.3 55.8 57.7 59.3 62.5
South AsiaBangladesh -2.2 -4.5 -3.0 -2.3 23.1 24.2 25.9 36.6Bhutan 2.0 -3.3 0.1 0.4 21.0 30.9 34.8 40.9India -0.3 -0.4 -0.4 -0.4 27.7 28.8 29.9 34.0Maldives 11.6 10.5 28.4 22.8 27.7 33.8 36.4 39.8Nepal -6.2 -7.4 -15.1 1.5 14.1 14.6 16.6 20.8Sri Lanka -4.7 -5.2 -4.7 -4.6 18.4 18.3 18.2 18.5
Southeast AsiaBrunei Darussalam 0.2 -1.2 -0.4 – 71.2 73.2 75.0 77.6Cambodia -0.6 -4.3 -2.0 -1.9 18.6 19.2 20.3 23.4Indonesia -1.1 -1.1 -0.4 -0.4 42.0 45.9 49.9 50.2Lao People’s Democratic Republic -5.3 -3.7 -3.5 -2.1 22.0 27.2 30.1 35.0Malaysia 5.5 5.7 1.7 1.6 62.0 66.5 71.0 75.6Myanmar -5.1 -5.4 -2.0 -3.1 27.0 27.9 28.9 30.0Philippines -3.0 -3.4 -1.7 -0.6 46.1 45.7 45.3 46.9Singapore 4.5 30.7 11.8 4.7 100.0 100.0 100.0 100.0Thailand 1.2 0.2 0.5 0.3 31.1 32.5 43.4 50.1Viet Nam -1.6 -1.9 -0.9 -0.8 24.2 27.1 30.5 35.7
The PacificCook Islands ... ... ... ... 65.2 71.0 73.3 75.1Fiji -14.4 -5.6 -12.0 -7.0 47.9 49.9 52.2 56.9Kiribati -4.4 -0.6 -7.7 -6.9 43.0 43.6 47.4 54.1Marshall Islands ... ... ... ... 68.6 71.1 73.6 77.0Micronesia, Federated States of -23.0 -23.5 -5.7 -5.4 22.3 22.3 22.3 22.6 (2017)Nauru ... ... ... ... 100.0 100.0 100.0 100.0Niue ... ... ... ... 33.1 35.2 38.7 44.8Palau ... ... ... ... 69.5 77.4 77.0 78.7 (2015)Papua New Guinea -2.7 1.1 -0.1 -0.1 13.2 13.1 13.0 13.2Samoa -17.7 -16.5 -12.8 -14.3 20.0 22.1 21.0 19.0Solomon Islands -3.8 -5.7 -2.8 -2.5 15.8 17.8 20.0 23.7Timor-Leste -5.9 -7.3 -4.9 -4.3 24.3 26.0 27.7 30.6Tonga -15.8 -15.2 -25.4 -7.7 23.0 23.2 23.4 22.8Tuvalu ... ... ... ... 46.0 49.7 54.8 62.4Vanuatu -2.6 -2.9 1.4 0.4 21.8 23.2 24.4 25.0
Developed ADB Member EconomiesAustralia 6.0 11.4 8.6 6.4 84.1 (2001) 84.6 85.7 86.8Japan 0.3 0.4 0.6 0.6 78.6 86.0 90.8 91.6New Zealand 6.7 2.9 4.0 3.2 83.5 83.8 83.7 84.1
... = data not available, – = magnitude equals zero, ADB = Asian Development Bank.
a Refers to annual average. The United Nations’ population estimates and projections are based on all available sources of data on population size, and levels of fertility, mortality, and international migration. Statistics on international migration are sourced from population registers and other administrative sources. These estimates and projections are made for 235 distinct national economies or areas comprising the total population of the world.
b For urban population, refers to localities of 100,000 or more inhabitants.
Sources: Economy sources; United Nations. World Urbanization Prospects: The 2018 Revision – Data Query. https://esa.un.org/unpd/wup/DataQuery/ (accessed 20 July 2019); and United Nations. World Population Prospects 2019. https://population.un.org/wpp/Download/Standard/Migration/ (accessed 20 July 2019).

77PeopleRegional Trends and Tables
Population
Table 2.1.3: Proportion of Total Population Aged 0–14 Years and Aged 15–64 Yearsa (%)
ADB Regional MemberPopulation Aged 0–14 Years Population Aged 15–64 Years
2000 2005 2010 2018 2000 2005 2010 2018Developing ADB Member Economies Central and West Asia 39.9 37.7 35.9 34.4 55.6 57.7 59.7 61.1
Afghanistan 48.9 47.9 48.2 43.1 48.8 49.9 49.5 54.3Armenia 25.8 21.5 19.5 20.6 64.2 66.6 69.5 68.1Azerbaijan 31.1 26.2 22.8 23.4 63.0 67.2 71.3 70.4Georgia 20.8 19.0 18.0 19.8 66.2 66.5 67.8 65.3Kazakhstan 27.5 24.5 24.1 28.5 65.6 67.8 69.1 64.1Kyrgyz Republic 34.9 31.0 29.9 32.4 59.6 63.4 65.6 63.2Pakistan 42.0 40.0 37.7 35.3 54.0 55.9 58.1 60.4Tajikistan 42.5 38.0 35.7 36.8 53.9 58.2 61.0 60.2Turkmenistan 36.3 32.6 29.5 30.8 59.5 62.8 66.3 64.8Uzbekistan 37.3 32.6 29.1 28.7 58.1 62.6 66.4 66.9
East Asia 24.6 20.3 18.5 17.6 68.6 72.2 73.3 71.3China, People’s Republic of 24.8 20.4 18.7 17.9 68.4 72.2 73.3 71.2Hong Kong, China 16.9 14.3 11.9 11.9 72.1 73.4 75.1 71.2Korea, Republic of 20.6 18.8 16.1 13.0 72.2 72.3 73.2 72.6Mongolia 34.8 28.9 27.0 30.4 61.5 67.3 69.2 65.5Taipei,China 21.2 19.0 15.9 12.9 70.0 71.3 73.4 72.7
South Asia 35.0 32.9 31.0 27.1 60.7 62.4 64.0 66.7Bangladesh 37.0 34.4 32.0 27.7 59.2 61.3 63.2 67.1Bhutan 39.8 35.1 31.2 25.8 56.3 60.5 63.7 68.2India 34.7 32.7 30.8 27.1 60.9 62.5 64.1 66.8Maldives 40.5 31.5 25.3 20.1 55.8 64.1 70.2 76.1Nepal 41.0 39.3 36.3 30.4 55.3 56.4 58.7 63.9Sri Lanka 26.8 25.6 25.4 24.2 67.0 67.6 67.2 65.3
Southeast Asia 31.7 29.9 27.9 25.7 63.4 65.0 66.6 67.7Brunei Darussalam 30.7 27.8 26.0 23.0 67.0 69.2 70.7 72.1Cambodia 41.6 37.1 33.3 31.2 55.3 59.5 62.9 64.2Indonesia 30.7 29.9 28.8 26.6 64.6 65.3 66.2 67.6Lao People’s Democratic Republic 43.4 40.3 36.4 32.6 53.1 56.0 59.9 63.3Malaysia 33.4 30.5 28.0 24.0 62.7 65.1 67.1 69.3Myanmar 32.5 31.2 30.0 26.4 63.0 64.2 65.1 67.8Philippines 38.5 37.1 34.0 31.0 58.3 59.4 61.9 63.9Singapore 18.7 17.2 14.0 12.3 74.9 75.6 78.7 76.3Thailand 24.0 21.3 19.2 17.1 69.5 71.0 71.9 71.0Viet Nam 31.6 27.1 23.6 23.2 62.0 66.4 69.9 69.6
The Pacific 40.0 39.1 38.0 35.8 56.8 57.6 58.4 60.4Cook Islands 34.7 31.4 27.9 26.0 59.1 61.3 63.8 63.6Fiji 35.0 30.5 29.0 29.5 61.6 65.4 66.2 65.0Kiribati 40.0 36.9 36.1 35.5 56.7 59.5 60.3 60.5Marshall Islands 42.3 41.3 41.8 38.2 55.5 56.5 55.9 58.4Micronesia, Federated States of 40.4 38.9 35.7 31.7 56.0 57.3 61.1 64.3Nauru 40.1 37.1 35.6 39.9 58.6 61.2 63.1 57.9Niue 30.0 25.5 24.8 21.6 60.8 64.0 63.0 64.3Palau 23.9 24.1 20.3 20.0 70.7 70.2 73.2 71.2Papua New Guinea 39.8 39.2 38.3 35.8 57.2 57.6 58.4 60.7Samoa 40.8 39.6 38.3 38.3 54.8 55.6 56.7 56.9Solomon Islands 41.9 41.3 40.8 40.2 55.2 55.7 55.9 56.2Timor-Leste 44.9 44.7 42.5 37.8 51.7 51.6 53.4 57.9Tonga 38.5 38.2 37.4 35.4 55.9 55.9 56.9 58.6Tuvalu 37.1 34.3 32.0 31.3 57.0 60.1 62.7 62.3Vanuatu 41.5 39.7 38.2 38.8 55.2 57.1 57.9 57.5
Developed ADB Member Economies 15.8 14.8 14.4 13.9 68.0 66.6 64.7 60.7Australia 20.9 19.8 19.0 19.2 66.8 67.3 67.6 65.2Japan 14.8 13.8 13.4 12.7 68.2 66.5 64.1 59.7New Zealand 22.7 21.5 20.5 19.7 65.5 66.4 66.4 64.7
DEVELOPING ADB MEMBER ECONOMIES 30.6 27.8 26.1 24.0 64.0 66.3 67.6 68.1ALL ADB REGIONAL MEMBERS 30.0 27.3 25.6 23.6 64.1 66.3 67.5 67.8WORLD 30.1 28.1 27.0 25.8 63.0 64.6 65.5 65.4
ADB = Asian Development Bank.
a The estimates are based on all available sources of data on population size and levels of fertility, mortality, and international migration for 235 distinct national economies or areas comprising the total population of the world.
Sources: United Nations. World Population Prospects, The 2019 Revision. https://population.un.org/wpp/ (accessed 1 July 2019). For the Cook Islands, the Marshall Islands, Nauru, Niue, Palau, and Tuvalu: The Pacific Community, Statistics for Development Division. Official communication, 3 July 2019.

78 Key Indicators for Asia and the Pacific 2019Population
Table 2.1.4: Proportion of Total Population Aged 65 Years or Oldera, and Age Dependency Ratio
ADB Regional MemberPopulation Aged 65 Years and Older
(% of total population) Age Dependency Ratio for Total Population2000 2005 2010 2018 2000 2005 2010 2018
Developing ADB Member Economies Central and West Asia 4.4 4.6 4.5 4.5 79.7 73.3 67.6 63.6
Afghanistan 2.3 2.2 2.3 2.6 104.9 100.3 102.0 84.1Armenia 10.0 11.9 11.0 11.3 55.8 50.1 43.8 46.8Azerbaijan 5.8 6.6 5.9 6.2 58.7 48.8 40.3 42.0Georgia 12.9 14.5 14.2 14.9 51.0 50.4 47.5 53.0Kazakhstan 6.8 7.7 6.8 7.4 52.4 47.4 44.6 55.9Kyrgyz Republic 5.5 5.6 4.5 4.5 67.9 57.7 52.5 58.3Pakistan 4.0 4.1 4.2 4.3 85.0 78.8 72.2 65.5Tajikistan 3.6 3.8 3.3 3.0 85.6 71.9 63.9 66.1Turkmenistan 4.3 4.6 4.1 4.4 68.2 59.2 50.7 54.4Uzbekistan 4.6 4.8 4.5 4.4 72.1 59.8 50.7 49.5
East Asia 6.9 7.6 8.2 11.1 45.9 38.6 36.5 40.3China, People’s Republic of 6.8 7.5 8.1 10.9 46.2 38.6 36.5 40.4Hong Kong, China 11.0 12.2 12.9 16.9 38.7 36.2 33.1 40.4Korea, Republic of 7.2 8.9 10.7 14.4 38.5 38.3 36.6 37.7Mongolia 3.7 3.7 3.8 4.1 62.5 48.5 44.6 52.7Taipei,China 8.7 9.7 10.7 14.4 42.8 40.3 36.2 37.6
South Asia 4.3 4.7 5.1 6.1 64.7 60.4 56.3 49.8Bangladesh 3.9 4.3 4.8 5.2 69.0 63.0 58.1 49.0Bhutan 3.9 4.4 5.1 6.0 77.7 65.3 57.0 46.6India 4.4 4.7 5.1 6.2 64.2 59.9 56.0 49.8Maldives 3.8 4.4 4.6 3.7 79.3 56.0 42.5 31.3Nepal 3.8 4.3 5.0 5.7 80.9 77.2 70.4 56.6Sri Lanka 6.2 6.8 7.4 10.5 49.2 48.0 48.8 53.1
Southeast Asia 4.9 5.1 5.5 6.6 57.8 53.9 50.1 47.7Brunei Darussalam 2.4 3.0 3.4 4.9 49.3 44.5 41.5 38.7Cambodia 3.1 3.4 3.7 4.6 80.7 67.9 58.9 55.7Indonesia 4.7 4.8 5.0 5.9 54.8 53.1 51.0 47.9Lao People’s Democratic Republic 3.6 3.7 3.7 4.1 88.4 78.5 67.0 57.9Malaysia 3.9 4.4 4.9 6.7 59.4 53.5 49.0 44.2Myanmar 4.5 4.6 4.8 5.8 58.7 55.8 53.5 47.4Philippines 3.3 3.5 4.1 5.1 71.6 68.2 61.6 56.5Singapore 6.4 7.2 7.3 11.5 33.5 32.3 27.0 31.1Thailand 6.5 7.8 8.9 11.9 43.9 40.9 39.0 40.8Viet Nam 6.4 6.5 6.5 7.3 61.3 50.7 43.1 43.8
The Pacific 3.2 3.4 3.6 3.8 76.0 73.7 71.2 65.6Cook Islands 6.2 7.3 8.2 10.4 69.3 63.1 56.7 57.2Fiji 3.4 4.1 4.8 5.4 62.5 53.0 51.1 53.8Kiribati 3.3 3.5 3.6 4.0 76.3 68.0 65.7 65.3Marshall Islands 2.1 2.2 2.3 3.5 80.0 76.9 78.8 71.3Micronesia, Federated States of 3.6 3.9 3.2 4.0 78.6 74.7 63.7 55.5Nauru 1.3 1.7 1.3 2.2 70.7 63.4 58.5 72.7Niue 9.2 10.5 12.1 14.1 64.6 56.4 58.7 55.5Palau 5.4 5.7 6.5 8.8 41.4 42.5 36.7 40.5Papua New Guinea 3.1 3.2 3.3 3.4 74.9 73.5 71.3 64.6Samoa 4.4 4.8 5.0 4.8 82.3 79.7 76.3 75.8Solomon Islands 2.9 3.0 3.3 3.6 81.1 79.6 78.9 78.1Timor-Leste 3.4 3.7 4.0 4.3 93.3 93.7 87.2 72.7Tonga 5.6 5.9 5.7 6.0 78.9 78.9 75.8 70.6Tuvalu 5.9 5.6 5.3 6.4 75.4 66.5 59.5 60.6Vanuatu 3.3 3.3 3.9 3.6 81.1 75.3 72.8 73.9
Developed ADB Member Economies 16.3 18.6 20.9 25.3 47.1 50.1 54.5 64.6Australia 12.3 12.9 13.4 15.7 49.7 48.6 47.9 53.5Japan 17.0 19.7 22.5 27.6 46.6 50.3 55.9 67.4New Zealand 11.8 12.1 13.1 15.7 52.7 50.6 50.5 54.6
DEVELOPING ADB MEMBER ECONOMIES 5.5 5.9 6.3 7.9 56.4 50.9 47.9 46.9ALL ADB REGIONAL MEMBERS 5.9 6.4 6.9 8.6 55.9 50.8 48.1 47.5WORLD 6.9 7.3 7.6 8.9 58.7 54.8 52.8 53.0
ADB = Asian Development Bank.
a The estimates are based on all available sources of data on population size and levels of fertility, mortality, and international migration for 235 distinct national economies or areas comprising the total population of the world.
Sources: For Population Aged 65 Years and Older: United Nations. World Population Prospects, The 2019 Revision. https://population.un.org/wpp/ (accessed 1 July 2019); and for the Cook Islands, the Marshall Islands, Nauru, Niue, Palau, and Tuvalu: The Pacific Community, Statistics for Development Division. Official communication, 3 July 2019. For Age Dependency Ratio for Total Population: Asian Development Bank estimates using data from the United Nations.
79PeopleRegional Trends and Tables
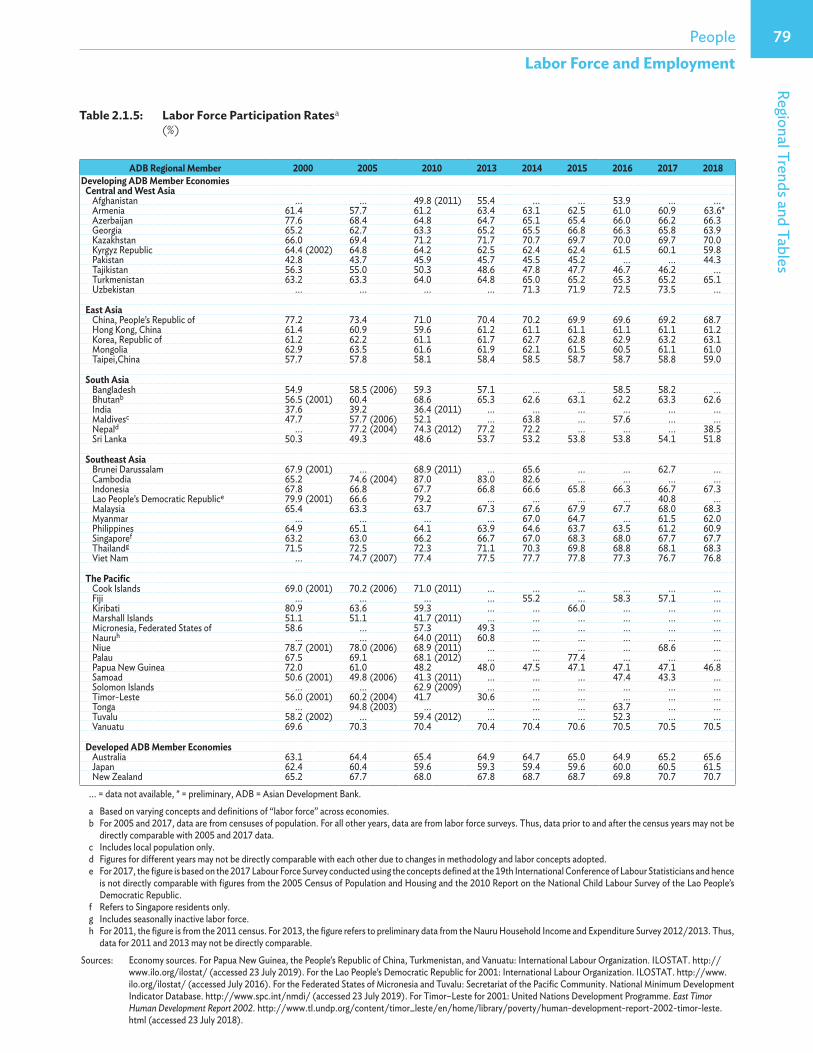
Labor Force and Employment
Table 2.1.5: Labor Force Participation Ratesa
(%)
ADB Regional Member 2000 2005 2010 2013 2014 2015 2016 2017 2018Developing ADB Member Economies Central and West Asia
Afghanistan ... ... 49.8 (2011) 55.4 ... ... 53.9 ... ... Armenia 61.4 57.7 61.2 63.4 63.1 62.5 61.0 60.9 63.6*Azerbaijan 77.6 68.4 64.8 64.7 65.1 65.4 66.0 66.2 66.3 Georgia 65.2 62.7 63.3 65.2 65.5 66.8 66.3 65.8 63.9 Kazakhstan 66.0 69.4 71.2 71.7 70.7 69.7 70.0 69.7 70.0 Kyrgyz Republic 64.4 (2002) 64.8 64.2 62.5 62.4 62.4 61.5 60.1 59.8 Pakistan 42.8 43.7 45.9 45.7 45.5 45.2 ... ... 44.3 Tajikistan 56.3 55.0 50.3 48.6 47.8 47.7 46.7 46.2 ... Turkmenistan 63.2 63.3 64.0 64.8 65.0 65.2 65.3 65.2 65.1 Uzbekistan ... ... ... ... 71.3 71.9 72.5 73.5 ...
East AsiaChina, People’s Republic of 77.2 73.4 71.0 70.4 70.2 69.9 69.6 69.2 68.7 Hong Kong, China 61.4 60.9 59.6 61.2 61.1 61.1 61.1 61.1 61.2 Korea, Republic of 61.2 62.2 61.1 61.7 62.7 62.8 62.9 63.2 63.1 Mongolia 62.9 63.5 61.6 61.9 62.1 61.5 60.5 61.1 61.0 Taipei,China 57.7 57.8 58.1 58.4 58.5 58.7 58.7 58.8 59.0
South AsiaBangladesh 54.9 58.5 (2006) 59.3 57.1 ... ... 58.5 58.2 ... Bhutanb 56.5 (2001) 60.4 68.6 65.3 62.6 63.1 62.2 63.3 62.6 India 37.6 39.2 36.4 (2011) ... ... ... ... ... ... Maldivesc 47.7 57.7 (2006) 52.1 ... 63.8 ... 57.6 ... ... Nepald ... 77.2 (2004) 74.3 (2012) 77.2 72.2 ... ... ... 38.5 Sri Lanka 50.3 49.3 48.6 53.7 53.2 53.8 53.8 54.1 51.8
Southeast AsiaBrunei Darussalam 67.9 (2001) ... 68.9 (2011) ... 65.6 ... ... 62.7 ... Cambodia 65.2 74.6 (2004) 87.0 83.0 82.6 ... ... ... ... Indonesia 67.8 66.8 67.7 66.8 66.6 65.8 66.3 66.7 67.3 Lao People’s Democratic Republice 79.9 (2001) 66.6 79.2 ... ... ... ... 40.8 ... Malaysia 65.4 63.3 63.7 67.3 67.6 67.9 67.7 68.0 68.3 Myanmar ... ... ... ... 67.0 64.7 ... 61.5 62.0 Philippines 64.9 65.1 64.1 63.9 64.6 63.7 63.5 61.2 60.9 Singaporef 63.2 63.0 66.2 66.7 67.0 68.3 68.0 67.7 67.7 Thailandg 71.5 72.5 72.3 71.1 70.3 69.8 68.8 68.1 68.3 Viet Nam ... 74.7 (2007) 77.4 77.5 77.7 77.8 77.3 76.7 76.8
The PacificCook Islands 69.0 (2001) 70.2 (2006) 71.0 (2011) ... ... ... ... ... ... Fiji ... ... ... ... 55.2 ... 58.3 57.1 ... Kiribati 80.9 63.6 59.3 ... ... 66.0 ... ... ... Marshall Islands 51.1 51.1 41.7 (2011) ... ... ... ... ... ... Micronesia, Federated States of 58.6 ... 57.3 49.3 ... ... ... ... ... Nauruh ... ... 64.0 (2011) 60.8 ... ... ... ... ... Niue 78.7 (2001) 78.0 (2006) 68.9 (2011) ... ... ... ... 68.6 ... Palau 67.5 69.1 68.1 (2012) ... ... 77.4 ... ... ... Papua New Guinea 72.0 61.0 48.2 48.0 47.5 47.1 47.1 47.1 46.8 Samoad 50.6 (2001) 49.8 (2006) 41.3 (2011) ... ... ... 47.4 43.3 ... Solomon Islands ... ... 62.9 (2009) ... ... ... ... ... ... Timor-Leste 56.0 (2001) 60.2 (2004) 41.7 30.6 ... ... ... ... ... Tonga ... 94.8 (2003) ... ... ... ... 63.7 ... ... Tuvalu 58.2 (2002) ... 59.4 (2012) ... ... ... 52.3 ... ... Vanuatu 69.6 70.3 70.4 70.4 70.4 70.6 70.5 70.5 70.5
Developed ADB Member EconomiesAustralia 63.1 64.4 65.4 64.9 64.7 65.0 64.9 65.2 65.6 Japan 62.4 60.4 59.6 59.3 59.4 59.6 60.0 60.5 61.5 New Zealand 65.2 67.7 68.0 67.8 68.7 68.7 69.8 70.7 70.7
... = data not available, * = preliminary, ADB = Asian Development Bank.
a Based on varying concepts and definitions of “labor force” across economies.b For 2005 and 2017, data are from censuses of population. For all other years, data are from labor force surveys. Thus, data prior to and after the census years may not be
directly comparable with 2005 and 2017 data. c Includes local population only. d Figures for different years may not be directly comparable with each other due to changes in methodology and labor concepts adopted.e For 2017, the figure is based on the 2017 Labour Force Survey conducted using the concepts defined at the 19th International Conference of Labour Statisticians and hence
is not directly comparable with figures from the 2005 Census of Population and Housing and the 2010 Report on the National Child Labour Survey of the Lao People’s Democratic Republic.
f Refers to Singapore residents only.g Includes seasonally inactive labor force.h For 2011, the figure is from the 2011 census. For 2013, the figure refers to preliminary data from the Nauru Household Income and Expenditure Survey 2012/2013. Thus,
data for 2011 and 2013 may not be directly comparable.
Sources: Economy sources. For Papua New Guinea, the People’s Republic of China, Turkmenistan, and Vanuatu: International Labour Organization. ILOSTAT. http://www.ilo.org/ilostat/ (accessed 23 July 2019). For the Lao People’s Democratic Republic for 2001: International Labour Organization. ILOSTAT. http://www.ilo.org/ilostat/ (accessed July 2016). For the Federated States of Micronesia and Tuvalu: Secretariat of the Pacific Community. National Minimum Development Indicator Database. http://www.spc.int/nmdi/ (accessed 23 July 2019). For Timor–Leste for 2001: United Nations Development Programme. East Timor Human Development Report 2002. http://www.tl.undp.org/content/timor_leste/en/home/library/poverty/human-development-report-2002-timor-leste.html (accessed 23 July 2018).

80 Key Indicators for Asia and the Pacific 2019Labor Force and Employment
Table 2.1.6: Employment in Agriculture, Industry, and Servicesa
(% of total employment)
ADB Regional MemberAgriculture
2000 2005 2010 2018Developing ADB Member Economies Central and West Asia
Afghanistan 69.6 (2001) 69.6 (2004) ... 39.5 (2016)Armenia 44.4 46.2 38.6 31.3 (2017)Azerbaijan 39.1 38.7 38.2 36.3Georgiab 52.8 (2001) 50.0 48.0 43.1 (2017)Kazakhstan 31.4 31.9 28.3 14.1Kyrgyz Republic 53.1 38.5 31.2 20.3Pakistanc 48.4 43.0 45.0 38.5Tajikistan 65.0 67.5 65.9 60.9 (2017)Turkmenistan 47.6 ... ... ...Uzbekistan 34.4 29.1 26.8 27.2 (2017)
East AsiaChina, People’s Republic ofd 50.0 44.8 36.7 26.1Hong Kong, Chinae 0.3 0.3 – –Korea, Republic off 10.7 8.0 6.6 5.0Mongolia 48.6 39.9 33.5 26.7Taipei,China 7.8 5.9 5.2 4.9
South AsiaBangladesh 50.8 48.1 (2006) 47.5 40.6 (2017)Bhutang 46.5 (2001) 43.6 59.4 54.0India 59.9 56.1 53.2 (2009) ...Maldivesh 13.7 15.9 (2007) 4.3 9.0 (2016)Nepal ... ... 64.0 (2011) 21.5Sri Lankai 36.0 32.8 32.5 25.5
Southeast AsiaBrunei Darussalam ... ... ... ...Cambodia 73.7 60.3 72.3 64.3 (2014)Indonesia 45.3 44.0 38.3 28.8Lao People’s Democratic Republic ... 76.3 72.2 31.3 (2017)Malaysiaj 16.7 14.6 13.6 10.6Myanmar ... ... ... 47.6Philippines 37.1 35.7 33.2 24.3Singaporek 0.1 0.1 0.2 0.1Thailand 44.2 38.6 38.2 32.1Viet Naml 65.1 55.1 49.5 37.7
The PacificCook Islandsm 7.2 (2001) 4.9 (2006) 4.3 (2011) 5.3 (2016)Fijin 1.5 1.1 1.7 19.2 (2016)Kiribatio ... 2.7 22.1 24.3 (2015)Marshall Islands 6.4 3.1 13.9 6.4 (2017)Micronesia, Federated States of 52.2 ... ... ...Nauru ... ... ... ...Niue 9.0 (2001) 15.9 (2006) 10.4 (2011) 8.7 (2017)Palaup 7.1 7.8 ... 6.4 (2015)Papua New Guinea ... ... ... ...Samoa 39.9 (2001) 35.4 (2006) 37.0 (2011) 21.9 (2017)Solomon Islandsq ... ... 41.5 (2009) ...Timor-Leste ... ... 51.0 40.5 (2013)Tonga ... 27.9 (2006) ... 24.1 (2016)Tuvalu ... ... ... ...Vanuatu ... ... ... ...
Developed ADB Member EconomiesAustralia 4.8 3.6 3.2 2.6Japan 5.1 4.4 4.0 3.4New Zealandr 8.8 6.9 6.7 5.8
continued on next page

81PeopleRegional Trends and Tables
Labor Force and Employment
ADB Regional MemberIndustry
2000 2005 2010 2018Developing ADB Member Economies Central and West Asia
Afghanistan 6.2 (2001) 6.2 (2004) ... 14.8 (2016)Armenia 20.6 15.9 17.4 16.7 (2017)Azerbaijan 12.1 12.4 13.7 14.6Georgiab 5.8 (2001) 7.5 7.2 13.2 (2017)Kazakhstan 18.2 17.9 18.7 19.9Kyrgyz Republic 10.5 17.6 21.1 24.8Pakistanc 11.5 20.3 20.9 24.6Tajikistan 9.1 8.7 7.9 9.1 (2017)Turkmenistan 13.0 ... ... ...Uzbekistan 12.7 13.2 22.7 23.1 (2017)
East AsiaChina, People’s Republic ofd 22.5 23.8 28.7 27.6Hong Kong, Chinae 19.6 14.4 11.2 11.6Korea, Republic off 20.4 26.7 25.0 25.2Mongolia 14.1 16.8 16.2 20.6Taipei,China 28.1 36.4 35.9 35.7
South AsiaBangladesh 13.1 14.6 (2006) 17.6 20.4 (2017)Bhutang 5.6 (2001) 17.2 6.6 13.1India 16.3 18.8 21.5 (2009) ...Maldivesh 19.0 27.9 (2007) 9.4 18.4 (2016)Nepal ... ... 9.5 (2011) 30.8Sri Lankai 23.6 25.4 24.6 27.9
Southeast AsiaBrunei Darussalam ... ... ... ...Cambodia 7.0 9.7 9.2 9.0 (2014)Indonesia 17.4 18.8 19.3 23.2Lao People’s Democratic Republic ... ... 8.1 14.1 (2017)Malaysiaj 32.5 29.7 27.8 27.1Myanmar ... ... ... 17.8Philippines 16.2 15.4 15.0 19.1Singaporek 25.7 21.7 21.8 15.9Thailand 20.2 22.4 20.8 22.8Viet Naml 13.1 17.6 21.0 26.8
The PacificCook Islandsm 6.0 (2001) 14.2 (2006) 11.7 (2011) 10.1 (2016)Fijin 30.8 30.8 23.9 14.4 (2016)Kiribatio ... 3.2 16.1 18.2 (2015)Marshall Islands 8.5 9.6 9.0 10.3 (2017)Micronesia, Federated States of ... ... ... ...Nauru ... ... ... ...Niue 20.4 (2001) 17.1 (2006) 14.2 (2011) 14.2 (2017)Palaup 0.7 2.6 ... 11.7 (2015)Papua New Guinea ... ... ... ...Samoa 19.7 (2001) 21.8 (2006) 12.2 (2011) 15.4 (2017)Solomon Islandsq ... ... 13.0 (2009) ...Timor-Leste ... ... 8.8 12.7 (2013)Tonga ... 27.8 (2006) ... 25.6 (2016)Tuvalu ... ... ... ...Vanuatu ... ... ... ...
Developed ADB Member EconomiesAustralia 21.5 21.1 21.0 19.7Japan 31.2 27.5 25.4 23.9New Zealandr 12.6 22.4 20.6 19.8
Table 2.1.6: Employment in Agriculture, Industry, and Servicesa (continued)
(% of total employment)
continued on next page

82 Key Indicators for Asia and the Pacific 2019Labor Force and Employment
Table 2.1.6: Employment in Agriculture, Industry, and Servicesa (continued)
(% of total employment)
ADB Regional Member Services2000 2005 2010 2018
Developing ADB Member Economies Central and West Asia
Afghanistan 24.2 (2001) 24.2 (2004) ... 45.7 (2016)Armenia 35.0 37.8 44.0 51.9 (2017)Azerbaijan 48.7 48.8 48.1 49.1Georgiab 41.4 (2001) 42.5 44.8 43.7 (2017)Kazakhstan 50.5 50.2 53.0 66.0Kyrgyz Republic 36.5 43.9 47.7 54.9Pakistanc 40.0 36.7 34.2 39.8Tajikistan 26.0 23.9 26.3 30.0 (2017)Turkmenistan 39.4 ... ... ...Uzbekistan 52.8 57.7 50.5 49.8 (2017)
East AsiaChina, People’s Republic ofd 27.5 31.4 34.6 46.3Hong Kong, Chinae 79.8 85.1 88.9 87.9Korea, Republic off 68.9 65.4 68.4 69.8Mongolia 37.2 43.3 50.2 52.7Taipei,China 64.1 57.7 58.8 59.4
South AsiaBangladesh 36.2 37.6 (2006) 35.3 38.9 (2017)Bhutang 47.9 (2001) 39.2 33.7 32.9India 23.7 25.1 25.3 (2009) ...Maldivesh 67.3 56.2 (2007) 86.3 72.6 (2016)Nepal ... ... 25.7 (2011) 47.7Sri Lankai 40.3 41.8 42.9 46.6
Southeast AsiaBrunei Darussalam ... ... ... ...Cambodia 19.3 30.0 18.6 26.6 (2014)Indonesia 37.3 37.3 42.3 48.0Lao People’s Democratic Republic ... ... 19.7 54.6 (2017)Malaysiaj 50.8 55.6 58.7 62.3Myanmar ... ... ... 34.7Philippines 46.7 48.1 51.8 56.6Singaporek 74.2 78.2 77.9 83.9Thailand 35.6 39.0 41.0 45.1Viet Naml 21.8 27.3 29.5 36.2
The PacificCook Islandsm 86.7 (2001) 80.9 (2006) 84.0 (2011) 84.6 (2016)Fijin 67.7 68.1 74.4 66.4 (2016)Kiribatio ... 30.7 61.8 57.5 (2015)Marshall Islands 85.1 87.3 77.1 83.3 (2017)Micronesia, Federated States of ... ... ... ...Nauru ... ... ... ...Niue 70.6 (2001) 66.9 (2006) 75.4 (2011) 77.1 (2017)Palaup 92.2 89.6 ... 82.0 (2015)Papua New Guinea ... ... ... ...Samoa 40.4 (2001) 42.8 (2006) 50.9 (2011) 62.7 (2017)Solomon Islandsq ... ... 44.8 (2009) ...Timor-Leste ... ... 39.8 46.7 (2013)Tonga ... 44.3 (2006) ... 50.3 (2016)Tuvalu ... ... ... ...Vanuatu ... ... ... ...
Developed ADB Member EconomiesAustralia 73.7 75.3 75.9 77.6Japan 63.7 68.1 70.5 72.7New Zealandr 66.3 70.7 72.6 74.4
... = data not available; – = magnitude equals zero, ADB = Asian Development Bank.
a Data are based on varying labor force concepts and definitions adopted by different economies. Some values may not add up to 100% due to limitations on data availability.b Prior to 2017, employment in services includes people who were engaged in construction industries.c For 2000, employment in services includes people who were engaged in electricity, gas, and water industries.d Refers to persons engaged in social labor and receiving remuneration or earning business income.e Employment in services includes people who are engaged in the following sectors: electricity and gas supply; water supply; sewerage, waste management, and remediation activities.f For 2000, employment in services includes people who are engaged in electricity, gas, water, and construction industries.g For 2005 and 2017, data are from the census of population. For other years, data are from labor force surveys. Data prior to and after the census years may not be directly comparable
to data for 2005 and 2017. h Figures include local population only. For 2010, employment in services includes people who were engaged in industries other than agriculture, forestry, and fishing; mining and
quarrying; or manufacturing industries.i Some data may not add up because (i) for 2005 and 2011–2013, data cover all islands; (ii) for 2003, data exclude the Northern Province; (iii) for 2004, data exclude Mullaitivu and
Kilinochchi districts; and (iv) for 2006–2010 and years prior to 2003, data exclude northern and eastern provinces.j For 2005, employment in services includes people who were engaged in water supply; sewerage, waste management, and remediation activities.k Refers to Singapore residents only.l Refers to total number of persons engaged in any activity, regardless of age.m Covers all wage and salary earners from all islands. For 2001, employment in services includes people who were engaged in electricity, gas, water, and construction industries.n Refers to paid employment as of end of June, except for 2000 and 2005, which refer to end of December.o Refers to cash work and unpaid village work. For 2005, employment figures by industry include only paid (cash work) workers, and as such, the number of employed for all industries
may not add up to the total number of employed, which includes both cash workers and unpaid village workers. For 2010, employment in agriculture includes people who were engaged in mining and quarrying.
p For 2000 and 2005, employment in services includes people who were engaged in electricity, gas, water, and construction industries.q For 2009, the figure refers to paid employment.r For 2000, employment in services includes people who were engaged in industries other than agriculture, forestry, and fishing or manufacturing industries.
Source: Asian Development Bank estimates using data from economy sources.

83PeopleRegional Trends and Tables
Poverty Indicators
Table 2.1.7: Poverty and Inequalitya
ADB Regional Member
Proportion of Population Living on Less Than $1.90 a
Day (2011 PPP) (%)
Proportion of Population Living on Less Than $3.20 a
Day (2011 PPP) (%)
Income Ratio of Highest 20% to Lowest 20%b
Gini Coefficient
2000 2017 2000 2017 2000 2017 2000 2017Developing ADB Member Economies Central and West Asia
Afghanistan ... ... ... ... ... ... ... ...Armenia 19.3 (2001) 1.4 55.6 (2001) 12.3 5.7 (2001) 5.0 0.354 (2001) 0.336Azerbaijanc 2.7 (2001) ... 17.6 (2001) ... 6.0 (2001) ... 0.365 (2001) ...Georgia 19.4 5.0 44.8 16.3 8.6 7.1 0.405 0.379Kazakhstan 10.3 (2001) 0.0 32.3 (2001) 0.4 6.4 (2001) 3.8 0.360 (2001) 0.275Kyrgyz Republic 42.1 1.5 77.6 19.6 4.7 3.8 0.310 0.273Pakistand 28.6 (2001) 3.9 (2015) 72.4 (2001) 34.7 (2015) 4.3 (2001) 4.8 (2015) 0.304 (2001) 0.335 (2015)Tajikistan 30.8 (2003) 4.8 (2015) 66.8 (2003) 20.3 (2015) 5.2 (2003) 5.6 (2015) 0.327 (2003) 0.340 (2015)Turkmenistan ... ... ... ... ... ... ... ...Uzbekistane 62.0 ... 86.7 ... 6.2 ... 0.361 ...
East AsiaChina, People’s Republic of 31.7 (2002) 0.7 (2015) 57.7 (2002) 7.0 (2015) 8.6 (2002) 7.1 (2015) 0.421 (2002) 0.386 (2015)Hong Kong, China ... ... ... ... ... ... ... ...Korea, Republic of 0.2 (2006) 0.2 (2012) 0.5 (2006) 0.5 (2012) 5.4 (2006) 5.3 (2012) 0.317 (2006) 0.316 (2012)Mongolia 9.7 (2002) 0.6 (2016) 33.6 (2002) 6.9 (2016) 5.4 (2002) 5.1 (2016) 0.329 (2002) 0.323 (2016)Taipei,Chinaf ... ... ... ... 4.2 3.9 0.294 0.277
South AsiaBangladesh 34.8 14.8 (2016) 72.7 52.9 (2016) 5.0 4.8 (2016) 0.334 0.324 (2016)Bhutan 17.6 (2003) 1.5 45.2 (2003) 12.0 7.4 (2003) 6.6 0.409 (2003) 0.374Indiad 38.2 (2004) 21.2 (2011) 75.2 (2004) 60.4 (2011) 5.1 (2004) 5.5 (2011) 0.344 (2004) 0.357 (2011)Maldivesd 10.0 (2002) 7.3 (2009) 39.2 (2002) 24.4 (2009) 7.2 (2002) 7.0 (2009) 0.413 (2002) 0.384 (2009)Nepald 46.1 (2003) 15.0 (2010) 75.5 (2003) 50.8 (2010) 7.9 (2003) 5.0 (2010) 0.438 (2003) 0.328 (2010)Sri Lanka 8.3 (2002) 0.8 (2016) 36.0 (2002) 10.1 (2016) 7.1 (2002) 6.8 (2016) 0.410 (2002) 0.398 (2016)
Southeast AsiaBrunei Darussalam ... ... ... ... ... ... ... ...Cambodia ... ... ... ... ... ... ... ...Indonesia 39.3 5.7 79.9 27.3 4.0 6.6 0.285 0.381Lao People’s Democratic Republicd 33.8 (2002) 22.7 (2012) 72.1 (2002) 58.7 (2012) 4.8 (2002) 5.9 (2012) 0.326 (2002) 0.364 (2012)Malaysia 0.4 (2004) 0.0 (2015) 2.6 (2004) 0.2 (2015) 10.9 (2004) 8.2 (2015) 0.461 (2004) 0.410 (2015)Myanmar ... 6.2 (2015) ... 29.5 (2015) ... 6.3 (2015) ... 0.381 (2015)Philippines 14.5 7.8 (2015) 43.1 32.6 (2015) 8.0 7.2 (2015) 0.428 0.401 (2015)Singapore ... ... ... ... ... ... ... ...Thailand 2.5 0.0 18.6 0.5 8.0 6.0 0.428 0.365Viet Nam 38.0 (2002) 2.0 (2016) 70.8 (2002) 8.4 (2016) 6.1 (2002) 6.2 (2016) 0.370 (2002) 0.353 (2016)
The PacificCook Islands ... ... ... ... ... ... ... ...Fijid 4.9 (2002) 1.4 (2013) 21.8 (2002) 14.1 (2013) 6.8 (2002) 6.0 (2013) 0.381 (2002) 0.367 (2013)Kiribati 12.9 (2006) ... 34.6 (2006) ... 6.7 (2006) ... 0.370 (2006) ...Marshall Islands ... ... ... ... ... ... ... ...Micronesia, Federated States of 8.1 (2005) 15.4 (2013) 24.6 (2005) 38.7 (2013) 8.7 (2005) 8.4 (2013) 0.424 (2005) 0.401 (2013)Nauru ... ... ... ... ... ... ... ...Niue ... ... ... ... ... ... ... ...Palau ... ... ... ... ... ... ... ...Papua New Guinead ... 38.0 (2009) ... 65.6 (2009) ... 9.3 (2009) ... 0.419 (2009)Samoad 2.0 (2002) 1.1 (2013) 11.9 (2002) 9.6 (2013) 7.6 (2002) 6.8 (2013) 0.407 (2002) 0.387 (2013)Solomon Islands 45.6 (2005) 25.1 (2013) 70.6 (2005) 58.8 (2013) 10.4 (2005) 6.4 (2013) 0.461 (2005) 0.371 (2013)Timor-Leste 46.0 (2001) 30.7 (2014) 75.7 (2001) 73.3 (2014) 6.0 (2001) 4.1 (2014) 0.359 (2001) 0.287 (2014)Tonga 2.8 (2001) 1.0 (2015) 8.4 (2001) 7.5 (2015) 7.1 (2001) 6.7 (2015) 0.377 (2001) 0.376 (2015)Tuvalu ... 3.3 (2010) ... 17.6 (2010) ... 7.0 (2010) ... 0.391 (2010)Vanuatu ... 13.1 (2010) ... 39.2 (2010) ... 6.7 (2010) ... 0.376 (2010)
Developed ADB Member EconomiesAustralia ... ... ... ... 5.5 (2001) 6.3 (2014) 0.335 (2001) 0.358 (2014)Japan ... ... ... ... 5.4 (2008) ... 0.321 (2008) ...New Zealandg ... ... ... ... ... ... ... 0.349 (2014)
... = Data not available, 0.0 = magnitude is less than half the unit employed, ADB = Asian Development Bank, PPP = purchasing power parity.
a Poverty and inequality estimates are consumption-based except for Malaysia, which is income-based. For New Zealand, the Gini coefficient data are based on disposable income post taxes and transfers. For Taipei,China, the estimates for the Gini coefficient are based on per capita disposable income.
b Derived from income or expenditure shares of the highest 20% and lowest 20% groups.c For Azerbaijan, the latest available data are for 2005: 0.0% for proportion of population below $1.90 a day (2011 PPP); 0.0% for proportion of population below $3.20 a
day (2011 PPP); 3.5 for income ratio of highest 20% to lowest 20%; and 0.266 for Gini coefficient.d Household income and expenditure surveys for these economies were conducted in overlapping years. The table adopts the approach of the World Bank’s World Development
Indicators, using the initial year of the survey as the reference period for the poverty estimates.e For Uzbekistan, the latest available data are for 2003: 62.1% for proportion of population below $1.90 a day (2011 PPP); 86.4% for proportion of population below $3.20 a
day (2011 PPP); 5.9 for income ratio of highest 20% to lowest 20%; and 0.353 for Gini coefficient.f For Taipei,China, the Gini coefficient reflected in the table refers to the coefficient using per capita disposable income. The estimates using disposable income of households
are 0.326 for 2000 and 0.337 for 2017.g Using the new income definition for New Zealand, the earliest available figure for the Gini coefficient is 0.323 for 2011.
Sources: World Bank. World Development Indicators. http://data.worldbank.org/data-catalog/world-development-indicators (accessed 3 June 2019); Organisation for Economic Co-operation and Development. Income Distribution and Poverty. /stats.oecd.org/index.aspx?queryid=66670 (accessed 3 June 2019). For Taipei,China: Government of Taipei,China, Directorate-General of Budget, Accounting and Statistics. http://eng.dgbas.gov.tw/mp.asp?mp=2 (accessed 3 June 2019).

84 Key Indicators for Asia and the Pacific 2019Poverty Indicators
Table 2.1.8: Human Development Indexa
ADB Regional Member 2000 2005 2010 2013 2014 2015 2016 2017 Rank in 2017b
Developing ADB Member Economies Central and West Asia 0.604 0.620 0.657 0.675 0.680 0.683 0.686 0.689
Afghanistan ... 0.408 0.463 0.487 0.491 0.493 0.494 0.498 168 Armenia 0.647 0.693 0.728 0.742 0.745 0.748 0.749 0.755 83 Azerbaijan 0.640 0.679 0.740 0.752 0.758 0.758 0.757 0.757 80 Georgia 0.673 0.712 0.735 0.757 0.765 0.771 0.776 0.780 70 Kazakhstan 0.685 0.747 0.765 0.788 0.793 0.797 0.797 0.800 58 Kyrgyz Republic 0.594 0.616 0.636 0.658 0.663 0.666 0.669 0.672 122 Pakistan 0.450 0.500 0.526 0.538 0.548 0.551 0.560 0.562 150 Tajikistan 0.550 0.593 0.634 0.646 0.645 0.645 0.647 0.650 127 Turkmenistan ... ... 0.673 0.692 0.697 0.701 0.705 0.706 108 Uzbekistan 0.595 0.628 0.666 0.690 0.695 0.698 0.703 0.710 105
East Asia 0.707 0.774 0.812 0.830 0.835 0.838 0.845 0.847China, People’s Republic of 0.594 0.647 0.706 0.729 0.738 0.743 0.748 0.752 86 Hong Kong, China 0.827 0.871 0.901 0.915 0.923 0.927 0.930 0.933 7 Korea, Republic of 0.817 0.855 0.884 0.893 0.896 0.898 0.900 0.903 22 Mongolia 0.589 0.650 0.697 0.729 0.734 0.737 0.743 0.741 92 Taipei,China ... 0.846 0.873 0.882 0.882 0.885 0.903 0.907 ...
South Asia 0.540 0.562 0.606 0.630 0.638 0.644 0.649 0.654Bangladesh 0.468 0.505 0.545 0.575 0.583 0.592 0.597 0.608 136 Bhutan ... 0.510 0.566 0.589 0.599 0.603 0.609 0.612 134 India 0.493 0.535 0.581 0.607 0.618 0.627 0.636 0.640 130 Maldives 0.606 0.631 0.671 0.696 0.705 0.710 0.712 0.717 101 Nepal 0.446 0.475 0.529 0.554 0.560 0.566 0.569 0.574 149 Sri Lanka 0.685 0.718 0.745 0.759 0.763 0.766 0.768 0.770 76
Southeast Asia 0.614 0.650 0.684 0.703 0.707 0.711 0.715 0.719Brunei Darussalam 0.819 0.838 0.842 0.853 0.853 0.852 0.852 0.853 39 Cambodia 0.420 0.490 0.537 0.560 0.566 0.571 0.576 0.582 146 Indonesia 0.606 0.632 0.661 0.681 0.683 0.686 0.691 0.694 116 Lao People’s Democratic Republic 0.466 0.506 0.546 0.579 0.586 0.593 0.598 0.601 139 Malaysia 0.725 0.731 0.772 0.785 0.790 0.795 0.799 0.802 57 Myanmar 0.431 0.477 0.530 0.558 0.564 0.569 0.574 0.578 148 Philippines 0.624 0.650 0.665 0.685 0.689 0.693 0.696 0.699 113 Singapore 0.819 0.868 0.909 0.923 0.928 0.929 0.930 0.932 9 Thailand 0.649 0.693 0.724 0.728 0.735 0.741 0.748 0.755 83 Viet Nam 0.579 0.616 0.654 0.675 0.678 0.684 0.689 0.694 116
The Pacific 0.584 0.602 0.632 0.644 0.645 0.652 0.653 0.658Cook Islands ... ... ... ... ... ... ... ... ... Fiji 0.683 0.695 0.711 0.727 0.730 0.738 0.738 0.741 92 Kiribati 0.552 0.585 0.590 0.609 0.616 0.621 0.610 0.612 134 Marshall Islands ... ... ... ... ... ... ... 0.708 106 Micronesia, Federated States of 0.552 0.582 0.608 0.619 0.618 0.627 0.627 0.627 131 Nauru ... ... ... ... ... ... ... ... ... Niue ... ... ... ... ... ... ... ... ... Palau 0.743 0.760 0.769 0.780 0.786 0.793 0.798 0.798 60 Papua New Guinea 0.449 0.479 0.520 0.534 0.536 0.542 0.543 0.544 153 Samoa 0.647 0.673 0.693 0.700 0.703 0.706 0.711 0.713 104 Solomon Islands 0.450 0.487 0.507 0.539 0.539 0.546 0.543 0.546 152 Timor-Leste 0.507 0.496 0.619 0.614 0.610 0.630 0.631 0.625 132 Tonga 0.673 0.693 0.712 0.716 0.717 0.721 0.724 0.726 98 Tuvalu ... ... ... ... ... ... ... ... ... Vanuatu ... 0.572 0.591 0.597 0.598 0.599 0.600 0.603 138
Developed ADB Member Economies 0.874 0.890 0.902 0.912 0.915 0.918 0.920 0.922Australia 0.898 0.908 0.923 0.931 0.933 0.936 0.938 0.939 3 Japan 0.855 0.873 0.885 0.899 0.903 0.905 0.907 0.909 19 New Zealand 0.869 0.888 0.899 0.907 0.910 0.914 0.915 0.917 16
... = data not available, ADB = Asian Development Bank.
a The regional indexes are calculated as simple averages of the indexes for their member economies. b Rank among the 189 national economies presented in Human Development Report 2018 of the United Nations Development Programme.
Sources: United Nations Development Programme. Human Development Data (1990–2017). http://hdr.undp.org/en/data# (accessed 4 June 2019). For Taipei,China: Government of Taipei,China, Directorate-General of Budget, Accounting and Statistics. https://eng.stat.gov.tw/ct.asp?xItem=25280&ctNode=6032&mp=5 (accessed 4 June 2019).

85PeopleRegional Trends and Tables
Social Indicators
Table 2.1.9: Life Expectancy at Birth (years)
ADB Regional MemberBoth Sexes Female Male
2000 2017 2000 2017 2000 2017Developing ADB Member Economies Central and West Asia
Afghanistan 55.5 64.0 56.7 65.4 54.4 62.8 Armenia 71.4 74.8 74.5 77.8 68.1 71.4 Azerbaijan 66.8 72.1 69.9 75.2 63.6 69.1 Georgia 71.9 73.4 75.4 77.6 68.1 69.2 Kazakhstan 65.5 73.0 71.1 76.9 60.2 68.7 Kyrgyz Republic 68.6 71.2 72.4 75.4 64.9 67.2 Pakistan 62.7 66.6 63.6 67.7 62.0 65.6 Tajikistan 65.5 71.2 68.8 74.4 62.5 68.4 Turkmenistan 63.6 68.0 67.7 71.4 59.6 64.5 Uzbekistan 67.2 71.4 70.4 74.2 64.0 68.6
East AsiaChina, People’s Republic of 72.0 76.4 73.7 78.0 70.4 74.9 Hong Kong, China 80.9 84.7 83.9 87.6 78.0 81.9 Korea, Republic of 75.9 82.6 79.7 85.7 72.3 79.7 Mongolia 62.9 69.5 65.9 73.7 60.1 65.4 Taipei,China 76.5 80.4 79.6 83.7 73.8 77.3
South AsiaBangladesh 65.3 72.8 65.7 74.6 65.0 71.2 Bhutan 60.8 70.6 60.9 70.9 60.6 70.3 India 62.6 68.8 63.4 70.4 61.8 67.3 Maldives 69.9 77.6 71.1 78.8 69.2 76.7 Nepal 62.4 70.6 63.4 72.2 61.3 69.0 Sri Lanka 71.0 75.5 74.9 78.8 67.5 72.1
Southeast AsiaBrunei Darussalam 75.2 77.4 76.9 79.1 73.7 75.8 Cambodia 58.4 69.3 60.6 71.3 56.2 67.1 Indonesia 66.3 69.4 68.0 71.6 64.6 67.3 Lao People’s Democratic Republic 58.9 67.0 60.3 68.6 57.5 65.4 Malaysia 72.8 75.5 75.0 77.9 70.8 73.3 Myanmar 62.1 66.7 64.2 69.1 60.1 64.4 Philippines 67.2 69.2 70.3 72.8 64.2 65.9 Singapore 78.0 82.9 80.0 85.2 76.0 80.7 Thailand 70.6 75.5 74.5 79.3 66.9 71.8 Viet Nam 73.3 76.5 78.1 81.0 68.4 71.8
The PacificCook Islands 71.9 76.2 (2018) 74.7 79.2 (2018) 69.2 73.4 (2018)Fiji 67.6 70.4 70.2 73.6 65.2 67.5 Kiribati 64.0 66.5 67.0 69.8 61.1 63.2 Marshall Islands 68.4 73.6 (2018) 70.4 76.0 (2018) 66.6 71.4 (2018)Micronesia, Federated States of 67.3 69.3 67.9 70.5 66.7 68.1 Nauru 60.9 67.8 (2018) 64.5 71.2 (2018) 57.4 63.6 (2018)Niue 70.1 (2001) 73.9 (2006–2011) a 71.2 (2001) 75.2 (2006–2011) a 69.8 (2001) 72.5 (2006–2011) a
Palau 68.5 73.6 (2018) 71.7 77.0 (2018) 65.4 70.4 (2018)Papua New Guinea 61.8 65.7 64.4 68.3 59.5 63.3 Samoa 69.3 75.2 72.8 78.5 66.3 72.3 Solomon Islands 63.1 71.0 64.0 72.6 62.3 69.5 Timor-Leste 59.4 69.2 60.6 71.1 58.1 67.4 Tonga 70.8 73.2 72.8 76.2 68.8 70.2 Tuvalu 61.6 67.2 (2018) 63.6 69.5 (2018) 59.7 65.0 (2018)Vanuatu 67.4 72.3 69.3 74.7 65.9 70.2
Developed ADB Member EconomiesAustralia 79.2 82.5 82.0 84.7 76.6 80.4 Japan 81.1 84.1 84.6 87.3 77.7 81.1 New Zealand 78.6 81.7 81.3 83.4 76.1 80.0
WORLD 67.7 72.2 69.9 74.5 65.6 70.1 ADB = Asian Development Bank.
a Refers to multiyear average for the intercensal years 2006–2011. Estimates are derived through an indirect technique, by applying the United Nations Mortpak.4.1 software program (MATCH), which calculates the Coale-Demeny WEST model life tables.
Sources: World Bank. World Development Indicators. http://databank.worldbank.org/data/source/world-development-indicators/preview/on# (accessed 19 June 2019). For the Cook Islands, the Marshall Islands, Nauru, Palau, and Tuvalu: United States Census Bureau Online. https://www.census.gov/data-tools/demo/idb/informationGateway.php (accessed 19 June 2019). For Niue: Statistics Niue, Department of Finance, Planning and Statistics. https://niue.prism.spc.int/ and http://prism.spc.int/images/census_reports/Niue_2011_Population_Households_Census.pdf (accessed 19 June 2019). For Taipei,China: Government of Taipei,China, Directorate-General of Budget, Accounting and Statistics. http://eng.dgbas.gov.tw/mp.asp?mp=2 (accessed 19 June 2019).

86 Key Indicators for Asia and the Pacific 2019Social Indicators
Table 2.1.10: Births, Deaths, and Fertility Rates
ADB Regional MemberCrude Birth Rate(per 1,000 people)
Crude Death Rate(per 1,000 people)
Total Fertility Rate(births per woman)
2000 2017 2000 2017 2000 2017Developing ADB Member Economies Central and West Asia
Afghanistan 48.4 32.5 12.0 6.6 7.5 4.5 Armenia 12.9 13.1 8.6 9.7 1.6 1.6 Azerbaijan 14.5 14.6 5.8 5.8 2.0 1.9 Georgia 12.0 13.2 9.9 13.2 1.6 2.0 Kazakhstan 14.9 21.6 10.1 7.2 1.8 2.7 Kyrgyz Republic 19.8 24.8 7.0 5.4 2.4 3.0 Pakistan 32.0 27.7 8.7 7.2 4.6 3.4 Tajikistan 30.2 28.3 7.0 5.1 3.9 3.3 Turkmenistan 23.6 24.6 7.8 7.1 2.8 2.8 Uzbekistan 21.4 22.1 5.5 5.0 2.6 2.5
East AsiaChina, People’s Republic of 14.0 12.4 6.5 7.1 1.5 1.6 Hong Kong, China 8.1 7.7 5.1 6.3 1.0 1.1 Korea, Republic of 13.3 7.0 5.2 5.6 1.5 1.1 Mongolia 19.3 23.1 7.7 6.3 2.1 2.7 Taipei,China 13.8 7.7 (2018) 5.7 7.3 (2018) 1.7 1.1 (2018)
South AsiaBangladesh 27.6 18.6 6.9 5.3 3.2 2.1 Bhutan 28.0 17.9 8.5 6.0 3.6 2.0 India 26.5 18.8 8.7 7.3 3.3 2.3 Maldives 22.6 17.7 4.7 3.3 2.9 2.1 Nepal 32.1 19.5 8.5 6.2 4.0 2.1 Sri Lanka 18.5 15.0 7.0 7.0 2.2 2.0
Southeast AsiaBrunei Darussalam 21.4 15.6 2.9 3.6 2.2 1.9 Cambodia 28.1 22.9 9.4 6.0 3.8 2.5 Indonesia 21.8 18.6 7.3 7.2 2.5 2.3 Lao People’s Democratic Republic 31.8 23.4 9.8 6.6 4.3 2.6 Malaysia 22.0 17.0 4.5 5.0 2.8 2.0 Myanmar 24.5 17.6 9.1 8.2 2.9 2.2 Philippines 29.6 23.0 6.0 6.5 3.8 2.9 Singapore 13.7 8.9 4.5 5.0 1.6 1.2 Thailand 14.5 10.1 6.9 8.0 1.7 1.5 Viet Nam 17.5 16.5 5.5 5.8 2.0 2.0
The PacificCook Islands 23.1 13.7 (2018) 6.3 8.6 (2018) 3.2 2.2 (2018)Fiji 24.7 19.0 6.1 7.2 3.1 2.5 Kiribati 30.6 27.9 7.6 7.0 4.1 3.6 Marshall Islands 35.0 23.8 (2018) 5.3 4.2 (2018) 4.4 3.0 (2018)Micronesia, Federated States of 29.9 23.8 6.3 6.2 4.3 3.1 Nauru 27.9 23.2 (2018) 7.2 5.9 (2018) 3.5 2.8 (2018)Niue 18.5 (2001) 18.4 (2006–2011)a 7.8 (2001) 8.9 (2006–2011)a 3.0 (2001) 2.2 (2006–2011)a
Palau 14.5 12.4 6.5 10.3 1.8 2.2 (2015)Papua New Guinea 34.0 27.3 8.3 7.1 4.5 3.6 Samoa 30.6 24.3 6.1 5.0 4.5 3.9 Solomon Islands 35.6 28.2 7.5 4.7 4.7 3.8 Timor-Leste 43.5 34.6 9.4 5.4 7.1 5.4 Tonga 28.2 23.6 6.2 6.0 4.3 3.6 Tuvalu 24.6 23.7 (2018) 10.8 8.4 (2018) 3.6 2.9 (2018)Vanuatu 32.4 25.5 6.2 4.8 4.4 3.2
Developed ADB Member EconomiesAustralia 13.0 12.4 6.7 6.5 1.8 1.8 Japan 9.4 7.6 7.7 10.8 1.4 1.4 New Zealand 14.7 12.4 6.9 7.0 2.0 1.8
WORLD 21.6 18.7 8.5 7.6 2.7 2.4 ADB = Asian Development Bank.
a Refers to a multiyear average for the intercensal years 2006–2011. Crude birth rate and crude death rate are calculated by dividing the average annual number of births and deaths of the intercensal period 2006–2011 by the midperiod population size of the intercensal period. For total fertility rate, the estimate is based on the average registered number of children born, by age of mother, of the intercensal period 2006–2011, and the estimated midperiod number of women of childbearing age.
Sources: World Bank. World Development Indicators. http://databank.worldbank.org/data/source/world-development-indicators/preview/on (accessed 18 June 2019). For the Cook Islands, the Marshall Islands, Nauru, and Tuvalu: United States Census Bureau Online. http://www.census.gov/ (accessed 18 June 2019). For Niue: Statistics Niue, Department of Finance, Planning and Statistics. https://niue.prism.spc.int/ and http://prism.spc.int/images/census_reports/Niue_2011_Population_Households_Census.pdf (accessed 18 June 2019). For Taipei,China: Government of Taipei,China, Directorate-General of Budget, Accounting and Statistics. http://eng.dgbas.gov.tw/mp.asp?mp=2 (accessed 18 June 2019).

87PeopleRegional Trends and Tables
Social Indicators
Table 2.1.11: Primary Education Completion Ratea (%)
ADB Regional MemberBoth Sexes Female Male
2000 2017 2000 2017 2000 2017Developing ADB Member Economies Central and West Asia
Afghanistan ... ... ... ... ... ... Armenia 93.7 (2002) 91.6 94.1 (2002) 92.2 93.3 (2002) 91.1 Azerbaijan 89.5 107.2 85.5 107.6 93.8 106.8 Georgia 96.2 117.1 96.4 117.6 96.0 116.7 Kazakhstan 92.1 109.7 (2018) 92.0 110.9 (2018) 92.2 108.5 (2018)Kyrgyz Republic 93.7 103.8 93.2 103.4 94.1 104.1 Pakistan 64.3 (2005) 71.3 (2016) 53.5 (2005) 64.6 (2016) 74.5 (2005) 77.6 (2016)Tajikistan 92.7 92.4 ... 92.0 ... 92.7 Turkmenistan ... ... ... ... ... ... Uzbekistan 100.4 (2001) 97.7 100.3 (2001) 97.0 100.5 (2001) 98.4
East AsiaChina, People’s Republic of 89.1 (2006) 99.9 (2013) 89.0 (2006) 99.2 (2013) 89.2 (2006) 100.5 (2013)Hong Kong, China ... 102.2 ... 100.7 ... 103.6 Korea, Republic of 103.2 96.1 (2016) 105.0 96.5 (2016) 101.6 95.8 (2016)Mongolia 87.0 92.6 89.3 91.5 84.6 93.6 Taipei,China ... ... ... ... ... ...
South AsiaBangladesh 64.3 (2005) 118.6 66.8 (2005) 123.0 61.9 (2005) 114.3 Bhutan 49.5 95.1 46.1 99.5 52.9 90.9 India 71.8 94.5 63.5 96.6 79.4 92.6 Maldives ... 94.7 ... 91.5 ... 97.8 Nepal 67.3 112.8 57.2 118.1 77.0 107.6 Sri Lanka 107.3 (2001) 101.9 106.6 (2001) 101.2 108.0 (2001) 102.7
Southeast AsiaBrunei Darussalam 114.8 106.5 109.9 105.2 119.5 107.8 Cambodia 51.3 (2001) 89.6 46.1 (2001) 91.9 56.3 (2001) 87.3 Indonesia 93.8 (2001) 99.2 94.2 (2001) 98.5 93.4 (2001) 99.8 Lao People’s Democratic Republic 67.3 102.2 61.4 101.8 73.0 102.6 Malaysia 100.6 99.2 100.7 100.3 100.5 98.1 Myanmar 78.2 96.4 75.9 96.7 80.6 96.1 Philippines 100.3 (2001) 104.0 (2016) 105.4 (2001) 106.1 (2016) 95.5 (2001) 102.0 (2016)Singapore ... 99.8 (2016) ... 99.2 (2016) ... 100.4 (2016)Thailand 84.9 93.4 84.3 94.1 85.4 92.7 Viet Nam 99.0 104.8 (2016) 96.6 105.0 (2016) 101.3 104.5 (2016)
The PacificCook Islands 112.0 (2007) 108.9 (2016) ... 102.1 (2016) ... 115.9 (2016)Fiji 95.0 102.8 (2016) 93.9 103.1 (2016) 96.0 102.6 (2016)Kiribati 99.0 99.5 (2016) 95.1 103.5 (2016) 102.7 95.8 (2016)Marshall Islands 114.3 (2002) 76.9 (2016) 118.1 (2002) 80.0 (2016) 110.8 (2002) 74.0 (2016)Micronesia, Federated States of ... ... ... ... ... ... Nauru 87.0 (2001) 120.4 (2016) 90.1 (2001) 121.0 (2016) 84.3 (2001) 119.8 (2016)Niue 105.0 (2001) 111.5 (2016) 105.6 (2001) 80.0 (2016) 104.5 (2001) 154.5 (2016)Palau 104.5 (2004) 95.9 (2014) ... 94.7 (2014) ... 96.9 (2014)Papua New Guinea 52.5 79.3 (2016) 48.1 73.5 (2016) 56.7 84.7 (2016)Samoa 94.0 100.9 95.5 103.2 92.7 98.7 Solomon Islands ... 87.2 ... 89.5 ... 85.0 Timor-Leste 76.6 (2008) 95.3 (2016) 76.1 (2008) 97.6 (2016) 77.2 (2008) 93.1 (2016)Tonga 105.5 (2001) 111.0 (2013) 104.0 (2001) 106.5 (2013) 107.0 (2001) 115.1 (2013)Tuvalu 101.7 (2001) 104.0 (2016) 108.3 (2001) 98.9 (2016) 96.1 (2001) 108.7 (2016)Vanuatu 92.1 93.8 (2013) 94.4 97.8 (2013) 89.9 90.2 (2013)
Developed ADB Member EconomiesAustralia ... ... ... ... ... ... Japan ... 100.5 (2016) ... 100.7 (2016) ... 100.3 (2016)New Zealand ... ... ... ... ... ...
... = data not available, ADB = Asian Development Bank.
a Represented by the total number of new entrants in the last grade of primary education, regardless of age, expressed as a percentage of the population at the theoretical age to enter the last grade of primary education.
Source: United Nations Educational, Scientific and Cultural Organization, Institute for Statistics Database. UIS.Stat. http://data.uis.unesco.org/ (accessed 20 July 2019).

88 Key Indicators for Asia and the Pacific 2019Social Indicators
Table 2.1.12: Adult (15 Years and Older) Literacy Rate (%)
ADB Regional MemberBoth Sexes Female Male
2000 2016 2000 2016 2000 2016Developing ADB Member Economies Central and West Asia
Afghanistan ... 31.7 (2011) ... 17.6 (2011) ... 45.4 (2011)Armenia 99.4 (2001) 99.7 (2011) 99.2 (2001) 99.7 (2011) 99.7 (2001) 99.8 (2011)Azerbaijan 99.6 (2007) 99.8 99.4 (2007) 99.7 99.8 (2007) 99.9 Georgia 99.7 (2002) 99.6 (2014) 99.6 (2002) 99.5 (2014) 99.8 (2002) 99.7 (2014)Kazakhstan ... 99.8 (2010) ... 99.7 (2010) ... 99.8 (2010)Kyrgyz Republic ... 99.2 (2009) ... 99.0 (2009) ... 99.5 (2009)Pakistan 49.9 (2005) 57.0 (2014) 35.4 (2005) 44.3 (2014) 64.1 (2005) 69.1 (2014)Tajikistan 99.5 99.8 (2014) 99.2 99.7 (2014) 99.7 99.8 (2014)Turkmenistan ... 99.7 (2014) ... 99.6 (2014) ... 99.8 (2014)Uzbekistan 98.6 100.0 98.1 100.0 99.2 100.0
East AsiaChina, People’s Republic of 90.9 95.1 (2010) 86.5 92.7 (2010) 95.1 97.5 (2010)Hong Kong, China ... ... ... ... ... ... Korea, Republic of ... ... ... ... ... ... Mongolia 97.8 98.3 (2010) 97.5 98.3 (2010) 98.0 98.2 (2010)Taipei,China ... ... ... ... ... ...
South AsiaBangladesh 47.5 (2001) 72.9 (2017) 40.8 (2001) 70.1 (2017) 53.9 (2001) 75.7 (2017)Bhutan 52.8 (2005) 57.0 (2012) 38.7 (2005) 48.0 (2012) 65.0 (2005) 66.0 (2012)India 61.0 (2001) 69.3 (2011) 47.8 (2001) 59.3 (2011) 73.4 (2001) 78.9 (2011)Maldives 98.4 (2006) 98.6 (2014) 98.4 (2006) 98.7 (2014) 98.4 (2006) 98.5 (2014)Nepal 48.6 (2001) 59.6 (2011) 34.9 (2001) 48.8 (2011) 62.7 (2001) 71.7 (2011)Sri Lanka 90.7 (2001) 91.9 (2017) 89.1 (2001) 91.0 (2017) 92.3 (2001) 93.0 (2017)
Southeast AsiaBrunei Darussalam 92.7 (2001) 96.1 (2011) 90.2 (2001) 94.7 (2011) 95.2 (2001) 97.4 (2011)Cambodia 73.6 (2004) 80.5 (2015) 64.1 (2004) 75.0 (2015) 84.7 (2004) 86.5 (2015)Indonesia 90.4 (2004) 95.4 86.8 (2004) 93.6 94.0 (2004) 97.2 Lao People’s Democratic Republic 69.6 84.7 (2015) 58.5 79.4 (2015) 81.4 90.0 (2015)Malaysia 88.7 93.7 85.4 91.1 92.0 96.3 Myanmar 89.9 75.6 86.4 71.8 93.9 80.0 Philippines 92.6 96.4 (2013) 92.7 96.8 (2013) 92.5 96.0 (2013)Singapore 92.5 97.0 88.6 95.4 96.6 98.7 Thailand 92.6 92.9 (2015) 90.5 91.2 (2015) 94.9 94.7 (2015)Viet Nam 90.2 93.5 (2009) 86.6 91.4 (2009) 93.9 95.8 (2009)
The PacificCook Islands ... ... ... ... ... ... Fiji ... ... ... ... ... ... Kiribati ... ... ... ... ... ... Marshall Islands ... 98.3 (2011) ... 98.2 (2011) ... 98.3 (2011)Micronesia, Federated States of ... ... ... ... ... ... Nauru ... ... ... ... ... ... Niue ... ... ... ... ... ... Palau ... 96.6 (2015) ... 96.3 (2015) ... 96.8 (2015)Papua New Guinea 57.3 61.6 (2010) 50.9 57.9 (2010) 63.4 65.3 (2010)Samoa ... 99.0 (2011) ... 99.1 (2011) ... 98.9 (2011)Solomon Islands ... ... ... ... ... ... Timor-Leste 37.6 (2001) 58.3 (2010) 30.0 (2001) 53.0 (2010) 45.3 (2001) 63.6 (2010)Tonga 99.0 (2006) 99.4 (2011) 99.1 (2006) 99.4 (2011) 99.0 (2006) 99.3 (2011)Tuvalu ... ... ... ... ... ... Vanuatu 78.4 (2004) 84.7 (2014) 76.2 (2004) 83.2 (2014) 80.5 (2004) 86.2 (2014)
Developed ADB Member EconomiesAustralia ... ... ... ... ... ... Japan ... ... ... ... ... ... New Zealand ... ... ... ... ... ...
WORLD 81.5 86.2 76.4 82.7 86.6 89.8 ... = data not available, ADB = Asian Development Bank.
Source: United Nations Educational, Scientific and Cultural Organization, Institute for Statistics Database. UIS.Stat. http://data.uis.unesco.org/ (accessed 20 July 2019).

89PeopleRegional Trends and Tables
Social Indicators
Table 2.1.13: Education Resources
ADB Regional MemberPrimary Pupil–Teacher Ratio Secondary Pupil–Teacher Ratio
2000 2017 2000 2017Developing ADB Member Economies Central and West Asia
Afghanistan 42.3 (2006) 44.0 31.6 (2007) 38.7Armenia 20.3 (2001) ... ... ...Azerbaijan 18.7 15.5 ... ...Georgia 16.8 9.0 7.5 7.4Kazakhstan 18.7 (2001) 19.6 (2018) ... 7.0 (2018)Kyrgyz Republic 24.1 24.9 13.3 10.4Pakistan 33.0 44.8 24.2 (2003) 19.4Tajikistan 21.8 22.3 16.4 15.4 (2011)Turkmenistan ... ... ... ...Uzbekistan 21.4 21.2 11.5 10.3
East AsiaChina, People’s Republic of 22.2 (2001) 16.6 17.1 13.3Hong Kong, China 21.5 13.8 18.8 (2001) 11.5Korea, Republic of 32.1 16.3 (2016) 21.0 13.8 (2016)Mongolia 32.6 30.4 19.9 14.5 (2010)Taipei,China 19.0 12.1 (2018) 17.6 12.8 a (2018)
South AsiaBangladesh 47.0 (2005) 30.1 38.4 34.0Bhutan 41.1 34.6 28.1 (2005) 11.0India 40.0 35.2 (2016) 33.6 28.5 (2016)Maldives 22.7 10.2 15.3 ...Nepal 38.0 20.9 30.2 28.8Sri Lanka 26.3 (2001) 22.9 ... 17.4
Southeast AsiaBrunei Darussalam 13.7 10.2 10.9 8.7Cambodia 50.1 41.7 18.5 ...Indonesia 22.1 16.1 14.6 15.3Lao People’s Democratic Republic 30.1 22.3 21.3 18.1Malaysia 19.6 11.7 18.4 12.3Myanmar 32.8 23.0 31.9 26.4Philippines 35.3 29.0 (2016) 36.4 (2001) 23.5 (2016)Singapore 21.1 (2007) 15.1 (2016) 17.8 (2007) 11.7 (2016)Thailand 20.8 16.2 24.0 (2001) 24.2Viet Nam 29.5 19.6 ... ...
The PacificCook Islands 17.8 17.4 (2016) 13.9 15.7 (2016)Fiji 28.1 19.7 (2016) 20.2 19.3 (2012)Kiribati 31.7 25.5 21.0 (2001) ...Marshall Islands 16.9 (2002) ... 16.7 (2002) ...Micronesia, Federated States of ... 19.7 (2015) ... ...Nauru 21.5 40.2 (2016) 17.4 24.8 (2016)Niue 14.7 15.5 (2016) 7.8 7.9 (2015)Palau 15.7 ... 15.1 ...Papua New Guinea 35.4 35.5 (2016) ... 34.3 (2016)Samoa 24.0 30.2 (2010) 21.2 27.7 (2016)Solomon Islands ... 25.8 10.1 25.9 (2012)Timor–Leste 61.9 (2001) 31.4 (2011) 28.0 (2001) 24.3 (2011)Tonga 22.1 21.6 (2015) 14.6 14.5 (2015)Tuvalu 19.7 17.2 (2016) ... 8.4 (2016)Vanuatu 22.5 26.6 (2015) 24.7 20.6 (2015)
Developed ADB Member EconomiesAustralia ... ... ... ...Japan ... 15.9 (2016) ... 11.2 (2016)New Zealand 18.4 14.9 15.5 13.6
... = data not available, ADB = Asian Development Bank.
a Includes those for vocational secondary schools.
Sources: United Nations Educational, Scientific and Cultural Organization, Institute for Statistics Database. UIS.Stat. http://data.uis.unesco.org/ (accessed 24 May 2019). For Taipei,China: Government of Taipei,China, Directorate-General of Budget, Accounting and Statistics. Social Indicators. http://eng.dgbas.gov.tw/mp.asp?mp=2 (accessed 24 May 2019).

90 Key Indicators for Asia and the Pacific 2019Social Indicators
Table 2.1.14: Health Care Resources (per 1,000 population)
ADB Regional MemberPhysicians Hospital Beds
2000 2017 2000 2017Developing ADB Member Economies Central and West Asia
Afghanistan 0.20 (2001) 0.28 (2016) 0.3 0.5 (2015)Armenia 2.99 2.90 (2014) 6.4 4.2 (2015)Azerbaijan 3.61 3.45 (2014) 8.7 4.7 (2013)Georgia 4.67 (2008) 5.10 (2015) 4.8 2.6 (2013)Kazakhstan 3.29 3.25 (2014) 7.2 6.7 (2013)Kyrgyz Republic 2.48 (2008) 1.88 (2014) 7.0 4.5 (2013)Pakistan 0.66 0.98 (2015) 0.7 0.6 (2014)Tajikistan 2.17 1.70 (2014) 6.5 4.8 (2013)Turkmenistan 4.35 (2002) 2.22 (2014) 9.1 7.4 (2013)Uzbekistan 2.95 2.37 (2014) 5.3 4.0 (2013)
East AsiaChina, People’s Republic of 1.24 1.79 (2015) 2.5 4.2 (2012)Hong Kong, China ... ... ... ... Korea, Republic of 1.69 (2004) 2.37 6.1 11.5 (2015)Mongolia 2.75 (2002) 2.89 (2016) 7.5 (2002) 7.0 (2012)Taipei,China 1.54 (2001) 2.25 5.7 (2001) 7.0
South AsiaBangladesh 0.24 (2001) 0.53 0.3 (2001) 0.8 (2015)Bhutan 0.18 (2004) 0.37 1.6 (2001) 1.7 (2012)India 0.53 0.78 0.7 (2002) 0.7 (2011)Maldives 0.97 (2004) 1.04 (2016) 1.7 4.3 (2009)Nepal 0.21 (2004) 0.65 0.2 (2001) 0.3 (2012)Sri Lanka 0.42 0.96 2.9 3.6 (2012)
Southeast AsiaBrunei Darussalam 1.01 1.77 (2015) 2.6 2.7 (2015)Cambodia 0.17 0.17 (2014) 0.6 (2001) 0.8 (2015)Indonesia 0.13 (2003) 0.38 0.6 (2002) 1.2 (2015)Lao People’s Democratic Republic 0.28 0.50 (2014) 0.9 (2002) 1.5 (2012)Malaysia 0.70 1.51 (2015) 1.8 (2001) 1.9 (2015)Myanmar 0.37 (2004) 0.86 0.7 0.9 (2012)Philippines 1.22 1.28 (2010) 1.0 (2001) 1.0 (2011)Singapore 1.43 (2001) 2.31 (2016) 2.9 (2001) 2.4 (2015)Thailand 0.30 (2001) 0.81 2.2 2.1 (2010)Viet Nam 0.52 (2001) 0.82 (2016) 2.4 (2001) 2.6 (2014)
The PacificCook Islands 0.77 (2001) 1.42 (2014) 6.3 (2005) ... Fiji 0.47 (2003) 0.84 (2015) 2.1 (2004) 2.3 (2011)Kiribati 0.25 (2008) 0.20 (2013) 1.5 (2004) 1.9 (2015)Marshall Islands 0.60 (2007) 0.46 (2012) ... 2.7 (2010)Micronesia, Federated States of 0.60 0.19 (2009) 2.8 3.2 (2009)Nauru 0.99 (2004) 1.24 (2015) 3.5 (2004) 5.0 (2010)Niue 2.22 (2003) ... 5.2 (2006) ... Palau 1.30 (2006) 1.18 (2014) 5.9 (2006) 4.8 (2010)Papua New Guinea 0.05 0.05 (2010) ... ... Samoa 0.28 (2003) 0.34 (2016) 3.3 ... Solomon Islands 0.13 (2003) 0.20 (2016) 2.2 (2003) 1.4 (2012)Timor-Leste 0.08 (2004) 0.72 ... 5.9 (2010)Tonga 0.36 (2001) 0.52 (2013) 3.2 (2001) 2.6 (2010)Tuvalu 0.63 (2002) 0.92 (2014) 5.6 (2001) ... Vanuatu 0.15 (2004) 0.17 (2016) 3.1 (2001) ...
Developed ADB Member EconomiesAustralia 2.48 (2001) 3.59 (2016) 7.8 3.8 (2014)Japan 2.01 2.41 (2016) 14.7 13.4 (2012)New Zealand 2.31 (2001) 3.03 (2016) 6.2 (2002) 2.8 (2013)
... = data not available, ADB = Asian Development Bank.
Sources: For number of physicians per 1,000 population: World Health Organization. Global Health Observatory. http://apps.who.int/gho/data/node.main.HWFGRP_0020?lang=en (accessed 27 May 2019); and for initial year data of Armenia, Azerbaijan, Kazakhstan, Timor-Leste, and Uzbekistan: World Bank. World Development Indicators. https://data.worldbank.org/indicator/SH.MED.PHYS.ZS (accessed 27 May 2019). For number of hospital beds per 1,000 population: World Bank. World Development Indicators. https://data.worldbank.org/indicator/SH.MED.BEDS.ZS (accessed 27 May 2019); and for initial year data of Cook Islands and Niue: World Health Organization. Global Health Observatory. http://apps.who.int/gho/data/view.main.HS07v (accessed 27 May 2019). For Taipei,China: Government of Taipei,China, Directorate-General of Budget, Accounting and Statistics. Statistical Yearbook of the Republic of China 2017. https://eng.dgbas.gov.tw/lp.asp?ctNode=2351&CtUnit=1072&BaseDSD=36&MP=2 (accessed 27 May 2019).

91PeopleRegional Trends and Tables
Social Indicators
Table 2.1.15: Adults Aged 15 Years and Older Living with HIVa (‘000)
ADB Regional MemberAll Adults Women
2000 2018 2000 2018Developing ADB Member Economies Central and West Asia
Afghanistan 1.5 6.9 <0.5 2.0 Armenia <1.0 3.5 <0.5 1.2 Azerbaijan ... ... ... ... Georgia <1.0 9.3 <0.5 3.0 Kazakhstan 1.1 25.0 <0.5 9.2 Kyrgyz Republic <1.0 8.2 <0.2 2.7 Pakistan <0.5 160.0 <0.2 48.0 Tajikistan 1.4 12.0 <0.5 3.5 Turkmenistan ... ... ... ... Uzbekistan 14.0 46.0 4.2 16.0
East AsiaChina, People’s Republic of ... ... ... ... Hong Kong, China ... ... ... ... Korea, Republic of ... ... ... ... Mongolia <0.1 <1.0 <0.1 <0.2 Taipei,China ... ... ... ...
South AsiaBangladesh <1.0 13.0 <0.5 4.8 Bhutan <1.0 1.3 <0.2 <0.5 India ... ... ... ... Maldives ... ... ... ... Nepal 15.0 29.0 2.4 12.0 Sri Lanka 2.1 3.4 <0.5 1.0
Southeast AsiaBrunei Darussalam ... ... ... ... Cambodia 78.0 70.0 33.0 37.0 Indonesia 80.0 620.0 15.0 220.0 Lao People’s Democratic Republic ... ... ... ... Malaysia 55.0 87.0 11.0 15.0 Myanmar 150.0 230.0 34.0 87.0 Philippines 1.0 77.0 <0.2 4.6 Singapore 2.9 7.9 <0.5 <1.0 Thailand 720.0 480.0 260.0 210.0 Viet Nam 120.0 220.0 24.0 74.0
The PacificCook Islands ... ... ... ... Fiji ... ... ... ... Kiribati ... ... ... ... Marshall Islands ... ... ... ... Micronesia, Federated States of ... ... ... ... Nauru ... ... ... ... Niue ... ... ... ... Palau ... ... ... ... Papua New Guinea 19.0 42.0 10.0 25.0 Samoa ... ... ... ... Solomon Islands ... ... ... ... Timor-Leste ... ... ... ... Tonga ... ... ... ... Tuvalu ... ... ... ... Vanuatu ... ... ... ...
Developed ADB Member EconomiesAustralia 13.0 28.0 1.3 3.3 Japan 6.1 30.0 <1.0 2.8 New Zealand 1.3 3.6 <0.5 <1.0
... = data not available, < = less than, ADB = Asian Development Bank.
a The modeled HIV estimates are calculated by the Joint United Nations Programme on HIV/AIDS (UNAIDS) using the software Spectrum developed by Avenir Health (www.avenirhealth.org), and the Estimates and Projections Package developed by the East-West Center (www.eastwestcenter.org). The UNAIDS Reference Group on Estimates, Modelling and Projections (www.epidem.org) provides technical guidance on the development of the HIV component of the software.
Source: Joint United Nations Programme on HIV/AIDS (UNAIDS). UNAIDS Database. http://aidsinfo.unaids.org/ (accessed 20 July 2019).