key indicators for asia and the pacific 2016 · •...
TRANSCRIPT
178 Key Indicators for Asia and the Pacific 2016178
PRC = People’s Republic of China.Source: World Bank. World Development Indicators Online. 2016. http://data.worldbank.org/indicator/BX.KLT.DINV.CD.WD (accessed October 2016).
0 50 100 150 200 250 300 350 400 450
Germany
Canada
Singapore
Netherlands
Brazil
Switzerland
Ireland
Hong Kong, China
PRC
United States
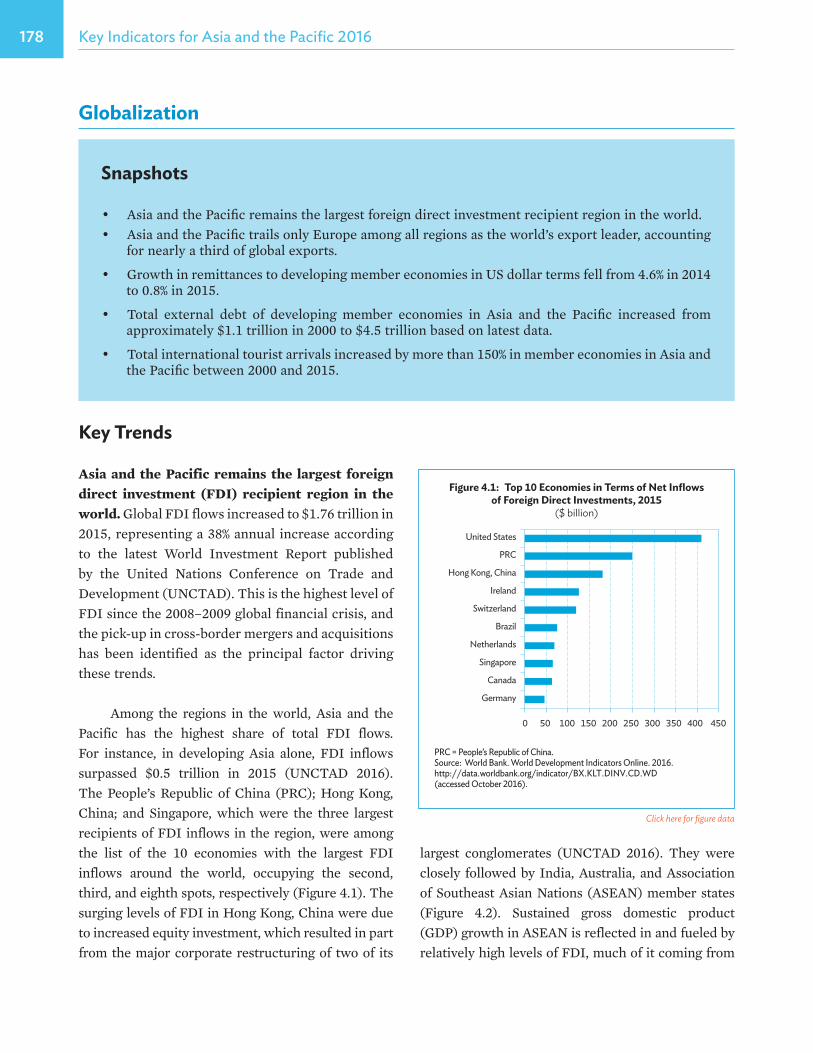
Figure 4.1: Top 10 Economies in Terms of Net Inflows of Foreign Direct Investments, 2015
($ billion)
Globalization
Snapshots
•• Asia•and•the•Pacific•remains•the•largest•foreign•direct•investment•recipient•region•in•the•world.•• Asia•and•the•Pacific•trails•only•Europe•among•all•regions•as•the•world’s•export•leader,•accounting•
for•nearly•a•third•of•global•exports.
•• Growth•in•remittances•to•developing•member•economies•in•US•dollar•terms•fell•from•4.6%•in•2014•to•0.8%•in•2015.•
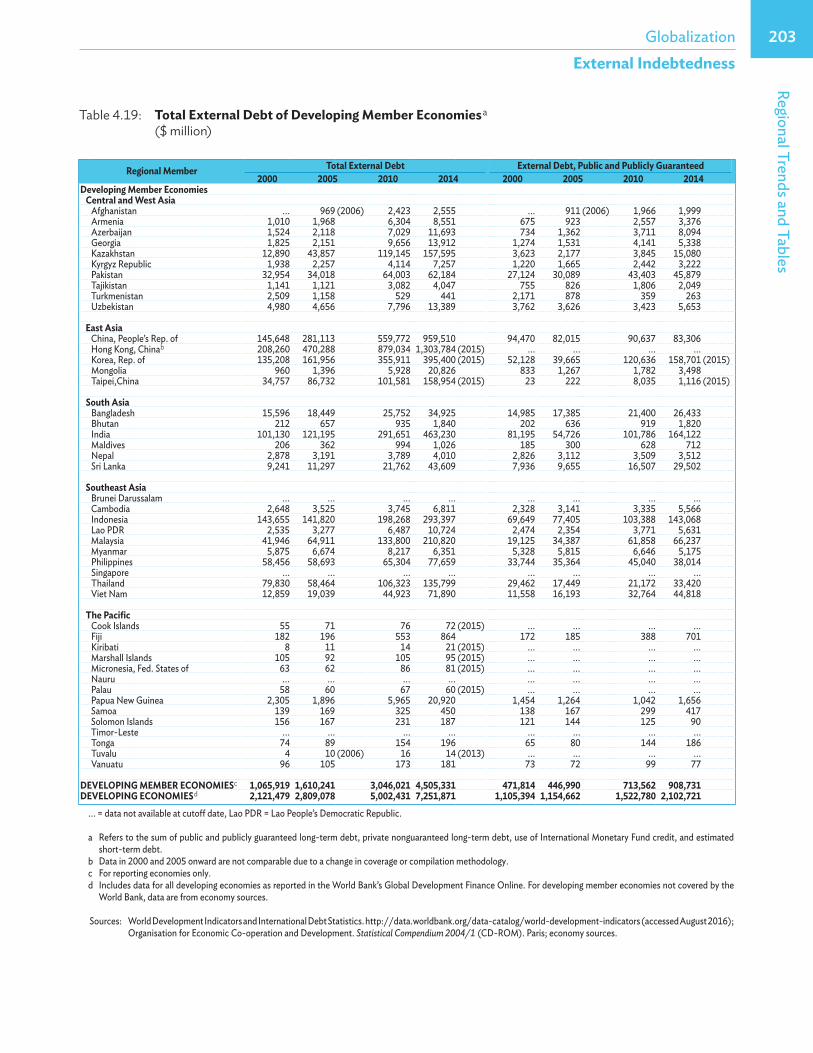
•• Total• external• debt• of• developing• member• economies• in• Asia• and• the• Pacific• increased• from•approximately•$1.1•trillion•in•2000•to•$4.5•trillion•based•on•latest•data.•
•• Total•international•tourist•arrivals•increased•by•more•than•150%•in•member•economies•in•Asia•and•the•Pacific•between•2000•and•2015.
Key Trends
Asia and the Pacific remains the largest foreign direct investment (FDI) recipient region in the world. Global•FDI•flows•increased•to•$1.76•trillion•in•2015,•representing•a•38%•annual•increase•according•to• the• latest• World• Investment• Report• published•by• the• United• Nations• Conference• on• Trade• and•Development•(UNCTAD).•This•is•the•highest•level•of•FDI•since•the•2008–2009•global•financial•crisis,•and•the•pick-up•in•cross-border•mergers•and•acquisitions•has• been• identified• as• the• principal• factor• driving•these•trends.•
Among• the• regions• in• the• world,• Asia• and• the•Pacific• has• the• highest• share• of• total• FDI• flows.•For• instance,• in• developing• Asia• alone,• FDI• inflows•surpassed• $0.5• trillion• in• 2015• (UNCTAD• 2016).•The• People’s• Republic• of• China• (PRC);• Hong• Kong,•China;•and•Singapore,• which•were• the• three• largest•recipients•of•FDI•inflows•in•the•region,•were•among•the• list• of• the• 10• economies• with• the• largest• FDI•inflows• around• the• world,• occupying• the• second,•third,•and•eighth•spots,•respectively•(Figure•4.1).•The•surging•levels•of•FDI•in•Hong•Kong,•China•were•due•to•increased•equity•investment,•which•resulted•in•part•from•the•major•corporate•restructuring•of•two•of•its•
largest• conglomerates• (UNCTAD• 2016).• They• were•closely•followed•by•India,•Australia,•and•Association•of•Southeast•Asian•Nations•(ASEAN)•member•states•(Figure• 4.2).• Sustained• gross• domestic• product•(GDP)•growth•in•ASEAN•is•reflected•in•and•fueled•by•relatively•high•levels•of•FDI,•much•of•it•coming•from•
Click here for figure data
179GlobalizationRegional Trends and Tables
179
PRC = People’s Republic of China. Source: Table 4.6.
0 50 100 150 200 250 300
Philippines
Thailand
Malaysia
Viet Nam
Indonesia
Australia
India
Singapore
Hong Kong, China
PRC
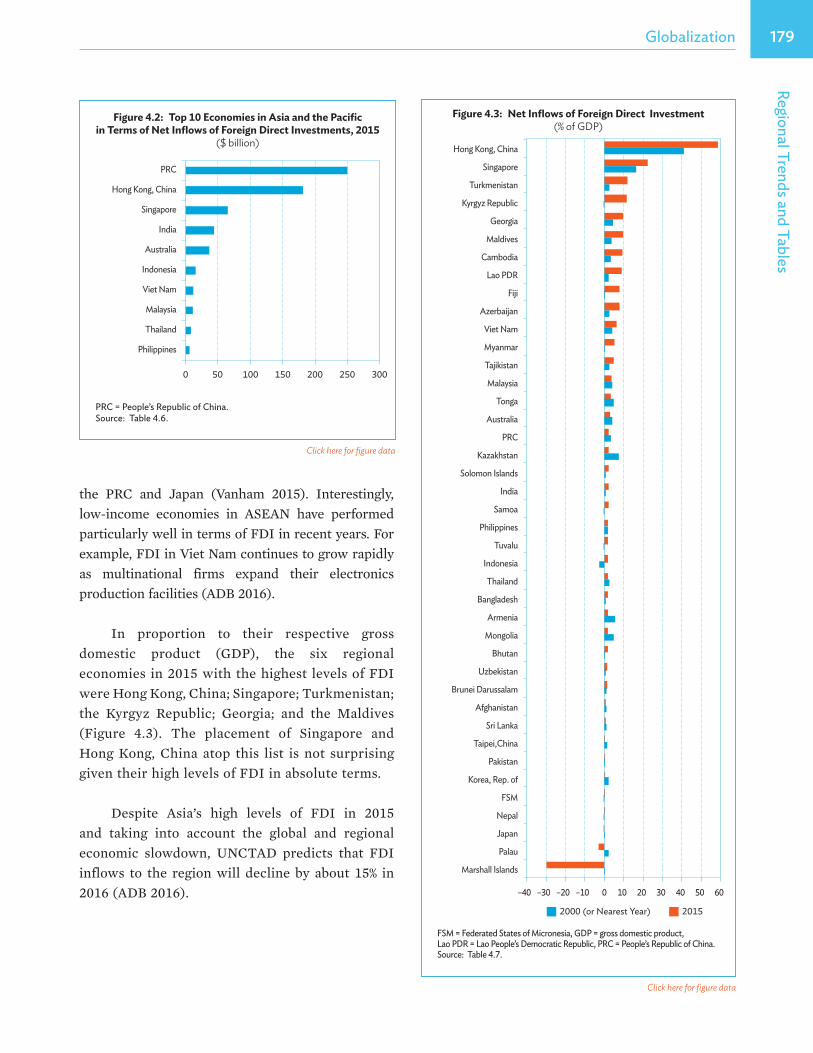
Figure 4.2: Top 10 Economies in Asia and the Pacific in Terms of Net Inflows of Foreign Direct Investments, 2015
($ billion)
FSM = Federated States of Micronesia, GDP = gross domestic product,Lao PDR = Lao People’s Democratic Republic, PRC = People’s Republic of China. Source: Table 4.7.
20152000 (or Nearest Year)
–40 –30 –20 –10 0 10 20 30 40 50 60
Marshall Islands
Palau
Japan
Nepal
FSM
Korea, Rep. of
Pakistan
Taipei,China
Sri Lanka
Afghanistan
Brunei Darussalam
Uzbekistan
Bhutan
Mongolia
Armenia
Bangladesh
Thailand
Indonesia
Tuvalu
Philippines
Samoa
India
Solomon Islands
Kazakhstan
PRC
Australia
Tonga
Malaysia
Tajikistan
Myanmar
Viet Nam
Azerbaijan
Fiji
Lao PDR
Cambodia
Maldives
Georgia
Kyrgyz Republic
Turkmenistan
Singapore
Hong Kong, China
Figure 4.3: Net Inflows of Foreign Direct Investment (% of GDP)
the• PRC• and• Japan• (Vanham• 2015).• Interestingly,•low-income• economies• in• ASEAN• have• performed•particularly•well•in•terms•of•FDI•in•recent•years.•For•example,•FDI•in•Viet•Nam•continues•to•grow•rapidly•as• multinational• firms• expand• their• electronics•production•facilities•(ADB•2016).
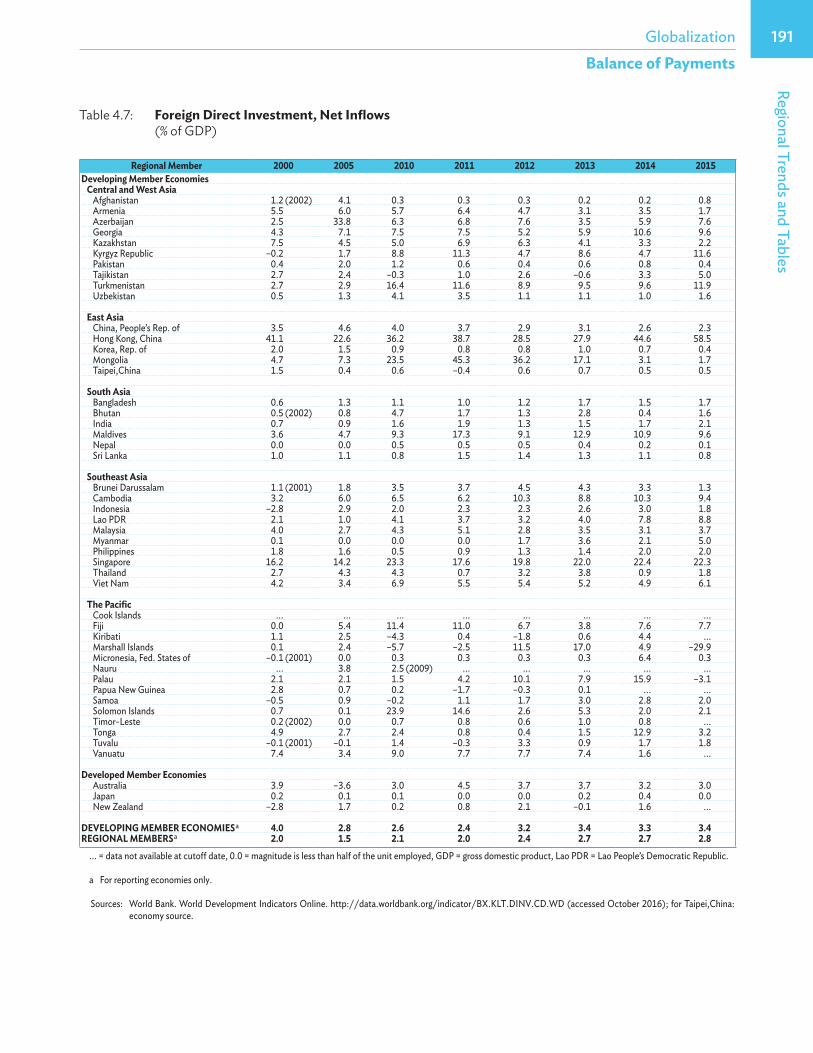
In• proportion• to• their• respective• gross•domestic• product• (GDP),• the• six• regional•economies•in•2015•with•the•highest•levels•of•FDI•were•Hong•Kong,•China;•Singapore;•Turkmenistan;•the• Kyrgyz• Republic;• Georgia;• and• the• Maldives•(Figure• 4.3).• The• placement• of• Singapore• and•Hong•Kong,•China•atop•this• list• is•not•surprising•given•their•high•levels•of•FDI•in•absolute•terms.•
Despite• Asia’s• high• levels• of• FDI• in• 2015•and• taking• into• account• the• global• and• regional•economic• slowdown,• UNCTAD• predicts• that• FDI•inflows•to• the•region•will•decline•by•about•15%• in•2016•(ADB•2016).
Click here for figure data
Click here for figure data
180 Key Indicators for Asia and the Pacific 2016180
PRC = People’s Republic of China. Sources: International Monetary Fund. May 2016. Direction of Trade Statistics (CD-ROM). Washington, DC.; Table 4.13.
Europe, 35.5
North and Central America, 18.8
Middle East, 5.1 South America, 2.8 Africa, 2.7
Rest of the World, 3.1
PRC, 38.4
Japan, 10.5
Korea, Rep. of, 9.0 Hong Kong, China, 6.3
Singapore, 5.9
Others, 30.0 Asia and the Pacific, 32.2
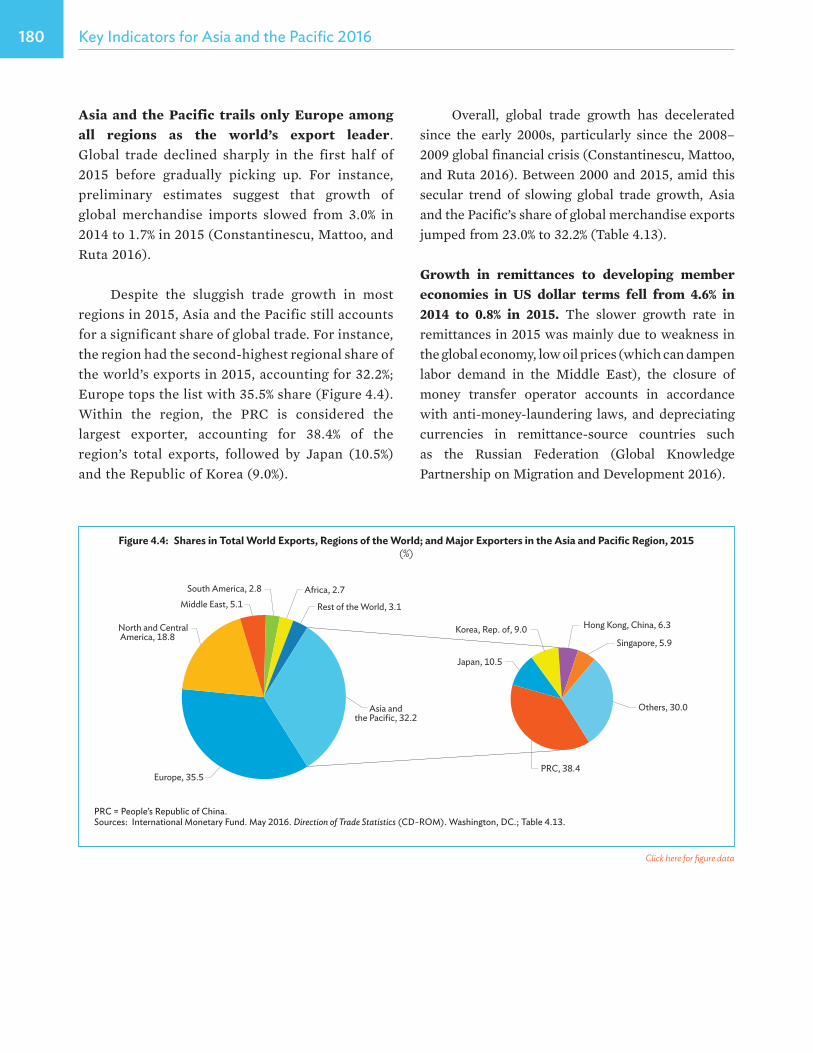
Figure 4.4: Shares in Total World Exports, Regions of the World; and Major Exporters in the Asia and Pacific Region, 2015 (%)
Asia and the Pacific trails only Europe among all regions as the world’s export leader.•Global• trade• declined• sharply• in• the• first• half• of•2015• before• gradually• picking• up.• For• instance,•preliminary• estimates• suggest• that• growth• of•global• merchandise• imports• slowed• from• 3.0%• in•2014•to•1.7%•in•2015•(Constantinescu,•Mattoo,•and•Ruta•2016).•
Despite• the• sluggish• trade• growth• in• most•regions•in•2015,•Asia•and•the•Pacific•still•accounts•for•a•significant•share•of•global•trade.•For•instance,•the•region•had•the•second-highest•regional•share•of•the•world’s•exports•in•2015,•accounting•for•32.2%;•Europe•tops•the•list•with•35.5%•share•(Figure 4.4).••Within• the• region,• the• PRC• is• considered• the•largest• exporter,• accounting• for• 38.4%• of• the•region’s• total• exports,• followed• by• Japan• (10.5%)•and•the•Republic•of•Korea•(9.0%).
Overall,• global• trade• growth• has• decelerated•since• the• early• 2000s,• particularly• since• the• 2008–2009•global•financial•crisis•(Constantinescu,•Mattoo,•and•Ruta•2016).•Between•2000•and•2015,•amid•this•secular• trend• of• slowing• global• trade• growth,• Asia•and•the•Pacific’s•share•of•global•merchandise•exports•jumped•from•23.0%•to•32.2%•(Table•4.13).
Growth in remittances to developing member economies in US dollar terms fell from 4.6% in 2014 to 0.8% in 2015. The• slower• growth• rate• in•remittances•in•2015•was•mainly•due•to•weakness•in•the•global•economy,•low•oil•prices•(which•can•dampen•labor• demand• in• the• Middle• East),• the• closure• of•money• transfer• operator• accounts• in• accordance•with•anti-money-laundering•laws,•and•depreciating•currencies• in• remittance-source• countries• such•as• the• Russian• Federation• (Global• Knowledge•Partnership•on•Migration•and•Development•2016).
Click here for figure data
181GlobalizationRegional Trends and Tables
181
FSM = Federated States of Micronesia, Lao PDR = Lao People’s Democratic Republic, PRC = People’s Republic of China. Source: Table 4.4.
20152000 (or Nearest Year)
0 10,000 20,000 30,000 40,000 50,000 60,000 70,000
Palau Maldives
Tuvalu Papua New Guinea
Kiribati Turkmenistan
Solomon Islands Bhutan
FSM Marshall Islands
Vanuatu Lao PDR
Timor-Leste Tonga
Samoa Kazakhstan
Fiji Mongolia
Afghanistan Hong Kong, China
Cambodia New Zealand Taipei,China
Azerbaijan Georgia
Armenia Malaysia
Kyrgyz Republic Australia
Tajikistan Uzbekistan
Myanmar Japan
Thailand Korea, Rep. of
Nepal Sri Lanka
Indonesia Viet Nam
Bangladesh Pakistan
Philippines PRC India
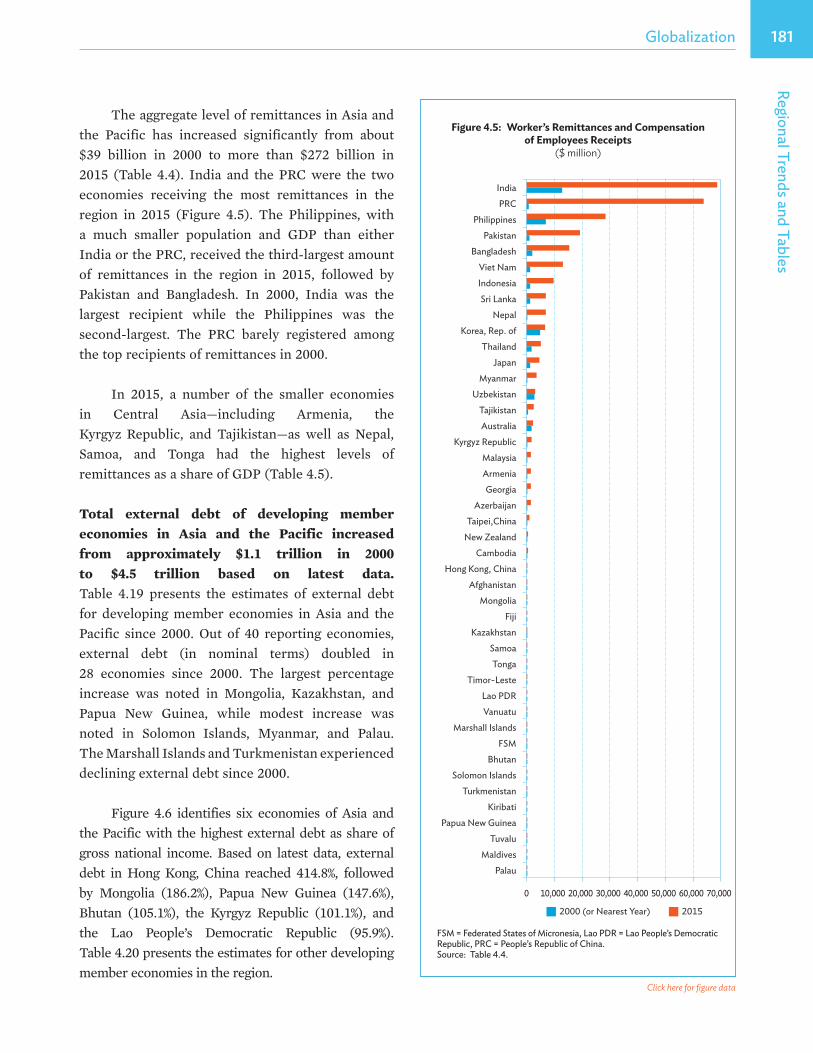
Figure 4.5: Worker’s Remittances and Compensation of Employees Receipts
($ million)
The•aggregate•level•of•remittances•in•Asia•and•the• Pacific• has• increased• significantly• from• about•$39• billion• in• 2000• to• more• than• $272• billion• in•2015• (Table• 4.4).• India• and• the• PRC• were• the• two•economies• receiving• the• most• remittances• in• the•region• in• 2015• (Figure• 4.5).• The• Philippines,• with•a• much• smaller• population• and• GDP• than• either•India•or•the•PRC,•received•the•third-largest•amount•of• remittances• in• the• region• in• 2015,• followed• by•Pakistan• and• Bangladesh.• In• 2000,• India• was• the•largest• recipient• while• the• Philippines• was• the•second-largest.• The• PRC• barely• registered• among•the•top•recipients•of•remittances•in•2000.
In• 2015,• a• number• of• the• smaller• economies•in• Central• Asia—including• Armenia,• the•Kyrgyz Republic,• and• Tajikistan—as• well• as• Nepal,•Samoa,• and• Tonga• had• the• highest• levels• of•remittances•as•a•share•of•GDP•(Table•4.5).
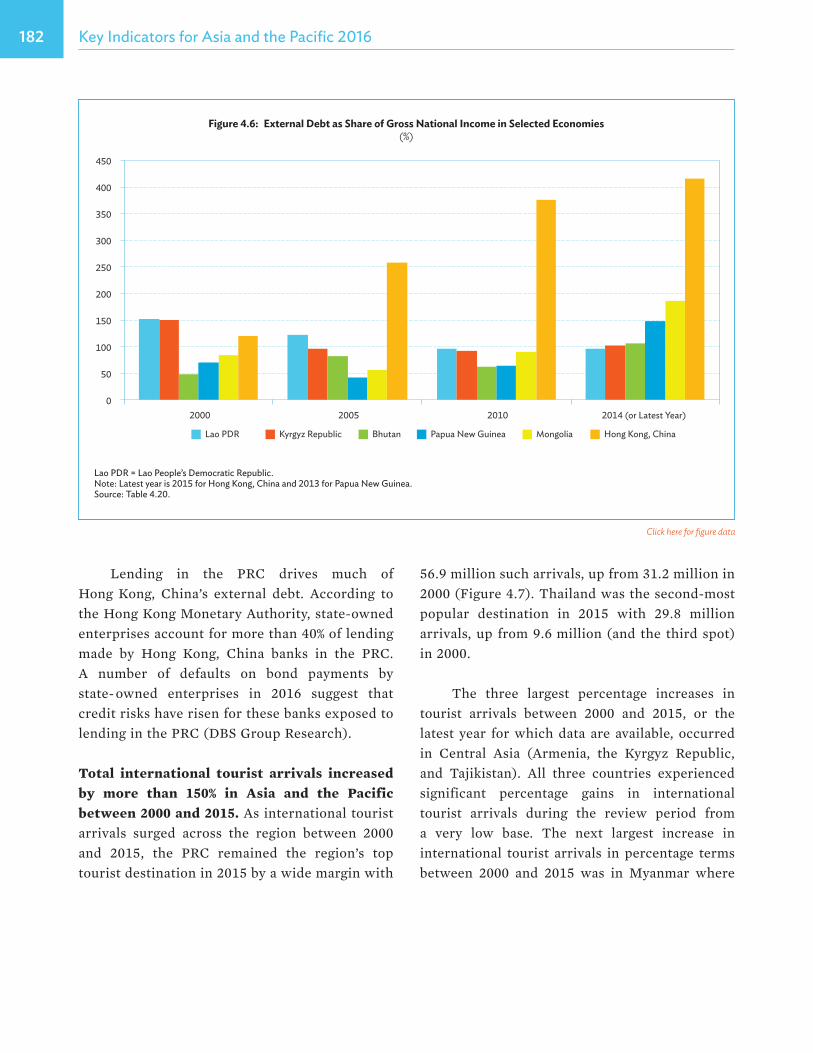
Total external debt of developing member economies in Asia and the Pacific increased from approximately $1.1 trillion in 2000 to $4.5 trillion based on latest data.• Table• 4.19• presents• the• estimates• of• external• debt•for• developing• member• economies• in• Asia• and• the•Pacific• since• 2000.• Out• of• 40• reporting• economies,•external• debt• (in• nominal• terms)• doubled• in• 28• economies• since• 2000.• The• largest• percentage•increase• was• noted• in• Mongolia,• Kazakhstan,• and•Papua• New• Guinea,• while• modest• increase• was•noted• in• Solomon Islands,• Myanmar,• and• Palau.• The•Marshall•Islands•and•Turkmenistan•experienced•declining•external•debt•since•2000.
Figure• 4.6• identifies• six• economies• of• Asia• and•the•Pacific•with•the•highest•external•debt•as•share•of•gross• national• income.• Based• on• latest• data,• external•debt• in• Hong• Kong,• China• reached• 414.8%,• followed•by• Mongolia• (186.2%),• Papua• New• Guinea• (147.6%),•Bhutan• (105.1%),• the• Kyrgyz• Republic• (101.1%),• and• the• Lao• People’s• Democratic• Republic• (95.9%).• Table•4.20•presents•the•estimates•for•other•developing•member•economies•in•the•region.•
Click here for figure data
182 Key Indicators for Asia and the Pacific 2016182
Lao PDR = Lao People’s Democratic Republic.Note: Latest year is 2015 for Hong Kong, China and 2013 for Papua New Guinea.Source: Table 4.20.
0
50
100
150
200
250
300
350
400
450
2000 2005 2010 2014 (or Latest Year)
Lao PDR Kyrgyz Republic Bhutan Papua New Guinea Mongolia Hong Kong, China
Figure 4.6: External Debt as Share of Gross National Income in Selected Economies (%)
Lending• in• the• PRC• drives• much• of•Hong Kong,• China’s• external• debt.• According• to•the•Hong•Kong•Monetary•Authority,•state-owned•enterprises•account•for•more•than•40%•of•lending•made• by• Hong• Kong,• China• banks• in• the• PRC.• A• number• of• defaults• on• bond• payments• by•state- owned• enterprises• in• 2016• suggest• that•credit•risks•have•risen•for•these•banks•exposed•to•lending•in•the•PRC•(DBS•Group•Research).•
Total international tourist arrivals increased by more than 150% in Asia and the Pacific between 2000 and 2015.•As•international•tourist•arrivals• surged• across• the• region• between• 2000•and• 2015,• the• PRC• remained• the• region’s• top•tourist•destination•in•2015•by•a•wide•margin•with•
56.9•million•such•arrivals,•up•from•31.2•million•in•2000•(Figure•4.7).•Thailand•was•the•second-most•popular• destination• in• 2015• with• 29.8• million•arrivals,•up•from•9.6 million•(and•the•third•spot)•in•2000.
The• three• largest• percentage• increases• in•tourist• arrivals• between• 2000• and• 2015,• or• the•latest•year•for•which•data•are•available,•occurred•in• Central• Asia• (Armenia,• the• Kyrgyz• Republic,•and• Tajikistan).• All• three• countries• experienced•significant• percentage• gains• in• international•tourist• arrivals• during• the• review• period• from•a• very• low• base.• The• next• largest• increase• in•international• tourist• arrivals• in• percentage• terms•between• 2000• and• 2015• was• in• Myanmar• where•
Click here for figure data
183GlobalizationRegional Trends and Tables
183
a•series•of•political,•economic,•and•administrative•reforms•launched•by•the•government•in•2011•have•resulted•in•expanded•tourism•(ADB•2016).
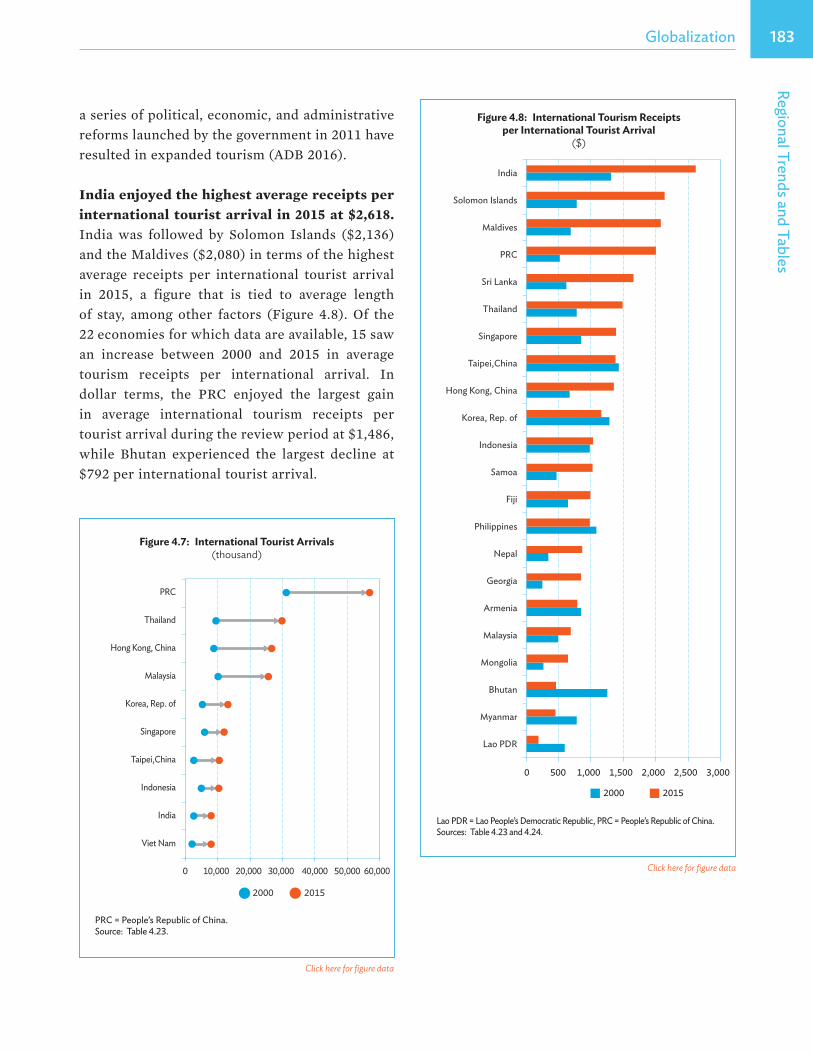
India enjoyed the highest average receipts per international tourist arrival in 2015 at $2,618.•India• was• followed• by• Solomon• Islands• ($2,136)•and•the•Maldives•($2,080)•in•terms•of•the•highest•average• receipts• per• international• tourist• arrival•in• 2015,• a• figure• that• is• tied• to• average• length•of• stay,• among• other• factors• (Figure• 4.8).• Of• the•22 economies•for•which•data•are•available,•15•saw•an• increase• between• 2000• and• 2015• in• average•tourism• receipts• per• international• arrival.• In•dollar• terms,• the• PRC• enjoyed• the• largest• gain•in• average• international• tourism• receipts• per•tourist•arrival•during•the•review•period•at•$1,486,•while• Bhutan• experienced• the• largest• decline• at•$792 per•international•tourist•arrival.••
PRC = People’s Republic of China.Source: Table 4.23.
0 10,000 20,000 30,000 40,000 50,000 60,000
PRC
Thailand
Hong Kong, China
Malaysia
Korea, Rep. of
Singapore
Taipei,China
Indonesia
India
Viet Nam
2000 2015
Figure 4.7: International Tourist Arrivals(thousand)
Lao PDR = Lao People’s Democratic Republic, PRC = People’s Republic of China.Sources: Table 4.23 and 4.24.
20152000
0 500 1,000 1,500 2,000 2,500 3,000
Lao PDR
Myanmar
Bhutan
Mongolia
Malaysia
Armenia
Georgia
Nepal
Philippines
Fiji
Samoa
Indonesia
Korea, Rep. of
Hong Kong, China
Taipei,China
Singapore
Thailand
Sri Lanka
PRC
Maldives
Solomon Islands
India
Figure 4.8: International Tourism Receipts per International Tourist Arrival
($)
Click here for figure data
Click here for figure data
184 Key Indicators for Asia and the Pacific 2016184
Data Issues and Comparability
Most•of•the•international•transactions•in•this•section•are• taken• from• balance-of-payments• statistics.•Countries•follow•the•International•Monetary•Fund’s•guidelines•when•compiling•these•statistics•and•meet•regularly•to•discuss•methodology,•but•many•countries•have• difficulty• accurately• recording• nonofficial•transactions• such• as• migrant• workers’• remittances•and•private•capital•flows,•which•is•one•of•the•reasons•that•the•Balance•of•Payments•Manual,•Fifth•Edition•(BPM5)• • was• updated• to• the• Balance• of• Payments•and• International• Investment• Position• Manual,•Sixth•Edition•(BPM6).•Analysis•for•this•section•was•based•on•the•balance-of-payments•data•as•reported•by• the• economies.• A• majority• of• countries• use• the•sixth•edition•and•a•few•continue•to•use•the•fifth•or•fourth•edition.•This•affects•the•comparability•of•data•across•economies.•
International• trade• statistics• are• closely•monitored• by• the• World• Trade• Organization• and•other• international• agencies.• Common• definitions•are• used• by• all• countries,• and• the• larger• Asian•economies• use• standard• forms• and• procedures• for•data•processing.
International•tourist•arrivals•and•receipts•data•come•from•the•World•Tourism•Organization,•which•serves• as• a• global• forum• for• tourism• policy• issues•and•a•practical•source•of•information•on•this•topic.
References
Asian• Development• Bank• (ADB).• 2015.• Asian Development Outlook 2015.•Manila.•
————.• 2016.• Asian Development Outlook 2016.•Manila.•
DBS• Group• Research.• 2016.• Hong Kong: Cautious Outlook.•Singapore.
Global• Knowledge• Partnership• on• Migration•and• Development.• 2016.• Migration• and•Remittances:• Recent• Developments• and•Outlook.•Migration and Development Brief•No.•26.•Washington,•DC:•World•Bank.•
United• Nations• Conference• on• Trade• and•Development• (UNCTAD).• 2016.• World Investment Report 2016.•Geneva.•
P.•Vanham.•2015.•14•Charts•on•the•Asian•Economy.•16• April.• https://www.weforum.org/agenda/2015/04/14-charts-on-the-asian-economy/.
185GlobalizationRegional Trends and Tables
Balance of Payments
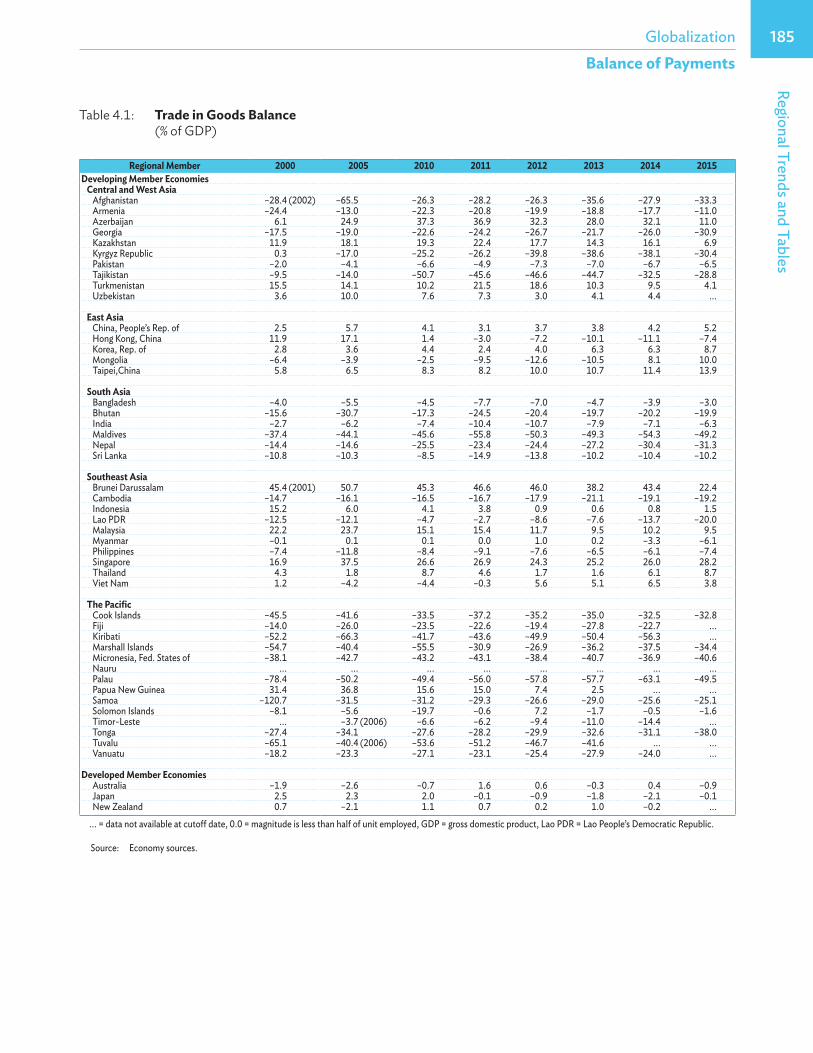
Table 4.1: Trade in Goods Balance (% of GDP)
Regional Member 2000 2005 2010 2011 2012 2013 2014 2015Developing Member Economies Central and West Asia
Afghanistan –28.4 (2002) –65.5 –26.3 –28.2 –26.3 –35.6 –27.9 –33.3Armenia –24.4 –13.0 –22.3 –20.8 –19.9 –18.8 –17.7 –11.0Azerbaijan 6.1 24.9 37.3 36.9 32.3 28.0 32.1 11.0Georgia –17.5 –19.0 –22.6 –24.2 –26.7 –21.7 –26.0 –30.9Kazakhstan 11.9 18.1 19.3 22.4 17.7 14.3 16.1 6.9Kyrgyz Republic 0.3 –17.0 –25.2 –26.2 –39.8 –38.6 –38.1 –30.4Pakistan –2.0 –4.1 –6.6 –4.9 –7.3 –7.0 –6.7 –6.5Tajikistan –9.5 –14.0 –50.7 –45.6 –46.6 –44.7 –32.5 –28.8Turkmenistan 15.5 14.1 10.2 21.5 18.6 10.3 9.5 4.1Uzbekistan 3.6 10.0 7.6 7.3 3.0 4.1 4.4 ...
East AsiaChina, People’s Rep. of 2.5 5.7 4.1 3.1 3.7 3.8 4.2 5.2Hong Kong, China 11.9 17.1 1.4 –3.0 –7.2 –10.1 –11.1 –7.4Korea, Rep. of 2.8 3.6 4.4 2.4 4.0 6.3 6.3 8.7Mongolia –6.4 –3.9 –2.5 –9.5 –12.6 –10.5 8.1 10.0Taipei,China 5.8 6.5 8.3 8.2 10.0 10.7 11.4 13.9
South AsiaBangladesh –4.0 –5.5 –4.5 –7.7 –7.0 –4.7 –3.9 –3.0Bhutan –15.6 –30.7 –17.3 –24.5 –20.4 –19.7 –20.2 –19.9India –2.7 –6.2 –7.4 –10.4 –10.7 –7.9 –7.1 –6.3Maldives –37.4 –44.1 –45.6 –55.8 –50.3 –49.3 –54.3 –49.2Nepal –14.4 –14.6 –25.5 –23.4 –24.4 –27.2 –30.4 –31.3Sri Lanka –10.8 –10.3 –8.5 –14.9 –13.8 –10.2 –10.4 –10.2
Southeast AsiaBrunei Darussalam 45.4 (2001) 50.7 45.3 46.6 46.0 38.2 43.4 22.4Cambodia –14.7 –16.1 –16.5 –16.7 –17.9 –21.1 –19.1 –19.2Indonesia 15.2 6.0 4.1 3.8 0.9 0.6 0.8 1.5Lao PDR –12.5 –12.1 –4.7 –2.7 –8.6 –7.6 –13.7 –20.0Malaysia 22.2 23.7 15.1 15.4 11.7 9.5 10.2 9.5Myanmar –0.1 0.1 0.1 0.0 1.0 0.2 –3.3 –6.1Philippines –7.4 –11.8 –8.4 –9.1 –7.6 –6.5 –6.1 –7.4Singapore 16.9 37.5 26.6 26.9 24.3 25.2 26.0 28.2Thailand 4.3 1.8 8.7 4.6 1.7 1.6 6.1 8.7Viet Nam 1.2 –4.2 –4.4 –0.3 5.6 5.1 6.5 3.8
The PacificCook Islands –45.5 –41.6 –33.5 –37.2 –35.2 –35.0 –32.5 –32.8Fiji –14.0 –26.0 –23.5 –22.6 –19.4 –27.8 –22.7 ...Kiribati –52.2 –66.3 –41.7 –43.6 –49.9 –50.4 –56.3 ...Marshall Islands –54.7 –40.4 –55.5 –30.9 –26.9 –36.2 –37.5 –34.4Micronesia, Fed. States of –38.1 –42.7 –43.2 –43.1 –38.4 –40.7 –36.9 –40.6Nauru ... ... ... ... ... ... ... ...Palau –78.4 –50.2 –49.4 –56.0 –57.8 –57.7 –63.1 –49.5Papua New Guinea 31.4 36.8 15.6 15.0 7.4 2.5 ... ...Samoa –120.7 –31.5 –31.2 –29.3 –26.6 –29.0 –25.6 –25.1Solomon Islands –8.1 –5.6 –19.7 –0.6 7.2 –1.7 –0.5 –1.6Timor-Leste ... –3.7 (2006) –6.6 –6.2 –9.4 –11.0 –14.4 ...Tonga –27.4 –34.1 –27.6 –28.2 –29.9 –32.6 –31.1 –38.0Tuvalu –65.1 –40.4 (2006) –53.6 –51.2 –46.7 –41.6 ... ...Vanuatu –18.2 –23.3 –27.1 –23.1 –25.4 –27.9 –24.0 ...
Developed Member EconomiesAustralia –1.9 –2.6 –0.7 1.6 0.6 –0.3 0.4 –0.9Japan 2.5 2.3 2.0 –0.1 –0.9 –1.8 –2.1 –0.1New Zealand 0.7 –2.1 1.1 0.7 0.2 1.0 –0.2 ...
... = data not available at cutoff date, 0.0 = magnitude is less than half of unit employed, GDP = gross domestic product, Lao PDR = Lao People’s Democratic Republic.
Source: Economy sources.
186 Key Indicators for Asia and the Pacific 2016Balance of Payments
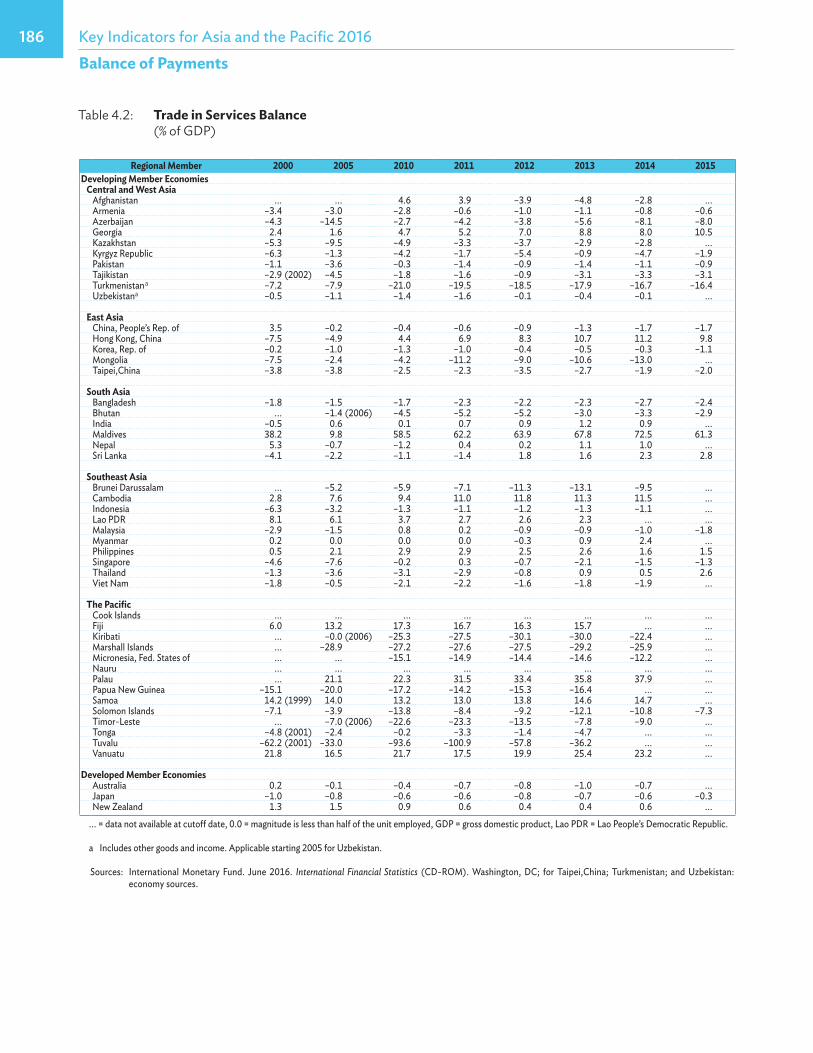
Table 4.2: Trade in Services Balance (% of GDP)
Regional Member 2000 2005 2010 2011 2012 2013 2014 2015Developing Member Economies Central and West Asia
Afghanistan ... ... 4.6 3.9 –3.9 –4.8 –2.8 ...Armenia –3.4 –3.0 –2.8 –0.6 –1.0 –1.1 –0.8 –0.6Azerbaijan –4.3 –14.5 –2.7 –4.2 –3.8 –5.6 –8.1 –8.0Georgia 2.4 1.6 4.7 5.2 7.0 8.8 8.0 10.5Kazakhstan –5.3 –9.5 –4.9 –3.3 –3.7 –2.9 –2.8 ...Kyrgyz Republic –6.3 –1.3 –4.2 –1.7 –5.4 –0.9 –4.7 –1.9Pakistan –1.1 –3.6 –0.3 –1.4 –0.9 –1.4 –1.1 –0.9Tajikistan –2.9 (2002) –4.5 –1.8 –1.6 –0.9 –3.1 –3.3 –3.1Turkmenistan a –7.2 –7.9 –21.0 –19.5 –18.5 –17.9 –16.7 –16.4Uzbekistana –0.5 –1.1 –1.4 –1.6 –0.1 –0.4 –0.1 ...
East AsiaChina, People’s Rep. of 3.5 –0.2 –0.4 –0.6 –0.9 –1.3 –1.7 –1.7Hong Kong, China –7.5 –4.9 4.4 6.9 8.3 10.7 11.2 9.8Korea, Rep. of –0.2 –1.0 –1.3 –1.0 –0.4 –0.5 –0.3 –1.1Mongolia –7.5 –2.4 –4.2 –11.2 –9.0 –10.6 –13.0 ...Taipei,China –3.8 –3.8 –2.5 –2.3 –3.5 –2.7 –1.9 –2.0
South AsiaBangladesh –1.8 –1.5 –1.7 –2.3 –2.2 –2.3 –2.7 –2.4Bhutan ... –1.4 (2006) –4.5 –5.2 –5.2 –3.0 –3.3 –2.9India –0.5 0.6 0.1 0.7 0.9 1.2 0.9 ...Maldives 38.2 9.8 58.5 62.2 63.9 67.8 72.5 61.3Nepal 5.3 –0.7 –1.2 0.4 0.2 1.1 1.0 ...Sri Lanka –4.1 –2.2 –1.1 –1.4 1.8 1.6 2.3 2.8
Southeast AsiaBrunei Darussalam ... –5.2 –5.9 –7.1 –11.3 –13.1 –9.5 ...Cambodia 2.8 7.6 9.4 11.0 11.8 11.3 11.5 ...Indonesia –6.3 –3.2 –1.3 –1.1 –1.2 –1.3 –1.1 ...Lao PDR 8.1 6.1 3.7 2.7 2.6 2.3 ... ...Malaysia –2.9 –1.5 0.8 0.2 –0.9 –0.9 –1.0 –1.8Myanmar 0.2 0.0 0.0 0.0 –0.3 0.9 2.4 ...Philippines 0.5 2.1 2.9 2.9 2.5 2.6 1.6 1.5Singapore –4.6 –7.6 –0.2 0.3 –0.7 –2.1 –1.5 –1.3Thailand –1.3 –3.6 –3.1 –2.9 –0.8 0.9 0.5 2.6Viet Nam –1.8 –0.5 –2.1 –2.2 –1.6 –1.8 –1.9 ...
The PacificCook Islands ... ... ... ... ... ... ... ...Fiji 6.0 13.2 17.3 16.7 16.3 15.7 ... ...Kiribati ... –0.0 (2006) –25.3 –27.5 –30.1 –30.0 –22.4 ...Marshall Islands ... –28.9 –27.2 –27.6 –27.5 –29.2 –25.9 ...Micronesia, Fed. States of ... ... –15.1 –14.9 –14.4 –14.6 –12.2 ...Nauru ... ... ... ... ... ... ... ...Palau ... 21.1 22.3 31.5 33.4 35.8 37.9 ...Papua New Guinea –15.1 –20.0 –17.2 –14.2 –15.3 –16.4 ... ...Samoa 14.2 (1999) 14.0 13.2 13.0 13.8 14.6 14.7 ...Solomon Islands –7.1 –3.9 –13.8 –8.4 –9.2 –12.1 –10.8 –7.3Timor-Leste ... –7.0 (2006) –22.6 –23.3 –13.5 –7.8 –9.0 ...Tonga –4.8 (2001) –2.4 –0.2 –3.3 –1.4 –4.7 ... ...Tuvalu –62.2 (2001) –33.0 –93.6 –100.9 –57.8 –36.2 ... ...Vanuatu 21.8 16.5 21.7 17.5 19.9 25.4 23.2 ...
Developed Member EconomiesAustralia 0.2 –0.1 –0.4 –0.7 –0.8 –1.0 –0.7 ...Japan –1.0 –0.8 –0.6 –0.6 –0.8 –0.7 –0.6 –0.3New Zealand 1.3 1.5 0.9 0.6 0.4 0.4 0.6 ...
... = data not available at cutoff date, 0.0 = magnitude is less than half of the unit employed, GDP = gross domestic product, Lao PDR = Lao People’s Democratic Republic.
a Includes other goods and income. Applicable starting 2005 for Uzbekistan.
Sources: International Monetary Fund. June 2016. International Financial Statistics (CD-ROM). Washington, DC; for Taipei,China; Turkmenistan; and Uzbekistan: economy sources.

187GlobalizationRegional Trends and Tables
Balance of Payments
Table 4.3: Current Account Balance (% of GDP)
Regional Member 2000 2005 2010 2011 2012 2013 2014 2015Developing Member Economies Central and West Asia
Afghanistan –3.5 (2002) –2.7 –10.1 –14.9 –20.6 –26.7 –19.0 –25.1Armenia –15.8 –2.5 –13.6 –10.4 –10.0 –7.6 –7.3 –2.7Azerbaijan –3.2 1.3 28.4 26.0 21.7 16.7 32.1 –0.4Georgia –5.8 –10.8 –10.3 –12.8 –11.7 –5.8 –10.6 –12.0Kazakhstan 2.1 –1.8 0.9 5.1 0.5 0.5 2.8 –3.2Kyrgyz Republic –5.5 –1.4 –6.6 –8.1 –15.8 –14.1 –17.3 –11.3Pakistan –0.3 –1.4 –2.3 0.1 –2.2 –1.1 –1.3 –1.0Tajikistan –7.2 –0.8 –15.9 –2.6 –3.2 –0.7 –2.8 –6.0Turkmenistan 8.3 6.2 –10.8 2.0 0.0 –7.6 –7.1 –12.3Uzbekistan 1.6 13.5 6.1 5.7 2.7 3.4 4.1 ...
East AsiaChina, People’s Rep. of 1.7 5.8 3.9 1.8 2.5 1.6 2.7 3.0Hong Kong, China 4.4 11.9 7.0 5.6 1.6 1.5 1.3 3.1Korea, Rep. of 1.9 1.4 2.6 1.6 4.2 6.2 6.0 7.7Mongolia –6.1 3.5 –12.3 –26.5 –27.4 –25.4 –11.5 –4.0Taipei,China 2.5 4.0 8.3 7.8 8.9 10.0 11.7 14.5
South AsiaBangladesh –0.9 –1.0 3.7 –1.3 –0.3 1.6 0.8 0.8Bhutan –9.4 –29.0 –20.5 –27.6 –20.1 –24.5 –24.8 –27.6India –0.6 –1.2 –2.8 –4.2 –4.8 –1.7 –1.3 –1.1Maldives –8.2 –24.4 –15.3 –15.6 –7.4 –4.6 –3.9 –8.8Nepal –2.2 2.0 –2.3 –0.9 4.8 3.3 4.5 5.0Sri Lanka –6.4 –2.7 –1.9 –7.1 –5.8 –3.4 –2.5 –2.4
Southeast AsiaBrunei Darussalam 51.5 (2001) 47.3 36.5 34.8 29.8 20.9 30.6 15.9Cambodia –2.7 –3.6 –6.0 –6.0 –8.2 –13.0 –9.8 –9.7Indonesia 4.8 0.1 0.7 0.2 –2.7 –3.2 –3.1 –2.0Lao PDR –0.3 –7.1 0.4 2.0 –4.5 –4.1 –10.0 –18.4Malaysia 9.0 14.4 10.1 10.9 5.2 3.5 4.4 3.0Myanmar –0.1 0.0 0.0 0.0 –1.5 –0.8 –2.1 –6.2Philippines –2.7 1.9 3.6 2.5 2.8 4.2 3.8 2.9Singapore 10.8 22.1 23.8 22.8 18.1 17.9 17.5 19.8Thailand 7.4 –4.0 2.9 2.4 –0.4 –1.2 3.8 8.1Viet Nam 4.2 –1.0 –3.7 0.2 5.9 4.5 4.9 0.5
The PacificCook Islands ... ... ... ... ... ... ... ...Fiji –1.6 –11.3 –4.7 –5.1 –1.3 –9.8 –7.5 ...Kiribati –3.2 –34.1 –2.2 –13.4 –4.5 9.3 24.4 ...Marshall Islands –15.1 5.8 –21.3 1.2 –3.2 –12.0 –3.4 14.8Micronesia, Fed. States of –13.3 –9.0 –15.4 –18.8 –13.4 –10.1 1.2 8.6Nauru ... ... ... ... ... ... ... ...Palau –44.1 –18.9 –6.7 –9.2 –8.5 –9.3 –11.8 –0.5Papua New Guinea 10.1 13.3 –4.5 –1.0 –10.8 –16.4 ... ...Samoa –3.3 –8.5 –5.4 –5.5 0.1 –4.3 –3.9 –2.5Solomon Islands –12.9 –1.9 –20.8 –2.4 2.9 –3.8 –4.8 –3.5Timor-Leste ... 19.3 (2006) 39.3 39.4 40.2 43.6 26.2 ...Tonga –5.2 –9.4 –7.4 –9.3 –6.9 –8.7 –5.0 –9.0Tuvalu 54.7 –1.6 (2006) –3.7 –26.5 –7.8 –2.8 ... ...Vanuatu –5.0 –3.5 –5.8 –7.4 –8.8 –0.5 2.2 ...
Developed Member EconomiesAustralia –4.9 –6.5 –5.0 –3.1 –3.3 –3.9 –3.3 –3.7Japan 2.8 3.7 4.0 2.2 1.0 0.9 0.8 3.3New Zealand –1.0 –5.4 –2.0 –2.5 –3.0 –2.1 –2.7 ...
... = data not available at cutoff date, 0.0 = magnitude is less than half of the unit employed, GDP = gross domestic product, Lao PDR = Lao People’s Democratic Republic.
Source: Economy sources.
188 Key Indicators for Asia and the Pacific 2016Balance of Payments
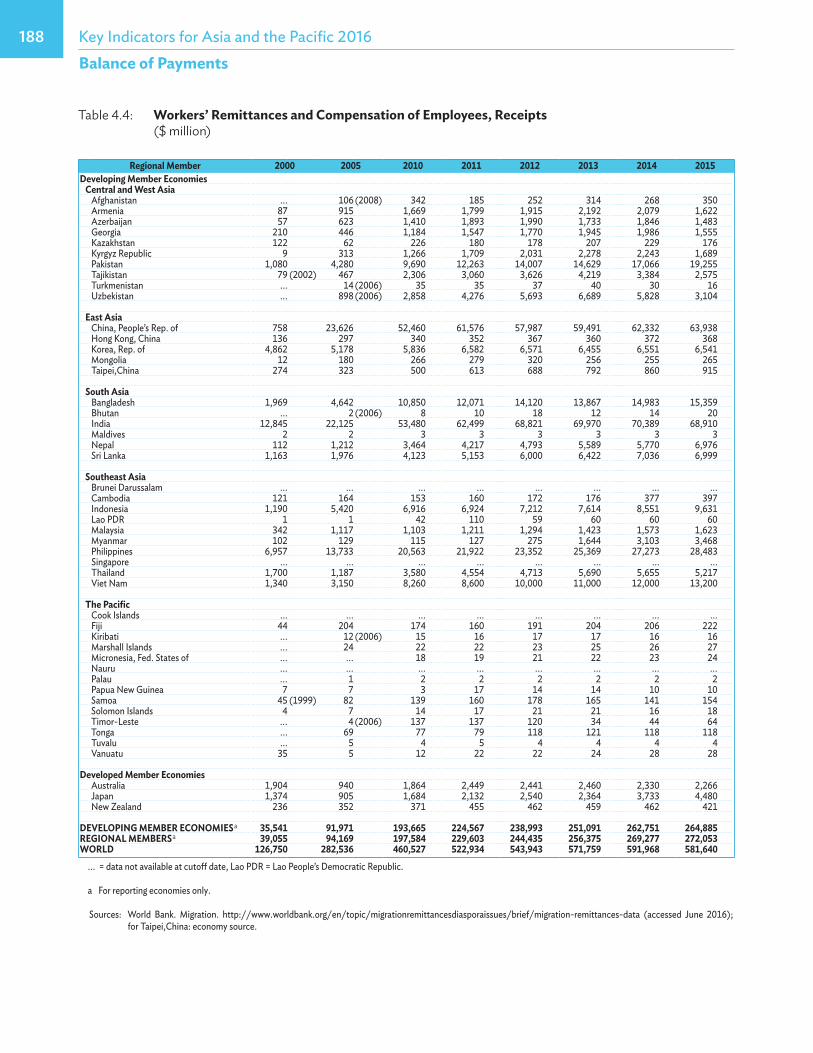
Table 4.4: Workers’ Remittances and Compensation of Employees, Receipts ($ million)
Regional Member 2000 2005 2010 2011 2012 2013 2014 2015Developing Member Economies Central and West Asia
Afghanistan ... 106 (2008) 342 185 252 314 268 350Armenia 87 915 1,669 1,799 1,915 2,192 2,079 1,622Azerbaijan 57 623 1,410 1,893 1,990 1,733 1,846 1,483Georgia 210 446 1,184 1,547 1,770 1,945 1,986 1,555Kazakhstan 122 62 226 180 178 207 229 176Kyrgyz Republic 9 313 1,266 1,709 2,031 2,278 2,243 1,689Pakistan 1,080 4,280 9,690 12,263 14,007 14,629 17,066 19,255Tajikistan 79 (2002) 467 2,306 3,060 3,626 4,219 3,384 2,575Turkmenistan ... 14 (2006) 35 35 37 40 30 16Uzbekistan ... 898 (2006) 2,858 4,276 5,693 6,689 5,828 3,104
East AsiaChina, People’s Rep. of 758 23,626 52,460 61,576 57,987 59,491 62,332 63,938Hong Kong, China 136 297 340 352 367 360 372 368Korea, Rep. of 4,862 5,178 5,836 6,582 6,571 6,455 6,551 6,541Mongolia 12 180 266 279 320 256 255 265Taipei,China 274 323 500 613 688 792 860 915
South AsiaBangladesh 1,969 4,642 10,850 12,071 14,120 13,867 14,983 15,359Bhutan ... 2 (2006) 8 10 18 12 14 20India 12,845 22,125 53,480 62,499 68,821 69,970 70,389 68,910Maldives 2 2 3 3 3 3 3 3Nepal 112 1,212 3,464 4,217 4,793 5,589 5,770 6,976Sri Lanka 1,163 1,976 4,123 5,153 6,000 6,422 7,036 6,999
Southeast AsiaBrunei Darussalam ... ... ... ... ... ... ... ...Cambodia 121 164 153 160 172 176 377 397Indonesia 1,190 5,420 6,916 6,924 7,212 7,614 8,551 9,631Lao PDR 1 1 42 110 59 60 60 60Malaysia 342 1,117 1,103 1,211 1,294 1,423 1,573 1,623Myanmar 102 129 115 127 275 1,644 3,103 3,468Philippines 6,957 13,733 20,563 21,922 23,352 25,369 27,273 28,483Singapore ... ... ... ... ... ... ... ...Thailand 1,700 1,187 3,580 4,554 4,713 5,690 5,655 5,217Viet Nam 1,340 3,150 8,260 8,600 10,000 11,000 12,000 13,200
The PacificCook Islands ... ... ... ... ... ... ... ...Fiji 44 204 174 160 191 204 206 222Kiribati ... 12 (2006) 15 16 17 17 16 16Marshall Islands ... 24 22 22 23 25 26 27Micronesia, Fed. States of ... ... 18 19 21 22 23 24Nauru ... ... ... ... ... ... ... ...Palau ... 1 2 2 2 2 2 2Papua New Guinea 7 7 3 17 14 14 10 10Samoa 45 (1999) 82 139 160 178 165 141 154Solomon Islands 4 7 14 17 21 21 16 18Timor-Leste ... 4 (2006) 137 137 120 34 44 64Tonga ... 69 77 79 118 121 118 118Tuvalu ... 5 4 5 4 4 4 4Vanuatu 35 5 12 22 22 24 28 28
Developed Member EconomiesAustralia 1,904 940 1,864 2,449 2,441 2,460 2,330 2,266Japan 1,374 905 1,684 2,132 2,540 2,364 3,733 4,480New Zealand 236 352 371 455 462 459 462 421
DEVELOPING MEMBER ECONOMIES a 35,541 91,971 193,665 224,567 238,993 251,091 262,751 264,885REGIONAL MEMBERS a 39,055 94,169 197,584 229,603 244,435 256,375 269,277 272,053WORLD 126,750 282,536 460,527 522,934 543,943 571,759 591,968 581,640
... = data not available at cutoff date, Lao PDR = Lao People’s Democratic Republic.
a For reporting economies only.
Sources: World Bank. Migration. http://www.worldbank.org/en/topic/migrationremittancesdiasporaissues/brief/migration-remittances-data (accessed June 2016); for Taipei,China: economy source.
189GlobalizationRegional Trends and Tables
Balance of Payments
Regional Member 2000 2005 2010 2011 2012 2013 2014 2015Developing Member Economies Central and West Asia
Afghanistan ... 1.0 (2008) 2.1 1.0 1.2 1.5 1.3 1.7Armenia 4.6 18.7 18.0 17.7 18.0 19.7 17.9 15.4Azerbaijan 1.1 4.7 2.7 2.9 2.9 2.3 2.5 2.8Georgia 6.9 7.0 10.2 10.7 11.2 12.1 12.0 11.1Kazakhstan 0.7 0.1 0.2 0.1 0.1 0.1 0.1 0.1Kyrgyz Republic 0.6 12.7 26.4 27.6 30.8 31.1 30.0 25.7Pakistan 1.5 3.9 5.6 5.8 6.5 6.6 6.9 7.2Tajikistan 3.8 (2002) 20.2 40.9 46.9 47.5 49.6 36.6 32.8Turkmenistan ... 0.1 (2006) 0.2 0.1 0.1 0.1 0.1 0.0Uzbekistan ... 5.2 (2006) 7.2 9.3 11.0 11.6 9.3 4.7
East AsiaChina, People’s Rep. of 0.1 1.0 0.9 0.8 0.7 0.6 0.6 0.6Hong Kong, China 0.1 0.2 0.1 0.1 0.1 0.1 0.1 0.1Korea, Rep. of 0.9 0.6 0.5 0.5 0.5 0.5 0.5 0.5Mongolia 1.1 7.1 3.7 2.7 2.6 2.0 2.1 2.2Taipei,China 0.1 0.1 0.1 0.1 0.1 0.2 0.2 0.2
South AsiaBangladesh 4.3 8.1 9.5 9.8 11.0 9.0 8.7 7.9Bhutan ... 0.2 (2006) 0.5 0.6 1.0 0.7 0.7 1.0India 2.7 2.6 3.1 3.3 3.7 3.6 3.4 3.3Maldives 0.4 0.2 0.1 0.1 0.1 0.1 0.1 0.1Nepal 2.0 14.7 21.3 22.8 26.7 30.7 29.2 33.8Sri Lanka 7.0 8.1 7.3 7.9 8.8 8.6 8.8 8.5
Southeast AsiaBrunei Darussalam ... ... ... ... ... ... ... ...Cambodia 3.3 2.6 1.4 1.3 1.2 1.2 2.2 2.2Indonesia 0.7 1.9 0.9 0.8 0.8 0.8 1.0 1.1Lao PDR 0.0 0.0 0.6 1.4 0.6 0.6 0.5 0.5Malaysia 0.4 0.8 0.4 0.4 0.4 0.4 0.5 0.5Myanmar 0.0 0.0 0.0 0.0 0.3 2.6 4.7 5.5Philippines 8.6 13.3 10.3 9.8 9.3 9.3 9.6 9.7Singapore ... ... ... ... ... ... ... ...Thailand 1.3 0.6 1.1 1.2 1.2 1.4 1.4 1.3Viet Nam 4.3 5.5 7.1 6.3 6.4 6.4 6.4 6.8
The PacificCook Islands ... ... ... ... ... ... ... ...Fiji 2.6 6.8 5.5 4.2 4.8 4.9 4.5 5.1Kiribati ... 11.6 (2006) 9.7 9.2 9.0 9.2 8.6 ...Marshall Islands ... 17.2 13.5 12.8 12.6 12.9 14.2 15.0Micronesia, Fed. States of ... ... 6.1 6.2 6.4 7.0 7.3 7.6Nauru ... ... ... ... ... ... ... ...Palau ... 0.8 0.9 1.0 1.1 1.0 0.9 0.8Papua New Guinea 0.2 0.1 0.0 0.1 0.1 0.1 ... ...Samoa 19.5 (1999) 18.8 20.4 20.3 22.2 20.5 17.0 19.9Solomon Islands 1.5 1.7 2.1 2.1 2.3 2.0 1.6 1.7Timor-Leste ... 0.1 (2006) 3.2 2.3 1.8 0.6 1.0 ...Tonga ... 26.0 20.7 17.6 25.3 27.5 27.0 29.8Tuvalu ... 22.5 12.3 11.7 9.6 10.6 10.8 12.4Vanuatu 12.7 1.3 1.7 2.7 2.8 3.0 3.5 ...
Developed Member EconomiesAustralia 0.5 0.1 0.2 0.2 0.2 0.2 0.2 0.2Japan 0.0 0.0 0.0 0.0 0.0 0.0 0.1 0.1New Zealand 0.4 0.3 0.3 0.3 0.3 0.2 0.2 ...
DEVELOPING MEMBER ECONOMIES a 0.9 1.2 1.0 1.0 1.5 1.5 1.4 1.4REGIONAL MEMBERS a 0.4 0.7 0.8 0.8 1.0 1.1 1.1 1.1
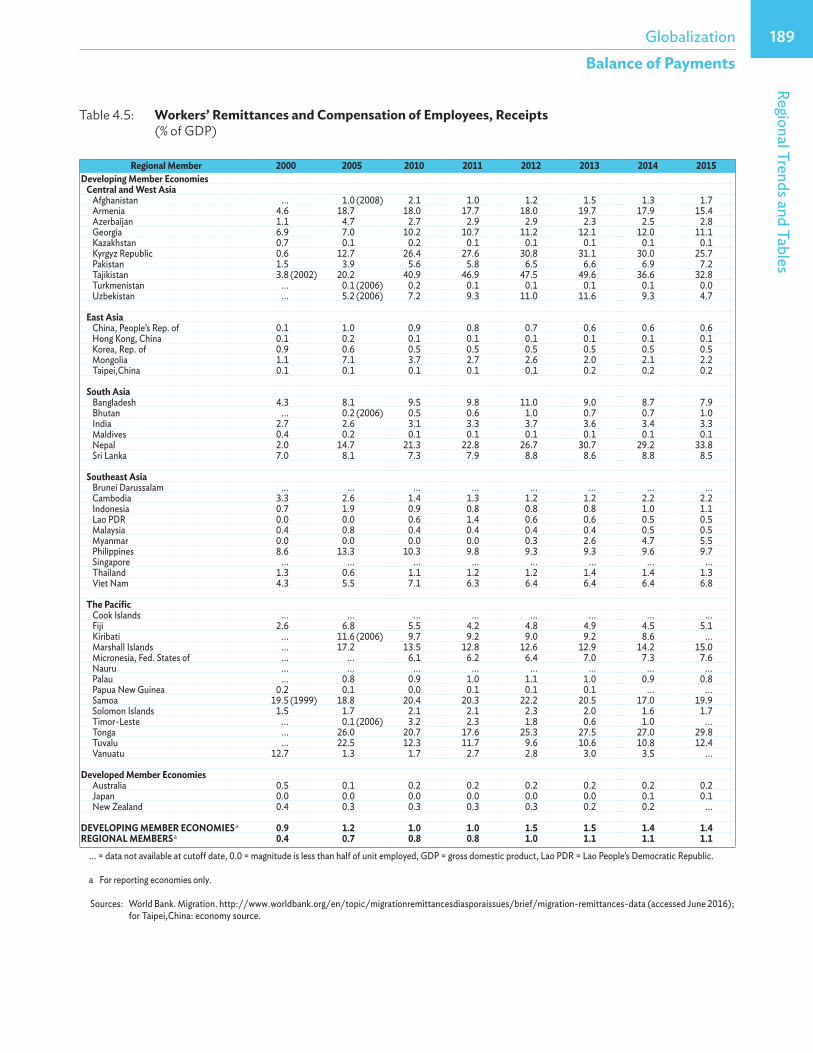
... = data not available at cutoff date, 0.0 = magnitude is less than half of unit employed, GDP = gross domestic product, Lao PDR = Lao People’s Democratic Republic.
a For reporting economies only.
Sources: World Bank. Migration. http://www.worldbank.org/en/topic/migrationremittancesdiasporaissues/brief/migration-remittances-data (accessed June 2016); for Taipei,China: economy source.
Table 4.5: Workers’ Remittances and Compensation of Employees, Receipts (% of GDP)
190 Key Indicators for Asia and the Pacific 2016Balance of Payments
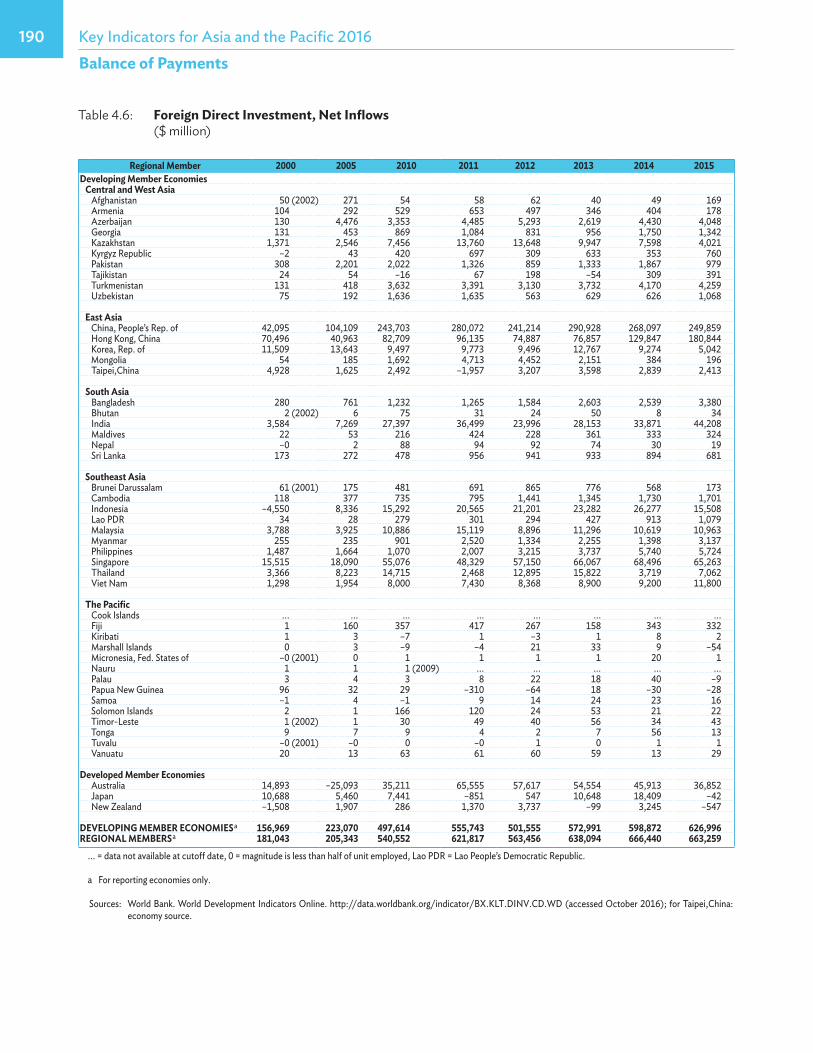
Table 4.6: Foreign Direct Investment, Net Inflows ($ million)
Regional Member 2000 2005 2010 2011 2012 2013 2014 2015Developing Member Economies Central and West Asia
Afghanistan 50 (2002) 271 54 58 62 40 49 169Armenia 104 292 529 653 497 346 404 178Azerbaijan 130 4,476 3,353 4,485 5,293 2,619 4,430 4,048Georgia 131 453 869 1,084 831 956 1,750 1,342Kazakhstan 1,371 2,546 7,456 13,760 13,648 9,947 7,598 4,021Kyrgyz Republic –2 43 420 697 309 633 353 760Pakistan 308 2,201 2,022 1,326 859 1,333 1,867 979Tajikistan 24 54 –16 67 198 –54 309 391Turkmenistan 131 418 3,632 3,391 3,130 3,732 4,170 4,259Uzbekistan 75 192 1,636 1,635 563 629 626 1,068
East AsiaChina, People’s Rep. of 42,095 104,109 243,703 280,072 241,214 290,928 268,097 249,859Hong Kong, China 70,496 40,963 82,709 96,135 74,887 76,857 129,847 180,844Korea, Rep. of 11,509 13,643 9,497 9,773 9,496 12,767 9,274 5,042Mongolia 54 185 1,692 4,713 4,452 2,151 384 196Taipei,China 4,928 1,625 2,492 –1,957 3,207 3,598 2,839 2,413
South AsiaBangladesh 280 761 1,232 1,265 1,584 2,603 2,539 3,380Bhutan 2 (2002) 6 75 31 24 50 8 34India 3,584 7,269 27,397 36,499 23,996 28,153 33,871 44,208Maldives 22 53 216 424 228 361 333 324Nepal –0 2 88 94 92 74 30 19Sri Lanka 173 272 478 956 941 933 894 681
Southeast AsiaBrunei Darussalam 61 (2001) 175 481 691 865 776 568 173Cambodia 118 377 735 795 1,441 1,345 1,730 1,701Indonesia –4,550 8,336 15,292 20,565 21,201 23,282 26,277 15,508Lao PDR 34 28 279 301 294 427 913 1,079Malaysia 3,788 3,925 10,886 15,119 8,896 11,296 10,619 10,963Myanmar 255 235 901 2,520 1,334 2,255 1,398 3,137Philippines 1,487 1,664 1,070 2,007 3,215 3,737 5,740 5,724Singapore 15,515 18,090 55,076 48,329 57,150 66,067 68,496 65,263Thailand 3,366 8,223 14,715 2,468 12,895 15,822 3,719 7,062Viet Nam 1,298 1,954 8,000 7,430 8,368 8,900 9,200 11,800
The Pacific Cook Islands ... ... ... ... ... ... ... ...Fiji 1 160 357 417 267 158 343 332Kiribati 1 3 –7 1 –3 1 8 2Marshall Islands 0 3 –9 –4 21 33 9 –54Micronesia, Fed. States of –0 (2001) 0 1 1 1 1 20 1Nauru 1 1 1 (2009) ... ... ... ... ...Palau 3 4 3 8 22 18 40 –9Papua New Guinea 96 32 29 –310 –64 18 –30 –28Samoa –1 4 –1 9 14 24 23 16Solomon Islands 2 1 166 120 24 53 21 22Timor-Leste 1 (2002) 1 30 49 40 56 34 43Tonga 9 7 9 4 2 7 56 13Tuvalu –0 (2001) –0 0 –0 1 0 1 1Vanuatu 20 13 63 61 60 59 13 29
Developed Member EconomiesAustralia 14,893 –25,093 35,211 65,555 57,617 54,554 45,913 36,852Japan 10,688 5,460 7,441 –851 547 10,648 18,409 –42New Zealand –1,508 1,907 286 1,370 3,737 –99 3,245 –547
DEVELOPING MEMBER ECONOMIES a 156,969 223,070 497,614 555,743 501,555 572,991 598,872 626,996REGIONAL MEMBERS a 181,043 205,343 540,552 621,817 563,456 638,094 666,440 663,259
... = data not available at cutoff date, 0 = magnitude is less than half of unit employed, Lao PDR = Lao People’s Democratic Republic.
a For reporting economies only.
Sources: World Bank. World Development Indicators Online. http://data.worldbank.org/indicator/BX.KLT.DINV.CD.WD (accessed October 2016); for Taipei,China: economy source.
191GlobalizationRegional Trends and Tables
Balance of Payments
Table 4.7: Foreign Direct Investment, Net Inflows (% of GDP)
Regional Member 2000 2005 2010 2011 2012 2013 2014 2015Developing Member Economies Central and West Asia
Afghanistan 1.2 (2002) 4.1 0.3 0.3 0.3 0.2 0.2 0.8Armenia 5.5 6.0 5.7 6.4 4.7 3.1 3.5 1.7Azerbaijan 2.5 33.8 6.3 6.8 7.6 3.5 5.9 7.6Georgia 4.3 7.1 7.5 7.5 5.2 5.9 10.6 9.6Kazakhstan 7.5 4.5 5.0 6.9 6.3 4.1 3.3 2.2Kyrgyz Republic –0.2 1.7 8.8 11.3 4.7 8.6 4.7 11.6Pakistan 0.4 2.0 1.2 0.6 0.4 0.6 0.8 0.4Tajikistan 2.7 2.4 –0.3 1.0 2.6 –0.6 3.3 5.0Turkmenistan 2.7 2.9 16.4 11.6 8.9 9.5 9.6 11.9Uzbekistan 0.5 1.3 4.1 3.5 1.1 1.1 1.0 1.6
East AsiaChina, People’s Rep. of 3.5 4.6 4.0 3.7 2.9 3.1 2.6 2.3Hong Kong, China 41.1 22.6 36.2 38.7 28.5 27.9 44.6 58.5Korea, Rep. of 2.0 1.5 0.9 0.8 0.8 1.0 0.7 0.4Mongolia 4.7 7.3 23.5 45.3 36.2 17.1 3.1 1.7Taipei,China 1.5 0.4 0.6 –0.4 0.6 0.7 0.5 0.5
South AsiaBangladesh 0.6 1.3 1.1 1.0 1.2 1.7 1.5 1.7Bhutan 0.5 (2002) 0.8 4.7 1.7 1.3 2.8 0.4 1.6India 0.7 0.9 1.6 1.9 1.3 1.5 1.7 2.1Maldives 3.6 4.7 9.3 17.3 9.1 12.9 10.9 9.6Nepal 0.0 0.0 0.5 0.5 0.5 0.4 0.2 0.1Sri Lanka 1.0 1.1 0.8 1.5 1.4 1.3 1.1 0.8
Southeast AsiaBrunei Darussalam 1.1 (2001) 1.8 3.5 3.7 4.5 4.3 3.3 1.3Cambodia 3.2 6.0 6.5 6.2 10.3 8.8 10.3 9.4Indonesia –2.8 2.9 2.0 2.3 2.3 2.6 3.0 1.8Lao PDR 2.1 1.0 4.1 3.7 3.2 4.0 7.8 8.8Malaysia 4.0 2.7 4.3 5.1 2.8 3.5 3.1 3.7Myanmar 0.1 0.0 0.0 0.0 1.7 3.6 2.1 5.0Philippines 1.8 1.6 0.5 0.9 1.3 1.4 2.0 2.0Singapore 16.2 14.2 23.3 17.6 19.8 22.0 22.4 22.3Thailand 2.7 4.3 4.3 0.7 3.2 3.8 0.9 1.8Viet Nam 4.2 3.4 6.9 5.5 5.4 5.2 4.9 6.1
The PacificCook Islands ... ... ... ... ... ... ... ...Fiji 0.0 5.4 11.4 11.0 6.7 3.8 7.6 7.7Kiribati 1.1 2.5 –4.3 0.4 –1.8 0.6 4.4 ...Marshall Islands 0.1 2.4 –5.7 –2.5 11.5 17.0 4.9 –29.9Micronesia, Fed. States of –0.1 (2001) 0.0 0.3 0.3 0.3 0.3 6.4 0.3Nauru ... 3.8 2.5 (2009) ... ... ... ... ...Palau 2.1 2.1 1.5 4.2 10.1 7.9 15.9 –3.1Papua New Guinea 2.8 0.7 0.2 –1.7 –0.3 0.1 ... ...Samoa –0.5 0.9 –0.2 1.1 1.7 3.0 2.8 2.0Solomon Islands 0.7 0.1 23.9 14.6 2.6 5.3 2.0 2.1Timor-Leste 0.2 (2002) 0.0 0.7 0.8 0.6 1.0 0.8 ...Tonga 4.9 2.7 2.4 0.8 0.4 1.5 12.9 3.2Tuvalu –0.1 (2001) –0.1 1.4 –0.3 3.3 0.9 1.7 1.8Vanuatu 7.4 3.4 9.0 7.7 7.7 7.4 1.6 ...
Developed Member EconomiesAustralia 3.9 –3.6 3.0 4.5 3.7 3.7 3.2 3.0Japan 0.2 0.1 0.1 0.0 0.0 0.2 0.4 0.0New Zealand –2.8 1.7 0.2 0.8 2.1 –0.1 1.6 ...
DEVELOPING MEMBER ECONOMIES a 4.0 2.8 2.6 2.4 3.2 3.4 3.3 3.4REGIONAL MEMBERS a 2.0 1.5 2.1 2.0 2.4 2.7 2.7 2.8
... = data not available at cutoff date, 0.0 = magnitude is less than half of the unit employed, GDP = gross domestic product, Lao PDR = Lao People’s Democratic Republic.
a For reporting economies only.
Sources: World Bank. World Development Indicators Online. http://data.worldbank.org/indicator/BX.KLT.DINV.CD.WD (accessed October 2016); for Taipei,China: economy source.
192 Key Indicators for Asia and the Pacific 2016External Trade
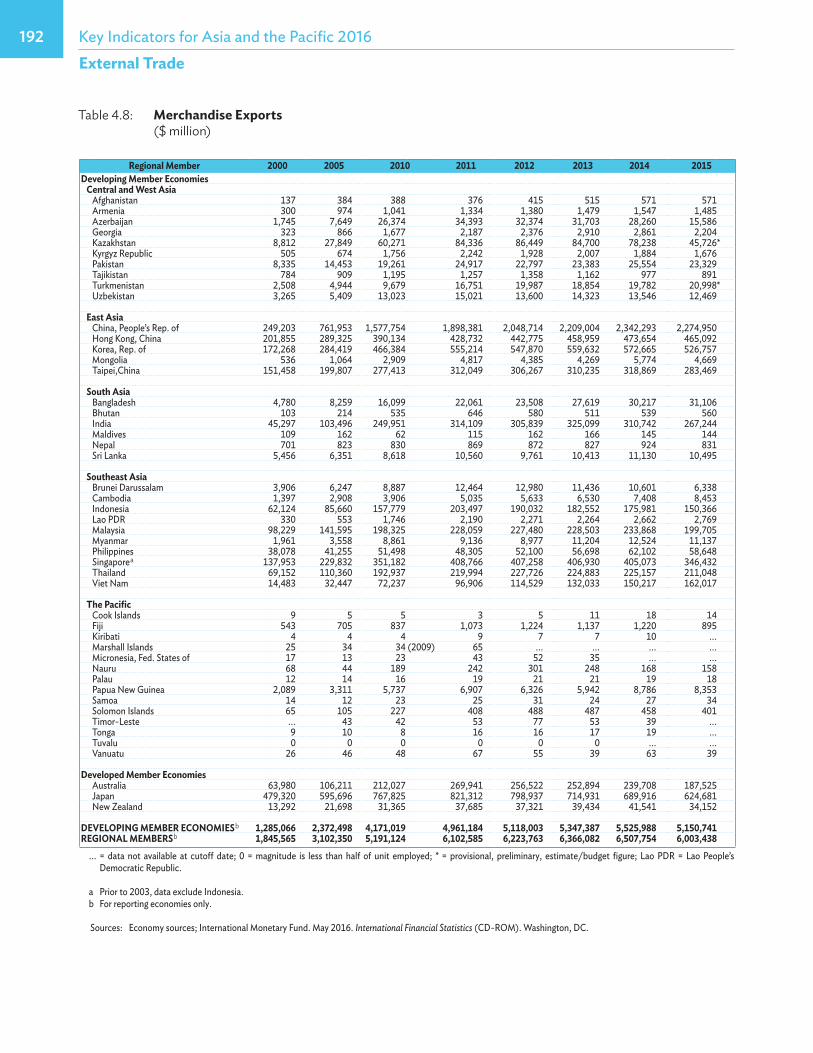
Table 4.8: Merchandise Exports ($ million)
Regional Member 2000 2005 2010 2011 2012 2013 2014 2015Developing Member Economies Central and West Asia
Afghanistan 137 384 388 376 415 515 571 571Armenia 300 974 1,041 1,334 1,380 1,479 1,547 1,485Azerbaijan 1,745 7,649 26,374 34,393 32,374 31,703 28,260 15,586Georgia 323 866 1,677 2,187 2,376 2,910 2,861 2,204Kazakhstan 8,812 27,849 60,271 84,336 86,449 84,700 78,238 45,726*Kyrgyz Republic 505 674 1,756 2,242 1,928 2,007 1,884 1,676Pakistan 8,335 14,453 19,261 24,917 22,797 23,383 25,554 23,329Tajikistan 784 909 1,195 1,257 1,358 1,162 977 891Turkmenistan 2,508 4,944 9,679 16,751 19,987 18,854 19,782 20,998*Uzbekistan 3,265 5,409 13,023 15,021 13,600 14,323 13,546 12,469
East AsiaChina, People’s Rep. of 249,203 761,953 1,577,754 1,898,381 2,048,714 2,209,004 2,342,293 2,274,950Hong Kong, China 201,855 289,325 390,134 428,732 442,775 458,959 473,654 465,092Korea, Rep. of 172,268 284,419 466,384 555,214 547,870 559,632 572,665 526,757Mongolia 536 1,064 2,909 4,817 4,385 4,269 5,774 4,669Taipei,China 151,458 199,807 277,413 312,049 306,267 310,235 318,869 283,469
South AsiaBangladesh 4,780 8,259 16,099 22,061 23,508 27,619 30,217 31,106Bhutan 103 214 535 646 580 511 539 560India 45,297 103,496 249,951 314,109 305,839 325,099 310,742 267,244Maldives 109 162 62 115 162 166 145 144Nepal 701 823 830 869 872 827 924 831Sri Lanka 5,456 6,351 8,618 10,560 9,761 10,413 11,130 10,495
Southeast AsiaBrunei Darussalam 3,906 6,247 8,887 12,464 12,980 11,436 10,601 6,338Cambodia 1,397 2,908 3,906 5,035 5,633 6,530 7,408 8,453Indonesia 62,124 85,660 157,779 203,497 190,032 182,552 175,981 150,366Lao PDR 330 553 1,746 2,190 2,271 2,264 2,662 2,769Malaysia 98,229 141,595 198,325 228,059 227,480 228,503 233,868 199,705Myanmar 1,961 3,558 8,861 9,136 8,977 11,204 12,524 11,137Philippines 38,078 41,255 51,498 48,305 52,100 56,698 62,102 58,648Singapore a 137,953 229,832 351,182 408,766 407,258 406,930 405,073 346,432Thailand 69,152 110,360 192,937 219,994 227,726 224,883 225,157 211,048Viet Nam 14,483 32,447 72,237 96,906 114,529 132,033 150,217 162,017
The PacificCook Islands 9 5 5 3 5 11 18 14Fiji 543 705 837 1,073 1,224 1,137 1,220 895Kiribati 4 4 4 9 7 7 10 ...Marshall Islands 25 34 34 (2009) 65 ... ... ... ...Micronesia, Fed. States of 17 13 23 43 52 35 ... ...Nauru 68 44 189 242 301 248 168 158Palau 12 14 16 19 21 21 19 18Papua New Guinea 2,089 3,311 5,737 6,907 6,326 5,942 8,786 8,353Samoa 14 12 23 25 31 24 27 34Solomon Islands 65 105 227 408 488 487 458 401Timor-Leste ... 43 42 53 77 53 39 ...Tonga 9 10 8 16 16 17 19 ...Tuvalu 0 0 0 0 0 0 ... ...Vanuatu 26 46 48 67 55 39 63 39
Developed Member Economies
Australia 63,980 106,211 212,027 269,941 256,522 252,894 239,708 187,525Japan 479,320 595,696 767,825 821,312 798,937 714,931 689,916 624,681New Zealand 13,292 21,698 31,365 37,685 37,321 39,434 41,541 34,152
DEVELOPING MEMBER ECONOMIES b 1,285,066 2,372,498 4,171,019 4,961,184 5,118,003 5,347,387 5,525,988 5,150,741REGIONAL MEMBERS b 1,845,565 3,102,350 5,191,124 6,102,585 6,223,763 6,366,082 6,507,754 6,003,438
... = data not available at cutoff date; 0 = magnitude is less than half of unit employed; * = provisional, preliminary, estimate/budget figure; Lao PDR = Lao People’s Democratic Republic.
a Prior to 2003, data exclude Indonesia.b For reporting economies only.
Sources: Economy sources; International Monetary Fund. May 2016. International Financial Statistics (CD-ROM). Washington, DC.
193GlobalizationRegional Trends and Tables
External Trade
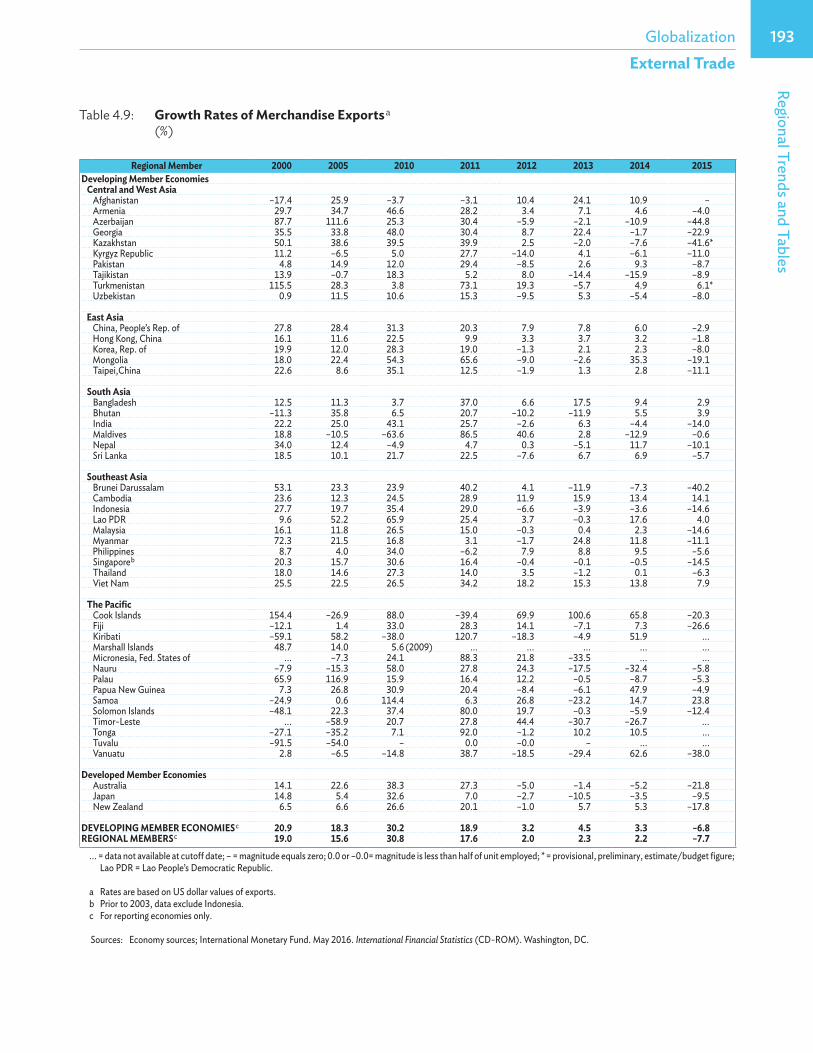
Table 4.9: Growth Rates of Merchandise Exports a (%)
Regional Member 2000 2005 2010 2011 2012 2013 2014 2015Developing Member Economies Central and West Asia
Afghanistan –17.4 25.9 –3.7 –3.1 10.4 24.1 10.9 –Armenia 29.7 34.7 46.6 28.2 3.4 7.1 4.6 –4.0Azerbaijan 87.7 111.6 25.3 30.4 –5.9 –2.1 –10.9 –44.8Georgia 35.5 33.8 48.0 30.4 8.7 22.4 –1.7 –22.9Kazakhstan 50.1 38.6 39.5 39.9 2.5 –2.0 –7.6 –41.6 *Kyrgyz Republic 11.2 –6.5 5.0 27.7 –14.0 4.1 –6.1 –11.0Pakistan 4.8 14.9 12.0 29.4 –8.5 2.6 9.3 –8.7Tajikistan 13.9 –0.7 18.3 5.2 8.0 –14.4 –15.9 –8.9Turkmenistan 115.5 28.3 3.8 73.1 19.3 –5.7 4.9 6.1 *Uzbekistan 0.9 11.5 10.6 15.3 –9.5 5.3 –5.4 –8.0
East AsiaChina, People’s Rep. of 27.8 28.4 31.3 20.3 7.9 7.8 6.0 –2.9Hong Kong, China 16.1 11.6 22.5 9.9 3.3 3.7 3.2 –1.8Korea, Rep. of 19.9 12.0 28.3 19.0 –1.3 2.1 2.3 –8.0Mongolia 18.0 22.4 54.3 65.6 –9.0 –2.6 35.3 –19.1Taipei,China 22.6 8.6 35.1 12.5 –1.9 1.3 2.8 –11.1
South AsiaBangladesh 12.5 11.3 3.7 37.0 6.6 17.5 9.4 2.9Bhutan –11.3 35.8 6.5 20.7 –10.2 –11.9 5.5 3.9India 22.2 25.0 43.1 25.7 –2.6 6.3 –4.4 –14.0Maldives 18.8 –10.5 –63.6 86.5 40.6 2.8 –12.9 –0.6Nepal 34.0 12.4 –4.9 4.7 0.3 –5.1 11.7 –10.1Sri Lanka 18.5 10.1 21.7 22.5 –7.6 6.7 6.9 –5.7
Southeast AsiaBrunei Darussalam 53.1 23.3 23.9 40.2 4.1 –11.9 –7.3 –40.2Cambodia 23.6 12.3 24.5 28.9 11.9 15.9 13.4 14.1Indonesia 27.7 19.7 35.4 29.0 –6.6 –3.9 –3.6 –14.6Lao PDR 9.6 52.2 65.9 25.4 3.7 –0.3 17.6 4.0Malaysia 16.1 11.8 26.5 15.0 –0.3 0.4 2.3 –14.6Myanmar 72.3 21.5 16.8 3.1 –1.7 24.8 11.8 –11.1Philippines 8.7 4.0 34.0 –6.2 7.9 8.8 9.5 –5.6Singapore b 20.3 15.7 30.6 16.4 –0.4 –0.1 –0.5 –14.5Thailand 18.0 14.6 27.3 14.0 3.5 –1.2 0.1 –6.3Viet Nam 25.5 22.5 26.5 34.2 18.2 15.3 13.8 7.9
The PacificCook Islands 154.4 –26.9 88.0 –39.4 69.9 100.6 65.8 –20.3Fiji –12.1 1.4 33.0 28.3 14.1 –7.1 7.3 –26.6Kiribati –59.1 58.2 –38.0 120.7 –18.3 –4.9 51.9 ...Marshall Islands 48.7 14.0 5.6 (2009) ... ... ... ... ...Micronesia, Fed. States of ... –7.3 24.1 88.3 21.8 –33.5 ... ...Nauru –7.9 –15.3 58.0 27.8 24.3 –17.5 –32.4 –5.8Palau 65.9 116.9 15.9 16.4 12.2 –0.5 –8.7 –5.3Papua New Guinea 7.3 26.8 30.9 20.4 –8.4 –6.1 47.9 –4.9Samoa –24.9 0.6 114.4 6.3 26.8 –23.2 14.7 23.8Solomon Islands –48.1 22.3 37.4 80.0 19.7 –0.3 –5.9 –12.4Timor-Leste ... –58.9 20.7 27.8 44.4 –30.7 –26.7 ...Tonga –27.1 –35.2 7.1 92.0 –1.2 10.2 10.5 ...Tuvalu –91.5 –54.0 – 0.0 –0.0 – ... ...Vanuatu 2.8 –6.5 –14.8 38.7 –18.5 –29.4 62.6 –38.0
Developed Member EconomiesAustralia 14.1 22.6 38.3 27.3 –5.0 –1.4 –5.2 –21.8Japan 14.8 5.4 32.6 7.0 –2.7 –10.5 –3.5 –9.5New Zealand 6.5 6.6 26.6 20.1 –1.0 5.7 5.3 –17.8
DEVELOPING MEMBER ECONOMIES c 20.9 18.3 30.2 18.9 3.2 4.5 3.3 –6.8REGIONAL MEMBERS c 19.0 15.6 30.8 17.6 2.0 2.3 2.2 –7.7
... = data not available at cutoff date; – = magnitude equals zero; 0.0 or –0.0= magnitude is less than half of unit employed; * = provisional, preliminary, estimate/budget figure; Lao PDR = Lao People’s Democratic Republic.
a Rates are based on US dollar values of exports.b Prior to 2003, data exclude Indonesia.c For reporting economies only.
Sources: Economy sources; International Monetary Fund. May 2016. International Financial Statistics (CD-ROM). Washington, DC.
194 Key Indicators for Asia and the Pacific 2016External Trade
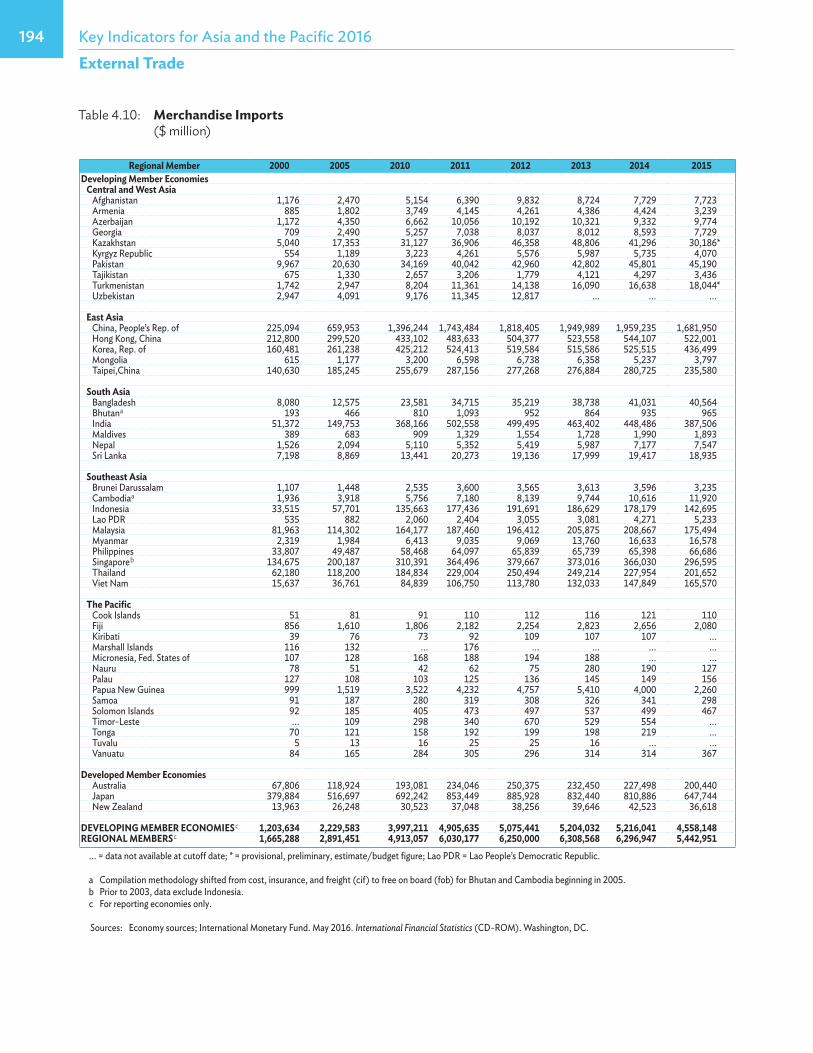
Table 4.10: Merchandise Imports ($ million)
Regional Member 2000 2005 2010 2011 2012 2013 2014 2015Developing Member Economies Central and West Asia
Afghanistan 1,176 2,470 5,154 6,390 9,832 8,724 7,729 7,723 Armenia 885 1,802 3,749 4,145 4,261 4,386 4,424 3,239 Azerbaijan 1,172 4,350 6,662 10,056 10,192 10,321 9,332 9,774 Georgia 709 2,490 5,257 7,038 8,037 8,012 8,593 7,729 Kazakhstan 5,040 17,353 31,127 36,906 46,358 48,806 41,296 30,186 *Kyrgyz Republic 554 1,189 3,223 4,261 5,576 5,987 5,735 4,070 Pakistan 9,967 20,630 34,169 40,042 42,960 42,802 45,801 45,190 Tajikistan 675 1,330 2,657 3,206 1,779 4,121 4,297 3,436 Turkmenistan 1,742 2,947 8,204 11,361 14,138 16,090 16,638 18,044 *Uzbekistan 2,947 4,091 9,176 11,345 12,817 ... ... ...
East AsiaChina, People’s Rep. of 225,094 659,953 1,396,244 1,743,484 1,818,405 1,949,989 1,959,235 1,681,950 Hong Kong, China 212,800 299,520 433,102 483,633 504,377 523,558 544,107 522,001 Korea, Rep. of 160,481 261,238 425,212 524,413 519,584 515,586 525,515 436,499 Mongolia 615 1,177 3,200 6,598 6,738 6,358 5,237 3,797 Taipei,China 140,630 185,245 255,679 287,156 277,268 276,884 280,725 235,580
South AsiaBangladesh 8,080 12,575 23,581 34,715 35,219 38,738 41,031 40,564 Bhutana 193 466 810 1,093 952 864 935 965 India 51,372 149,753 368,166 502,558 499,495 463,402 448,486 387,506 Maldives 389 683 909 1,329 1,554 1,728 1,990 1,893 Nepal 1,526 2,094 5,110 5,352 5,419 5,987 7,177 7,547 Sri Lanka 7,198 8,869 13,441 20,273 19,136 17,999 19,417 18,935
Southeast AsiaBrunei Darussalam 1,107 1,448 2,535 3,600 3,565 3,613 3,596 3,235 Cambodiaa 1,936 3,918 5,756 7,180 8,139 9,744 10,616 11,920 Indonesia 33,515 57,701 135,663 177,436 191,691 186,629 178,179 142,695 Lao PDR 535 882 2,060 2,404 3,055 3,081 4,271 5,233 Malaysia 81,963 114,302 164,177 187,460 196,412 205,875 208,667 175,494 Myanmar 2,319 1,984 6,413 9,035 9,069 13,760 16,633 16,578 Philippines 33,807 49,487 58,468 64,097 65,839 65,739 65,398 66,686 Singapore b 134,675 200,187 310,391 364,496 379,667 373,016 366,030 296,595 Thailand 62,180 118,200 184,834 229,004 250,494 249,214 227,954 201,652 Viet Nam 15,637 36,761 84,839 106,750 113,780 132,033 147,849 165,570
The PacificCook Islands 51 81 91 110 112 116 121 110 Fiji 856 1,610 1,806 2,182 2,254 2,823 2,656 2,080 Kiribati 39 76 73 92 109 107 107 ... Marshall Islands 116 132 ... 176 ... ... ... ... Micronesia, Fed. States of 107 128 168 188 194 188 ... ... Nauru 78 51 42 62 75 280 190 127 Palau 127 108 103 125 136 145 149 156 Papua New Guinea 999 1,519 3,522 4,232 4,757 5,410 4,000 2,260 Samoa 91 187 280 319 308 326 341 298 Solomon Islands 92 185 405 473 497 537 499 467 Timor-Leste ... 109 298 340 670 529 554 ... Tonga 70 121 158 192 199 198 219 ... Tuvalu 5 13 16 25 25 16 ... ... Vanuatu 84 165 284 305 296 314 314 367
Developed Member Economies
Australia 67,806 118,924 193,081 234,046 250,375 232,450 227,498 200,440 Japan 379,884 516,697 692,242 853,449 885,928 832,440 810,886 647,744 New Zealand 13,963 26,248 30,523 37,048 38,256 39,646 42,523 36,618
DEVELOPING MEMBER ECONOMIES c 1,203,634 2,229,583 3,997,211 4,905,635 5,075,441 5,204,032 5,216,041 4,558,148REGIONAL MEMBERS c 1,665,288 2,891,451 4,913,057 6,030,177 6,250,000 6,308,568 6,296,947 5,442,951
... = data not available at cutoff date; * = provisional, preliminary, estimate/budget figure; Lao PDR = Lao People’s Democratic Republic.
a Compilation methodology shifted from cost, insurance, and freight (cif) to free on board (fob) for Bhutan and Cambodia beginning in 2005.b Prior to 2003, data exclude Indonesia.c For reporting economies only.
Sources: Economy sources; International Monetary Fund. May 2016. International Financial Statistics (CD-ROM). Washington, DC.
195GlobalizationRegional Trends and Tables
External Trade
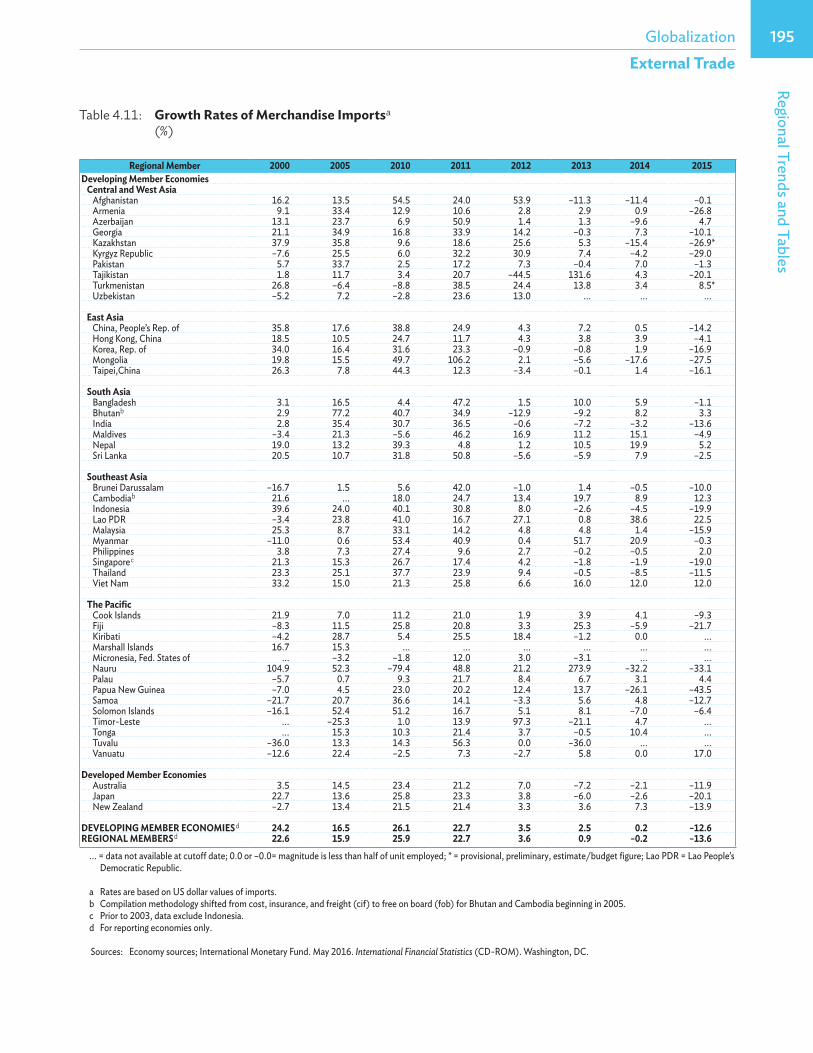
Table 4.11: Growth Rates of Merchandise Importsa (%)
Regional Member 2000 2005 2010 2011 2012 2013 2014 2015Developing Member Economies Central and West Asia
Afghanistan 16.2 13.5 54.5 24.0 53.9 –11.3 –11.4 –0.1Armenia 9.1 33.4 12.9 10.6 2.8 2.9 0.9 –26.8Azerbaijan 13.1 23.7 6.9 50.9 1.4 1.3 –9.6 4.7Georgia 21.1 34.9 16.8 33.9 14.2 –0.3 7.3 –10.1Kazakhstan 37.9 35.8 9.6 18.6 25.6 5.3 –15.4 –26.9*Kyrgyz Republic –7.6 25.5 6.0 32.2 30.9 7.4 –4.2 –29.0Pakistan 5.7 33.7 2.5 17.2 7.3 –0.4 7.0 –1.3Tajikistan 1.8 11.7 3.4 20.7 –44.5 131.6 4.3 –20.1Turkmenistan 26.8 –6.4 –8.8 38.5 24.4 13.8 3.4 8.5*Uzbekistan –5.2 7.2 –2.8 23.6 13.0 ... ... ...
East AsiaChina, People’s Rep. of 35.8 17.6 38.8 24.9 4.3 7.2 0.5 –14.2Hong Kong, China 18.5 10.5 24.7 11.7 4.3 3.8 3.9 –4.1Korea, Rep. of 34.0 16.4 31.6 23.3 –0.9 –0.8 1.9 –16.9Mongolia 19.8 15.5 49.7 106.2 2.1 –5.6 –17.6 –27.5Taipei,China 26.3 7.8 44.3 12.3 –3.4 –0.1 1.4 –16.1
South AsiaBangladesh 3.1 16.5 4.4 47.2 1.5 10.0 5.9 –1.1Bhutanb 2.9 77.2 40.7 34.9 –12.9 –9.2 8.2 3.3India 2.8 35.4 30.7 36.5 –0.6 –7.2 –3.2 –13.6Maldives –3.4 21.3 –5.6 46.2 16.9 11.2 15.1 –4.9Nepal 19.0 13.2 39.3 4.8 1.2 10.5 19.9 5.2Sri Lanka 20.5 10.7 31.8 50.8 –5.6 –5.9 7.9 –2.5
Southeast AsiaBrunei Darussalam –16.7 1.5 5.6 42.0 –1.0 1.4 –0.5 –10.0Cambodiab 21.6 ... 18.0 24.7 13.4 19.7 8.9 12.3Indonesia 39.6 24.0 40.1 30.8 8.0 –2.6 –4.5 –19.9Lao PDR –3.4 23.8 41.0 16.7 27.1 0.8 38.6 22.5Malaysia 25.3 8.7 33.1 14.2 4.8 4.8 1.4 –15.9Myanmar –11.0 0.6 53.4 40.9 0.4 51.7 20.9 –0.3Philippines 3.8 7.3 27.4 9.6 2.7 –0.2 –0.5 2.0Singapore c 21.3 15.3 26.7 17.4 4.2 –1.8 –1.9 –19.0Thailand 23.3 25.1 37.7 23.9 9.4 –0.5 –8.5 –11.5Viet Nam 33.2 15.0 21.3 25.8 6.6 16.0 12.0 12.0
The PacificCook Islands 21.9 7.0 11.2 21.0 1.9 3.9 4.1 –9.3Fiji –8.3 11.5 25.8 20.8 3.3 25.3 –5.9 –21.7Kiribati –4.2 28.7 5.4 25.5 18.4 –1.2 0.0 ...Marshall Islands 16.7 15.3 ... ... ... ... ... ...Micronesia, Fed. States of ... –3.2 –1.8 12.0 3.0 –3.1 ... ...Nauru 104.9 52.3 –79.4 48.8 21.2 273.9 –32.2 –33.1Palau –5.7 0.7 9.3 21.7 8.4 6.7 3.1 4.4Papua New Guinea –7.0 4.5 23.0 20.2 12.4 13.7 –26.1 –43.5Samoa –21.7 20.7 36.6 14.1 –3.3 5.6 4.8 –12.7Solomon Islands –16.1 52.4 51.2 16.7 5.1 8.1 –7.0 –6.4Timor-Leste ... –25.3 1.0 13.9 97.3 –21.1 4.7 ...Tonga ... 15.3 10.3 21.4 3.7 –0.5 10.4 ...Tuvalu –36.0 13.3 14.3 56.3 0.0 –36.0 ... ...Vanuatu –12.6 22.4 –2.5 7.3 –2.7 5.8 0.0 17.0
Developed Member Economies
Australia 3.5 14.5 23.4 21.2 7.0 –7.2 –2.1 –11.9Japan 22.7 13.6 25.8 23.3 3.8 –6.0 –2.6 –20.1New Zealand –2.7 13.4 21.5 21.4 3.3 3.6 7.3 –13.9
DEVELOPING MEMBER ECONOMIES d 24.2 16.5 26.1 22.7 3.5 2.5 0.2 –12.6REGIONAL MEMBERS d 22.6 15.9 25.9 22.7 3.6 0.9 –0.2 –13.6
... = data not available at cutoff date; 0.0 or –0.0= magnitude is less than half of unit employed; * = provisional, preliminary, estimate/budget figure; Lao PDR = Lao People’s Democratic Republic.
a Rates are based on US dollar values of imports.b Compilation methodology shifted from cost, insurance, and freight (cif) to free on board (fob) for Bhutan and Cambodia beginning in 2005.c Prior to 2003, data exclude Indonesia.d For reporting economies only.
Sources: Economy sources; International Monetary Fund. May 2016. International Financial Statistics (CD-ROM). Washington, DC.
196 Key Indicators for Asia and the Pacific 2016External Trade
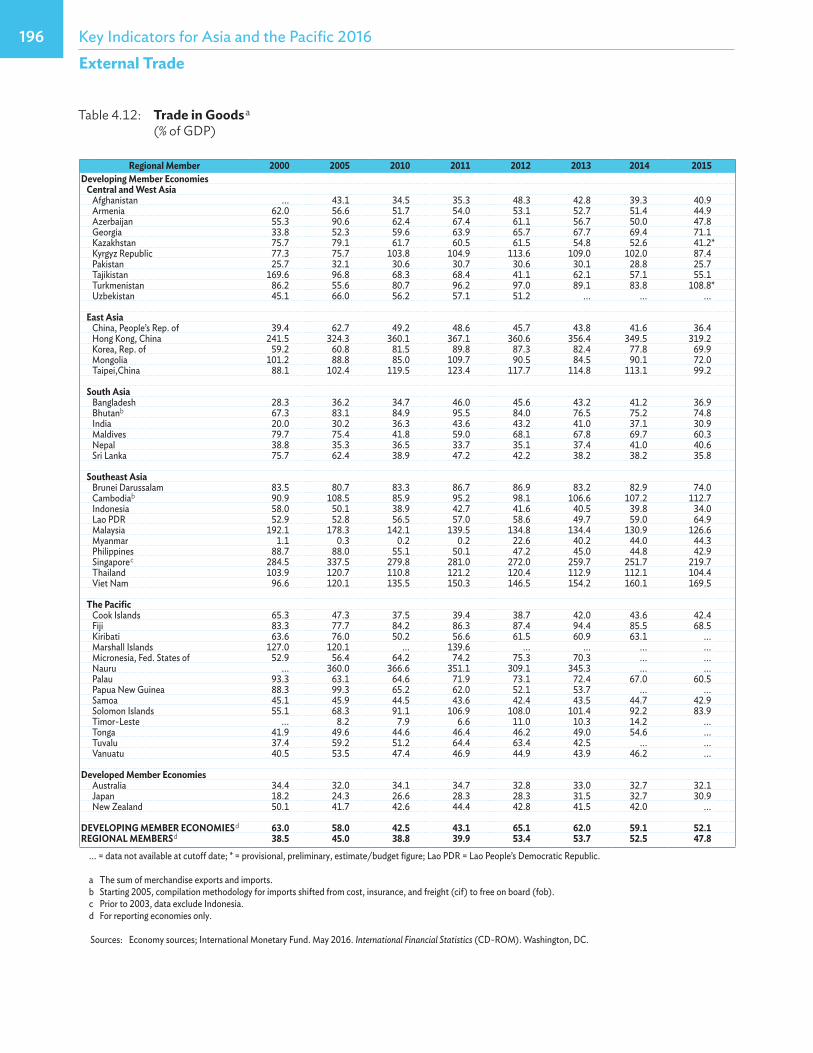
Table 4.12: Trade in Goods a (% of GDP)
Regional Member 2000 2005 2010 2011 2012 2013 2014 2015Developing Member Economies Central and West Asia
Afghanistan ... 43.1 34.5 35.3 48.3 42.8 39.3 40.9Armenia 62.0 56.6 51.7 54.0 53.1 52.7 51.4 44.9Azerbaijan 55.3 90.6 62.4 67.4 61.1 56.7 50.0 47.8Georgia 33.8 52.3 59.6 63.9 65.7 67.7 69.4 71.1Kazakhstan 75.7 79.1 61.7 60.5 61.5 54.8 52.6 41.2*Kyrgyz Republic 77.3 75.7 103.8 104.9 113.6 109.0 102.0 87.4Pakistan 25.7 32.1 30.6 30.7 30.6 30.1 28.8 25.7Tajikistan 169.6 96.8 68.3 68.4 41.1 62.1 57.1 55.1Turkmenistan 86.2 55.6 80.7 96.2 97.0 89.1 83.8 108.8*Uzbekistan 45.1 66.0 56.2 57.1 51.2 ... ... ...
East AsiaChina, People’s Rep. of 39.4 62.7 49.2 48.6 45.7 43.8 41.6 36.4Hong Kong, China 241.5 324.3 360.1 367.1 360.6 356.4 349.5 319.2Korea, Rep. of 59.2 60.8 81.5 89.8 87.3 82.4 77.8 69.9Mongolia 101.2 88.8 85.0 109.7 90.5 84.5 90.1 72.0Taipei,China 88.1 102.4 119.5 123.4 117.7 114.8 113.1 99.2
South AsiaBangladesh 28.3 36.2 34.7 46.0 45.6 43.2 41.2 36.9Bhutanb 67.3 83.1 84.9 95.5 84.0 76.5 75.2 74.8India 20.0 30.2 36.3 43.6 43.2 41.0 37.1 30.9Maldives 79.7 75.4 41.8 59.0 68.1 67.8 69.7 60.3Nepal 38.8 35.3 36.5 33.7 35.1 37.4 41.0 40.6Sri Lanka 75.7 62.4 38.9 47.2 42.2 38.2 38.2 35.8
Southeast AsiaBrunei Darussalam 83.5 80.7 83.3 86.7 86.9 83.2 82.9 74.0Cambodiab 90.9 108.5 85.9 95.2 98.1 106.6 107.2 112.7Indonesia 58.0 50.1 38.9 42.7 41.6 40.5 39.8 34.0Lao PDR 52.9 52.8 56.5 57.0 58.6 49.7 59.0 64.9Malaysia 192.1 178.3 142.1 139.5 134.8 134.4 130.9 126.6Myanmar 1.1 0.3 0.2 0.2 22.6 40.2 44.0 44.3Philippines 88.7 88.0 55.1 50.1 47.2 45.0 44.8 42.9Singapore c 284.5 337.5 279.8 281.0 272.0 259.7 251.7 219.7Thailand 103.9 120.7 110.8 121.2 120.4 112.9 112.1 104.4Viet Nam 96.6 120.1 135.5 150.3 146.5 154.2 160.1 169.5
The PacificCook Islands 65.3 47.3 37.5 39.4 38.7 42.0 43.6 42.4Fiji 83.3 77.7 84.2 86.3 87.4 94.4 85.5 68.5Kiribati 63.6 76.0 50.2 56.6 61.5 60.9 63.1 ...Marshall Islands 127.0 120.1 ... 139.6 ... ... ... ...Micronesia, Fed. States of 52.9 56.4 64.2 74.2 75.3 70.3 ... ...Nauru ... 360.0 366.6 351.1 309.1 345.3 ... ...Palau 93.3 63.1 64.6 71.9 73.1 72.4 67.0 60.5Papua New Guinea 88.3 99.3 65.2 62.0 52.1 53.7 ... ...Samoa 45.1 45.9 44.5 43.6 42.4 43.5 44.7 42.9Solomon Islands 55.1 68.3 91.1 106.9 108.0 101.4 92.2 83.9Timor-Leste ... 8.2 7.9 6.6 11.0 10.3 14.2 ...Tonga 41.9 49.6 44.6 46.4 46.2 49.0 54.6 ...Tuvalu 37.4 59.2 51.2 64.4 63.4 42.5 ... ...Vanuatu 40.5 53.5 47.4 46.9 44.9 43.9 46.2 ...
Developed Member Economies
Australia 34.4 32.0 34.1 34.7 32.8 33.0 32.7 32.1Japan 18.2 24.3 26.6 28.3 28.3 31.5 32.7 30.9New Zealand 50.1 41.7 42.6 44.4 42.8 41.5 42.0 ...
DEVELOPING MEMBER ECONOMIES d 63.0 58.0 42.5 43.1 65.1 62.0 59.1 52.1REGIONAL MEMBERS d 38.5 45.0 38.8 39.9 53.4 53.7 52.5 47.8
... = data not available at cutoff date; * = provisional, preliminary, estimate/budget figure; Lao PDR = Lao People’s Democratic Republic.
a The sum of merchandise exports and imports.b Starting 2005, compilation methodology for imports shifted from cost, insurance, and freight (cif) to free on board (fob).c Prior to 2003, data exclude Indonesia.d For reporting economies only.
Sources: Economy sources; International Monetary Fund. May 2016. International Financial Statistics (CD-ROM). Washington, DC.
197GlobalizationRegional Trends and Tables
External Trade
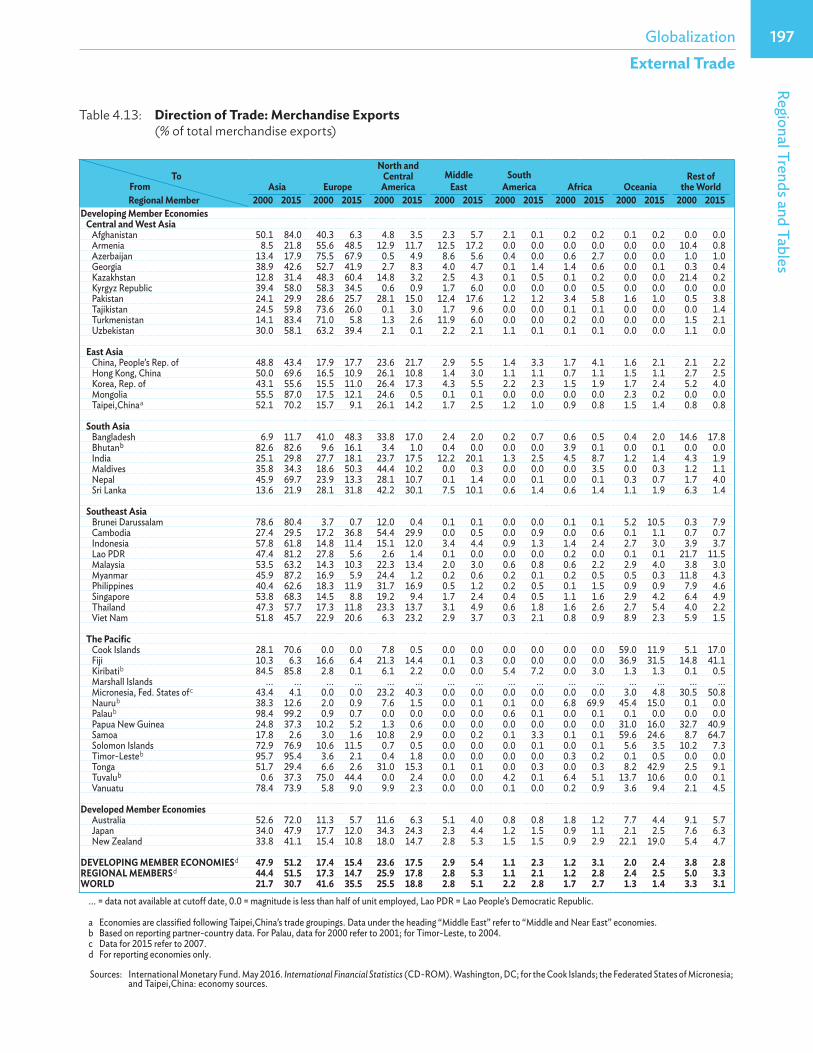
Table 4.13: Direction of Trade: Merchandise Exports (% of total merchandise exports)
Asia Europe
North andCentral
AmericaMiddle
EastSouth
America Africa OceaniaRest of
the WorldRegional Member 2000 2015 2000 2015 2000 2015 2000 2015 2000 2015 2000 2015 2000 2015 2000 2015
Developing Member Economies Central and West Asia
Afghanistan 50.1 84.0 40.3 6.3 4.8 3.5 2.3 5.7 2.1 0.1 0.2 0.2 0.1 0.2 0.0 0.0Armenia 8.5 21.8 55.6 48.5 12.9 11.7 12.5 17.2 0.0 0.0 0.0 0.0 0.0 0.0 10.4 0.8Azerbaijan 13.4 17.9 75.5 67.9 0.5 4.9 8.6 5.6 0.4 0.0 0.6 2.7 0.0 0.0 1.0 1.0Georgia 38.9 42.6 52.7 41.9 2.7 8.3 4.0 4.7 0.1 1.4 1.4 0.6 0.0 0.1 0.3 0.4Kazakhstan 12.8 31.4 48.3 60.4 14.8 3.2 2.5 4.3 0.1 0.5 0.1 0.2 0.0 0.0 21.4 0.2Kyrgyz Republic 39.4 58.0 58.3 34.5 0.6 0.9 1.7 6.0 0.0 0.0 0.0 0.5 0.0 0.0 0.0 0.0Pakistan 24.1 29.9 28.6 25.7 28.1 15.0 12.4 17.6 1.2 1.2 3.4 5.8 1.6 1.0 0.5 3.8Tajikistan 24.5 59.8 73.6 26.0 0.1 3.0 1.7 9.6 0.0 0.0 0.1 0.1 0.0 0.0 0.0 1.4Turkmenistan 14.1 83.4 71.0 5.8 1.3 2.6 11.9 6.0 0.0 0.0 0.2 0.0 0.0 0.0 1.5 2.1Uzbekistan 30.0 58.1 63.2 39.4 2.1 0.1 2.2 2.1 1.1 0.1 0.1 0.1 0.0 0.0 1.1 0.0
East AsiaChina, People’s Rep. of 48.8 43.4 17.9 17.7 23.6 21.7 2.9 5.5 1.4 3.3 1.7 4.1 1.6 2.1 2.1 2.2Hong Kong, China 50.0 69.6 16.5 10.9 26.1 10.8 1.4 3.0 1.1 1.1 0.7 1.1 1.5 1.1 2.7 2.5Korea, Rep. of 43.1 55.6 15.5 11.0 26.4 17.3 4.3 5.5 2.2 2.3 1.5 1.9 1.7 2.4 5.2 4.0Mongolia 55.5 87.0 17.5 12.1 24.6 0.5 0.1 0.1 0.0 0.0 0.0 0.0 2.3 0.2 0.0 0.0Taipei,China a 52.1 70.2 15.7 9.1 26.1 14.2 1.7 2.5 1.2 1.0 0.9 0.8 1.5 1.4 0.8 0.8
South AsiaBangladesh 6.9 11.7 41.0 48.3 33.8 17.0 2.4 2.0 0.2 0.7 0.6 0.5 0.4 2.0 14.6 17.8Bhutan b 82.6 82.6 9.6 16.1 3.4 1.0 0.4 0.0 0.0 0.0 3.9 0.1 0.0 0.1 0.0 0.0India 25.1 29.8 27.7 18.1 23.7 17.5 12.2 20.1 1.3 2.5 4.5 8.7 1.2 1.4 4.3 1.9Maldives 35.8 34.3 18.6 50.3 44.4 10.2 0.0 0.3 0.0 0.0 0.0 3.5 0.0 0.3 1.2 1.1Nepal 45.9 69.7 23.9 13.3 28.1 10.7 0.1 1.4 0.0 0.1 0.0 0.1 0.3 0.7 1.7 4.0Sri Lanka 13.6 21.9 28.1 31.8 42.2 30.1 7.5 10.1 0.6 1.4 0.6 1.4 1.1 1.9 6.3 1.4
Southeast AsiaBrunei Darussalam 78.6 80.4 3.7 0.7 12.0 0.4 0.1 0.1 0.0 0.0 0.1 0.1 5.2 10.5 0.3 7.9Cambodia 27.4 29.5 17.2 36.8 54.4 29.9 0.0 0.5 0.0 0.9 0.0 0.6 0.1 1.1 0.7 0.7Indonesia 57.8 61.8 14.8 11.4 15.1 12.0 3.4 4.4 0.9 1.3 1.4 2.4 2.7 3.0 3.9 3.7Lao PDR 47.4 81.2 27.8 5.6 2.6 1.4 0.1 0.0 0.0 0.0 0.2 0.0 0.1 0.1 21.7 11.5Malaysia 53.5 63.2 14.3 10.3 22.3 13.4 2.0 3.0 0.6 0.8 0.6 2.2 2.9 4.0 3.8 3.0Myanmar 45.9 87.2 16.9 5.9 24.4 1.2 0.2 0.6 0.2 0.1 0.2 0.5 0.5 0.3 11.8 4.3Philippines 40.4 62.6 18.3 11.9 31.7 16.9 0.5 1.2 0.2 0.5 0.1 1.5 0.9 0.9 7.9 4.6Singapore 53.8 68.3 14.5 8.8 19.2 9.4 1.7 2.4 0.4 0.5 1.1 1.6 2.9 4.2 6.4 4.9Thailand 47.3 57.7 17.3 11.8 23.3 13.7 3.1 4.9 0.6 1.8 1.6 2.6 2.7 5.4 4.0 2.2Viet Nam 51.8 45.7 22.9 20.6 6.3 23.2 2.9 3.7 0.3 2.1 0.8 0.9 8.9 2.3 5.9 1.5
The PacificCook Islands 28.1 70.6 0.0 0.0 7.8 0.5 0.0 0.0 0.0 0.0 0.0 0.0 59.0 11.9 5.1 17.0Fiji 10.3 6.3 16.6 6.4 21.3 14.4 0.1 0.3 0.0 0.0 0.0 0.0 36.9 31.5 14.8 41.1Kiribati b 84.5 85.8 2.8 0.1 6.1 2.2 0.0 0.0 5.4 7.2 0.0 3.0 1.3 1.3 0.1 0.5Marshall Islands ... ... ... ... ... ... ... ... ... ... ... ... ... ... ... ...Micronesia, Fed. States of c 43.4 4.1 0.0 0.0 23.2 40.3 0.0 0.0 0.0 0.0 0.0 0.0 3.0 4.8 30.5 50.8Nauru b 38.3 12.6 2.0 0.9 7.6 1.5 0.0 0.1 0.1 0.0 6.8 69.9 45.4 15.0 0.1 0.0Palau b 98.4 99.2 0.9 0.7 0.0 0.0 0.0 0.0 0.6 0.1 0.0 0.1 0.1 0.0 0.0 0.0Papua New Guinea 24.8 37.3 10.2 5.2 1.3 0.6 0.0 0.0 0.0 0.0 0.0 0.0 31.0 16.0 32.7 40.9Samoa 17.8 2.6 3.0 1.6 10.8 2.9 0.0 0.2 0.1 3.3 0.1 0.1 59.6 24.6 8.7 64.7Solomon Islands 72.9 76.9 10.6 11.5 0.7 0.5 0.0 0.0 0.0 0.1 0.0 0.1 5.6 3.5 10.2 7.3Timor-Leste b 95.7 95.4 3.6 2.1 0.4 1.8 0.0 0.0 0.0 0.0 0.3 0.2 0.1 0.5 0.0 0.0Tonga 51.7 29.4 6.6 2.6 31.0 15.3 0.1 0.1 0.0 0.3 0.0 0.3 8.2 42.9 2.5 9.1Tuvalu b 0.6 37.3 75.0 44.4 0.0 2.4 0.0 0.0 4.2 0.1 6.4 5.1 13.7 10.6 0.0 0.1Vanuatu 78.4 73.9 5.8 9.0 9.9 2.3 0.0 0.0 0.1 0.0 0.2 0.9 3.6 9.4 2.1 4.5
Developed Member EconomiesAustralia 52.6 72.0 11.3 5.7 11.6 6.3 5.1 4.0 0.8 0.8 1.8 1.2 7.7 4.4 9.1 5.7Japan 34.0 47.9 17.7 12.0 34.3 24.3 2.3 4.4 1.2 1.5 0.9 1.1 2.1 2.5 7.6 6.3New Zealand 33.8 41.1 15.4 10.8 18.0 14.7 2.8 5.3 1.5 1.5 0.9 2.9 22.1 19.0 5.4 4.7
DEVELOPING MEMBER ECONOMIES d 47.9 51.2 17.4 15.4 23.6 17.5 2.9 5.4 1.1 2.3 1.2 3.1 2.0 2.4 3.8 2.8REGIONAL MEMBERS d 44.4 51.5 17.3 14.7 25.9 17.8 2.8 5.3 1.1 2.1 1.2 2.8 2.4 2.5 5.0 3.3WORLD 21.7 30.7 41.6 35.5 25.5 18.8 2.8 5.1 2.2 2.8 1.7 2.7 1.3 1.4 3.3 3.1
... = data not available at cutoff date, 0.0 = magnitude is less than half of unit employed, Lao PDR = Lao People’s Democratic Republic.
a Economies are classified following Taipei,China’s trade groupings. Data under the heading “Middle East” refer to “Middle and Near East” economies. b Based on reporting partner-country data. For Palau, data for 2000 refer to 2001; for Timor-Leste, to 2004.c Data for 2015 refer to 2007.d For reporting economies only.
Sources: International Monetary Fund. May 2016. International Financial Statistics (CD-ROM). Washington, DC; for the Cook Islands; the Federated States of Micronesia; and Taipei,China: economy sources.
FromTo
198 Key Indicators for Asia and the Pacific 2016External Trade
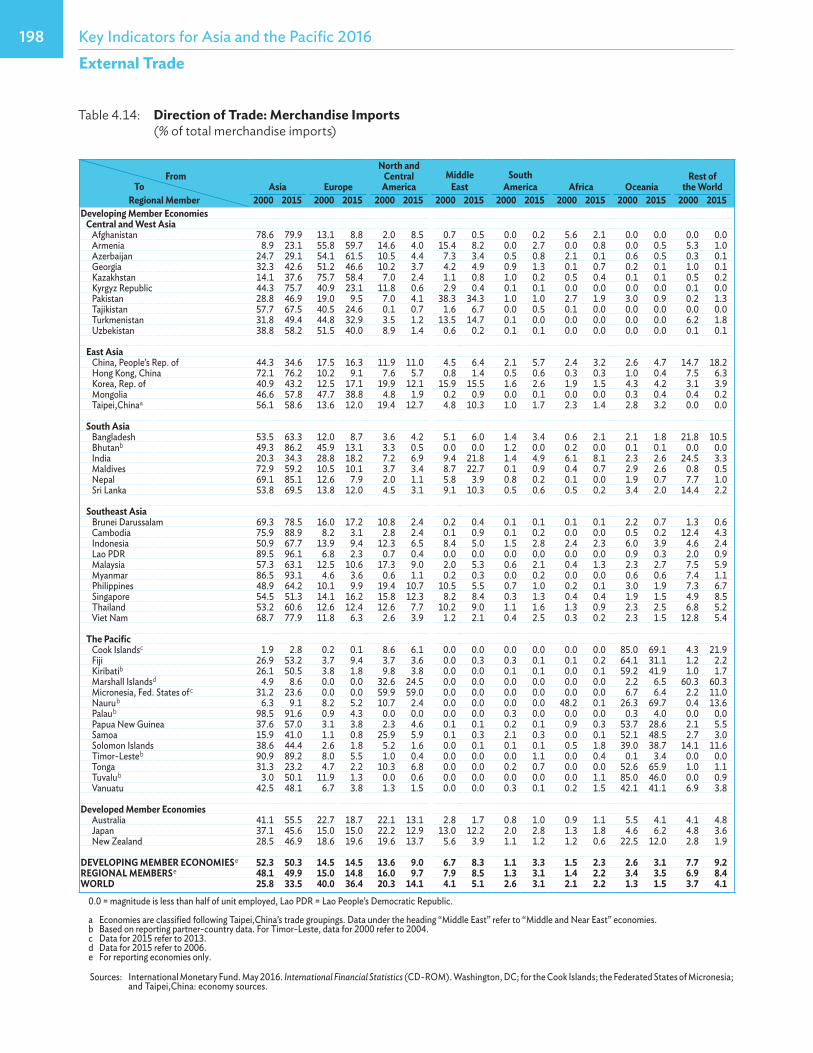
Table 4.14: Direction of Trade: Merchandise Imports (% of total merchandise imports)
Asia Europe
North andCentral
AmericaMiddle
EastSouth
America Africa OceaniaRest of
the WorldRegional Member 2000 2015 2000 2015 2000 2015 2000 2015 2000 2015 2000 2015 2000 2015 2000 2015
Developing Member Economies Central and West Asia
Afghanistan 78.6 79.9 13.1 8.8 2.0 8.5 0.7 0.5 0.0 0.2 5.6 2.1 0.0 0.0 0.0 0.0Armenia 8.9 23.1 55.8 59.7 14.6 4.0 15.4 8.2 0.0 2.7 0.0 0.8 0.0 0.5 5.3 1.0Azerbaijan 24.7 29.1 54.1 61.5 10.5 4.4 7.3 3.4 0.5 0.8 2.1 0.1 0.6 0.5 0.3 0.1Georgia 32.3 42.6 51.2 46.6 10.2 3.7 4.2 4.9 0.9 1.3 0.1 0.7 0.2 0.1 1.0 0.1Kazakhstan 14.1 37.6 75.7 58.4 7.0 2.4 1.1 0.8 1.0 0.2 0.5 0.4 0.1 0.1 0.5 0.2Kyrgyz Republic 44.3 75.7 40.9 23.1 11.8 0.6 2.9 0.4 0.1 0.1 0.0 0.0 0.0 0.0 0.1 0.0Pakistan 28.8 46.9 19.0 9.5 7.0 4.1 38.3 34.3 1.0 1.0 2.7 1.9 3.0 0.9 0.2 1.3Tajikistan 57.7 67.5 40.5 24.6 0.1 0.7 1.6 6.7 0.0 0.5 0.1 0.0 0.0 0.0 0.0 0.0Turkmenistan 31.8 49.4 44.8 32.9 3.5 1.2 13.5 14.7 0.1 0.0 0.0 0.0 0.0 0.0 6.2 1.8Uzbekistan 38.8 58.2 51.5 40.0 8.9 1.4 0.6 0.2 0.1 0.1 0.0 0.0 0.0 0.0 0.1 0.1
East AsiaChina, People’s Rep. of 44.3 34.6 17.5 16.3 11.9 11.0 4.5 6.4 2.1 5.7 2.4 3.2 2.6 4.7 14.7 18.2Hong Kong, China 72.1 76.2 10.2 9.1 7.6 5.7 0.8 1.4 0.5 0.6 0.3 0.3 1.0 0.4 7.5 6.3Korea, Rep. of 40.9 43.2 12.5 17.1 19.9 12.1 15.9 15.5 1.6 2.6 1.9 1.5 4.3 4.2 3.1 3.9Mongolia 46.6 57.8 47.7 38.8 4.8 1.9 0.2 0.9 0.0 0.1 0.0 0.0 0.3 0.4 0.4 0.2Taipei,Chinaa 56.1 58.6 13.6 12.0 19.4 12.7 4.8 10.3 1.0 1.7 2.3 1.4 2.8 3.2 0.0 0.0
South Asia
Bangladesh 53.5 63.3 12.0 8.7 3.6 4.2 5.1 6.0 1.4 3.4 0.6 2.1 2.1 1.8 21.8 10.5Bhutanb 49.3 86.2 45.9 13.1 3.3 0.5 0.0 0.0 1.2 0.0 0.2 0.0 0.1 0.1 0.0 0.0India 20.3 34.3 28.8 18.2 7.2 6.9 9.4 21.8 1.4 4.9 6.1 8.1 2.3 2.6 24.5 3.3Maldives 72.9 59.2 10.5 10.1 3.7 3.4 8.7 22.7 0.1 0.9 0.4 0.7 2.9 2.6 0.8 0.5Nepal 69.1 85.1 12.6 7.9 2.0 1.1 5.8 3.9 0.8 0.2 0.1 0.0 1.9 0.7 7.7 1.0Sri Lanka 53.8 69.5 13.8 12.0 4.5 3.1 9.1 10.3 0.5 0.6 0.5 0.2 3.4 2.0 14.4 2.2
Southeast AsiaBrunei Darussalam 69.3 78.5 16.0 17.2 10.8 2.4 0.2 0.4 0.1 0.1 0.1 0.1 2.2 0.7 1.3 0.6Cambodia 75.9 88.9 8.2 3.1 2.8 2.4 0.1 0.9 0.1 0.2 0.0 0.0 0.5 0.2 12.4 4.3Indonesia 50.9 67.7 13.9 9.4 12.3 6.5 8.4 5.0 1.5 2.8 2.4 2.3 6.0 3.9 4.6 2.4Lao PDR 89.5 96.1 6.8 2.3 0.7 0.4 0.0 0.0 0.0 0.0 0.0 0.0 0.9 0.3 2.0 0.9Malaysia 57.3 63.1 12.5 10.6 17.3 9.0 2.0 5.3 0.6 2.1 0.4 1.3 2.3 2.7 7.5 5.9Myanmar 86.5 93.1 4.6 3.6 0.6 1.1 0.2 0.3 0.0 0.2 0.0 0.0 0.6 0.6 7.4 1.1Philippines 48.9 64.2 10.1 9.9 19.4 10.7 10.5 5.5 0.7 1.0 0.2 0.1 3.0 1.9 7.3 6.7Singapore 54.5 51.3 14.1 16.2 15.8 12.3 8.2 8.4 0.3 1.3 0.4 0.4 1.9 1.5 4.9 8.5Thailand 53.2 60.6 12.6 12.4 12.6 7.7 10.2 9.0 1.1 1.6 1.3 0.9 2.3 2.5 6.8 5.2Viet Nam 68.7 77.9 11.8 6.3 2.6 3.9 1.2 2.1 0.4 2.5 0.3 0.2 2.3 1.5 12.8 5.4
The PacificCook Islandsc 1.9 2.8 0.2 0.1 8.6 6.1 0.0 0.0 0.0 0.0 0.0 0.0 85.0 69.1 4.3 21.9Fiji 26.9 53.2 3.7 9.4 3.7 3.6 0.0 0.3 0.3 0.1 0.1 0.2 64.1 31.1 1.2 2.2Kiribatib 26.1 50.5 3.8 1.8 9.8 3.8 0.0 0.0 0.1 0.1 0.0 0.1 59.2 41.9 1.0 1.7Marshall Islandsd 4.9 8.6 0.0 0.0 32.6 24.5 0.0 0.0 0.0 0.0 0.0 0.0 2.2 6.5 60.3 60.3Micronesia, Fed. States of c 31.2 23.6 0.0 0.0 59.9 59.0 0.0 0.0 0.0 0.0 0.0 0.0 6.7 6.4 2.2 11.0Nauru b 6.3 9.1 8.2 5.2 10.7 2.4 0.0 0.0 0.0 0.0 48.2 0.1 26.3 69.7 0.4 13.6Palau b 98.5 91.6 0.9 4.3 0.0 0.0 0.0 0.0 0.3 0.0 0.0 0.0 0.3 4.0 0.0 0.0Papua New Guinea 37.6 57.0 3.1 3.8 2.3 4.6 0.1 0.1 0.2 0.1 0.9 0.3 53.7 28.6 2.1 5.5Samoa 15.9 41.0 1.1 0.8 25.9 5.9 0.1 0.3 2.1 0.3 0.0 0.1 52.1 48.5 2.7 3.0Solomon Islands 38.6 44.4 2.6 1.8 5.2 1.6 0.0 0.1 0.1 0.1 0.5 1.8 39.0 38.7 14.1 11.6Timor-Leste b 90.9 89.2 8.0 5.5 1.0 0.4 0.0 0.0 0.0 1.1 0.0 0.4 0.1 3.4 0.0 0.0Tonga 31.3 23.2 4.7 2.2 10.3 6.8 0.0 0.0 0.2 0.7 0.0 0.0 52.6 65.9 1.0 1.1Tuvalu b 3.0 50.1 11.9 1.3 0.0 0.6 0.0 0.0 0.0 0.0 0.0 1.1 85.0 46.0 0.0 0.9Vanuatu 42.5 48.1 6.7 3.8 1.3 1.5 0.0 0.0 0.3 0.1 0.2 1.5 42.1 41.1 6.9 3.8
Developed Member EconomiesAustralia 41.1 55.5 22.7 18.7 22.1 13.1 2.8 1.7 0.8 1.0 0.9 1.1 5.5 4.1 4.1 4.8Japan 37.1 45.6 15.0 15.0 22.2 12.9 13.0 12.2 2.0 2.8 1.3 1.8 4.6 6.2 4.8 3.6New Zealand 28.5 46.9 18.6 19.6 19.6 13.7 5.6 3.9 1.1 1.2 1.2 0.6 22.5 12.0 2.8 1.9
DEVELOPING MEMBER ECONOMIES e 52.3 50.3 14.5 14.5 13.6 9.0 6.7 8.3 1.1 3.3 1.5 2.3 2.6 3.1 7.7 9.2REGIONAL MEMBERS e 48.1 49.9 15.0 14.8 16.0 9.7 7.9 8.5 1.3 3.1 1.4 2.2 3.4 3.5 6.9 8.4WORLD 25.8 33.5 40.0 36.4 20.3 14.1 4.1 5.1 2.6 3.1 2.1 2.2 1.3 1.5 3.7 4.1
0.0 = magnitude is less than half of unit employed, Lao PDR = Lao People’s Democratic Republic.
a Economies are classified following Taipei,China’s trade groupings. Data under the heading “Middle East” refer to “Middle and Near East” economies. b Based on reporting partner-country data. For Timor-Leste, data for 2000 refer to 2004.c Data for 2015 refer to 2013.d Data for 2015 refer to 2006.e For reporting economies only.
Sources: International Monetary Fund. May 2016. International Financial Statistics (CD-ROM). Washington, DC; for the Cook Islands; the Federated States of Micronesia; and Taipei,China: economy sources.
ToFrom
199GlobalizationRegional Trends and Tables
International Reserves
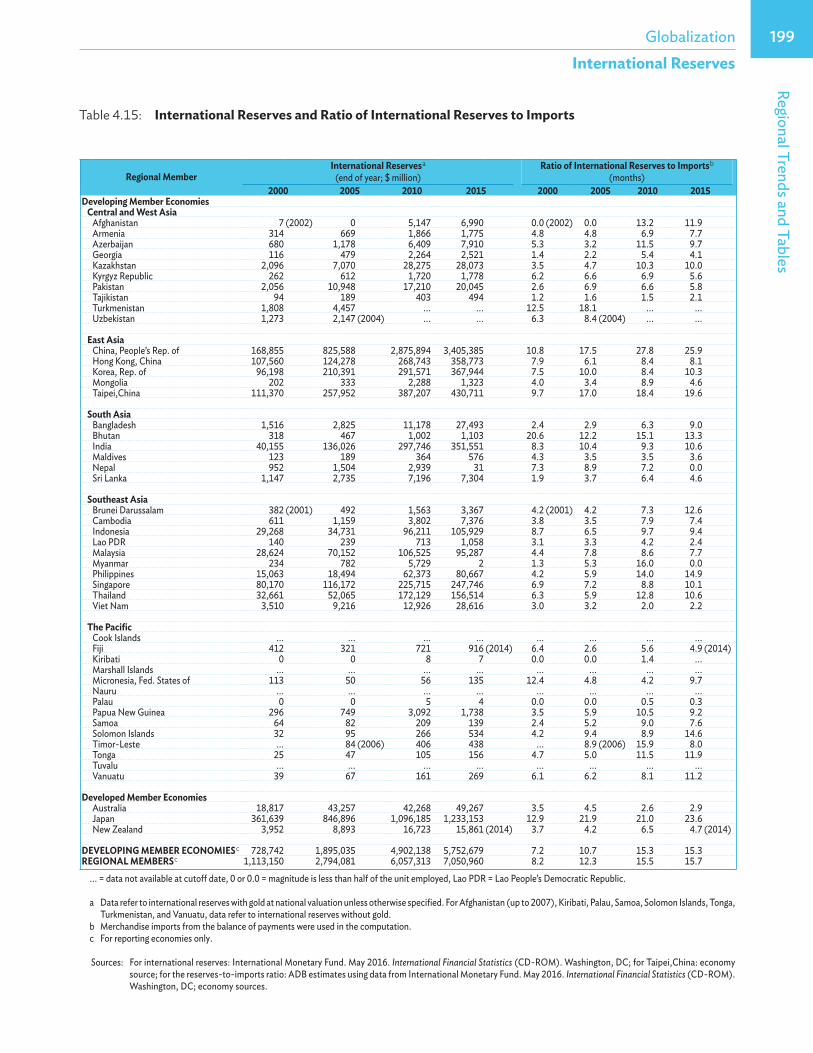
Table 4.15: International Reserves and Ratio of International Reserves to Imports
Regional MemberInternational Reserves a
(end of year; $ million)Ratio of International Reserves to Imports b
(months)2000 2005 2010 2015 2000 2005 2010 2015
Developing Member Economies Central and West Asia
Afghanistan 7 (2002) 0 5,147 6,990 0.0 (2002) 0.0 13.2 11.9Armenia 314 669 1,866 1,775 4.8 4.8 6.9 7.7Azerbaijan 680 1,178 6,409 7,910 5.3 3.2 11.5 9.7Georgia 116 479 2,264 2,521 1.4 2.2 5.4 4.1Kazakhstan 2,096 7,070 28,275 28,073 3.5 4.7 10.3 10.0Kyrgyz Republic 262 612 1,720 1,778 6.2 6.6 6.9 5.6Pakistan 2,056 10,948 17,210 20,045 2.6 6.9 6.6 5.8Tajikistan 94 189 403 494 1.2 1.6 1.5 2.1Turkmenistan 1,808 4,457 ... ... 12.5 18.1 ... ...Uzbekistan 1,273 2,147 (2004) ... ... 6.3 8.4 (2004) ... ...
East AsiaChina, People’s Rep. of 168,855 825,588 2,875,894 3,405,385 10.8 17.5 27.8 25.9Hong Kong, China 107,560 124,278 268,743 358,773 7.9 6.1 8.4 8.1Korea, Rep. of 96,198 210,391 291,571 367,944 7.5 10.0 8.4 10.3Mongolia 202 333 2,288 1,323 4.0 3.4 8.9 4.6Taipei,China 111,370 257,952 387,207 430,711 9.7 17.0 18.4 19.6
South AsiaBangladesh 1,516 2,825 11,178 27,493 2.4 2.9 6.3 9.0Bhutan 318 467 1,002 1,103 20.6 12.2 15.1 13.3India 40,155 136,026 297,746 351,551 8.3 10.4 9.3 10.6Maldives 123 189 364 576 4.3 3.5 3.5 3.6Nepal 952 1,504 2,939 31 7.3 8.9 7.2 0.0Sri Lanka 1,147 2,735 7,196 7,304 1.9 3.7 6.4 4.6
Southeast AsiaBrunei Darussalam 382 (2001) 492 1,563 3,367 4.2 (2001) 4.2 7.3 12.6Cambodia 611 1,159 3,802 7,376 3.8 3.5 7.9 7.4Indonesia 29,268 34,731 96,211 105,929 8.7 6.5 9.7 9.4Lao PDR 140 239 713 1,058 3.1 3.3 4.2 2.4Malaysia 28,624 70,152 106,525 95,287 4.4 7.8 8.6 7.7Myanmar 234 782 5,729 2 1.3 5.3 16.0 0.0Philippines 15,063 18,494 62,373 80,667 4.2 5.9 14.0 14.9Singapore 80,170 116,172 225,715 247,746 6.9 7.2 8.8 10.1Thailand 32,661 52,065 172,129 156,514 6.3 5.9 12.8 10.6Viet Nam 3,510 9,216 12,926 28,616 3.0 3.2 2.0 2.2
The PacificCook Islands ... ... ... ... ... ... ... ...Fiji 412 321 721 916 (2014) 6.4 2.6 5.6 4.9 (2014)Kiribati 0 0 8 7 0.0 0.0 1.4 ...Marshall Islands ... ... ... ... ... ... ... ...Micronesia, Fed. States of 113 50 56 135 12.4 4.8 4.2 9.7Nauru ... ... ... ... ... ... ... ...Palau 0 0 5 4 0.0 0.0 0.5 0.3Papua New Guinea 296 749 3,092 1,738 3.5 5.9 10.5 9.2Samoa 64 82 209 139 2.4 5.2 9.0 7.6Solomon Islands 32 95 266 534 4.2 9.4 8.9 14.6Timor-Leste ... 84 (2006) 406 438 ... 8.9 (2006) 15.9 8.0Tonga 25 47 105 156 4.7 5.0 11.5 11.9Tuvalu ... ... ... ... ... ... ... ...Vanuatu 39 67 161 269 6.1 6.2 8.1 11.2
Developed Member EconomiesAustralia 18,817 43,257 42,268 49,267 3.5 4.5 2.6 2.9Japan 361,639 846,896 1,096,185 1,233,153 12.9 21.9 21.0 23.6New Zealand 3,952 8,893 16,723 15,861 (2014) 3.7 4.2 6.5 4.7 (2014)
DEVELOPING MEMBER ECONOMIES c 728,742 1,895,035 4,902,138 5,752,679 7.2 10.7 15.3 15.3REGIONAL MEMBERS c 1,113,150 2,794,081 6,057,313 7,050,960 8.2 12.3 15.5 15.7
... = data not available at cutoff date, 0 or 0.0 = magnitude is less than half of the unit employed, Lao PDR = Lao People’s Democratic Republic.
a Data refer to international reserves with gold at national valuation unless otherwise specified. For Afghanistan (up to 2007), Kiribati, Palau, Samoa, Solomon Islands, Tonga, Turkmenistan, and Vanuatu, data refer to international reserves without gold.
b Merchandise imports from the balance of payments were used in the computation.c For reporting economies only.
Sources: For international reserves: International Monetary Fund. May 2016. International Financial Statistics (CD-ROM). Washington, DC; for Taipei,China: economy source; for the reserves-to-imports ratio: ADB estimates using data from International Monetary Fund. May 2016. International Financial Statistics (CD-ROM). Washington, DC; economy sources.
200 Key Indicators for Asia and the Pacific 2016Capital Flows
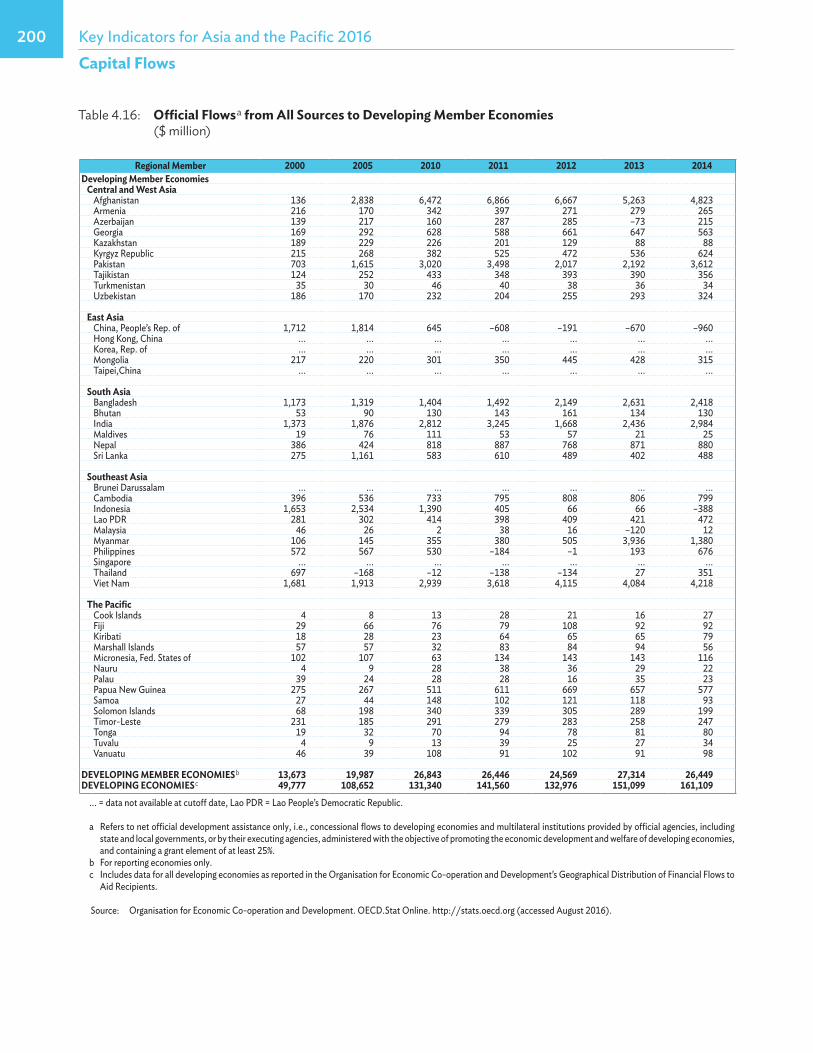
Table 4.16: Official Flows a from All Sources to Developing Member Economies ($ million)
Regional Member 2000 2005 2010 2011 2012 2013 2014Developing Member Economies Central and West Asia
Afghanistan 136 2,838 6,472 6,866 6,667 5,263 4,823Armenia 216 170 342 397 271 279 265Azerbaijan 139 217 160 287 285 –73 215Georgia 169 292 628 588 661 647 563Kazakhstan 189 229 226 201 129 88 88Kyrgyz Republic 215 268 382 525 472 536 624Pakistan 703 1,615 3,020 3,498 2,017 2,192 3,612Tajikistan 124 252 433 348 393 390 356Turkmenistan 35 30 46 40 38 36 34Uzbekistan 186 170 232 204 255 293 324
East AsiaChina, People’s Rep. of 1,712 1,814 645 –608 –191 –670 –960Hong Kong, China ... ... ... ... ... ... ...Korea, Rep. of ... ... ... ... ... ... ...Mongolia 217 220 301 350 445 428 315Taipei,China ... ... ... ... ... ... ...
South AsiaBangladesh 1,173 1,319 1,404 1,492 2,149 2,631 2,418Bhutan 53 90 130 143 161 134 130India 1,373 1,876 2,812 3,245 1,668 2,436 2,984Maldives 19 76 111 53 57 21 25Nepal 386 424 818 887 768 871 880Sri Lanka 275 1,161 583 610 489 402 488
Southeast AsiaBrunei Darussalam ... ... ... ... ... ... ...Cambodia 396 536 733 795 808 806 799Indonesia 1,653 2,534 1,390 405 66 66 –388Lao PDR 281 302 414 398 409 421 472Malaysia 46 26 2 38 16 –120 12Myanmar 106 145 355 380 505 3,936 1,380Philippines 572 567 530 –184 –1 193 676Singapore ... ... ... ... ... ... ...Thailand 697 –168 –12 –138 –134 27 351Viet Nam 1,681 1,913 2,939 3,618 4,115 4,084 4,218
The PacificCook Islands 4 8 13 28 21 16 27Fiji 29 66 76 79 108 92 92Kiribati 18 28 23 64 65 65 79Marshall Islands 57 57 32 83 84 94 56Micronesia, Fed. States of 102 107 63 134 143 143 116Nauru 4 9 28 38 36 29 22Palau 39 24 28 28 16 35 23Papua New Guinea 275 267 511 611 669 657 577Samoa 27 44 148 102 121 118 93Solomon Islands 68 198 340 339 305 289 199Timor-Leste 231 185 291 279 283 258 247Tonga 19 32 70 94 78 81 80Tuvalu 4 9 13 39 25 27 34Vanuatu 46 39 108 91 102 91 98
DEVELOPING MEMBER ECONOMIES b 13,673 19,987 26,843 26,446 24,569 27,314 26,449DEVELOPING ECONOMIES c 49,777 108,652 131,340 141,560 132,976 151,099 161,109
... = data not available at cutoff date, Lao PDR = Lao People’s Democratic Republic.
a Refers to net official development assistance only, i.e., concessional flows to developing economies and multilateral institutions provided by official agencies, including state and local governments, or by their executing agencies, administered with the objective of promoting the economic development and welfare of developing economies, and containing a grant element of at least 25%.
b For reporting economies only.c Includes data for all developing economies as reported in the Organisation for Economic Co-operation and Development’s Geographical Distribution of Financial Flows to
Aid Recipients.
Source: Organisation for Economic Co-operation and Development. OECD.Stat Online. http://stats.oecd.org (accessed August 2016).
201GlobalizationRegional Trends and Tables
Capital Flows
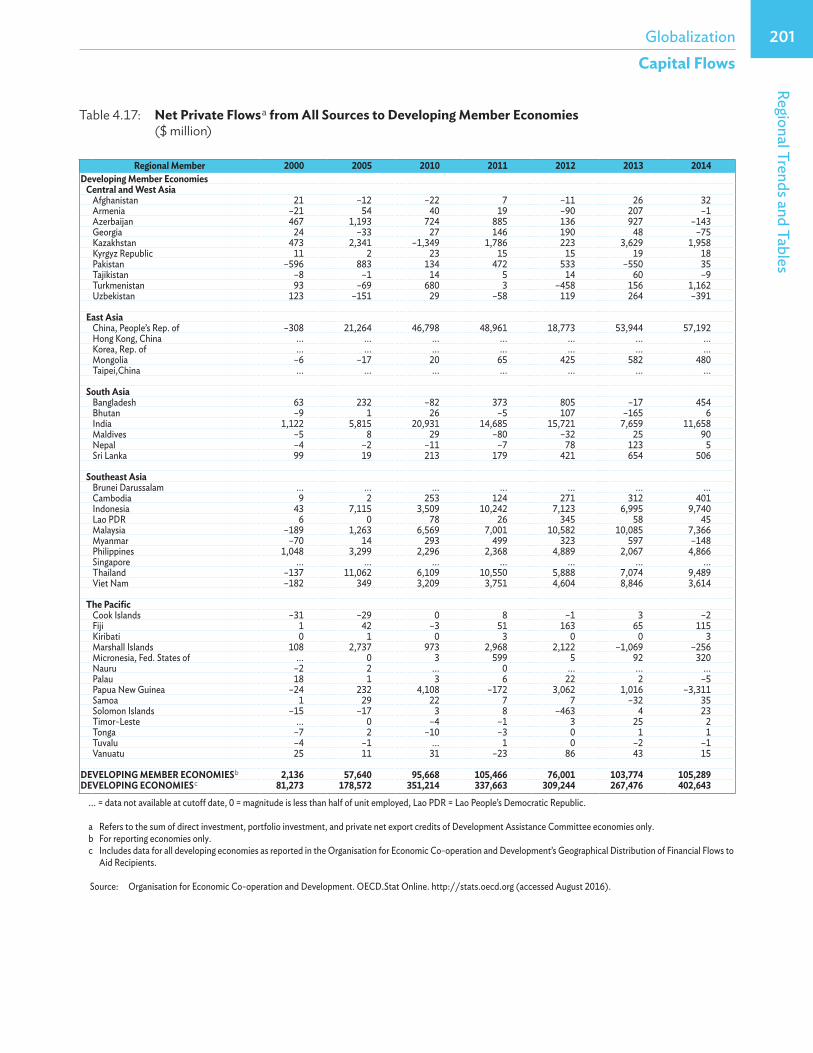
Table 4.17: Net Private Flows a from All Sources to Developing Member Economies ($ million)
Regional Member 2000 2005 2010 2011 2012 2013 2014Developing Member Economies Central and West Asia
Afghanistan 21 –12 –22 7 –11 26 32Armenia –21 54 40 19 –90 207 –1Azerbaijan 467 1,193 724 885 136 927 –143Georgia 24 –33 27 146 190 48 –75Kazakhstan 473 2,341 –1,349 1,786 223 3,629 1,958Kyrgyz Republic 11 2 23 15 15 19 18Pakistan –596 883 134 472 533 –550 35Tajikistan –8 –1 14 5 14 60 –9Turkmenistan 93 –69 680 3 –458 156 1,162Uzbekistan 123 –151 29 –58 119 264 –391
East AsiaChina, People’s Rep. of –308 21,264 46,798 48,961 18,773 53,944 57,192Hong Kong, China ... ... ... ... ... ... ...Korea, Rep. of ... ... ... ... ... ... ...Mongolia –6 –17 20 65 425 582 480Taipei,China ... ... ... ... ... ... ...
South AsiaBangladesh 63 232 –82 373 805 –17 454Bhutan –9 1 26 –5 107 –165 6India 1,122 5,815 20,931 14,685 15,721 7,659 11,658Maldives –5 8 29 –80 –32 25 90Nepal –4 –2 –11 –7 78 123 5Sri Lanka 99 19 213 179 421 654 506
Southeast AsiaBrunei Darussalam ... ... ... ... ... ... ...Cambodia 9 2 253 124 271 312 401Indonesia 43 7,115 3,509 10,242 7,123 6,995 9,740Lao PDR 6 0 78 26 345 58 45Malaysia –189 1,263 6,569 7,001 10,582 10,085 7,366Myanmar –70 14 293 499 323 597 –148Philippines 1,048 3,299 2,296 2,368 4,889 2,067 4,866Singapore ... ... ... ... ... ... ...Thailand –137 11,062 6,109 10,550 5,888 7,074 9,489Viet Nam –182 349 3,209 3,751 4,604 8,846 3,614
The PacificCook Islands –31 –29 0 8 –1 3 –2Fiji 1 42 –3 51 163 65 115Kiribati 0 1 0 3 0 0 3Marshall Islands 108 2,737 973 2,968 2,122 –1,069 –256Micronesia, Fed. States of ... 0 3 599 5 92 320Nauru –2 2 ... 0 ... ... ...Palau 18 1 3 6 22 2 –5Papua New Guinea –24 232 4,108 –172 3,062 1,016 –3,311Samoa 1 29 22 7 7 –32 35Solomon Islands –15 –17 3 8 –463 4 23Timor-Leste ... 0 –4 –1 3 25 2Tonga –7 2 –10 –3 0 1 1Tuvalu –4 –1 ... 1 0 –2 –1Vanuatu 25 11 31 –23 86 43 15
DEVELOPING MEMBER ECONOMIES b 2,136 57,640 95,668 105,466 76,001 103,774 105,289DEVELOPING ECONOMIES c 81,273 178,572 351,214 337,663 309,244 267,476 402,643
... = data not available at cutoff date, 0 = magnitude is less than half of unit employed, Lao PDR = Lao People’s Democratic Republic.
a Refers to the sum of direct investment, portfolio investment, and private net export credits of Development Assistance Committee economies only. b For reporting economies only.c Includes data for all developing economies as reported in the Organisation for Economic Co-operation and Development’s Geographical Distribution of Financial Flows to
Aid Recipients.
Source: Organisation for Economic Co-operation and Development. OECD.Stat Online. http://stats.oecd.org (accessed August 2016).
202 Key Indicators for Asia and the Pacific 2016Capital Flows
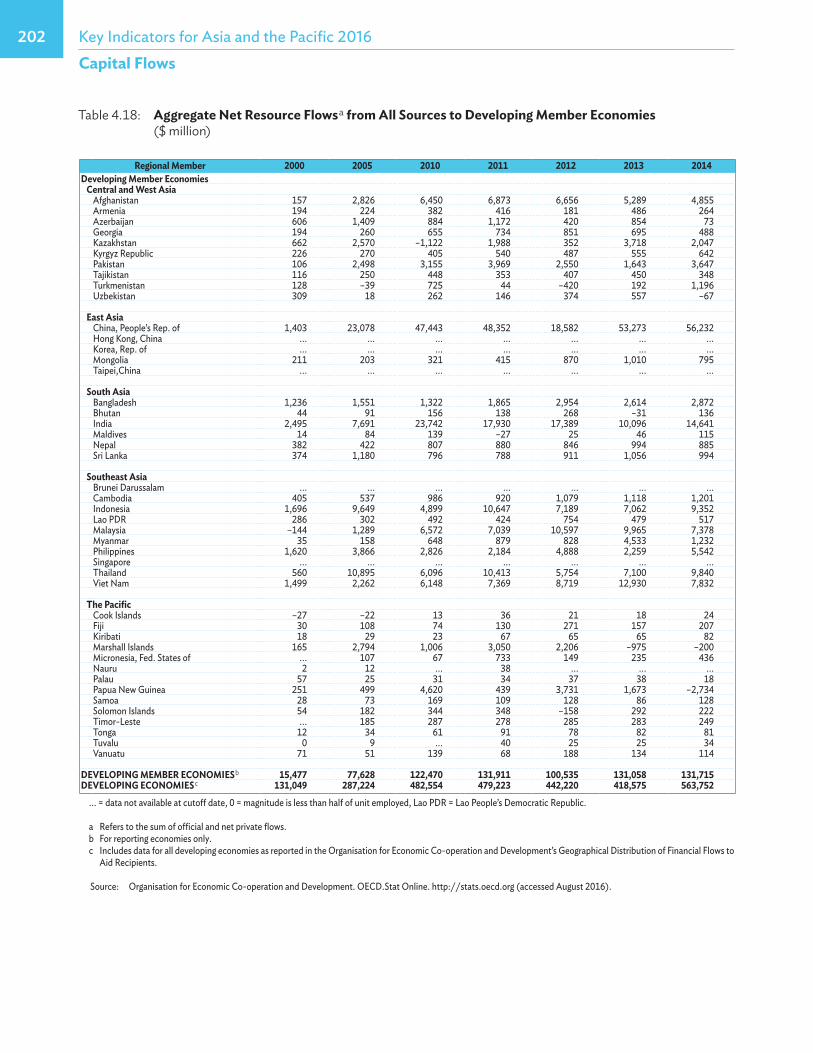
Table 4.18: Aggregate Net Resource Flows a from All Sources to Developing Member Economies ($ million)
Regional Member 2000 2005 2010 2011 2012 2013 2014Developing Member Economies Central and West Asia
Afghanistan 157 2,826 6,450 6,873 6,656 5,289 4,855Armenia 194 224 382 416 181 486 264Azerbaijan 606 1,409 884 1,172 420 854 73Georgia 194 260 655 734 851 695 488Kazakhstan 662 2,570 –1,122 1,988 352 3,718 2,047Kyrgyz Republic 226 270 405 540 487 555 642Pakistan 106 2,498 3,155 3,969 2,550 1,643 3,647Tajikistan 116 250 448 353 407 450 348Turkmenistan 128 –39 725 44 –420 192 1,196Uzbekistan 309 18 262 146 374 557 –67
East AsiaChina, People’s Rep. of 1,403 23,078 47,443 48,352 18,582 53,273 56,232Hong Kong, China ... ... ... ... ... ... ...Korea, Rep. of ... ... ... ... ... ... ...Mongolia 211 203 321 415 870 1,010 795Taipei,China ... ... ... ... ... ... ...
South AsiaBangladesh 1,236 1,551 1,322 1,865 2,954 2,614 2,872Bhutan 44 91 156 138 268 –31 136India 2,495 7,691 23,742 17,930 17,389 10,096 14,641Maldives 14 84 139 –27 25 46 115Nepal 382 422 807 880 846 994 885Sri Lanka 374 1,180 796 788 911 1,056 994
Southeast AsiaBrunei Darussalam ... ... ... ... ... ... ...Cambodia 405 537 986 920 1,079 1,118 1,201Indonesia 1,696 9,649 4,899 10,647 7,189 7,062 9,352Lao PDR 286 302 492 424 754 479 517Malaysia –144 1,289 6,572 7,039 10,597 9,965 7,378Myanmar 35 158 648 879 828 4,533 1,232Philippines 1,620 3,866 2,826 2,184 4,888 2,259 5,542Singapore ... ... ... ... ... ... ...Thailand 560 10,895 6,096 10,413 5,754 7,100 9,840Viet Nam 1,499 2,262 6,148 7,369 8,719 12,930 7,832
The PacificCook Islands –27 –22 13 36 21 18 24Fiji 30 108 74 130 271 157 207Kiribati 18 29 23 67 65 65 82Marshall Islands 165 2,794 1,006 3,050 2,206 –975 –200Micronesia, Fed. States of ... 107 67 733 149 235 436Nauru 2 12 ... 38 ... ... ...Palau 57 25 31 34 37 38 18Papua New Guinea 251 499 4,620 439 3,731 1,673 –2,734Samoa 28 73 169 109 128 86 128Solomon Islands 54 182 344 348 –158 292 222Timor-Leste ... 185 287 278 285 283 249Tonga 12 34 61 91 78 82 81Tuvalu 0 9 ... 40 25 25 34Vanuatu 71 51 139 68 188 134 114
DEVELOPING MEMBER ECONOMIES b 15,477 77,628 122,470 131,911 100,535 131,058 131,715DEVELOPING ECONOMIES c 131,049 287,224 482,554 479,223 442,220 418,575 563,752
... = data not available at cutoff date, 0 = magnitude is less than half of unit employed, Lao PDR = Lao People’s Democratic Republic.
a Refers to the sum of official and net private flows. b For reporting economies only.c Includes data for all developing economies as reported in the Organisation for Economic Co-operation and Development’s Geographical Distribution of Financial Flows to
Aid Recipients.
Source: Organisation for Economic Co-operation and Development. OECD.Stat Online. http://stats.oecd.org (accessed August 2016).
203GlobalizationRegional Trends and Tables
External Indebtedness
Table 4.19: Total External Debt of Developing Member Economies a ($ million)
Regional Member Total External Debt External Debt, Public and Publicly Guaranteed2000 2005 2010 2014 2000 2005 2010 2014
Developing Member Economies Central and West Asia
Afghanistan ... 969 (2006) 2,423 2,555 ... 911 (2006) 1,966 1,999Armenia 1,010 1,968 6,304 8,551 675 923 2,557 3,376Azerbaijan 1,524 2,118 7,029 11,693 734 1,362 3,711 8,094Georgia 1,825 2,151 9,656 13,912 1,274 1,531 4,141 5,338Kazakhstan 12,890 43,857 119,145 157,595 3,623 2,177 3,845 15,080Kyrgyz Republic 1,938 2,257 4,114 7,257 1,220 1,665 2,442 3,222Pakistan 32,954 34,018 64,003 62,184 27,124 30,089 43,403 45,879Tajikistan 1,141 1,121 3,082 4,047 755 826 1,806 2,049Turkmenistan 2,509 1,158 529 441 2,171 878 359 263Uzbekistan 4,980 4,656 7,796 13,389 3,762 3,626 3,423 5,653
East AsiaChina, People’s Rep. of 145,648 281,113 559,772 959,510 94,470 82,015 90,637 83,306Hong Kong, Chinab 208,260 470,288 879,034 1,303,784 (2015) ... ... ... ...Korea, Rep. of 135,208 161,956 355,911 395,400 (2015) 52,128 39,665 120,636 158,701 (2015)Mongolia 960 1,396 5,928 20,826 833 1,267 1,782 3,498Taipei,China 34,757 86,732 101,581 158,954 (2015) 23 222 8,035 1,116 (2015)
South AsiaBangladesh 15,596 18,449 25,752 34,925 14,985 17,385 21,400 26,433Bhutan 212 657 935 1,840 202 636 919 1,820India 101,130 121,195 291,651 463,230 81,195 54,726 101,786 164,122Maldives 206 362 994 1,026 185 300 628 712Nepal 2,878 3,191 3,789 4,010 2,826 3,112 3,509 3,512Sri Lanka 9,241 11,297 21,762 43,609 7,936 9,655 16,507 29,502
Southeast AsiaBrunei Darussalam ... ... ... ... ... ... ... ...Cambodia 2,648 3,525 3,745 6,811 2,328 3,141 3,335 5,566Indonesia 143,655 141,820 198,268 293,397 69,649 77,405 103,388 143,068Lao PDR 2,535 3,277 6,487 10,724 2,474 2,354 3,771 5,631Malaysia 41,946 64,911 133,800 210,820 19,125 34,387 61,858 66,237Myanmar 5,875 6,674 8,217 6,351 5,328 5,815 6,646 5,175Philippines 58,456 58,693 65,304 77,659 33,744 35,364 45,040 38,014Singapore ... ... ... ... ... ... ... ...Thailand 79,830 58,464 106,323 135,799 29,462 17,449 21,172 33,420Viet Nam 12,859 19,039 44,923 71,890 11,558 16,193 32,764 44,818
The PacificCook Islands 55 71 76 72 (2015) ... ... ... ...Fiji 182 196 553 864 172 185 388 701Kiribati 8 11 14 21 (2015) ... ... ... ...Marshall Islands 105 92 105 95 (2015) ... ... ... ...Micronesia, Fed. States of 63 62 86 81 (2015) ... ... ... ...Nauru ... ... ... ... ... ... ... ...Palau 58 60 67 60 (2015) ... ... ... ...Papua New Guinea 2,305 1,896 5,965 20,920 1,454 1,264 1,042 1,656Samoa 139 169 325 450 138 167 299 417Solomon Islands 156 167 231 187 121 144 125 90Timor-Leste ... ... ... ... ... ... ... ...Tonga 74 89 154 196 65 80 144 186Tuvalu 4 10 (2006) 16 14 (2013) ... ... ... ...Vanuatu 96 105 173 181 73 72 99 77
DEVELOPING MEMBER ECONOMIESc 1,065,919 1,610,241 3,046,021 4,505,331 471,814 446,990 713,562 908,731DEVELOPING ECONOMIES d 2,121,479 2,809,078 5,002,431 7,251,871 1,105,394 1,154,662 1,522,780 2,102,721
... = data not available at cutoff date, Lao PDR = Lao People’s Democratic Republic.
a Refers to the sum of public and publicly guaranteed long-term debt, private nonguaranteed long-term debt, use of International Monetary Fund credit, and estimated short-term debt.
b Data in 2000 and 2005 onward are not comparable due to a change in coverage or compilation methodology.c For reporting economies only.d Includes data for all developing economies as reported in the World Bank’s Global Development Finance Online. For developing member economies not covered by the
World Bank, data are from economy sources.
Sources: World Development Indicators and International Debt Statistics. http://data.worldbank.org/data-catalog/world-development-indicators (accessed August 2016); Organisation for Economic Co-operation and Development. Statistical Compendium 2004/1 (CD-ROM). Paris; economy sources.
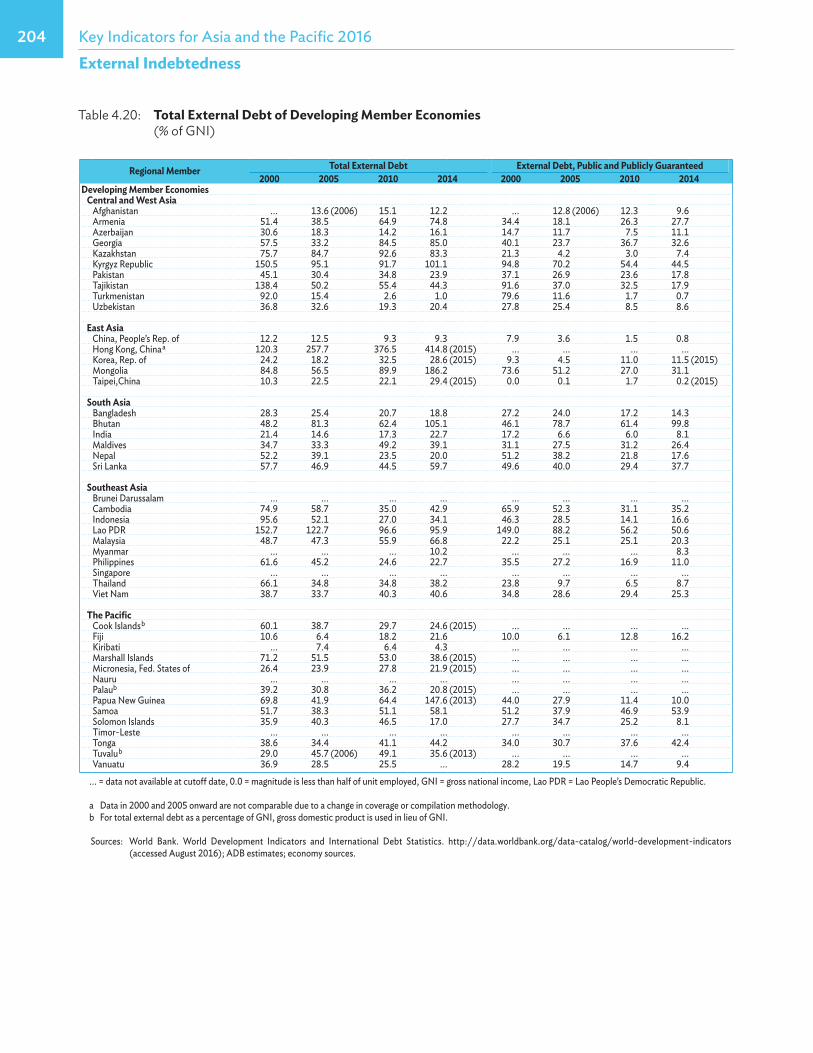
204 Key Indicators for Asia and the Pacific 2016External Indebtedness
Table 4.20: Total External Debt of Developing Member Economies (% of GNI)
Regional Member Total External Debt External Debt, Public and Publicly Guaranteed2000 2005 2010 2014 2000 2005 2010 2014
Developing Member Economies Central and West Asia
Afghanistan ... 13.6 (2006) 15.1 12.2 ... 12.8 (2006) 12.3 9.6Armenia 51.4 38.5 64.9 74.8 34.4 18.1 26.3 27.7Azerbaijan 30.6 18.3 14.2 16.1 14.7 11.7 7.5 11.1Georgia 57.5 33.2 84.5 85.0 40.1 23.7 36.7 32.6Kazakhstan 75.7 84.7 92.6 83.3 21.3 4.2 3.0 7.4Kyrgyz Republic 150.5 95.1 91.7 101.1 94.8 70.2 54.4 44.5Pakistan 45.1 30.4 34.8 23.9 37.1 26.9 23.6 17.8Tajikistan 138.4 50.2 55.4 44.3 91.6 37.0 32.5 17.9Turkmenistan 92.0 15.4 2.6 1.0 79.6 11.6 1.7 0.7Uzbekistan 36.8 32.6 19.3 20.4 27.8 25.4 8.5 8.6
East AsiaChina, People’s Rep. of 12.2 12.5 9.3 9.3 7.9 3.6 1.5 0.8Hong Kong, China a 120.3 257.7 376.5 414.8 (2015) ... ... ... ...Korea, Rep. of 24.2 18.2 32.5 28.6 (2015) 9.3 4.5 11.0 11.5 (2015)Mongolia 84.8 56.5 89.9 186.2 73.6 51.2 27.0 31.1Taipei,China 10.3 22.5 22.1 29.4 (2015) 0.0 0.1 1.7 0.2 (2015)
South AsiaBangladesh 28.3 25.4 20.7 18.8 27.2 24.0 17.2 14.3Bhutan 48.2 81.3 62.4 105.1 46.1 78.7 61.4 99.8India 21.4 14.6 17.3 22.7 17.2 6.6 6.0 8.1Maldives 34.7 33.3 49.2 39.1 31.1 27.5 31.2 26.4Nepal 52.2 39.1 23.5 20.0 51.2 38.2 21.8 17.6Sri Lanka 57.7 46.9 44.5 59.7 49.6 40.0 29.4 37.7
Southeast AsiaBrunei Darussalam ... ... ... ... ... ... ... ...Cambodia 74.9 58.7 35.0 42.9 65.9 52.3 31.1 35.2Indonesia 95.6 52.1 27.0 34.1 46.3 28.5 14.1 16.6Lao PDR 152.7 122.7 96.6 95.9 149.0 88.2 56.2 50.6Malaysia 48.7 47.3 55.9 66.8 22.2 25.1 25.1 20.3Myanmar ... ... ... 10.2 ... ... ... 8.3Philippines 61.6 45.2 24.6 22.7 35.5 27.2 16.9 11.0Singapore ... ... ... ... ... ... ... ...Thailand 66.1 34.8 34.8 38.2 23.8 9.7 6.5 8.7Viet Nam 38.7 33.7 40.3 40.6 34.8 28.6 29.4 25.3
The PacificCook Islands b 60.1 38.7 29.7 24.6 (2015) ... ... ... ...Fiji 10.6 6.4 18.2 21.6 10.0 6.1 12.8 16.2Kiribati ... 7.4 6.4 4.3 ... ... ... ...Marshall Islands 71.2 51.5 53.0 38.6 (2015) ... ... ... ...Micronesia, Fed. States of 26.4 23.9 27.8 21.9 (2015) ... ... ... ...Nauru ... ... ... ... ... ... ... ...Palaub 39.2 30.8 36.2 20.8 (2015) ... ... ... ...Papua New Guinea 69.8 41.9 64.4 147.6 (2013) 44.0 27.9 11.4 10.0Samoa 51.7 38.3 51.1 58.1 51.2 37.9 46.9 53.9Solomon Islands 35.9 40.3 46.5 17.0 27.7 34.7 25.2 8.1Timor-Leste ... ... ... ... ... ... ... ...Tonga 38.6 34.4 41.1 44.2 34.0 30.7 37.6 42.4Tuvalu b 29.0 45.7 (2006) 49.1 35.6 (2013) ... ... ... ...Vanuatu 36.9 28.5 25.5 ... 28.2 19.5 14.7 9.4
... = data not available at cutoff date, 0.0 = magnitude is less than half of unit employed, GNI = gross national income, Lao PDR = Lao People’s Democratic Republic.
a Data in 2000 and 2005 onward are not comparable due to a change in coverage or compilation methodology.b For total external debt as a percentage of GNI, gross domestic product is used in lieu of GNI.
Sources: World Bank. World Development Indicators and International Debt Statistics. http://data.worldbank.org/data-catalog/world-development-indicators (accessed August 2016); ADB estimates; economy sources.
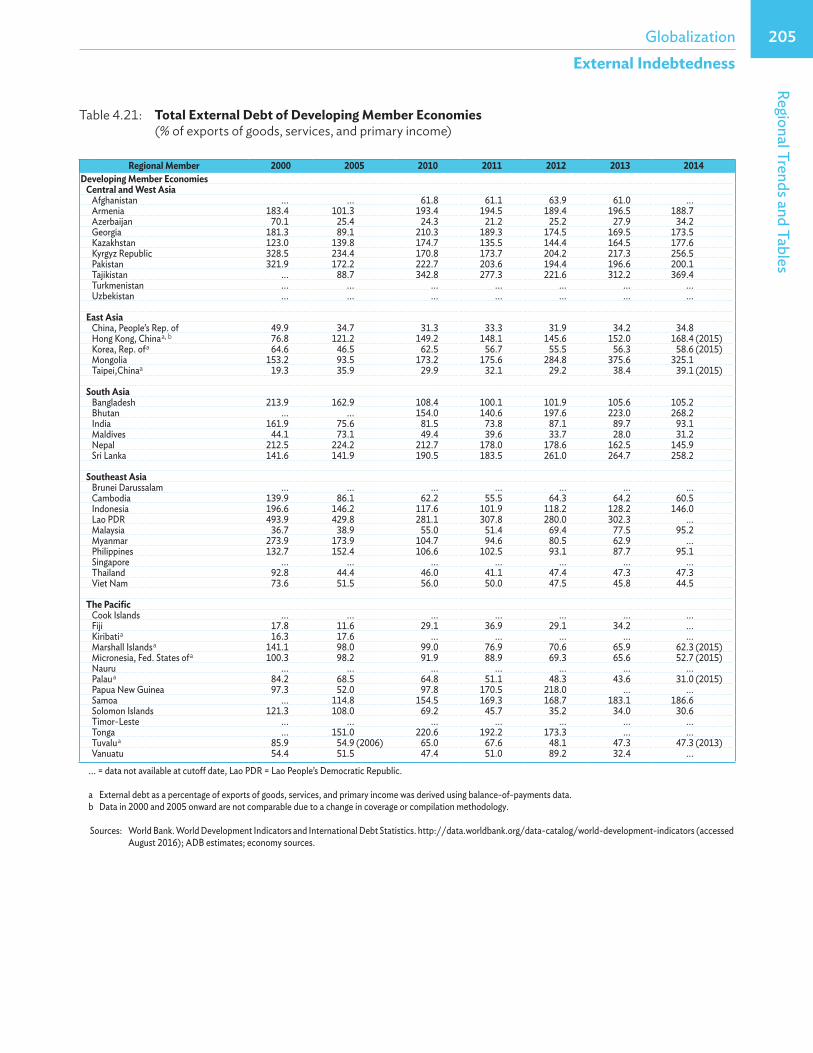
205GlobalizationRegional Trends and Tables
External Indebtedness
Table 4.21: Total External Debt of Developing Member Economies (% of exports of goods, services, and primary income)
Regional Member 2000 2005 2010 2011 2012 2013 2014Developing Member Economies Central and West Asia
Afghanistan ... ... 61.8 61.1 63.9 61.0 ...Armenia 183.4 101.3 193.4 194.5 189.4 196.5 188.7Azerbaijan 70.1 25.4 24.3 21.2 25.2 27.9 34.2Georgia 181.3 89.1 210.3 189.3 174.5 169.5 173.5Kazakhstan 123.0 139.8 174.7 135.5 144.4 164.5 177.6Kyrgyz Republic 328.5 234.4 170.8 173.7 204.2 217.3 256.5Pakistan 321.9 172.2 222.7 203.6 194.4 196.6 200.1Tajikistan ... 88.7 342.8 277.3 221.6 312.2 369.4Turkmenistan ... ... ... ... ... ... ...Uzbekistan ... ... ... ... ... ... ...
East AsiaChina, People’s Rep. of 49.9 34.7 31.3 33.3 31.9 34.2 34.8Hong Kong, China a, b 76.8 121.2 149.2 148.1 145.6 152.0 168.4 (2015)Korea, Rep. of a 64.6 46.5 62.5 56.7 55.5 56.3 58.6 (2015)Mongolia 153.2 93.5 173.2 175.6 284.8 375.6 325.1Taipei,Chinaa 19.3 35.9 29.9 32.1 29.2 38.4 39.1 (2015)
South AsiaBangladesh 213.9 162.9 108.4 100.1 101.9 105.6 105.2Bhutan ... ... 154.0 140.6 197.6 223.0 268.2India 161.9 75.6 81.5 73.8 87.1 89.7 93.1Maldives 44.1 73.1 49.4 39.6 33.7 28.0 31.2Nepal 212.5 224.2 212.7 178.0 178.6 162.5 145.9Sri Lanka 141.6 141.9 190.5 183.5 261.0 264.7 258.2
Southeast AsiaBrunei Darussalam ... ... ... ... ... ... ...Cambodia 139.9 86.1 62.2 55.5 64.3 64.2 60.5Indonesia 196.6 146.2 117.6 101.9 118.2 128.2 146.0Lao PDR 493.9 429.8 281.1 307.8 280.0 302.3 ...Malaysia 36.7 38.9 55.0 51.4 69.4 77.5 95.2Myanmar 273.9 173.9 104.7 94.6 80.5 62.9 ...Philippines 132.7 152.4 106.6 102.5 93.1 87.7 95.1Singapore ... ... ... ... ... ... ...Thailand 92.8 44.4 46.0 41.1 47.4 47.3 47.3Viet Nam 73.6 51.5 56.0 50.0 47.5 45.8 44.5
The PacificCook Islands ... ... ... ... ... ... ...Fiji 17.8 11.6 29.1 36.9 29.1 34.2 ...Kiribati a 16.3 17.6 ... ... ... ... ...Marshall Islands a 141.1 98.0 99.0 76.9 70.6 65.9 62.3 (2015)Micronesia, Fed. States of a 100.3 98.2 91.9 88.9 69.3 65.6 52.7 (2015)Nauru ... ... ... ... ... ... ...Palau a 84.2 68.5 64.8 51.1 48.3 43.6 31.0 (2015)Papua New Guinea 97.3 52.0 97.8 170.5 218.0 ... ...Samoa ... 114.8 154.5 169.3 168.7 183.1 186.6Solomon Islands 121.3 108.0 69.2 45.7 35.2 34.0 30.6Timor-Leste ... ... ... ... ... ... ...Tonga ... 151.0 220.6 192.2 173.3 ... ...Tuvalu a 85.9 54.9 (2006) 65.0 67.6 48.1 47.3 47.3 (2013)Vanuatu 54.4 51.5 47.4 51.0 89.2 32.4 ...
... = data not available at cutoff date, Lao PDR = Lao People’s Democratic Republic.
a External debt as a percentage of exports of goods, services, and primary income was derived using balance-of-payments data.b Data in 2000 and 2005 onward are not comparable due to a change in coverage or compilation methodology.
Sources: World Bank. World Development Indicators and International Debt Statistics. http://data.worldbank.org/data-catalog/world-development-indicators (accessed August 2016); ADB estimates; economy sources.
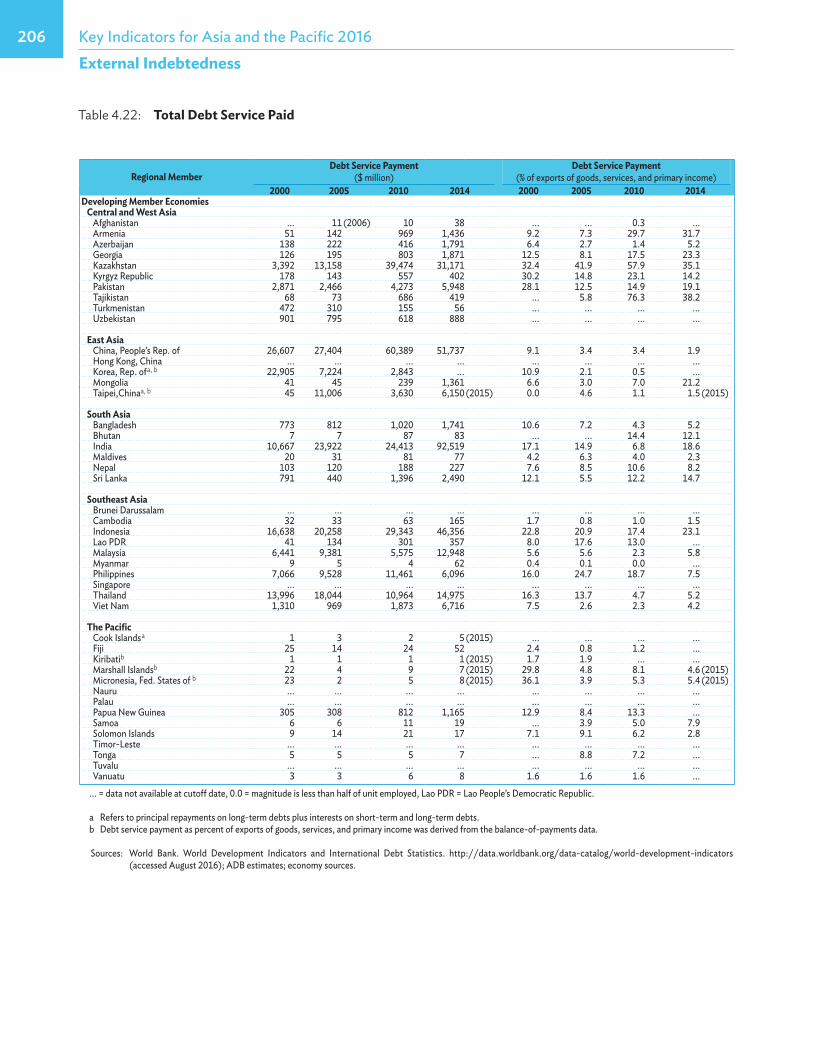
206 Key Indicators for Asia and the Pacific 2016External Indebtedness
Table 4.22: Total Debt Service Paid
Regional MemberDebt Service Payment
($ million)Debt Service Payment
(% of exports of goods, services, and primary income)2000 2005 2010 2014 2000 2005 2010 2014
Developing Member Economies Central and West Asia
Afghanistan ... 11 (2006) 10 38 ... ... 0.3 ...Armenia 51 142 969 1,436 9.2 7.3 29.7 31.7Azerbaijan 138 222 416 1,791 6.4 2.7 1.4 5.2Georgia 126 195 803 1,871 12.5 8.1 17.5 23.3Kazakhstan 3,392 13,158 39,474 31,171 32.4 41.9 57.9 35.1Kyrgyz Republic 178 143 557 402 30.2 14.8 23.1 14.2Pakistan 2,871 2,466 4,273 5,948 28.1 12.5 14.9 19.1Tajikistan 68 73 686 419 ... 5.8 76.3 38.2Turkmenistan 472 310 155 56 ... ... ... ...Uzbekistan 901 795 618 888 ... ... ... ...
East AsiaChina, People’s Rep. of 26,607 27,404 60,389 51,737 9.1 3.4 3.4 1.9Hong Kong, China ... ... ... ... ... ... ... ...Korea, Rep. of a, b 22,905 7,224 2,843 ... 10.9 2.1 0.5 ...Mongolia 41 45 239 1,361 6.6 3.0 7.0 21.2Taipei,Chinaa, b 45 11,006 3,630 6,150 (2015) 0.0 4.6 1.1 1.5 (2015)
South AsiaBangladesh 773 812 1,020 1,741 10.6 7.2 4.3 5.2Bhutan 7 7 87 83 ... ... 14.4 12.1India 10,667 23,922 24,413 92,519 17.1 14.9 6.8 18.6Maldives 20 31 81 77 4.2 6.3 4.0 2.3Nepal 103 120 188 227 7.6 8.5 10.6 8.2Sri Lanka 791 440 1,396 2,490 12.1 5.5 12.2 14.7
Southeast AsiaBrunei Darussalam ... ... ... ... ... ... ... ...Cambodia 32 33 63 165 1.7 0.8 1.0 1.5Indonesia 16,638 20,258 29,343 46,356 22.8 20.9 17.4 23.1Lao PDR 41 134 301 357 8.0 17.6 13.0 ...Malaysia 6,441 9,381 5,575 12,948 5.6 5.6 2.3 5.8Myanmar 9 5 4 62 0.4 0.1 0.0 ...Philippines 7,066 9,528 11,461 6,096 16.0 24.7 18.7 7.5Singapore ... ... ... ... ... ... ... ...Thailand 13,996 18,044 10,964 14,975 16.3 13.7 4.7 5.2Viet Nam 1,310 969 1,873 6,716 7.5 2.6 2.3 4.2
The PacificCook Islands a 1 3 2 5 (2015) ... ... ... ...Fiji 25 14 24 52 2.4 0.8 1.2 ...Kiribatib 1 1 1 1 (2015) 1.7 1.9 ... ...Marshall Islandsb 22 4 9 7 (2015) 29.8 4.8 8.1 4.6 (2015)Micronesia, Fed. States of b 23 2 5 8 (2015) 36.1 3.9 5.3 5.4 (2015)Nauru ... ... ... ... ... ... ... ...Palau ... ... ... ... ... ... ... ...Papua New Guinea 305 308 812 1,165 12.9 8.4 13.3 ...Samoa 6 6 11 19 ... 3.9 5.0 7.9Solomon Islands 9 14 21 17 7.1 9.1 6.2 2.8Timor-Leste ... ... ... ... ... ... ... ...Tonga 5 5 5 7 ... 8.8 7.2 ...Tuvalu ... ... ... ... ... ... ... ...Vanuatu 3 3 6 8 1.6 1.6 1.6 ...
... = data not available at cutoff date, 0.0 = magnitude is less than half of unit employed, Lao PDR = Lao People’s Democratic Republic.
a Refers to principal repayments on long-term debts plus interests on short-term and long-term debts. b Debt service payment as percent of exports of goods, services, and primary income was derived from the balance-of-payments data.
Sources: World Bank. World Development Indicators and International Debt Statistics. http://data.worldbank.org/data-catalog/world-development-indicators (accessed August 2016); ADB estimates; economy sources.
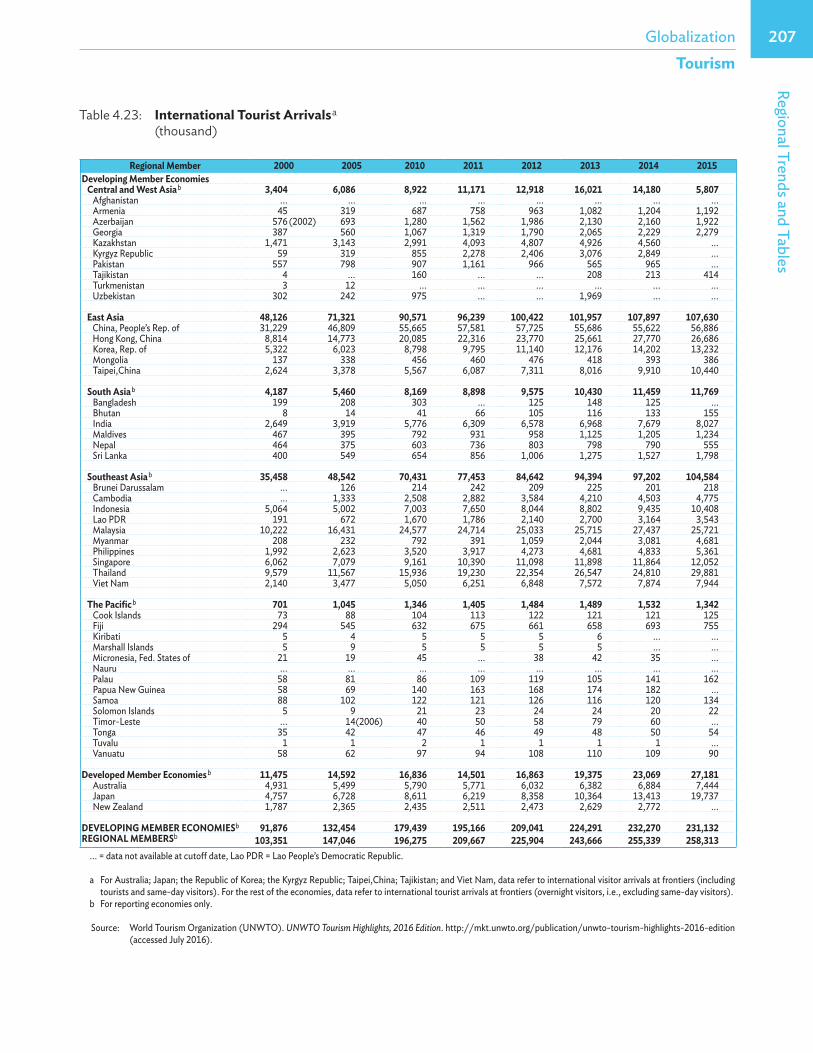
207GlobalizationRegional Trends and Tables
Tourism
Table 4.23: International Tourist Arrivals a (thousand)
Regional Member 2000 2005 2010 2011 2012 2013 2014 2015Developing Member Economies Central and West Asia b 3,404 6,086 8,922 11,171 12,918 16,021 14,180 5,807
Afghanistan ... ... ... ... ... ... ... ...Armenia 45 319 687 758 963 1,082 1,204 1,192Azerbaijan 576 (2002) 693 1,280 1,562 1,986 2,130 2,160 1,922Georgia 387 560 1,067 1,319 1,790 2,065 2,229 2,279Kazakhstan 1,471 3,143 2,991 4,093 4,807 4,926 4,560 ...Kyrgyz Republic 59 319 855 2,278 2,406 3,076 2,849 ...Pakistan 557 798 907 1,161 966 565 965 ...Tajikistan 4 ... 160 ... ... 208 213 414Turkmenistan 3 12 ... ... ... ... ... ...Uzbekistan 302 242 975 ... ... 1,969 ... ...
East Asia 48,126 71,321 90,571 96,239 100,422 101,957 107,897 107,630China, People’s Rep. of 31,229 46,809 55,665 57,581 57,725 55,686 55,622 56,886Hong Kong, China 8,814 14,773 20,085 22,316 23,770 25,661 27,770 26,686Korea, Rep. of 5,322 6,023 8,798 9,795 11,140 12,176 14,202 13,232Mongolia 137 338 456 460 476 418 393 386Taipei,China 2,624 3,378 5,567 6,087 7,311 8,016 9,910 10,440
South Asia b 4,187 5,460 8,169 8,898 9,575 10,430 11,459 11,769Bangladesh 199 208 303 ... 125 148 125 ...Bhutan 8 14 41 66 105 116 133 155India 2,649 3,919 5,776 6,309 6,578 6,968 7,679 8,027Maldives 467 395 792 931 958 1,125 1,205 1,234Nepal 464 375 603 736 803 798 790 555Sri Lanka 400 549 654 856 1,006 1,275 1,527 1,798
Southeast Asia b 35,458 48,542 70,431 77,453 84,642 94,394 97,202 104,584Brunei Darussalam ... 126 214 242 209 225 201 218Cambodia ... 1,333 2,508 2,882 3,584 4,210 4,503 4,775Indonesia 5,064 5,002 7,003 7,650 8,044 8,802 9,435 10,408Lao PDR 191 672 1,670 1,786 2,140 2,700 3,164 3,543Malaysia 10,222 16,431 24,577 24,714 25,033 25,715 27,437 25,721Myanmar 208 232 792 391 1,059 2,044 3,081 4,681Philippines 1,992 2,623 3,520 3,917 4,273 4,681 4,833 5,361Singapore 6,062 7,079 9,161 10,390 11,098 11,898 11,864 12,052Thailand 9,579 11,567 15,936 19,230 22,354 26,547 24,810 29,881Viet Nam 2,140 3,477 5,050 6,251 6,848 7,572 7,874 7,944
The Pacific b 701 1,045 1,346 1,405 1,484 1,489 1,532 1,342Cook Islands 73 88 104 113 122 121 121 125Fiji 294 545 632 675 661 658 693 755Kiribati 5 4 5 5 5 6 ... ...Marshall Islands 5 9 5 5 5 5 ... ...Micronesia, Fed. States of 21 19 45 ... 38 42 35 ...Nauru ... ... ... ... ... ... ... ...Palau 58 81 86 109 119 105 141 162Papua New Guinea 58 69 140 163 168 174 182 ...Samoa 88 102 122 121 126 116 120 134Solomon Islands 5 9 21 23 24 24 20 22Timor-Leste ... 14(2006) 40 50 58 79 60 ...Tonga 35 42 47 46 49 48 50 54Tuvalu 1 1 2 1 1 1 1 ...Vanuatu 58 62 97 94 108 110 109 90
Developed Member Economies b 11,475 14,592 16,836 14,501 16,863 19,375 23,069 27,181Australia 4,931 5,499 5,790 5,771 6,032 6,382 6,884 7,444Japan 4,757 6,728 8,611 6,219 8,358 10,364 13,413 19,737New Zealand 1,787 2,365 2,435 2,511 2,473 2,629 2,772 ...
DEVELOPING MEMBER ECONOMIESb 91,876 132,454 179,439 195,166 209,041 224,291 232,270 231,132REGIONAL MEMBERSb 103,351 147,046 196,275 209,667 225,904 243,666 255,339 258,313
... = data not available at cutoff date, Lao PDR = Lao People’s Democratic Republic.
a For Australia; Japan; the Republic of Korea; the Kyrgyz Republic; Taipei,China; Tajikistan; and Viet Nam, data refer to international visitor arrivals at frontiers (including tourists and same-day visitors). For the rest of the economies, data refer to international tourist arrivals at frontiers (overnight visitors, i.e., excluding same-day visitors).
b For reporting economies only.
Source: World Tourism Organization (UNWTO). UNWTO Tourism Highlights, 2016 Edition. http://mkt.unwto.org/publication/unwto-tourism-highlights-2016-edition (accessed July 2016).
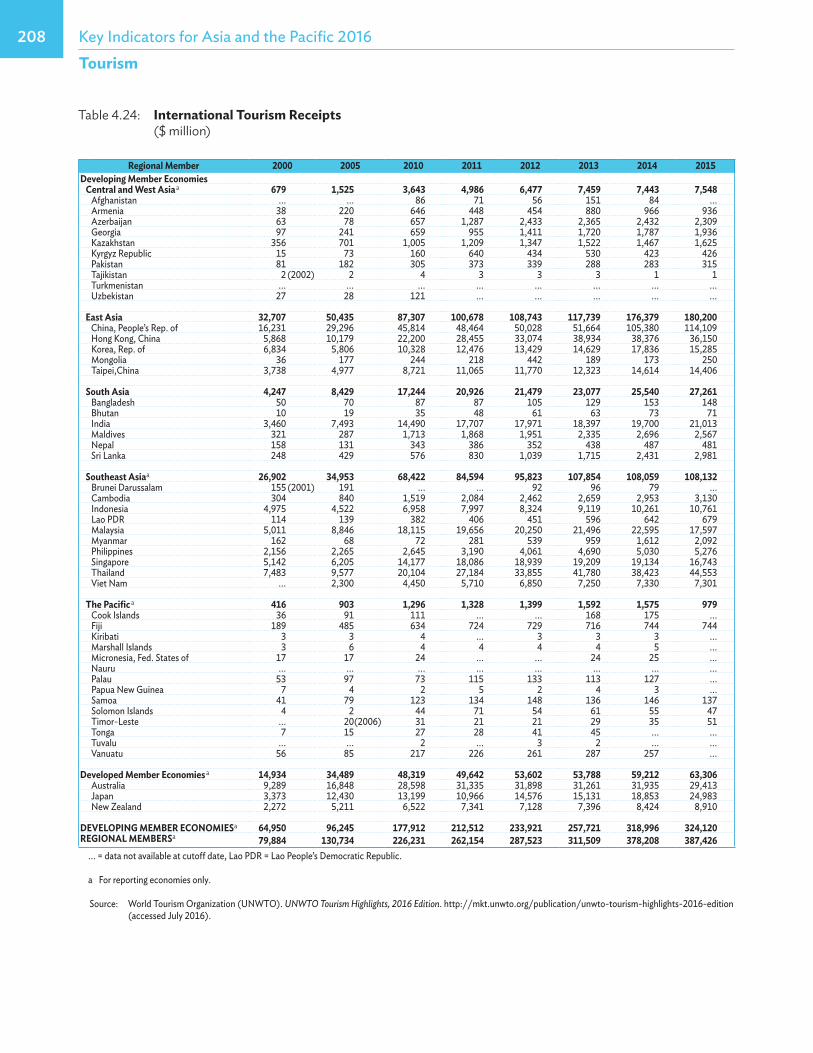
208 Key Indicators for Asia and the Pacific 2016
Regional Member 2000 2005 2010 2011 2012 2013 2014 2015Developing Member Economies Central and West Asia a 679 1,525 3,643 4,986 6,477 7,459 7,443 7,548
Afghanistan ... ... 86 71 56 151 84 ...Armenia 38 220 646 448 454 880 966 936Azerbaijan 63 78 657 1,287 2,433 2,365 2,432 2,309Georgia 97 241 659 955 1,411 1,720 1,787 1,936Kazakhstan 356 701 1,005 1,209 1,347 1,522 1,467 1,625Kyrgyz Republic 15 73 160 640 434 530 423 426Pakistan 81 182 305 373 339 288 283 315Tajikistan 2 (2002) 2 4 3 3 3 1 1Turkmenistan ... ... ... ... ... ... ... ...Uzbekistan 27 28 121 ... ... ... ... ...
East Asia 32,707 50,435 87,307 100,678 108,743 117,739 176,379 180,200China, People’s Rep. of 16,231 29,296 45,814 48,464 50,028 51,664 105,380 114,109Hong Kong, China 5,868 10,179 22,200 28,455 33,074 38,934 38,376 36,150Korea, Rep. of 6,834 5,806 10,328 12,476 13,429 14,629 17,836 15,285Mongolia 36 177 244 218 442 189 173 250Taipei,China 3,738 4,977 8,721 11,065 11,770 12,323 14,614 14,406
South Asia 4,247 8,429 17,244 20,926 21,479 23,077 25,540 27,261Bangladesh 50 70 87 87 105 129 153 148Bhutan 10 19 35 48 61 63 73 71India 3,460 7,493 14,490 17,707 17,971 18,397 19,700 21,013Maldives 321 287 1,713 1,868 1,951 2,335 2,696 2,567Nepal 158 131 343 386 352 438 487 481Sri Lanka 248 429 576 830 1,039 1,715 2,431 2,981
Southeast Asiaa 26,902 34,953 68,422 84,594 95,823 107,854 108,059 108,132Brunei Darussalam 155 (2001) 191 ... ... 92 96 79 ...Cambodia 304 840 1,519 2,084 2,462 2,659 2,953 3,130Indonesia 4,975 4,522 6,958 7,997 8,324 9,119 10,261 10,761Lao PDR 114 139 382 406 451 596 642 679Malaysia 5,011 8,846 18,115 19,656 20,250 21,496 22,595 17,597Myanmar 162 68 72 281 539 959 1,612 2,092Philippines 2,156 2,265 2,645 3,190 4,061 4,690 5,030 5,276Singapore 5,142 6,205 14,177 18,086 18,939 19,209 19,134 16,743Thailand 7,483 9,577 20,104 27,184 33,855 41,780 38,423 44,553Viet Nam ... 2,300 4,450 5,710 6,850 7,250 7,330 7,301
The Pacific a 416 903 1,296 1,328 1,399 1,592 1,575 979Cook Islands 36 91 111 ... ... 168 175 ...Fiji 189 485 634 724 729 716 744 744Kiribati 3 3 4 ... 3 3 3 ...Marshall Islands 3 6 4 4 4 4 5 ...Micronesia, Fed. States of 17 17 24 ... ... 24 25 ...Nauru ... ... ... ... ... ... ... ...Palau 53 97 73 115 133 113 127 ...Papua New Guinea 7 4 2 5 2 4 3 ...Samoa 41 79 123 134 148 136 146 137Solomon Islands 4 2 44 71 54 61 55 47Timor-Leste ... 20(2006) 31 21 21 29 35 51Tonga 7 15 27 28 41 45 ... ...Tuvalu ... ... 2 ... 3 2 ... ...Vanuatu 56 85 217 226 261 287 257 ...
Developed Member Economies a 14,934 34,489 48,319 49,642 53,602 53,788 59,212 63,306Australia 9,289 16,848 28,598 31,335 31,898 31,261 31,935 29,413Japan 3,373 12,430 13,199 10,966 14,576 15,131 18,853 24,983New Zealand 2,272 5,211 6,522 7,341 7,128 7,396 8,424 8,910
DEVELOPING MEMBER ECONOMIESa 64,950 96,245 177,912 212,512 233,921 257,721 318,996 324,120REGIONAL MEMBERSa 79,884 130,734 226,231 262,154 287,523 311,509 378,208 387,426
... = data not available at cutoff date, Lao PDR = Lao People’s Democratic Republic.
a For reporting economies only.
Source: World Tourism Organization (UNWTO). UNWTO Tourism Highlights, 2016 Edition. http://mkt.unwto.org/publication/unwto-tourism-highlights-2016-edition (accessed July 2016).
Tourism
Table 4.24: International Tourism Receipts ($ million)