oyster environmental interactions
TRANSCRIPT
The University of MaineDigitalCommons@UMaine
Miscellaneous Publications Publications
4-2016
Oyster Environmental InteractionsCarter R. NewellPemaquid Oyster Company, [email protected]
Follow this and additional works at: https://digitalcommons.library.umaine.edu/ari_miscpubs
Part of the Aquaculture and Fisheries Commons
This Presentation is brought to you for free and open access by DigitalCommons@UMaine. It has been accepted for inclusion in MiscellaneousPublications by an authorized administrator of DigitalCommons@UMaine. For more information, please [email protected].
Repository CitationNewell, Carter R., "Oyster Environmental Interactions" (2016). Miscellaneous Publications. 9.https://digitalcommons.library.umaine.edu/ari_miscpubs/9

Oyster environmental interactions
Newell, C.R. Ph.D. Maine Shellfish R&D, Damariscotta, School of Marine Sciences, University of Maine, Pemaquid
Oyster Company, Pemaquid Mussel Farms
How do coastal ecosystems affect the growth rates of Crassostrea virginica on
seafarms?
How do populations of Crassostrea virginica
affect coastal ecosystems?
Understanding the Productivity of the Damariscotta River April 1, 2016 DRA
11 miles
The Damariscotta River Estuary and locations of
monitoring buoys
oysters

Oyster farming processes site selection, hatchery, upwellers, nursery,
grow-out, processing, harvesting, sales.

• RIGHT SPECIES
• RIGHT ENVIRONMENT
• RIGHT CULTURE TECHNOLOGY
• RIGHT MARKET PRICE
• ENVIRONMENTAL STEWARDSHIP
What makes aquaculture successful?
What factors can threaten it?
• EXPOSURE TO WAVES FROM BIG STORMS
• BACTERIAL POLLUTION (RAINFALL, NON-POINT
SOURCE, POINT SOURCE)
• RED TIDES
• VIBRIO OUTBREAKS
• DISEASE AND MORTALITY
• PREDATION
Oysters $5 to $10 million and growing
Mussels $1 to $2 million and growing
Maine currently leases about 600
acres to all shellfish farms in the state

Scales of Interactions
The estuary • Geomorphology - water depth, PAR, water residence times,
fresh water input, nutrient sources, exposure to waves, physical oceanography
The bay • Productivity – PAR and nutrients, seasonal and tidal effects,
weather events, grazing, water flow patterns, resuspension The farm • Food supply and demand, oyster biomass, aquaculture structure
(suspended, bottom), husbandry The oyster • Local food availability as a function of stocking density, particle
concentration and quality, hydrodynamics

0
5
10
15
20
25
ch
l a
(u
g l
-1)
15% reduction in chl a over an oyster farm (2010) depth (ft)
center lease
control
Ecosystem interactions
• Phytoplankton biomass • Sedimentation of biodeposits • Light penetration • Nutrient regeneration and
nutrient removal • Benthic and pelagic habitat for
invertebrates, fish and birds • Benthic diatom populations • Restoration of wild populations
American oyster growth drivers
• Water temperature: filtration rate, food assimilation rate, rate of shell growth, reproduction (20-30° C)
• Water salinity: filtration rates (18-32 psu) • Particle size (> 2 µm), type (inorganic, organic),
concentration • Food quality: phytoplankton (diatoms,
dinoflagellates, ciliates, microflagellates); detritus (phytodetritus, macroalgal detritus) detritus quality (digestibility, N/C ratio)
• Water velocity: ( for populations)
Environmental Growth Drivers and Ecosystem Interactions

With UDSA and MAIC funding we have developed an oyster GIS system
• Site selection for sustainable seafarms
• Improve husbandry practices and profitability (growth rate and yield)
• Understand aquaculture/environment and human interactions

ShellGIS Workspace
Data layers (50 m grid)
Flow model out put
Water quality data
Static layers
Models
SHELLSIM growth model
Benthic boundary layer particle and nutrient exchange algorithms
Suspension culture particle and nutrient exchange algorithms
Hydraulic zone of influence
Economic models
Benthic biodeposition and nutrient regeneration
(coming soon!)
System architecture shellgis.com Based on STEM-GIS platform developed by Discovery Software Ltd. UK x, y, z, time dimensions

Factors affecting utility and functionality of GIS system
Data and models • Hydrodynamic flow model (Mike 21,
FVCOM) Bathymetry, tide gauge and water velocity field measurements
• Shellfish growth model (ShellSIM) species calibration (ecophysiology) in-situ • Water quality data: how it varies
temporally and spatially within the bay and the farm
User interface • For growers: what species, what type of
culture, where, seed size, density, time of year: growth rates, yield, profit
• For scientists: how animals respond to changing environments, model functional responses such as clearance rates, oxygen consumption, ammonium excretion, biodeposition, growth, and reproduction
• For regulators: (coming soon) ecosystem services, benthic impacts and nutrient regeneration

Measured and modeled oyster growth based on field measures of oyster responses to
environmental conditions (food quality)
Absorption of food particles Food availability, measured and modeled growth using ShellSIM

Model results: oysters grow faster in warmer water, in fast moving water, and each place has an optimal stocking density
20
30
40
50
60
Oyster live weight for different bottom densities (no. m-2) 50
200
400
600
1000
At one location (click on
map)
For whole bay (% reduction in
growth) at 2 bottom
densities
100 oysters m-2 500 oysters m-2
Effects of temperature (+/- 5ºC)
Effects of density (bottom culture)

How can we improve our understanding of oyster/ecosystem interactions? Better data on growth drivers : CTD transects and water samples
Student transects
0.000.501.001.502.002.503.003.504.004.505.00
Mean chl a all profiles Aug - Nov, 2015
0.00
2.00
4.00
6.00
8.00
10.00
12.00
Aug27
Sep11
Oct6
Oct23
Nov10
Nov23
Mean Chl a from CTD casts Damariscotta River August -
November, 2015
Upper river
Perkins Pt
Glidden ledges
Darling Center
S Bristol
0
5
10
15
20
25
Aug27
Sept11
Oct6
Oct23
Nov10
Nov23
Mean temperature CTD profiles Damariscotta River
Aug - Nov 2015
Upper river
Perkins Pt
Glidden ledges
Darling Center
S Bristol
24
26
28
30
32
34
Aug 27 Sept11
Oct 6 Oct 23 Nov 10 Nov 23
Salinity Aug - Nov 2015 Damariscotta
Upper river
Perkins Pt
Glidden ledges
Darling Center
S Bristol0
10
20
30
40
50
Upperriver
Perkins Pt DarlingCenter
S Bristol
Suspended particulate matter mg l-1
TPM
PIM
POM
% POM

How can we improve our understanding of oyster/ecosystem interactions? Water samples
0
5
10
15
20
25
30
35
40
45
Perkins Pt DarlingCenter
S Bristol
Mean primary production rate
Avg Pmax (µg C L-1 d-1)
0
50
100
150
200
250
300
350
Perkins Pt Darling Center S Bristol
Mean POC (ug/l) at Buoy Stations
0
20
40
60
80
Perkins Pt Darling Center S Bristol
Mean PON (ug/l) at Buoy Stations
0
5000
10000
15000
20000
25000
30000
35000
Perkins Pt Darling Center S Bristol
Picoeukaryote cells ml-1 Aug 27 - Nov 23
0
1
2
3
4
5
6
7
8
PerkinsPt
DarlingCenter
S Bristol
Nitrate (uM)
27-Aug-16
11-Sep-15
6-Oct-15
23-Oct-15
10-Nov-15
23-Nov-150
1
2
3
4
5
6
7
Perkins Pt DarlingCenter
S Bristol
Ammonium (uM)

Understand the productivity of the Damariscotta River April 1, 2016 DRA
How does this compare with other places? Three estuaries cruises in 1993-1994
The Damariscotta River is much more efficient at converting nutrients to phytoplankton than the
Sheepscot and Kennebec (plot from Dr. Larry Mayer)

Copepod – Eurytemora herdmani
Copepod – Acartia hudsonica
Barnacle and bivalve larvae
Mysid shrimp – Neomysis americana
Cladoceran – Evadne nordmanni
Polychaete larvae
Copepod nauplii
How can we improve our understanding of oyster/ecosystem interactions? Vertical
zooplankton tows (they also feed on phytoplankton)

How can we improve our understanding of
oyster/ecosystem interactions? LOBO buoys
0
5
10
15
20
25
30
35
CD
OM
(Q
SDE)
or
Salin
ity
(PSU
)
Time (hourly samples)
CDOM and Salinity Sep 25 to Nov 2, 2015
CDOM LOBO 1
Salinity LOBO 1
CDOM LOBO 2
Salinity LOBO 2
7.6
7.65
7.7
7.75
7.8
7.85
7.9
7.95
8
8.05
Time (hourly samples)
pH September 25 to October 14
pH LOBO 1
pH LOBO 2
-2
-1
0
1
2
3
4
5
6
Time (hourly samples)
Quenching of Chl a (Sept 25-Oct 4, LOBO 2)
chlorophyll [ug/L]
Log (PAR)
0
2
4
6
8
10
Time (hourly samples)
Chl a, transmission and turbidity Sep 25 to Oct 3 LOBO 1
0
2
4
6
8
10
Time (hourly samples)
Chl a, transmission and turbidity Sep 25 to Oct 3 LOBO 2
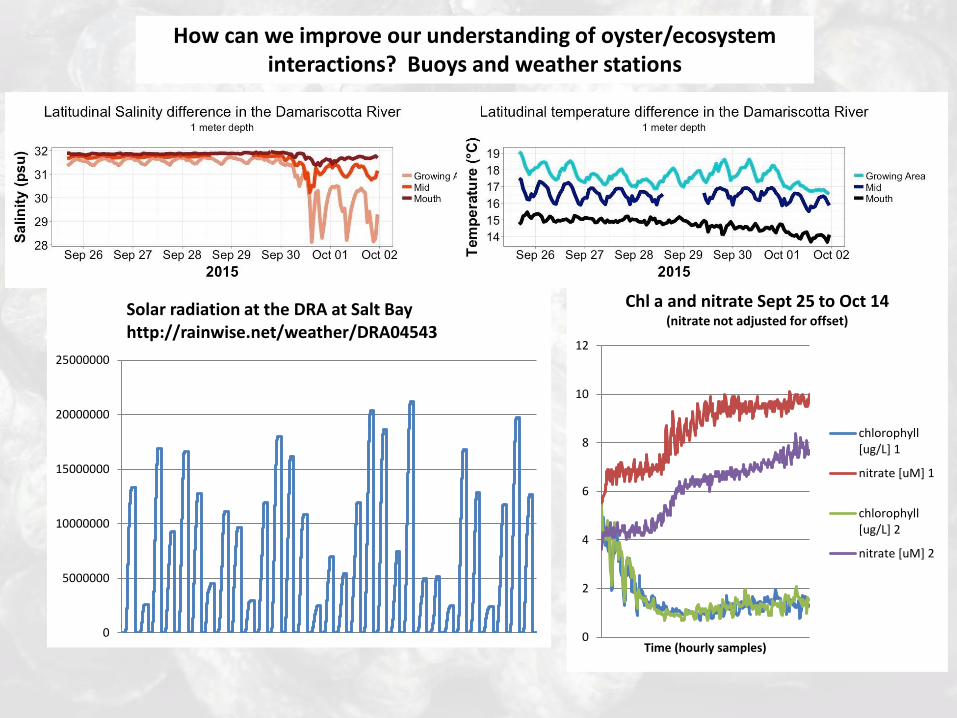
How can we improve our understanding of oyster/ecosystem interactions? Buoys and weather stations
0
2
4
6
8
10
12
Time (hourly samples)
Chl a and nitrate Sept 25 to Oct 14 (nitrate not adjusted for offset)
chlorophyll[ug/L] 1
nitrate [uM] 1
chlorophyll[ug/L] 2
nitrate [uM] 2
0
5000000
10000000
15000000
20000000
25000000
Solar radiation at the DRA at Salt Bay http://rainwise.net/weather/DRA04543
0
200
400
600
800
1000
1200
1400
1600
1800
2000
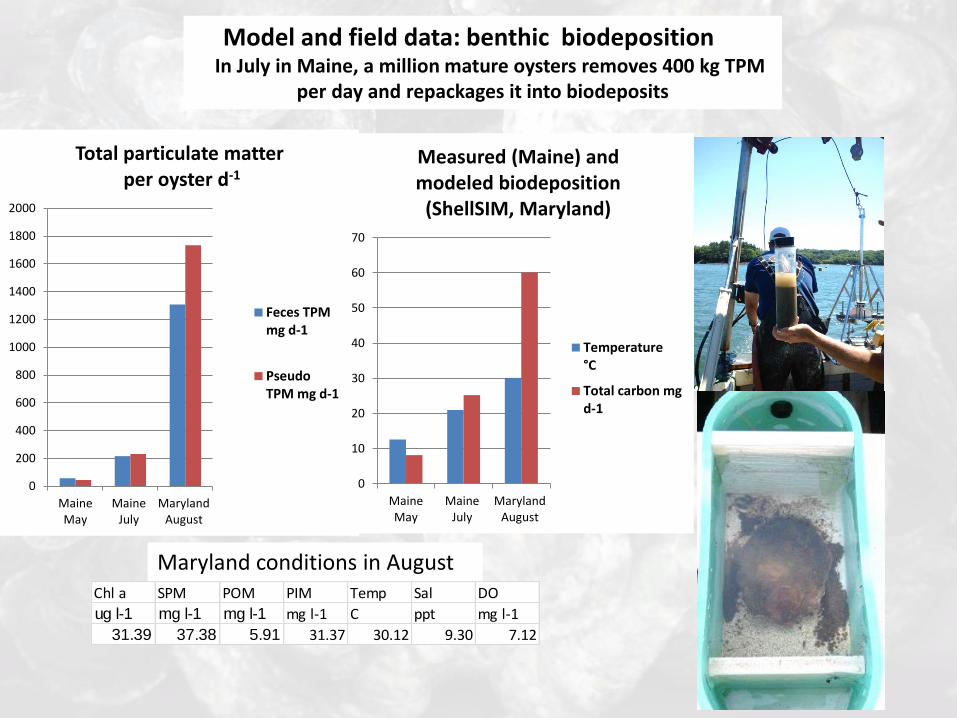
MaineMay
MaineJuly
MarylandAugust
Total particulate matter per oyster d-1
Feces TPMmg d-1
PseudoTPM mg d-1
0
10
20
30
40
50
60
70
MaineMay
MaineJuly
MarylandAugust
Measured (Maine) and modeled biodeposition
(ShellSIM, Maryland)
Temperature°C
Total carbon mgd-1
Chl a SPM POM PIM Temp Sal DO
ug l-1 mg l-1 mg l-1 mg l-1 C ppt mg l-1
31.39 37.38 5.91 31.37 30.12 9.30 7.12
Maryland conditions in August
Model and field data: benthic biodeposition In July in Maine, a million mature oysters removes 400 kg TPM
per day and repackages it into biodeposits

• Maryland farm biodeposition settles quickly to bottom and mostly moved as bedload due to resuspension from tidal currents and waves
• Most of the nitrogen is converted back to ammonium for the phytoplankton to use within days, affecting the Bay Scale nutrient budget for phytoplankton
*Testa, J.M, D.C. Brady, J.C. Cornwell, M.S. Owens, L.P. Sanford, M.S. Owens, L.P. Sanford, C.R. Newell, S.E. Suttles and R.I.E. Newell. 2015. Modeling the impact of floating oyster aquaculture on sediment-water nutrient and oxygen fluxes. Aquaculture Environment Interactions 7:205-222.
Biodeposition continued:What happens to it?* In both Maine and Maryland, shellfish biodeposition is about 2x background deposition but at these sites with tidal flow > 35 cm s-1 most is moved off site and converted into ammonium within a couple of days (recycling)
Oyster, mussel and tunicate biodeposits settle at .2-2 cm s-1
0 1 10
1
[
10
cm s
-1
s
Biodeposit ESD (mm)
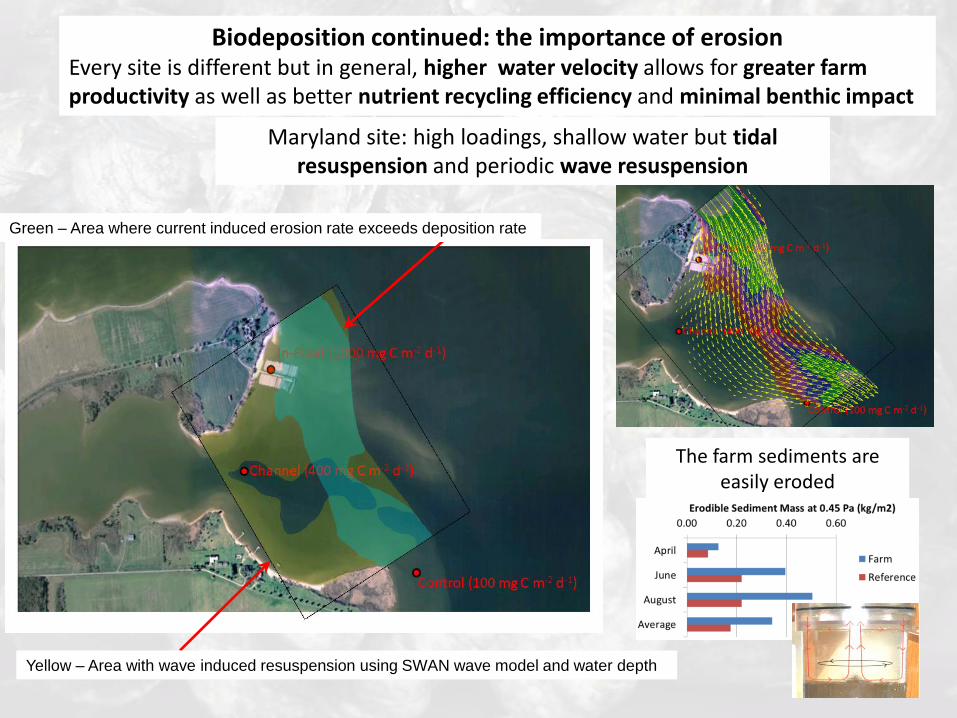
Green – Area where current induced erosion rate exceeds deposition rate
Yellow – Area with wave induced resuspension using SWAN wave model and water depth
Maryland site: high loadings, shallow water but tidal resuspension and periodic wave resuspension
The farm sediments are easily eroded
Biodeposition continued: the importance of erosion Every site is different but in general, higher water velocity allows for greater farm productivity as well as better nutrient recycling efficiency and minimal benthic impact

45th Benthic Ecology Meeting March 2016 Portland Maine
What have we learned?
• Estuarine geomorphology results in longer residence times in the upper estuary, where it is shallow and sufficient light and nutrients for phytoplankton to grow, increasing primary productivity. Fort Island Narrows and Glidden Ledges contribute significantly to the productivity in the Damariscotta River.
• The upper estuary also has higher suspended particulate matter and detritus concentrations
• Water temperature is higher in the upper estuary, allowing for higher filtration rates and rapid growth of oysters
• Rainfall events result in lower salinity, higher CDOM, higher nutrients and lower pH in the upper estuary.
• There are significant seasonal and tidal variations in all parameters • Nitrate concentrations are lower in the upper estuary but ammonium concentrations
remain high throughout the season • Oyster biodeposition increases with water temperature, phytoplankton concentrations
and suspended particulate matter but hydrodynamic factors control its dispersion • Oyster farms act to concentrate, remove and recycle nutrients in the estuary and
have beneficial ecosystem interactions
• The farms act as biological reefs, attracting seaweed, invertebrates, fish and birds • A Shellfish GIS system may be used to quantify aquaculture/environment interactions
and improve husbandry practices

Why is it worth it?
• Recognize and quantify the value of estuaries as food growing areas • Understand what makes estuaries productive and how they change under
different environments (i.e. increased temperatures and precipitation, pH) • Quantify ecosystem services of bivalves • Choose and manage sites based on their suitability and sustainability • Evolve from trial and error aquaculture to sustainable economic development • Improve engineering of aquaculture structures and placement in estuaries
They taste good!
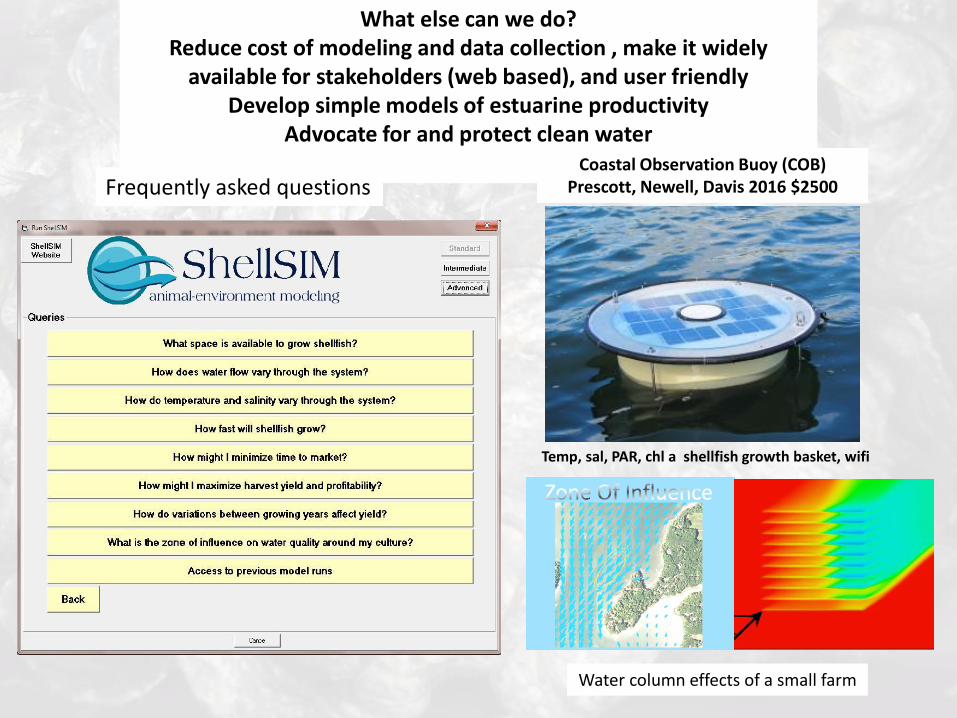
What else can we do? Reduce cost of modeling and data collection , make it widely
available for stakeholders (web based), and user friendly Develop simple models of estuarine productivity
Advocate for and protect clean water
Temp, sal, PAR, chl a shellfish growth basket, wifi
Coastal Observation Buoy (COB) Prescott, Newell, Davis 2016 $2500 Frequently asked questions
Water column effects of a small farm

Human interactions: Pemaquid Oyster Festival
Last Sunday in September – see you there!
• Shuck 15,000 oysters • Raise $15,000 for Ed Myers
marine conservation fund • Over $100,000 to date
• Boat tours of oyster farms • Shucking contest • Live music all day
• Tent of education/information including land trusts, conservation groups, regulators, research, touch
tank, children's activities

Acknowledgements
www.shellgis.com