overview - remittance prices worldwide · overview the remittance prices worldwide* (rpw) ......
TRANSCRIPT
* Remittance Prices Worldwide is a product of the Financial Inclusion and Infrastructure Global Practice of the Financial and Private Sector Development Vice-Presidency of the World Bank.
ISSUE NO. 9 – MARCH 2014
This Report reflects the latest trends observed in the data published in March 2014. Remittance Prices Worldwide is available at http://remittanceprices.worldbank.org
Overview
The Remittance Prices Worldwide* (RPW) database monitors remittance prices across all geographic regions of the world. RPW was launched by the World Bank in September 2008,i and remains a key tool to monitor the cost incurred by remitters when sending money along major remittance corridors. The recently launched fourteenth iteration of RPW covers 226 country corridors worldwide, originating from 32 remittance sending countries and destined for 89 receiving countries.
This Report uses data from RPW’s most recent release to analyze the global, regional, and country specific trends in the average total cost of migrant remittances, as well as the factors influencing them. RPW is used as a reference for measuring progress towards the “5x5” objective,ii which has been endorsed by the G8 and the G20 and is being pursued in partnership with governments, service providers, and interested stakeholders.
Main Findings
Based on the data collected for the Q1 2014 release of RPW, and when compared to previous iterations,iii the following main findings have been identified. All figures refer to the cost of sending USD 200 or the local currency equivalent.
In Q1 2014, the Global Average total cost of sending remittances was recorded at 8.36 percent, declining from 8.58 percent in the previous quarter and reaching a new lifetime low.
The Global Weighted Average also declined – from 6.13 percent in Q4 2013 to 5.91 percent in Q1 2014 – and fell below 6 percent for the first time since the inception of RPW, suggesting that costs continue to be lower where larger volumes are transferred.
The International MTO Index, which includes the Money Transfer Operators (MTOs) present in over 85 percent of the surveyed corridors, also experienced a significant decline in the last quarter. The Index now stands at 8.35 percent in Q1 2014, down from 8.74 percent in Q4 2013 and below the Global Average for the first time.
Significant improvements can be observed at the level of individual corridors since the launch of the 5x5 initiative. In Q1 2014, a third more corridors have an average cost below 10 percent compared to 5 years ago and, in the same time period, the percentage of corridors with average cost that is over 15 percent has more than halved.
The average cost for sending remittances from the G8 countries dropped from 8.20 percent in Q4 2013 to 7.73 percent in Q1 2014; the lowest level ever recorded and below 8 percent for the first time. Russia remains the least expensive sending country in the G8 group, and Japan remains the most expensive although the cost decreased for the third consecutive quarter. Canada, Germany, Italy, the USA and the UK experienced declines in the cost of sending remittances this quarter; France was the only county to experience an increase.
2
ISSUE NO. 9 – MARCH 2014
In Q1 2014, the cost of remitting from the G20 countries increased and now stands at 8.31 percent, up from 8.16 percent in the previous quarter. The average cost of sending money to the G20 countries that are included in RPW as receiving markets has fallen to a record low 8.25 percent in Q1 2014.
Latin American and the Caribbean (LAC)iv is the least costly region to send money to, with an average cost of 6.21 percent, followed by South Asia (SAR), where the cost is 6.56 percent on average. The cost of sending money to Middle East and North Africa (MNA) and East Asia Pacific (EAP) both increased, from 7.80 percent and 8.28 percent in Q4 2013 to 8.32 percent and 8.52 percent, respectively. The cost of sending money to Sub-Saharan Africa (SSA) decreased from 12.55 in Q4 2013 to 11.71 percent in Q1 2014, but this remains the most expensive region of the world to send money to.
The average total cost of sending money through commercial banks was 12.53 percent in Q1 2014, well above the global average and the most expensive of all Remittance Service Provider (RSP) types. Post offices registered an increase in Q1 2014, now standing at 5.93 percent, up from 4.21 percent in the previous quarter. The cost of sending money through MTOs declined further from 7.01 percent in Q4 2013 to 6.69 in Q1 2014.
While cash products remain the most widely available (43 percent of the sample), an increased number of account-to-account services has been recorded in Q1 2014. On-line services are also gaining ground and have now reached an average cost of 6.06 percent.
Global average cost for remittances continue to decline, and major MTOs follow the same trend
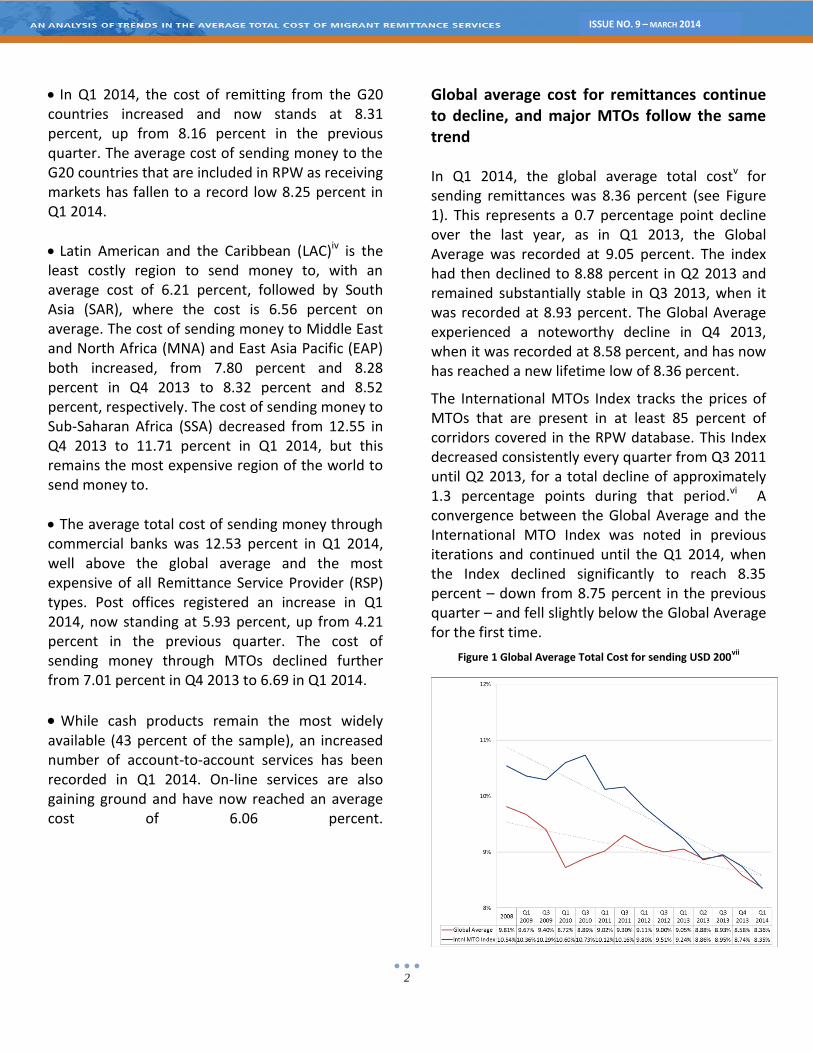
In Q1 2014, the global average total costv for sending remittances was 8.36 percent (see Figure 1). This represents a 0.7 percentage point decline over the last year, as in Q1 2013, the Global Average was recorded at 9.05 percent. The index had then declined to 8.88 percent in Q2 2013 and remained substantially stable in Q3 2013, when it was recorded at 8.93 percent. The Global Average experienced a noteworthy decline in Q4 2013, when it was recorded at 8.58 percent, and has now has reached a new lifetime low of 8.36 percent.
The International MTOs Index tracks the prices of MTOs that are present in at least 85 percent of corridors covered in the RPW database. This Index decreased consistently every quarter from Q3 2011 until Q2 2013, for a total decline of approximately 1.3 percentage points during that period.vi A convergence between the Global Average and the International MTO Index was noted in previous iterations and continued until the Q1 2014, when the Index declined significantly to reach 8.35 percent – down from 8.75 percent in the previous quarter – and fell slightly below the Global Average for the first time.
Figure 1 Global Average Total Cost for sending USD 200vii

3
ISSUE NO. 9 – MARCH 2014
Global weighted average falls below 6 percent
In addition to the Global Average, a global weighted average total cost is calculated, which accounts for the size of the flows in each remittance corridor.viii
The global weighted average total cost of sending remittances, as illustrated in Figure 2, has, at times, shown a different pattern from the simple average. After declining for the first six consecutive iterations, from 2008 to Q3 2011, the global weighted average increased for the first time in Q1 2012 to 7.10 percent, up from 7.02 percent in the previous iteration. The upward trend continued in Q3 2012, when the global weighted average increased to 7.26 percent, but was reversed in the following quarter. In Q2 2013, the weighted average decreased to 6.63 percent, down from 6.92 in the previous quarter, and remained substantially stable in Q3 2013, when it was recorded at 6.62 percent. In Q4 2013, however, the global weighted average declined almost half a percentage point to 6.13 percent. As Figure 2 illustrates, the global weighted average continues to decline. In Q1 2014, the global weighted average declined to 5.91 percent – falling below 6 percent for the first time since the inception of RPW.
Figure 2 Global Weighted Average for sending USD 200
Are receivers charged too?
In calculating the cost of transferring remittances, all components of the cost should be considered, both on the sending and the receiving side.
It is, however, particularly challenging to obtain information on fees and other costs that may be charged to the beneficiary of the transaction on the receiving end. For this reason, to allow for comparability and avoid penalizing the more transparent providers by displaying a higher total cost for their services, the total cost displayed in RPW does not capture receiving fees.
In Q1 2014, researchers were asked to further whether or not the RSP on the sending side was aware of any fee being charged to the receiver. While it is important to stress that some of this information might be biased by a lack of knowledge of the RSP or its agent on the sending side, some conclusions are presented here.
Figure 3 shows that in the majority of cases (69 percent) the providers claim that no fee will be charged to the receiver. This seems consistent with the general industry practice of MTOs charging only the sender for the transaction and this is confirmed by the vast majority of the “no” answers having been collected at MTOs.
On the other hand, for 11 percent of services a receiving fee is disclosed. These are generally transfers to a bank account, where it seems to be a rather common practice for banks to charge their account holders for receiving international transfers. It is important to note that the RSPs are often not aware of how much is being charged to the receiver.
It is particularly concerning that in 19 percent of cases providers are unable to inform their clients whether or not a fee will be charged on the receiving side, leaving the sender with only partial information on the cost of the transaction being performed. These services should be considered to be not transparent and this is a bad practice to be addressed.
Figure 3 Fees charged to recipients

4
ISSUE NO. 9 – MARCH 2014
Corridors recording average costs below 10 percent increased significantly since 2009, corridors over 15 percent more than halved
Figure 4 shows that the overall downward trend reflected in the Global Average is even more evident when looking at the level of individual corridors. While in the global figures the less virtuous cases prevent the averages from dropping to more desirable levels, observing the individual corridors shows the progress that has been made over the years also thanks to the efforts generated by the “5x5 objective” initiative.
Figure 4 Distribution of Average Total Costs
The percentage of corridors where remitters could pay between 0 and 10 percent on average to send money home has increased significantly since 2009. In Q1 2009, this was the case for only 53 percent of corridors; in Q1 2014, 71 percent of RPW corridors fall in this range.
For the higher bands, the percentage has dropped: nearly one fifth of corridors (16 percent) had an average total cost above 15 percent in 2009; today, roughly 6 percent of corridors do. Additionally, less than two percent of corridors have an average price that is higher than 20 percent; this was almost 5 percent 5 years ago. Similarly, only 4.4 percent of the corridors are still in the 15-20 percent range, compared to 11.9 percent 6 years ago.
Average cost of sending from G8 countries falls to 7.73 percent
The G8 countries include the major sending countries in the world. The average cost for sending remittances from the G8 countries in Q1 2014 was 7.73 percent, falling below 8 percent for the first time. The new lifetime low represents a decline of almost half of a percentage point from 8.20 percent in the previous quarter.
As Figure 5 illustrates, there are significant disparities in the cost structure across these countries (see also Table 1 in the annex). The total average cost of sending money from Japan, Canada, France, and Germany is above both the global average and the G8 average, while costs in Russia, the United States, Italy, and the United Kingdom are below. This has been relatively consistent for most countries over the years.
Figure 5 Total average in G8 countries
With an average cost of 2.16 percent in Q1 2014, down from 2.44 percent last quarter, Russia maintains the lowest average total cost across G8 countries. It is important to note that Russia has a unique environment where cross border remittances are mostly conducted in the same currency and possible additional costs associated with a currency exchange are not known. The Russian market also benefits from relatively low fees charged by the providers when compared to the other G8 countries.

5
ISSUE NO. 9 – MARCH 2014
The average total cost of sending remittances from Japan declined from 15.73 percent in Q4 2013 to 14.36 percent in Q1 2014, the lowest ever recorded for Japan. Despite this positive trend, Japan remains the most expensive country in the G8 group.
Canada, Germany, Italy, the USA, and the UK also registered decreases in the average price of sending remittances in Q1 2014. Germany experienced the largest decline, from 9.31 percent in Q4 2013 to 8.37 percent in Q1 2014. Declines in other countries were more modest; 10.79 percent to 10.31 percent for Canada, 7.28 percent to 7.06 percent for Italy, 8.38 percent to 7.86 percent for the UK and 6.18 percent to 5.80 percent for the USA.
France was the only G8 country to experience an increase this quarter – from 10.43 percent in Q4 2013 to 10.91 in Q1 2014.
Cost of sending remittances from the G20 countries increased slightly, while the cost of remitting to G20 countries reaches lifetime low
With the exception of Q3 2009, the cost of remitting from G20 countriesix followed the same pattern as the global average, until Q1 2013. In Q2 2013, the two figures began to move in opposite directions, and have continued to do so, with the exception of Q4 2013, when both indices declined. Once again, the cost of remitting from the G20 countries moved in the opposite direction to the global average cost. The cost of remitting from G20 countries increased from 8.16 percent in Q4 2013 to 8.31 percent in Q1 2014, as shown in Figure 6 (see also Table 1 in the annex).
Figure 6 Average cost of sending USD 200 from G20 countries
The average cost of sending money to the G20 countries that are included in RPW as receiving markets continued to decline and was recorded at 8.25 percent in Q1 2014, down from 8.86 percent the previous quarter, and the lowest level recorded in the lifetime of the indicator (see Figure 7 and Table 2 in the annex). Apart from a few quarters, the average cost of sending money to the G20 countries has followed the pattern of the global average. The disparity between the average cost of sending money to the G20 and the global average increased over time, and reached a peak in Q3 2013. The significant convergence noted in Q4 2013 continued in Q1 2014, when the cost of sending to G20 countries fell below the global average for the first time in the history of RPW.

6
ISSUE NO. 9 – MARCH 2014
Figure 7 Average cost of sending USD 200 to G20 countries
South Africa remains the most costly G20 country to send remittances from, with an average of 19.80, followed by Japan with an average of 14.36 percent (see Figure 8). The least expensive sending country, together with Russia, is Saudi Arabia (4.09), followed by the USA (5.80) and Korea (5.98).
Figure 8 Average cost of remitting from G20 countries in Q1 2014
China is the most expensive country in the G20 to send money to, with an average cost of 10.58 percent in Q1 2014 (Figure 9).
In Q1 2014, Mexico and Brazil were the cheapest receiving markets in the G20 group, with averages of 4.48 and 6.35 percent, respectively.
It is important to note that Brazil was among the most expensive G20 receiving countries until the last quarter. For historical reasons, different
reference rates are published in Brazil to convert the Brazilian Real into USD. Until Q4 2013, the so-called “informal” rate has been used as a reference to calculate the exchange rate margin for the Brazilian Real in RPW. However, as the Banco Central do Brasil has recently published new data on the exchange rates applied to customers in the market, it was possible to conclude that the market has evolved and that regulated providers are indeed using the standard rate as a reference to calculate their margins. It should be clearly highlighted though that it is a general business practice for providers in Brazil to charge a fee to the receiver for exchanging the foreign currency with the Real and that this is not captured in the average costs reported here.
Figure 9 Average cost of remitting to G20 countries in Q1 2014
Remittance sending costs vary significantly across receiving regions
The cost for remittance services varies significantly depending on the region where money is being sent (see Figure 10 and Table 3 in the annex). The cost of sending money to Latin America and the Caribbean (LAC) declined from 7.02 percent in Q4 2013 to 6.21 percent in Q1 2014, falling below 7 percent for the first time and overtaking South Asia (SAR), where the average cost is 6.56 percent, as the least costly region to send money to.
Due to the peculiarity of the Russian market and its heavy influence on the Eastern and Central Asia

7
ISSUE NO. 9 – MARCH 2014
(ECA) region, two values have been calculated and considered: an average including and an average excluding Russia. The average including Russia increased slightly, from 6.29 in Q4 2013 to 6.49 percent in Q1 2014, despite a decrease in the cost of sending money from Russia. The average excluding Russia increased from 7.93 in Q4 2013 to 8.18 in the most recent iteration, continuing the upward trend that began in Q3 2012.
The average cost of sending remittances to the East Asia and Pacific (EAP) region increased slightly from 8.28 percent in Q4 3013 to 8.52 in Q1 2014. Despite the minor increase last quarter, significant progress has been made in the region compared to the average price in 2009, which was approximately 2 percentage points higher than today’s average. While the margins for improvement are still present, the efforts in the area of transparency and competition, as well as increased dialogue among regulators and operators, particularly in the Pacific region, should be noted.
Until 2012, the Middle East and North Africa (MNA) was characterized by a seasonal trend; slight increases in the third quarters followed by drops of the average costs in the first quarters. Unlike previous years, the average price in this region remained relatively stable in Q1 and Q2 of 2013, and registered a fairly significant decline in Q3 2013, from 7.83 to 7.61. In Q1 2014, the cost of sending money to MNA region returned to Q2 2013 levels, and was recorded at 7.80.
The cost of sending money to the Sub-Saharan Africa (SSA) region declined in the last quarter – from 12.55 in Q4 2013 to 11.71 percent in Q1 2014 – falling below 12 percent for the first time since Q3 2010, but remains the most expensive region of the world to send money to. These results call for additional efforts of national authorities, as well as the international community, to improve the market for remittances in Africa.
Figure 10 Total averages by region of the world
Post offices remain the least expensive, banks the most costly
RPW tracks the cost of sending remittances for three main RSP types; commercial banks, MTOs, and post offices. Based on the data from this reporting period (see Figure 11), commercial banks continue to be the most costly RSP type. The cost of sending remittances using a commercial bank is 12.53 percent, significantly higher than the global average (8.36) and much higher than the cost through post offices and MTOs, which are 5.93 and 6.69 percent, respectively.
In Q4 2013, the cost of sending money through MTOs declined from 7.01 percent in Q4 2013 to 6.69, reaching a new lifetime low.
Post offices remain the cheapest RSP type to send money at 5.93 percent, but experienced a notable increase in average cost from 4.21 percent last quarter.
MTOs are the largest category in the RPW database and the most transparent. 99 percent of MTOs (2,037 out of 2,060) disclose complete information to their customers, compared with only 74 percent of banks (655 out of 888) and 46 percent of post offices (16 out of 35).

8
ISSUE NO. 9 – MARCH 2014
Figure 11 Total averages by RSP type
More alternatives to cash products are emerging in the market
Cash services remain the most widely available (43 percent, see Figure 13) and one of the most competitive ways to send money, with an average cost of 7.07 percent, as shown in Figure 12.
An increased number of account-to-account services have been recorded in Q1 2014. This is generally due to many MTOs now offering the option to transfer money from the sender’s bank account to the bank account of their beneficiary. In the last three years, two of the leading global MTOs have acquired Foreign Exchange companies that specialize in sending money to bank accounts. As these services become more common in the market, the average cost seem to have been little affected, with account service (to any bank) remaining over 13 percent. The cost of transfers within the same bank (or to a partner bank in the receiving country) has slightly decreased and is now 7.26 percent.
While not widely available (6 percent), cash to account services are the cheapest product type, at an average cost of 5.69 percent.
Services offered on-line seem to be gaining ground. While the available services covered in RPW is stable around 13 percent of the total sample, a number of providers are emerging in this space. On-line services generally offer senders different
options to pay for the transaction (from their bank accounts, with either a wire transfer or direct debit, or by debit or credit card). The sender can also choose different ways for the money to be delivered, for example to the beneficiary’s bank account or in cash at an agent in the receiving country. The average cost for these services in the Q1 2014 was 6.06 percent.
Figure 12 Average cost by product type
Figure 13 Availability of product types

9
ISSUE NO. 9 – MARCH 2014
NOTES
i Several countries/regions operate their own databases to monitor remittance price activity at the national/regional level. The World Bank certifies national and regional remittance prices databases compliant with the minimum mandatory requirements for remittance databases. To date databases for Italy, Central America, Australia/New Zealand, Africa, Norway, France, and Germany have been certified. For more information, visit http://remittanceprices.worldbank.org/National-Databases.
ii The 5x5 objective refers to reduction of the global average total cost of migrant remittances by 5 percentage points in 5 years. It was adopted by the G8 at the 2009 L’Aquila summit where the commitment was made “to achieve in particular the objective of a reduction of the global average costs of transferring remittances from the present 10% to 5% in 5 years.” In 2010, the G20 committed to a “significant reduction in the cost of remittances” and established a Development Action for Remittances.
iii The first iteration of the database was released in September 2008. For the following five years, the RPW database was updated every six months with data releases published for Q1 and 3Q 2009, Q1 and 3Q 2010, Q1 and 3Q 2011 and Q1, and 3Q 2012. Starting in 2013, the RPW database will be updated quarterly. Data have been published for Q1 2013, Q2 2013, Q3 2013, Q4 2013, and Q1 2014.
iv The regions’ abbreviations are as follows: East Asia and Pacific (EAP), Europe and Central Asia (ECA), Latin America and the Caribbean (LAC), Middle East and North Africa (MNA), South Asia (SAR), Sub-Saharan Africa (SSA).
v The global average total cost is calculated as the average total cost for sending USD 200 with all RSPs worldwide; non-transparent RSPs (i.e. RSPs that do not disclose the exchange rate applied to the transaction) are excluded, as well as corridors from Russia, since in these cases the exchange rates were not provided and cost could be higher if data were complete.
vi The International MTOs Index includes all MTOs that are present in over 85 percent of RPW corridors. Thus far, it has included Western Union and MoneyGram,
which operate in 99 percent and 92 percent of the country corridors covered in the database, respectively.
vii Figures for the global average were adjusted in Q1
2014 following a thorough clean-up of the entire database. Some values slightly vary from data published in the past.
viii It is important to note that, while official data on
remittance flows by bilateral corridors are currently not available, estimates (Ratha and Shaw 2007, updated in 2012, available at http://go.worldbank.org/JITC7NYTT0) have been used in this calculation. These estimates are based on the Balance Of Payments (BOP) and factor in migrant stocks, destination country incomes, and source country incomes. The methodology for these estimates has been questioned, as well as the accuracy of official data on remittance flows and migrant stocks. However, this still represents the only available comprehensive dataset on bilateral remittance flows. It also seems likely that overall the dataset is sufficiently accurate to reflect at least the proportion between the different corridors, hence offering a good approximation to weight the relevance of each corridor in terms of flow size.
ix In the final declaration of the Cannes Summit on November 3 and 4 2011, the G20 head of state committed to work towards the reduction of the average cost of transferring remittances from 10 to 5 percent by 2014. The G20 adoption of a target created the need for an index that specifically monitors the price of remittances in the G20 members. As some G20 countries are included in RPW as remittance senders, while others are listed as receivers, two different indexes are presented here: (1) average for sending remittances from the G20 member countries; and (2) average for sending remittances to the G20 member countries. The following G20 countries are included in RPW. Sending countries: Australia, Canada, France, Germany, Italy, Japan, Republic of Korea, Russia, Saudi Arabia, United Kingdom, and the United States. Receiving countries: China, India, Indonesia, Mexico, and Turkey. Countries that are both sending and receiving: Brazil and South Africa. Argentina is not included in RPW. The European Union does not appear as such in RPW, although most EU member countries are included in the database.

10
ISSUE NO. 9 – MARCH 2014
ANNEX: TABLES
Table 1 - Total average in G20 sending countries (%)
2008 Q1
2009 Q3
2009 Q1
2010 Q3
2010 Q1
2011 Q3
2011 Q1
2012 Q3
2012 Q1
2013 Q2
2013 Q3
2013 Q4
2013 Q1
2014
Australia - - 13.98 14.38 13.57 15.21 14.82 11.02 10.84 11.07 10.21 10.19 9.12 9.80
Brazil - - 15.42 15.25 7.12 6.31 11.12 13.00 5.88 8.66 6.35 5.94 9.65 6.35
Canada 14.00 13.28 11.07 10.18 10.90 10.31 11.87 11.08 10.06 11.03 11.09 10.97 10.79 10.31
France 10.92 11.50 11.15 10.01 8.95 8.76 11.63 11.78 11.68 10.72 10.96 10.48 10.43 10.91
Germany 14.07 13.53 12.71 11.85 12.67 10.98 12.64 11.16 10.94 10.16 9.62 9.01 9.31 8.37
Italy 10.03 7.36 8.21 8.11 7.87 7.57 8.18 7.88 7.47 7.64 7.31 7.42 7.28 7.06
Japan 15.33 18.24 19.06 17.34 16.16 17.54 16.84 15.70 16.32 16.66 18.31 16.57 15.73 14.36
Korea - - - - 8.84 8.28 6.36 6.73 6.65 6.49 6.20 6.43 6.08 5.98
Russia 3.22 2.42 2.99 2.54 2.52 2.88 2.68 2.33 2.42 2.43 2.34 2.43 2.44 2.16
Saudi Arabia 5.20 3.86 4.72 4.42 4.60 4.38 4.13 4.22 4.25 3.93 4.46 4.05 4.19 4.09
South Africa 15.91 16.48 15.03 14.76 14.60 18.29 17.73 18.77 20.56 20.72 20.69 19.29 18.16 19.80
UK 10.26 10.27 9.05 8.29 8.07 8.33 7.73 7.93 7.88 7.96 7.69 8.40 8.38 7.86
USA 6.90 7.21 7.06 7.57 7.14 6.67 6.93 6.91 6.80 6.75 6.65 6.42 6.18 5.80
G8 10.26 10.32 8.80 8.37 8.40 8.36 8.53 8.49 8.31 8.53 9.19 8.44 8.20 7.73
From G20 9.23 9.07 9.49 9.04 8.92 9.11 9.19 8.98 8.87 9.12 9.52 8.72 8.16 8.31
Global 9.81 9.67 9.40 8.72 8.89 9.02 9.30 9.11 9.00 9.05 8.88 8.93 8.58 8.36
Table 2 - Total average in G20 receiving countries (%)
2008 Q1
2009 Q3
2009 Q1
2010 Q3
2010 Q1
2011 Q3
2011 Q1
2012 Q3
2012 Q1
2013 Q2
2013 Q3
2013 Q4
2013 Q1
2014
Brazil 14.67 12.42 8.54 14.01 10.93 10.44 13.42 11.31 12.99 13.48 11.56 11.94 10.97 6.35
China 14.44 15.29 13.66 12.55 11.00 12.58 11.92 11.60 12.01 11.62 11.59 11.99 11.13 10.58
India 7.65 7.91 7.56 7.34 8.13 7.70 6.96 7.95 7.83 9.05 9.18 8.57 7.86 7.57
Indonesia 10.49 8.31 9.19 6.40 6.43 6.25 5.94 6.97 6.01 6.69 6.67 7.61 6.53 7.10
Mexico 5.80 7.01 5.95 7.42 7.37 6.58 5.97 5.86 5.56 5.31 5.67 4.41 5.29 4.48
South Africa 12.22 12.42 11.64 10.20 8.62 9.55 8.03 7.90 9.57 10.08 9.87 9.55 8.39 7.63
Turkey 12.17 11.26 11.63 10.05 9.58 9.25 8.76 8.76 7.75 7.26 8.43 7.95 7.24 7.02
To G20 9.74 10.18 9.99 9.88 9.44 9.80 9.80 9.79 10.08 10.11 9.81 10.57 8.86 8.25
Global 9.81 9.67 9.40 8.72 8.89 9.02 9.30 9.11 9.00 9.05 8.88 8.93 8.58 8.36

11
ISSUE NO. 9 – MARCH 2014
Table 3 - Total average by regions of the world (%)
2008 Q1
2009 Q3
2009 Q1
2010 Q3
2010 Q1
2011 Q3
2011 Q1
2012 Q3
2012 Q1
2013 Q2
2013 Q3
2013 Q4
2013 Q1
2014
EAP 11.05 10.46 10.38 9.33 9.48 9.71 9.80 9.27 8.88 8.97 8.88 9.00 8.28 8.52
ECA 5.96 6.68 7.19 6.48 7.57 7.55 6.86 6.28 6.54 6.77 6.70 6.68 6.29 6.49
ECA (x Russia) 11.03 9.70 9.42 8.33 9.49 9.32 8.68 8.14 8.21 8.43 8.35
8.41
7.93 8.18
LAC 8.37 8.65 7.63 8.12 7.27 6.82 7.68 7.72 7.65 7.77 7.28 7.26 7.02 6.21
MNA 11.10 9.30 9.58 8.19 8.95 8.00 8.15 8.19 7.85 7.81 7.83 7.61 7.80 8.32
SAR 7.80 7.31 6.85 5.99 6.54 6.56 6.15 6.70 6.54 7.16 7.02 7.12 6.58 6.56
SSA 14.01 13.07 11.61 10.86 11.57 12.82 12.41 12.32 12.40 12.21 12.06 12.29 12.55 11.71
Global 9.81 9.67 9.40 8.72 8.89 9.02 9.30 9.11 9.00 9.05 8.88 8.93 8.58 8.36
See note iv for list of abbreviations