overview of global oils and fats the malaysian palm...
TRANSCRIPT

Overview of Global Oils and Fats
&
the Malaysian Palm Oil Industry
Presentation for Members of European Parliament
by
Dr. Yusof Basiron
Chief Executive Officer

Presentation Outline
Overview of:
• Global oils & fats scenario
• The Malaysian palm oil industry
• Issues related to environment, social aspects
& sustainability
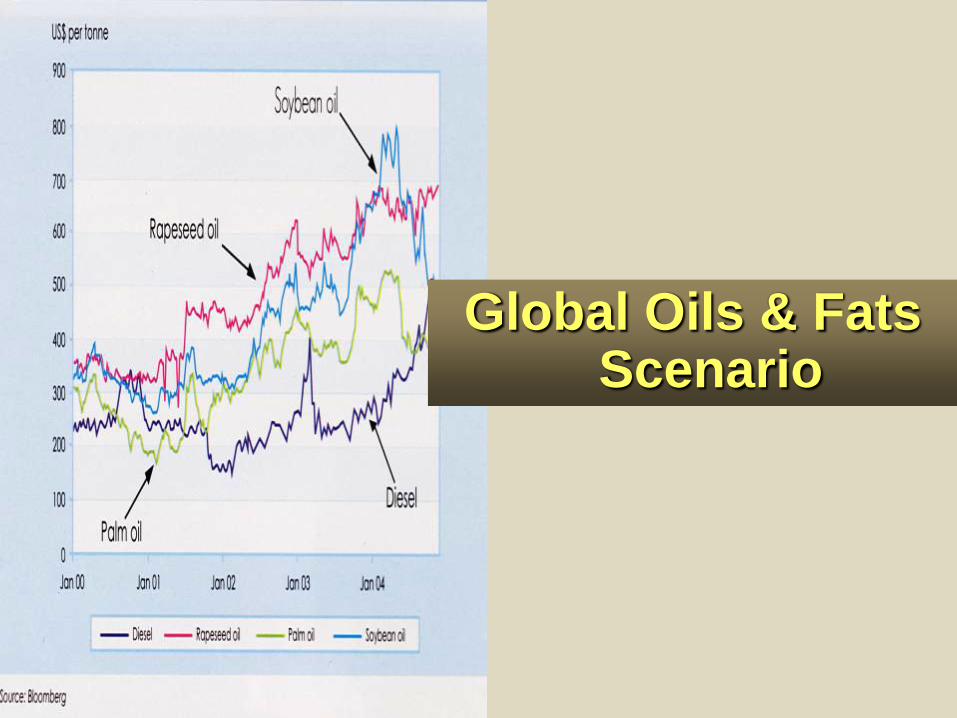
Global Oils & Fats Scenario

Total Production 2007 = 154 mil tonnes
37.538.2
18.5
11.0
24.7
7.4
16.7
0.0
5.0
10.0
15.0
20.0
25.0
30.0
35.0
40.0
million t
onnes
Soybean oil Palm oil Rapeseed
oil
Sunflower
oil
Animal
Fats
Laurics Others
Production in 2006 = 150 mil tonnes
Source: Oil World

• Annual global production growth during 2002-
07 was 5% per annum
• Palm oil had the highest growth rate at 8.5%
per year during this period. Soybean and
rapeseed growth rates were at 4.7% and 6.8%,
respectively
• In 2007, average growth of all oils estimated at
2.6%, with palm oil at 2.7%, soybean at 6.2%
and rapeseed at 0.1%.
Production Average Growth

World Oils & Fats Production Share
Soybean
24%
Sunflower
7%
Animal Fats
16%
Laurics
5%
Others
11%
Palm
25%
Rapeseed
12%Source: Oil World

Total Exports 2007 = 57.8 mil tonnes
Soybean oil
19%
Palm oil
51%
Others
4%
Laurics
8%
Animal Fats
7%
Rapeseed oil
4%
Sunflower oil
7%
Source: Oil World

Export Trend of Major Oils
0
5,000
10,000
15,000
20,000
25,000
30,000
35,000
1995
1996
1997
1998
1999
2000
2001
2002
2003
2004
2005
2006
2007
'00
0 T
on
ne
s
Soybean Palm Oil
Rapeseed Sunflower
Source: Oil World

14%
19%
5%3%
35%
26%
5%
13%
3%25%
28%
24%
Malaysia
USA
Argentina
EU
Indonesia
Others
19802007
Market Share in Export Trade
1980 vs 2007
Source: Oil World

Africa
4%
EU-25
17%Other Europe
1%Middle East
7%
Sub-Continent
18%
East Asia &
Oceania
32%
Americas
21%
Oils & Fats Consumption by Region
Source: Oil World
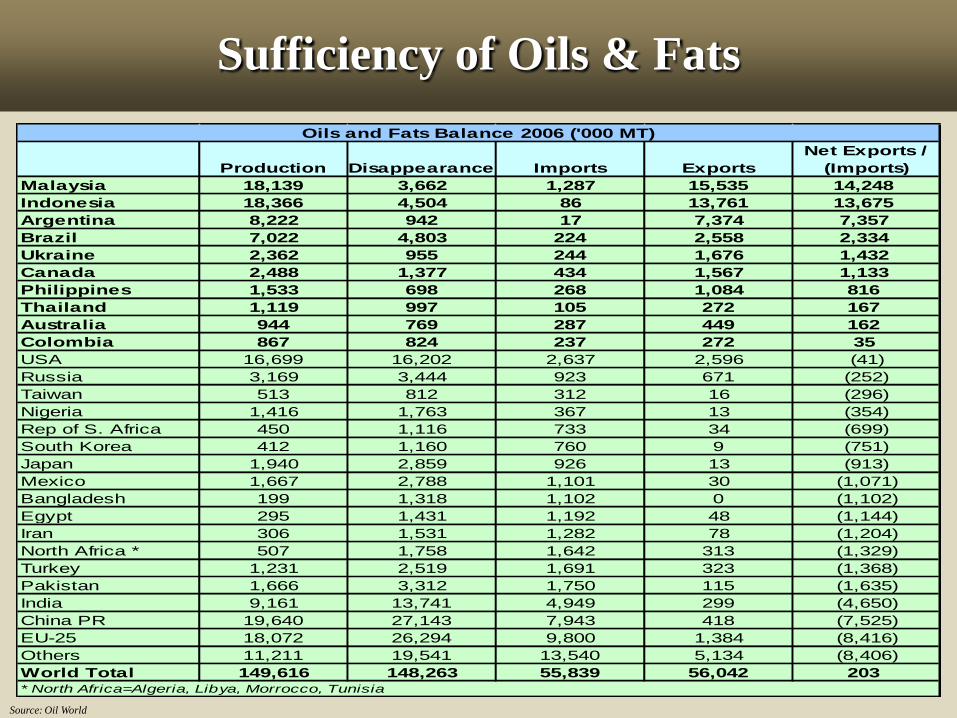
Production Disappearance Imports Exports
Net Exports /
(Imports)
Malaysia 18,139 3,662 1,287 15,535 14,248
Indonesia 18,366 4,504 86 13,761 13,675
Argentina 8,222 942 17 7,374 7,357
Brazil 7,022 4,803 224 2,558 2,334
Ukraine 2,362 955 244 1,676 1,432
Canada 2,488 1,377 434 1,567 1,133
Philippines 1,533 698 268 1,084 816
Thailand 1,119 997 105 272 167
Australia 944 769 287 449 162
Colombia 867 824 237 272 35
USA 16,699 16,202 2,637 2,596 (41)
Russia 3,169 3,444 923 671 (252)
Taiwan 513 812 312 16 (296)
Nigeria 1,416 1,763 367 13 (354)
Rep of S. Africa 450 1,116 733 34 (699)
South Korea 412 1,160 760 9 (751)
Japan 1,940 2,859 926 13 (913)
Mexico 1,667 2,788 1,101 30 (1,071)
Bangladesh 199 1,318 1,102 0 (1,102)
Egypt 295 1,431 1,192 48 (1,144)
Iran 306 1,531 1,282 78 (1,204)
North Africa * 507 1,758 1,642 313 (1,329)
Turkey 1,231 2,519 1,691 323 (1,368)
Pakistan 1,666 3,312 1,750 115 (1,635)
India 9,161 13,741 4,949 299 (4,650)
China PR 19,640 27,143 7,943 418 (7,525)
EU-25 18,072 26,294 9,800 1,384 (8,416)
Others 11,211 19,541 13,540 5,134 (8,406)
World Total 149,616 148,263 55,839 56,042 203
Oils and Fats Balance 2006 ('000 MT)
* North Africa=Algeria, Libya, Morrocco, Tunisia
Source: Oil World
Sufficiency of Oils & Fats

Future
Outlook

• World population is expected to rise exponentially
to another 1.5 billion people by 2020.
• Expansion of global economy – P.R of China,
India, ASEAN
• Improved technologies & biotechnology
• Agricultural and free trade policies
• Scarcity of land – Expansion vs Productivity vs
Environmental Concerns
Demand & Supply Drivers

54.257.6
22.124.3
22.3 21.4
12.29.3
0
10
20
30
40
50
60
70
USA EU-25 Japan World China Pakistan India Bangladesh
Per Capita Consumption of
Oils & Fats in 2006 (kg per yr)
Potential of Highly-Populated Countries

Total Oils & Fats Demand (million tonnes):
1996/2000 103.4 2001/2005 121.22011/2015 156.42016/2020 175.3
Source: Oil World 2020

Future Export Market
58 mil tonnes (average 2011-15)
Palm Oil
48%
Others
7%Animal
Fats
7%
Sun / Rape
14%
Soybean
20%

Malaysian Palm Oil Industry
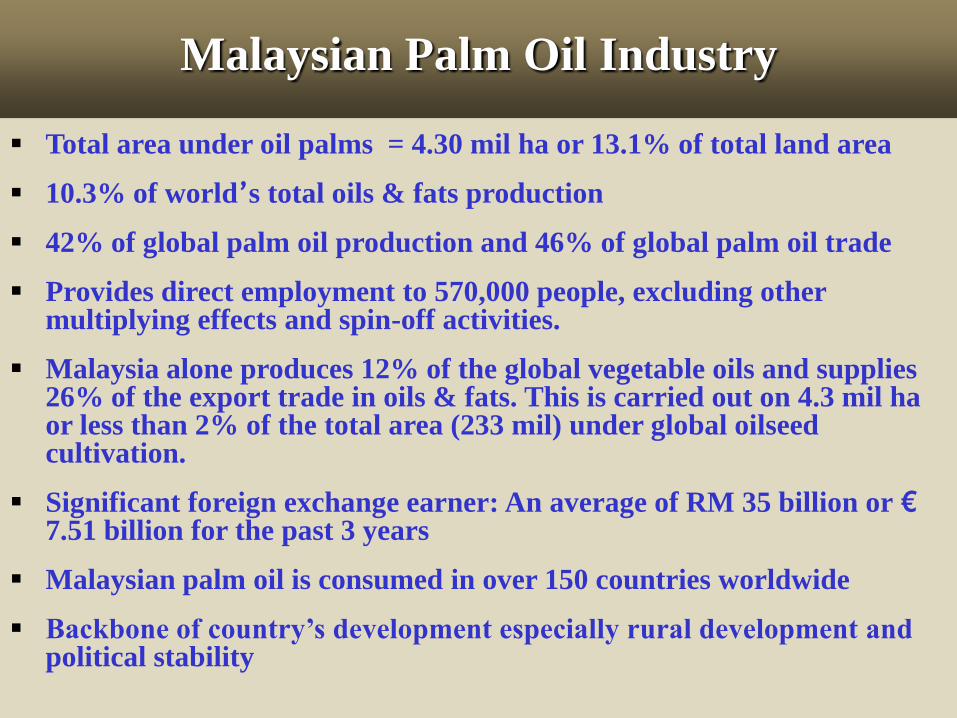
Total area under oil palms = 4.30 mil ha or 13.1% of total land area
10.3% of world’s total oils & fats production
42% of global palm oil production and 46% of global palm oil trade
Provides direct employment to 570,000 people, excluding other multiplying effects and spin-off activities.
Malaysia alone produces 12% of the global vegetable oils and supplies 26% of the export trade in oils & fats. This is carried out on 4.3 mil ha or less than 2% of the total area (233 mil) under global oilseed cultivation.
Significant foreign exchange earner: An average of RM 35 billion or €7.51 billion for the past 3 years
Malaysian palm oil is consumed in over 150 countries worldwide
Backbone of country’s development especially rural development and political stability
Malaysian Palm Oil Industry

The Journey from West Africa to Malaya
Oil palms in the wild mangroves in Africa
The 5 original steps used to extract palm oil One of the four Bogor palms planted in 1848
1
2
3
4
5

John Middleton Sime,
together with Henry Darby,
founded the first
Sime Darby estate
in Malacca in 1910
Alexander Guthrie:
Founder of Guthrie
Plantation Group in 1821
Sir Frank Swettenham:
Colonial official and schemer
The ‘British Connection’ – English, Scottish, Irish
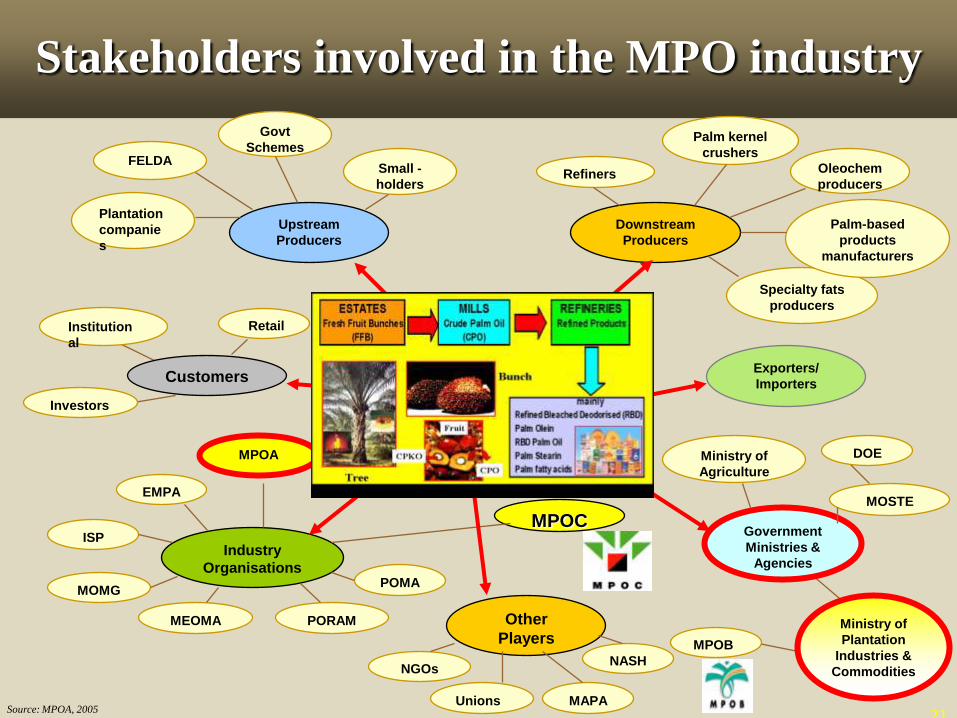
Stakeholders involved in the MPO industry
Customers
Other
Players
Industry
Organisations
Exporters/
Importers
Upstream
Producers
Downstream
Producers
Plantation
companie
s
FELDA
Govt
Schemes
Small -
holdersRefiners
Specialty fats
producers
Palm-based
products
manufacturers
Oleochem
producers
Palm kernel
crushers
POMA
MPOC
MPOA
PORAMMEOMA
MOMG
EMPA
ISP
Unions
NGOs
MAPA
NASH
Investors
Institution
al
Retail
MPOB
Ministry of
Plantation
Industries &
Commodities
Ministry of
Agriculture
Government
Ministries &
Agencies
DOE
MOSTE
21Source: MPOA, 2005

Ownership of Planted Area
Private Estates : 60%
Govt./State Schemes : 29%
Smallholders : 11%
2.36 mil ha : 55%
249 mills : 61%
37 ref’ns : 71%
18 oleoc’ : 100%
11 biodiesel : 84%
1.28 mil ha : 30%
115 mills : 28%
11 ref’ns : 21%
2 biodiesel : 16%
0.66 mil ha : 15%
42 mills : 10%
4 ref’ns : 7%
Peninsular
Malaysia
Sarawak
Sabah
Distribution of the Malaysian Oil Palm Business
& Ownership in 2007
Source: MPOB, 2008
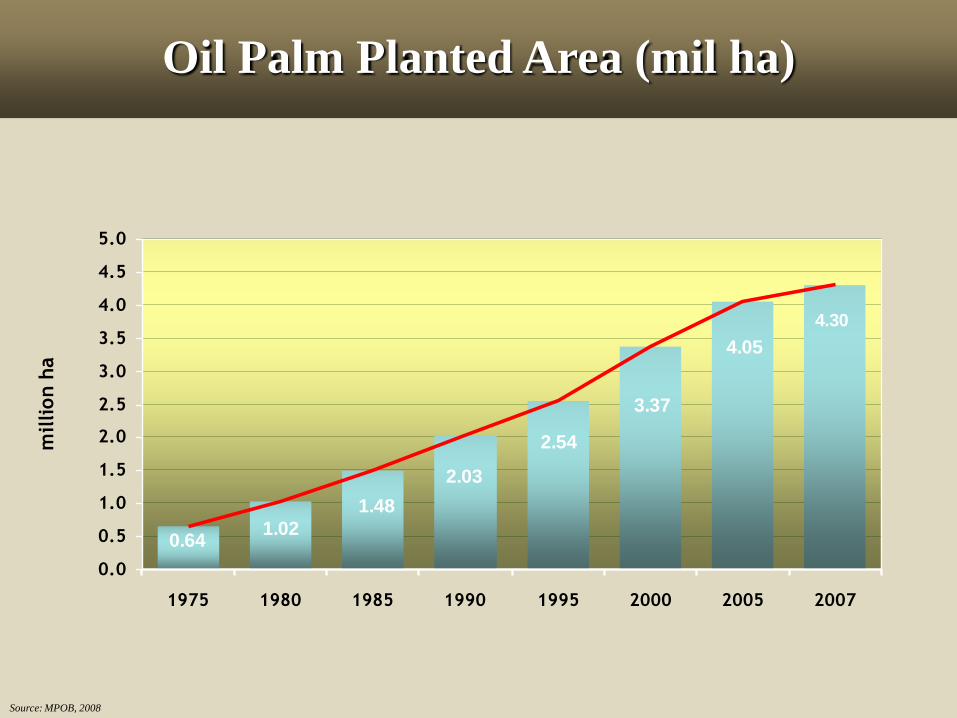
Oil Palm Planted Area (mil ha)
4.30
0.641.02
1.48
2.03
2.54
3.37
4.05
0.0
0.5
1.0
1.5
2.0
2.5
3.0
3.5
4.0
4.5
5.0
1975 1980 1985 1990 1995 2000 2005 2007
million h
a
Source: MPOB, 2008
Source: MPOB, 2008
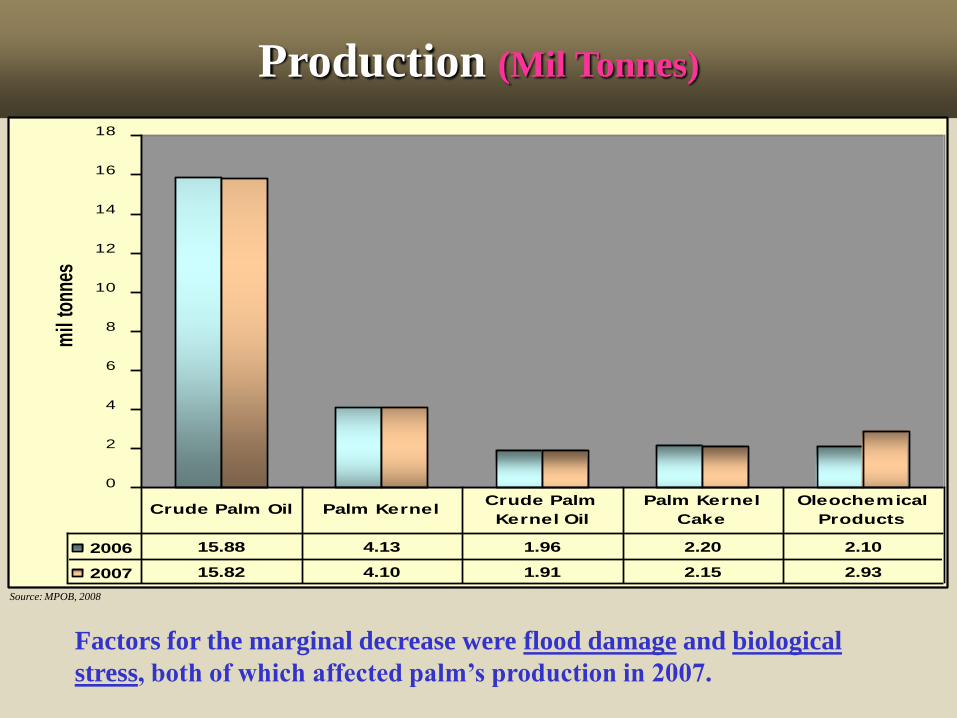
Production (Mil Tonnes)
Factors for the marginal decrease were flood damage and biological
stress, both of which affected palm’s production in 2007.
0
2
4
6
8
10
12
14
16
18
mil
tonn
es
2006 15.88 4.13 1.96 2.20 2.10
2007 15.82 4.10 1.91 2.15 2.93
Crude Palm Oil Palm Kernel Crude Palm
Kernel Oil
Palm Kernel
Cake
Oleochemical
Products

Product 2006 2007 Difference (%)
Palm Oil 14.42 13.74 -4.8
Palm Kernel Oil 0.93 1.06 14.1
Palm Kernel Cake 2.13 2.09 -1.9
Oleochemical
Products 2.16 2.23 3.4
Finished
Products 0.42 0.35 -16.5
Others 0.09 0.08 -6.1
TOTAL 20.16 19.56 -3.0Source: MPOB, 2008
Exports (Mil Tonnes)

Product 2006 2007 Difference (%)
Palm Oil 22.65 33.15 46.4
Palm Kernel Oil 2.16 3.11 43.9
Palm Kernel Cake 0.42 0.76 80.4
Oleochemical
Products 5.60 6.91 23.3
Finished
Products 0.90 1.10 22.7
Others 0.079 0.083 4.0
TOTAL 31.81 45.11 41.8Source: MPOB, 2008 Average exchange rate 2007 : RM 4.66 = € 1
Export Revenue (RM Billion)
Total export revenue for 2007 is RM 45.11 bil or approx € 9.68 bil
0
2
4
6
8
10
12
14
16
19
80
19
82
19
84
19
86
19
88
19
90
19
92
19
94
19
96
19
98
20
00
20
02
20
04
20
06
Millio
n T
on
ne
s
2 00
7
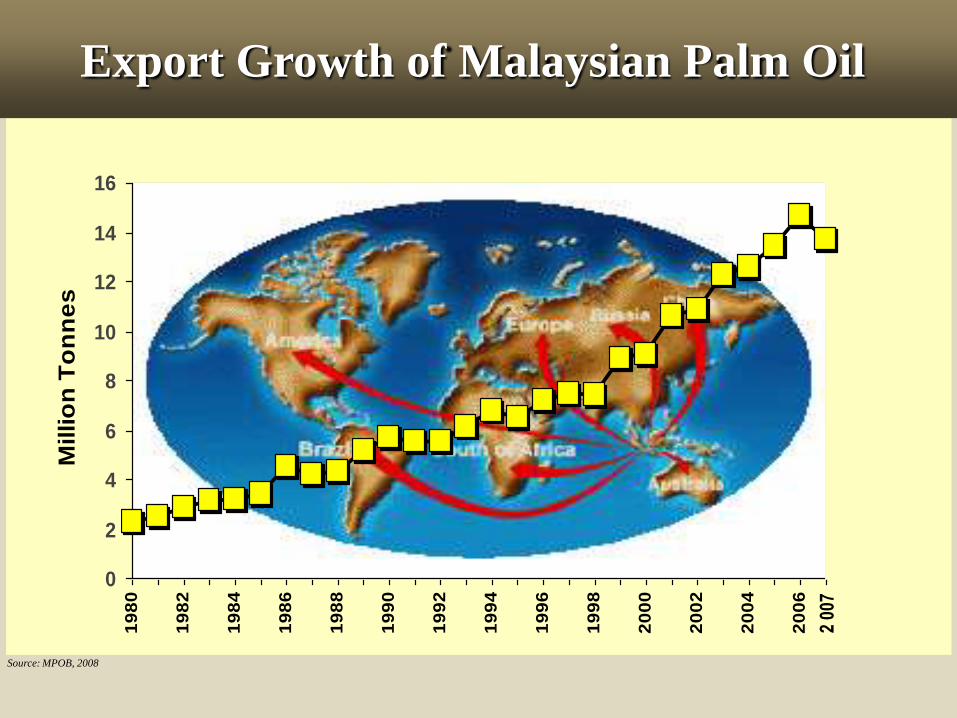
Export Growth of Malaysian Palm Oil
Source: MPOB, 2008

15.8
16.8
0.8 0.8 1.0
2.9
0.0
2.0
4.0
6.0
8.0
10.0
12.0
14.0
16.0
18.0
Malaysia Indonesia Nigeria Colombia Thailand Others
million t
onnes
Total Output = 38.2 mil tonnes
Comparison between Malaysia and Other Palm Oil
Producers in 2007
Source: Oil World, MPOB, 2008

Indonesia
44%
Others
15%
Malaysia
41%
Indonesia
42%
Others
11%
Malaysia
47%
Palm Oil Production & Exports for 2007
Malaysia vs Indonesia
Source: Oil World, MPOB, 2008
Export
Production

13%9%
11%
3%
47%
5%
28%
4%
15%
8%
6%35%
4%
12%
China
India
EU
Pakistan
USA
Others
Japan
Major Importers of Malaysian Palm Oil
Source: MPOB, 2008
19902007

Issues related to Environment, Social Aspects
& Sustainability

Environment:
a) Deforestation
b) Global warming – CO2 emission
c) Loss of biodiversity & wildlife especially orang utan
Social:
a) Customary rights of native people
b) World’s poverty & hunger – rarely mentioned!!
Sustainability:
a) Food vs Non-food Requirements
Issues of concern

• Formulated to ensure that the capability of the agricultural sector's
strategic role in national development is sustained and enhanced in
light of new and emerging challenges facing agricultural development
• In the NAP 3, two new strategic approaches are adopted
a) agroforestry approach: aimed at addressing the increasingly scarce
resources including land and raw material availability
b) product-based approach: adopted to reinforce and complement the
cluster-based agro-industrial development as identified in the
Second Industrial Master Plan 1996-2005 through strengthening
both inter and intra-sectoral linkages including the development
and expansion of intermediate and supporting industries
National Agricultural Policy 3
(2000 – 2010)

Total Forest Area
18.31
0.57 15.30
0.57
2.44
2.44
NATIONAL PARKS/
WILDLIFE
& BIRD SANCTUARIES
(13.3%)
PERMANENT RESERVED
FORESTS
(83.4%)
STATE LAND/
ALIENATED LAND
(3.3%)
PRODUCTION
(SFM)TOTALLY
PROTECTED
3.1112.19
5.55
30.3%
12.76
69.7%
TOTALLY PROTECTEDPRODUCTION
(CONVERSION)
Source: Thang C.H.

Forest Cover Change in Malaysia from 1995 – 2005
(mil ha)
Forest Cover Type 1995 2000 2005
Permanent Reserved Forest
(PRF)– Protected
3.43 3.84 3.11
PRF– Sustainable Forest
Management
10.85 10.60 12.19
National Parks, Wildlife & Bird
Sanctuaries and Nature Reserves
– Totally Protected
2.12 1.87 2.44
Stateland/Alienated Land
Forest – Conversion Forest
4.19 3.93 0.57
TOTAL 20.59 20.24 (-1.7%) 18.31 (-9.5%)
Source: FAO, 7th, 8th and 9th Malaysian Plans, Forestry Department of Malaysia, Ministry of Plantation Industries & Commodities, Satoshi Tachibana,S. Sothi Rachagan, and Thang H.C.
1) Deforestation mainly occurs in the stateland/alienated land which has
been earmarked for economic development
2) Changes in the hectarage of PRFs and national parks, wildlife & bird
sanctuaries and nature reserves are due to reclassification.

1) The Convention on Biological Diversity 1992
2) International Tropical Timber Agreement, and
3) Charter of the Indigenous-Tribal Peoples of
Tropical Forests
Malaysia is committed to
preserving its forest resources through
Sustainable Forest Management (SFM)
Malaysia is a signatory to

Chart 7: Changes in Land Use
of Selected Tree Crops in Malaysia
1990 = 4.39 million ha
Collectively, other agriculture
crops lost 1.02 mil ha which were
mainly converted to oil palm from
1990 to 2007
2007 = 5.65 million ha
Crop
Oil Palm
Rubber
Cocoa
Coconut
Total
1990
2.029
1.836
0.393
0.134
4.392
2007
4.3
1.2e
0.038e
0.109e
5.647
Oil Palm, 46%
Rubber, 42%
Coconut, 3%
Oil Palm, 76.1%Rubber, 21.3%
Coconut, 1.9%
Cocoa, 9%
Cocoa, 0.7%
Note: e estimates
Source: MPOB, Malaysian Rubber Board, Agriculture Department, Malaysian Cocoa Board
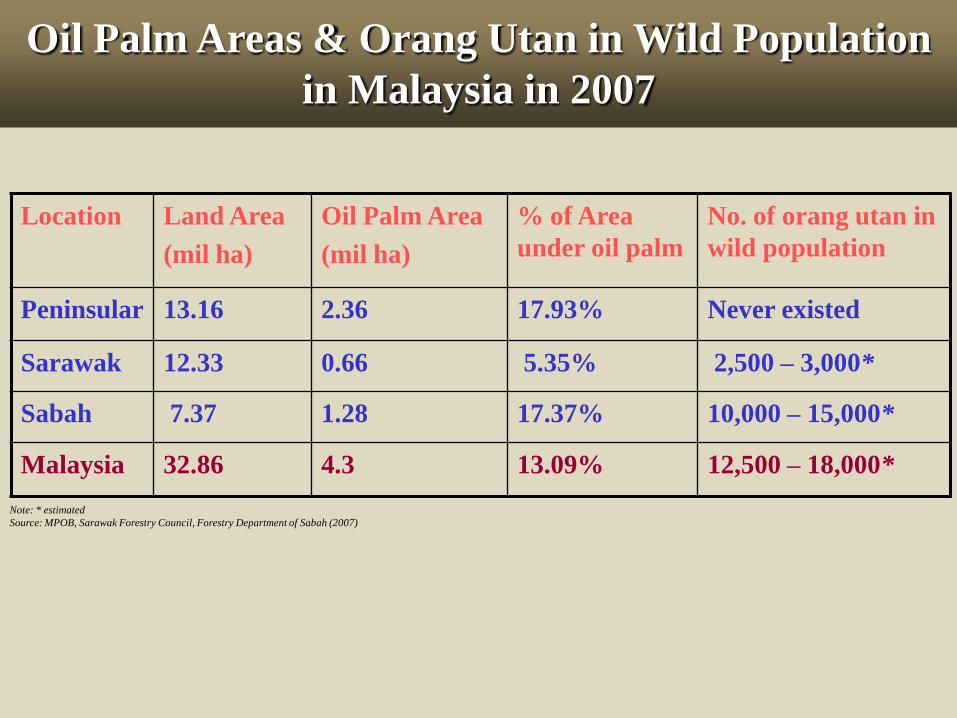
Oil Palm Areas & Orang Utan in Wild Population
in Malaysia in 2007
Location Land Area
(mil ha)
Oil Palm Area
(mil ha)
% of Area
under oil palm
No. of orang utan in
wild population
Peninsular 13.16 2.36 17.93% Never existed
Sarawak 12.33 0.66 5.35% 2,500 – 3,000*
Sabah 7.37 1.28 17.37% 10,000 – 15,000*
Malaysia 32.86 4.3 13.09% 12,500 – 18,000*
Note: * estimated
Source: MPOB, Sarawak Forestry Council, Forestry Department of Sabah (2007)

Oil palms areas in Sarawak are mainly concentrated in the coastal areas where no
orang utans are found. Indeed, the areas at borderline with Kalimantan, where
most of the orang utans in the state are found, are not suitable for oil palm
cultivation.

The state government
through Sarawak Forestry
Council continues to
identify its forest areas for
high populations of orang
utans. If such areas have
been identified, the state
government will gazette the
areas as a wildlife sanctuary
or national park. Current
areas that have been
gazetted are in the table on
the right.
Sarawak Government’s Policy
No. Location in Sarawak Estimated
Orang Utan
Populations
1 Lanjak Entimau
Wildlife Sanctuary
1,400
2 Batang Ai National
Park
300
3 Ulu Sebuyau National
Park
300
4 Semenggoh & Matang
Rehabilitation Centers
35
TOTAL 2, 035
Source: Sarawak Forestry Council (2007)

Tabin
Wildlife Reserve
Kulamba Wildlife
Reserve
Kinabatangan Wildlife Sanctuary
Sepilok Orangutan Sanctuary
Malua Forest Reserve
Segaliud-Lokan FR
Deramakot FR
Tangkulap FR
Ulu Pinangah FR
Ulu Segama
FR
Danum Valley Conservation
AreaKuamut FRGn. Rara FR
Kalabakan
FR
Sapulut FR
Maliau Basin
Conservation Area
Map showing major forest
reserves with orang utan populations
in Sabah. Ulu Segama-Malua area
has the highest concentrations with
6,000 – 7,000 or half of the total of
orang utans in Sabah.

Malaysian Palm Oil Conservation Fund
• Launched in 2006
• Initial contribution of € 2.2 mil (RM 10 mil) from the industry,government agencies and the public
• Operated as ‘matching grant' basis
• To achieve € 4.3 million (RM 20 mil) target
• Aimed at enhancing conservation of wildlife and biodiversity efforts
• Beneficial to all palm oil stakeholders worldwide
• Approved projects include:
a) upgrading of the infant unit of an Orang Utan
Research & Rehabilitation Center
b) establishing a jungle patrol unit for Sabah Wildlife
Department
c) developing information materials for Tabin Wildlife Reserve,
Sabah

Carbon Sequestration: Oil Palm vs. Soyabean
Oil palm is more effective than soybean in reducing the effects of global
warming
Crop Total
Planted
Areaa
(mil ha)
CO2 absorbed
(mil t/year)
O2 released
(mil t/year)
Average
CO2
absorbed
(t/ha/year)
Average
O2
released
(t/ha/year)
Soyabean 94.15 331.4 241.0 3.52 2.56
Oil Palm 10.55 309.1 224.7 29.3 21.3
Note: a 2007 figures
Source: Oil World Dec 2007, Chan 2002

Oil Palm Plantations: Biodiversity, Riparian
Reserves & Wildlife Corridor
Riparian Reserves Wildlife Corridor
Biodiversity

Malaysian Palm Oil Industry
Adopting Good Agricultural &
Management practices
“Zero” burning policy
Natural fertilizers
Erosion control
Moisture retention
Integrated Pest Management
Recycling of biomass

Examples of Good Agricultural Practices
Recycling of Biomass „Beneficial‟ Plants
Leguminous Cover Crop „Zero‟ Burning

Integrated Pest Management
Integrated Pest Management (IPM) using biological control is
increasingly practised in the plantations

Items (unit) Soyabean Oil Sunflower Oil Rapeseed Oil Palm Oil
Inputs
Seeds for planting (kg) 150 6.3 2.5
Nitrogen (kg) 315 96 99 47
Phosphates (kg) 77 72 42 8
Pesticides/
Herbicides (kg)
29 28 11 2
Others (kg) 117 150 124 88
Energy (GJ) 2.9 0.2 0.7 0.5
Outputs
Oilseed/fruits (kg) 5000 2500 2500 4540
Emissions to soil and water (kg)
-Nitrogen
-Phosphates
-Pesticides/herbicides
32
23
23
10
22
22
10
13
9
5
2
0.4
Emissions to air (kg)
-NOX
-SO2
-CO2
-Pesticides/herbicides
4
2
205
6
0.3
0.1
16
6
0.8
0.4
50
2
0.5
0.2
32
0.1
Input-Output Analysis of Intensive Oilseeds & Oil Palm Cultivation
(per tonne of oil)
Source: FAO (1996)

From fronds during regular pruning rounds
Dry matter per hectare = 10 tonnes x 22 years
= 220 tonnes
Carbon equivalent per hectare = 88 tonnes
(@40% C to organic matter)
From trunks and fronds at replanting
Dry matter per hectare = 100 tonnes
Carbon equivalent per hectare = 40 tonnes
(@40% C to organic matter)
From male to flowers that decay and fall to the ground
Dry matter per hectare = 27 tonnes
Carbon equivalent per hectare = 10.8 tonnes
(@40% C to organic matter)
From empty fruit bunch mulching (EFB)
Dry matter per hectare = 30 tonnes
Carbon equivalent per hectare = 12 tonnes
COMBINED BIOMASS RECYCLED ON LAND DURING THE COURSE OF
ONE GENERATION OF OIL PALM
Dry matter per hectare = 220 + 100 + 27 + 30
(organic matter) = 377 tonnes
Carbon equivalent per hectare = 150.8 tonnes
OIL PALM BIOMASS RECYCLED ON LAND AND ITS CONTRIBUTION
TO THE CARBON ECONOMY OF THE SOIL
(DURING THE COURSE OF ONE GENERATION OF PALMS)
Source: Dr Gurmit Singh/UP Plantations (1999)

Energy-efficient Crop
Oil palm is an energy
efficient crop that
requires less energy input
to produce 1 tonne of oil
0
20
40
60
80
100
120
140
160
180
200
Oil Palm Soybean Rapeseed
Input
Output
En
ergy, G
J/h
a
19 20 23
7050
182
•The energy expressed by the ratio of energy output to input is wider
for oil palm than any other commercially grown oil crops.
•The oil palm’s cultivation and processing requires lower inputs of
agrochemicals (pesticides), fertilizers and fossil fuels to produce one
tonne of oil, with fewer resulting emissions and pollutants
Source: Wood & Corley, 1991

Highly-Regulated Industry
1) Land Acquisition Act 1960
2) Land Conservation Act 1960 revised in 1989
3) National Land Code 1965
4) Protection of Wildlife Act 1972
5) Environmental Quality Act 1974 (Environmental Quality) (Prescribed Premises) (Crude Palm Oil) Regulation 1977
6) Environmental Quality (Clean Air) Regulation 1978
7) Labor Law
8) Workers‟ Minimum Standard of Housing & Amenities Act 1990
9) Occupational Safety & Health Act 1977
10) Pesticides Act 1974 (Pesticides Registration) Rules 1988
11) Pesticides (Licensing for sale & storage) Rules 1988
12) Pesticides (Labeling) Regulations 1984
13) Environmental Quality (Prescribed Activities) (Environmental Impact Assessment) Order 1987
14) Factories & Machinery (Noise Exposure) Regulations 1989

Socially Responsible
• Sarawak State Government
enforces customary rights of
its native people
• Oil palm industry is a
major employer with > 0.5
mil people employed directly
• Help reduce migration and
instrumental in the
development of secondary
towns and centers in rural
areas
• Provides places of worship,
houses, schools, clinics, and
other basic necessities in
estates

The EU Target on Biofuel
(% of total fuel share):
2005 2%
2010
2010 10.0%
5.75%
(Revised)
• Availability of biodiesel to supply shortages in the EU and
other countries offers mutual benefits
• 6 mil tonnes of rapeseed in EU can’t cope with demand
• Palm biodiesel is best positioned to fill the 40% gap
• If biofuel intended use is to reduce global warming, palm
biodiesel is a viable option
(9.0 mil tonnes)
(15.7 mil tonnes)

• Malaysia has initiated steps to blend the commodity with diesel to power up the domestic transportation and industrial sectors.
• National Biofuel Policy launched in May 2006 to mandate the blending of diesel with processed palm oil.
• A 5% palm-diesel mixture (B5) has been set as the winning formula.
• The B5 is expected to use up an additional 0.5 mil tonnes of palm oil per year. This will augur well for the average price of palm oil.
National Biofuel Policy

Why is Palm Oil the
Ideal Choice?
fulfills the 3 indicators of sustainability
. People
. Planet
. Profits
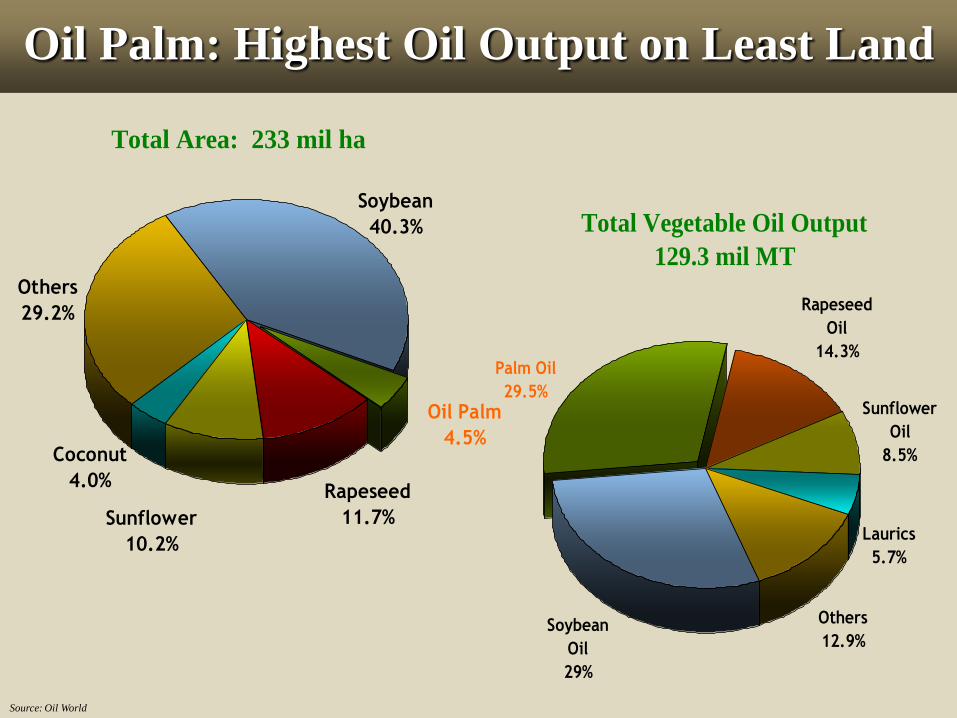
Oil Palm: Highest Oil Output on Least Land
Total Area: 233 mil ha
Sunflower
10.2%
Coconut
4.0%
Others
29.2%
Soybean
40.3%
Oil Palm
4.5%
Rapeseed
11.7%
Total Vegetable Oil Output
129.3 mil MT
Sunflower
Oil
8.5%
Laurics
5.7%
Others
12.9%Soybean
Oil
29%
Palm Oil
29.5%
Rapeseed
Oil
14.3%
Source: Oil World

Oil Palm vs Other Oilseed Crops
Average Oil Yield(t/ha/year)
Soybean0.40
Sunflower0.46
Rapeseed0.68
Oil Palm3.62
Oil Crop
Soybean
Sunflower
Rapeseed
Oil Palm
TOTALb
Production(mil tonnes)
% of TotalProduction
Average Oil Yield(t/ha/year)
Total Area(mil ha)
%Area
37.48
11.00
18.52
38.16a
117.47
31.91
9.36
15.77
32.48
0.40
0.46
0.68
3.62
94.15
23.91
27.22
10.55
221.45
42.52
10.80
12.29
4.76
Note: aonly for palm oilbonly for the 7 major oils (groundnut, coconut, cottonseed and the above oils)
Source: Oil World Dec 2007

-55
-5
45
95
145
195
US
$/M
T
Premium of SBO over PO
Palm Oil - Greater Value for Money
250
350
450
550
650
750
850
950
1990
1991
1992
1993
1994
1995
1996
1997
1998
1999
2000
2001
2002
2003
2004
2005
2006
2007
US
$/M
T
CPO CDSBO

Palm Oil Markets (1976 vs 2007)
0%
10%
20%
30%
40%
50%
60%
70%
80%
90%
100%
1976 2007
Developed Countries Developing Countries
62%
38%
80%
20%

Attacks by NGOs:
What is the reality?

Malaysian Agricultural Area vs World
Agricultural Area
World Oilseed Area in 2007: 233 mil
ha
Sunflower
10.25%
Coconut
3.98%
Others
31.93%
Soybean
40.34%
Malaysian
Oil Palm
1.85%
Rapeseed
11.66%
World Malaysia Malaysian
Oil Palm
4,967.5 7.87 4.05
Comparison of Agricultural
Areas in 2005 (mil ha)
In 2005, Malaysia utilized only 4.05 mil
ha of its land for oil palm or 0.08% of
the world’s total agricultural land.
Source: Oil World 2007
Source: FAO 2005
• In 2007, the world population was recorded
at about 6.6 billion whereas Malaysia
recorded a population of 24.8 million.
• Malaysia’s population only represents about
0.38% of the world's
Comparison on Population

• Every 10 new cars produced during their lifetime will emit CO2 equivalent to that emitted by deforestation of one hectare of rainforest
• Yearly production of 15 million new cars by EU will emit GHGs equivalent to the deforestation of 1.5 million hectares of rain forest.
• Is oil palm the cause of CO2 emission?
In three years, the EU's introduction of new cars alone would emit CO2 equivalent to 4.5 million hectares of rainforest being destroyed.
• In comparison, the total oil palm area in Malaysia has only managed to reach 4.3 million hectares presently after over 90 years of development since the industry was first established in 1917.
The Real Culprit in CO2 Emissions

Malaysia continues to serve the needs of the
consuming countries and the world…
Balancing between economic, environment,
& social needs of mankind!
