carbon footprint of malaysian palm oil and future areas...
TRANSCRIPT
Carbon Footprint of Malaysian Palm oil
and Future Areas of Research
Chan Kook Weng

Outline of presentation
• Introduction
• Five initiatives
• Develop a C sustainability framework
• Aim of paper
• Understand carbon footprint
• Research into oil palm carbon footprint
• Climate change, carbon market, standards
• Way forward and conclusion
Introduction
• Overarching requirement of C footprint
• Address climate change
• Reduce greenhouse gas & global warming
• Five initiatives: - Harmonized approach
- Ensure palm oil industry is green
- Gaining global creditability
- Define sustainability of industry
- Readiness to tackle climate change

- Carbon
credit
- Regulated market
- Voluntary
market
Green
currency
-1 t
- CO2
- CO2 e
- Global Warming Potential
- CH4
- 21 times
- N2O
- 296 times
Maintain
creditability
of carbon unit
- C allowances
- C credit
- C offset
- C-Lucrative
business
Carbon Footprint
& Neutrality
Building
confidence
Computing
- Carbon balance
- No rush
- Standardized
methodology
- Multilateral
agreement
- Ad hoc
methods Five Initiatives
1. Harmonize
approach
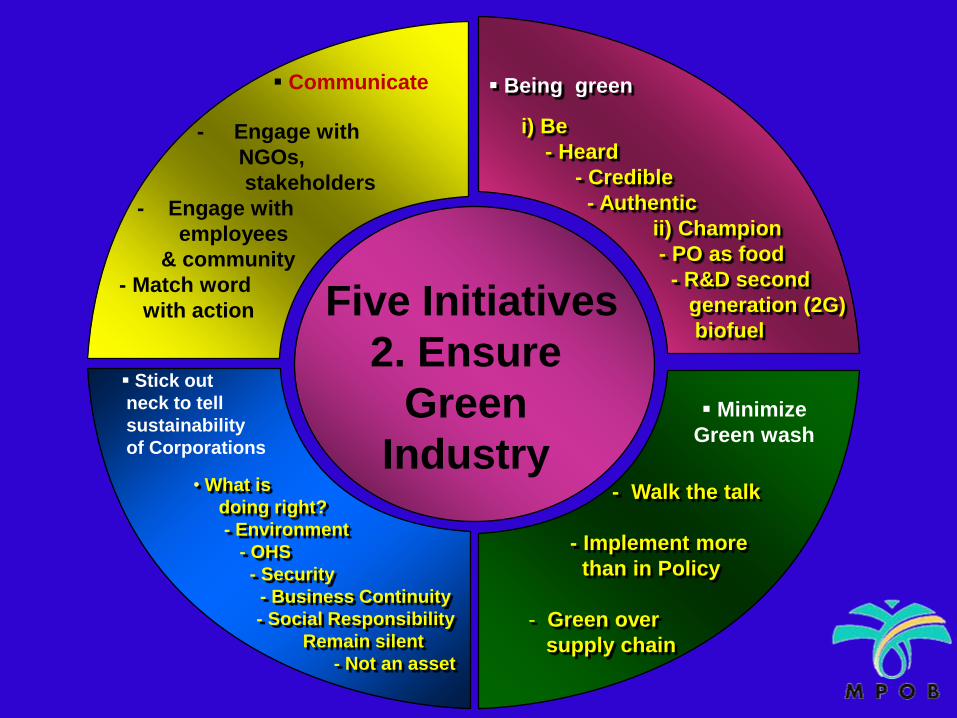
- Walk the talk
- Implement more
than in Policy
- Green over
supply chain
Minimize
Green wash
• What is
doing right?
- Environment
- OHS
- Security
- Business Continuity
- Social Responsibility
Remain silent
- Not an asset
Stick out
neck to tell
sustainability
of Corporations
- Engage with
NGOs,
stakeholders
- Engage with
employees
& community
- Match word
with action
Communicate Being green
i) Be
- Heard
- Credible
- Authentic
ii) Champion
- PO as food
- R&D second
generation (2G)
biofuelFive Initiatives
2. Ensure
Green
Industry

- Broad applicability
- Consistency
- Reproducibility
- Transparency
- Assurance
Standardized
Methodologies
-Resource use
- Energy efficiency
- Conservation
- Recycling
- Smart energy
- Reduction of fossil fuel
- Over supply chain
- Use knowledge
- innovation
Reduce GHG
Emissions
- Do complete
LCA
- New low carbon
processes
- C-Management
Strategies
Collect &
generate Data
Demonstrate
Strong commitment
To -Sustainability
- MS OP GAP
- RSPO
-Codes of Practice
- ISO Standards Five Initiatives
3.Gain Global
Credibility
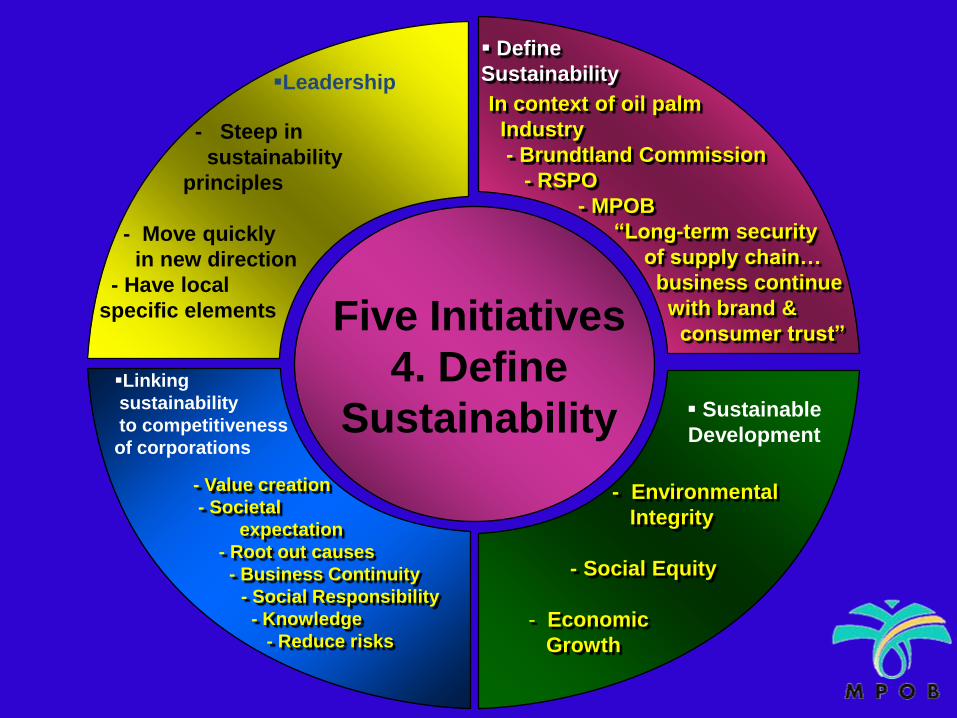
- Environmental
Integrity
- Social Equity
- Economic
Growth
Sustainable
Development
- Value creation
- Societal
expectation
- Root out causes
- Business Continuity
- Social Responsibility
- Knowledge
- Reduce risks
Linking
sustainability
to competitiveness
of corporations
- Steep in
sustainability
principles
- Move quickly
in new direction
- Have local
specific elements
Leadership
Define
Sustainability
In context of oil palm
Industry
- Brundtland Commission
- RSPO
- MPOB
“Long-term security
of supply chain…
business continue
with brand &
consumer trust” Five Initiatives
4. Define
Sustainability
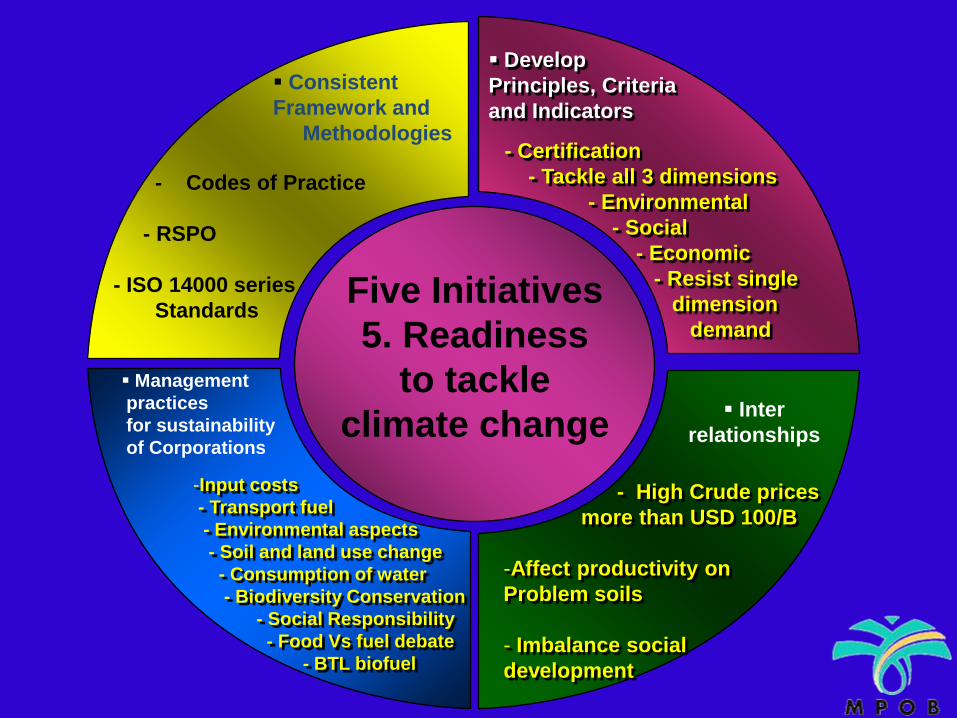
- High Crude prices
more than USD 100/B
-Affect productivity on
Problem soils
- Imbalance social
development
Inter
relationships
-Input costs
- Transport fuel
- Environmental aspects
- Soil and land use change
- Consumption of water
- Biodiversity Conservation
- Social Responsibility
- Food Vs fuel debate
- BTL biofuel
Management
practices
for sustainability
of Corporations
- Codes of Practice
- RSPO
- ISO 14000 series
Standards
Consistent
Framework and
Methodologies
Develop
Principles, Criteria
and Indicators
- Certification
- Tackle all 3 dimensions
- Environmental
- Social
- Economic
- Resist single
dimension
demand
Five Initiatives
5. Readiness
to tackle
climate change
Develop Sustainability Framework to Assess Carbon Balance
• Have an objective
• Develop principles
• Have criteria
• Look at indicators
• Have verifiers
• Certification

Urgency to be Green
• Narrow gap of compliance
• Doing best to fulfill requirement but not fast
enough
• Speed to market yet possess technical
rigour
• Data collection remains fragmented
• Quality of data, Action plans, Milestones,
Deliverables, Budgets and Reviews

Aim of paper
• Take action to reduce GHG emissions
- UNFCCC Fourth Assessment Report
- Stern Report
- Bali Roadmap
• Tell Malaysian palm oil industry’s reduction
of carbon footprint on Government,
business and individual levels
Understanding Carbon Footprint, Offset
and Carbon Neutral Claims
• (Carbon footprint + Offset = Carbon neutral)
• Carbon footprint = Carbon emission
• Carbon offset = Carbon credit or removal
• Carbon neutral when carbon footprint equals
carbon offset
• Put carbon eco label on products
• Who to pay for food miles?

EU targets for renewable energy and Biofuel
in 2010 and 2020
Sources 2010 2020
Renewable Energy (Biofuel, Solar, Wind, Hydro, Geothermal, etc)
10% 20%
Biofuel 5.75% 10%
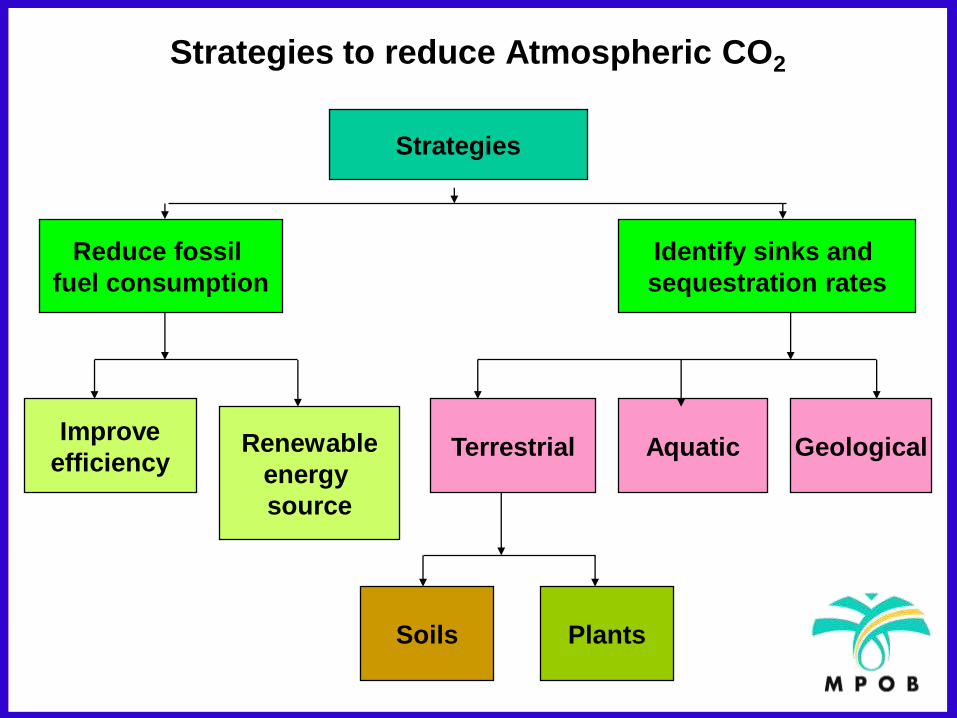
Strategies to reduce Atmospheric CO2
Strategies
Reduce fossil
fuel consumption
Identify sinks and
sequestration rates
Improve
efficiencyRenewable
energy
source
Terrestrial Aquatic Geological
Soils Plants
Avoid Conflicting Approaches
• A detailed full MPOB LCA study in progress
• Review of current published work
• MPOB interim studies on carbon accounting
• Research into carbon footprint at 3 levels
• Local, Landscape or Regional and National
levels
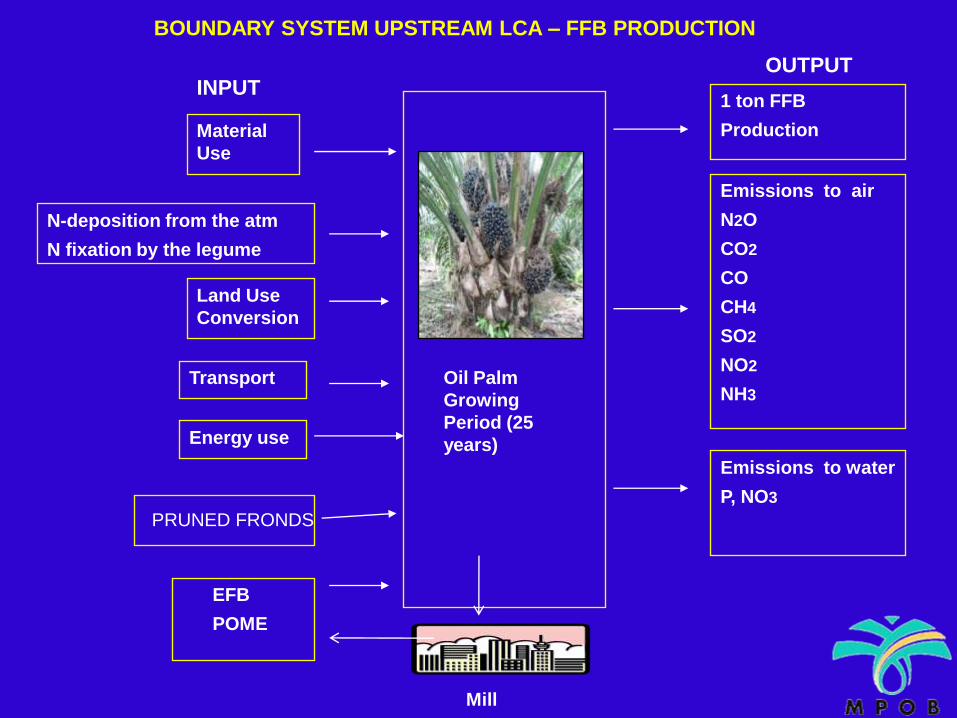
Mill
Material
Use
Energy use
Transport
Land Use
Conversion
Emissions to water
P, NO3
Emissions to air
N2O
CO2
CO
CH4
SO2
NO2
NH3
1 ton FFB
Production
Oil Palm
Growing
Period (25
years)
BOUNDARY SYSTEM UPSTREAM LCA – FFB PRODUCTION
INPUTOUTPUT
N-deposition from the atm
N fixation by the legume
EFB
POME
PRUNED FRONDS

Methodology for GHG Emission for Palm Oil
Emissions Requirements Comments
a) Cultivation and harvesting
Emissions from fertilizers, pesticidesand machinery at 338 and not666kg/t biodiesel compared with 1411and 1110 Kg/t each for sunflower andrape
Palm oil has advantage with lower inputs at 18 versus rape at 30gCO2e/MJ
b) Carbon stockchanges from land use
Mentioned in the equation but not forma part of the whole calculation of carbon balance and default figures are hardly provided. The carbon stock at 189tC/ha is high compared with 51tC/ha obtained
The inclusion of this is often neglected in the directive; and spreading to 20 years means one cycle of palm
c) Processing The factor encompasses a wide range of emissions from milling to esterification.
It is felt that 1221kg/t biodiesel is lower than 1311kg/t quoted or 481 Vs 435kg/t for non-waste situation
d) Transport Overall emission is small. At 185kg/t biodiesel is 5 times higher than 37kg/t for sunflower and rape
It is felt that emission at 5 times more than rape, palm oil transport is still small
Emissions = a + b + c + d + e – f – g -h

Methodology for GHG Emission for Biofuel
Emissions Requirements Comments
e)Fuel in use
These factors can only be non-zero in situations where CO2
emissions incurred during the production of vegetable oils are stored underground or reused for industrial purposes. This is difficult and expensive even in large CO2-rich flow let alone a vegetable oil supply chain with dispersed CO2 emission sources
It is felt that this may be set to zero
f) Savings from carbon capture and sequestration
This is felt that this may be set to zero
g) Saving from Carbon capture and replacement
This is felt that this may be set to zero
h) Savings from excess electricity
This is felt that this could be larger than zero as in some mills have excess electricity for sale to national grid
Emissions = a + b + c + d + e – f – g -h
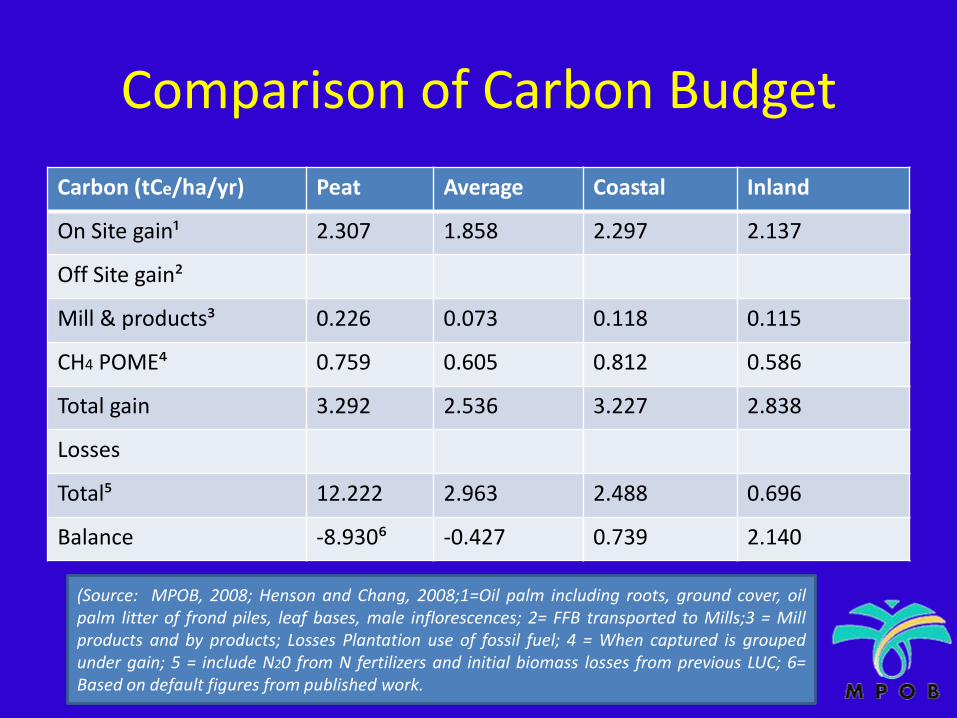
Comparison of Carbon Budget
Carbon (tCe/ha/yr) Peat Average Coastal Inland
On Site gain¹ 2.307 1.858 2.297 2.137
Off Site gain²
Mill & products³ 0.226 0.073 0.118 0.115
CH4 POME⁴ 0.759 0.605 0.812 0.586
Total gain 3.292 2.536 3.227 2.838
Losses
Total⁵ 12.222 2.963 2.488 0.696
Balance -8.930⁶ -0.427 0.739 2.140
(Source: MPOB, 2008; Henson and Chang, 2008;1=Oil palm including roots, ground cover, oilpalm litter of frond piles, leaf bases, male inflorescences; 2= FFB transported to Mills;3 = Millproducts and by products; Losses Plantation use of fossil fuel; 4 = When captured is groupedunder gain; 5 = include N20 from N fertilizers and initial biomass losses from previous LUC; 6=Based on default figures from published work.
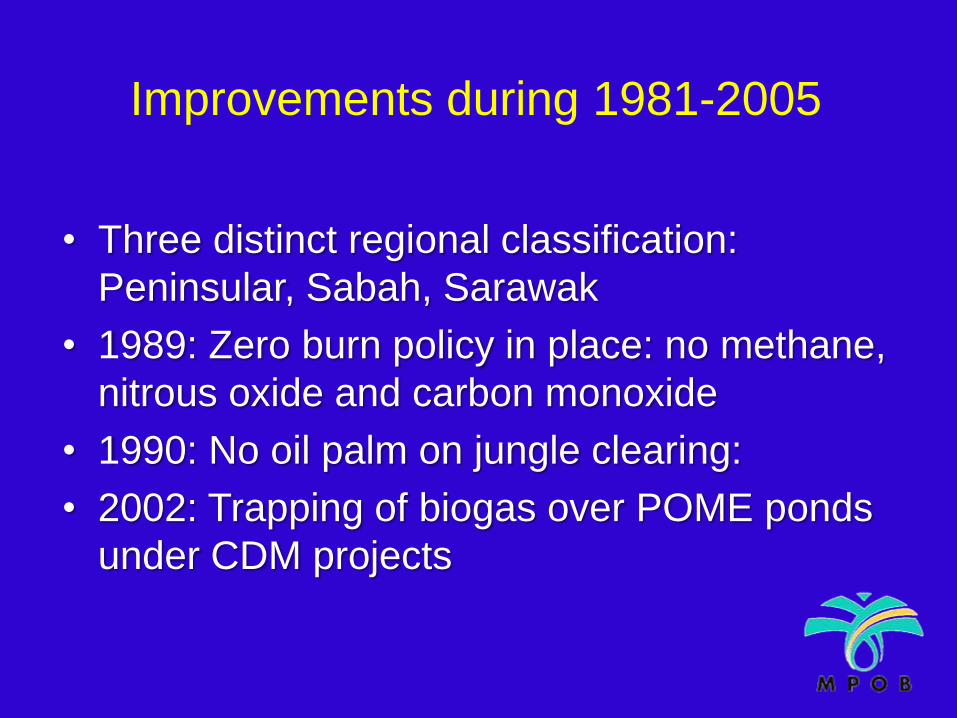
Improvements during 1981-2005
• Three distinct regional classification:
Peninsular, Sabah, Sarawak
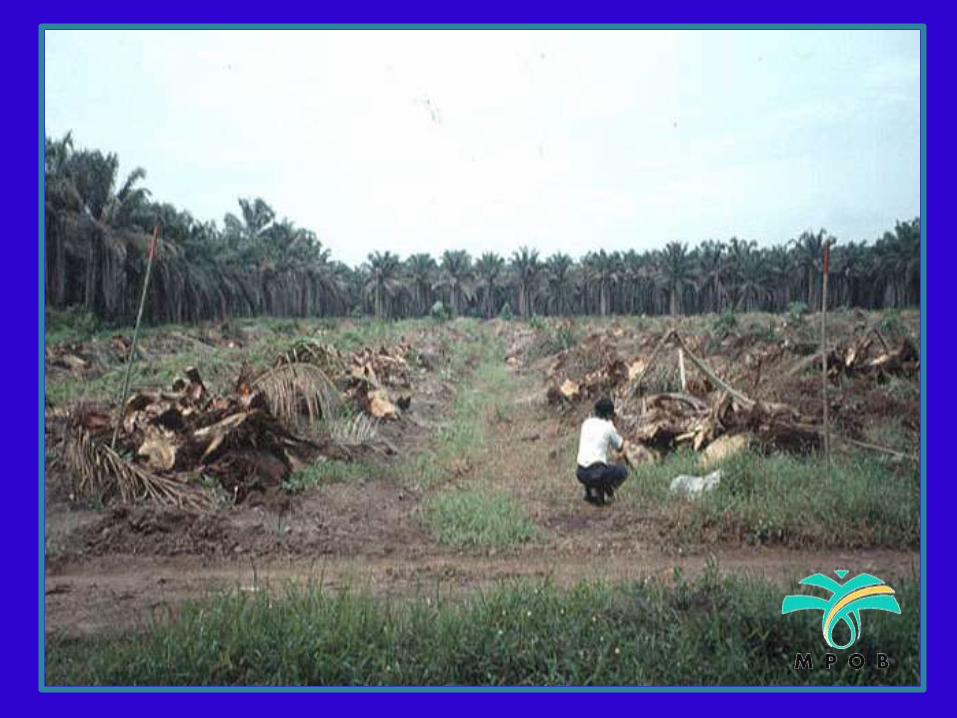
• 1989: Zero burn policy in place: no methane,
nitrous oxide and carbon monoxide
• 1990: No oil palm on jungle clearing:
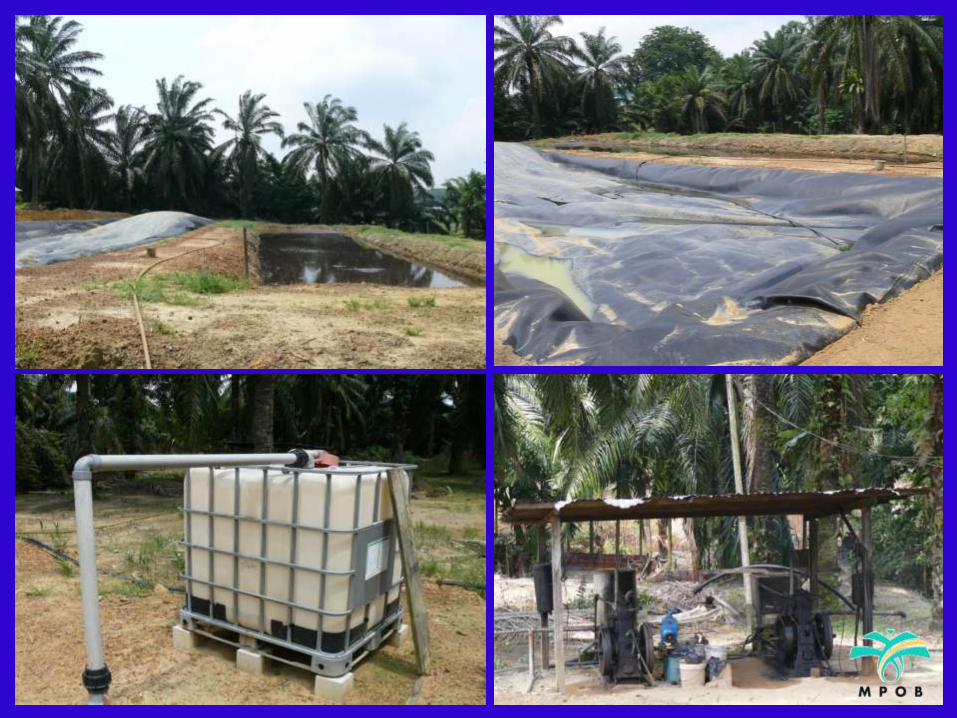
• 2002: Trapping of biogas over POME ponds
under CDM projects
- - --
- - -
-
-
+
+
+0
0 -
-
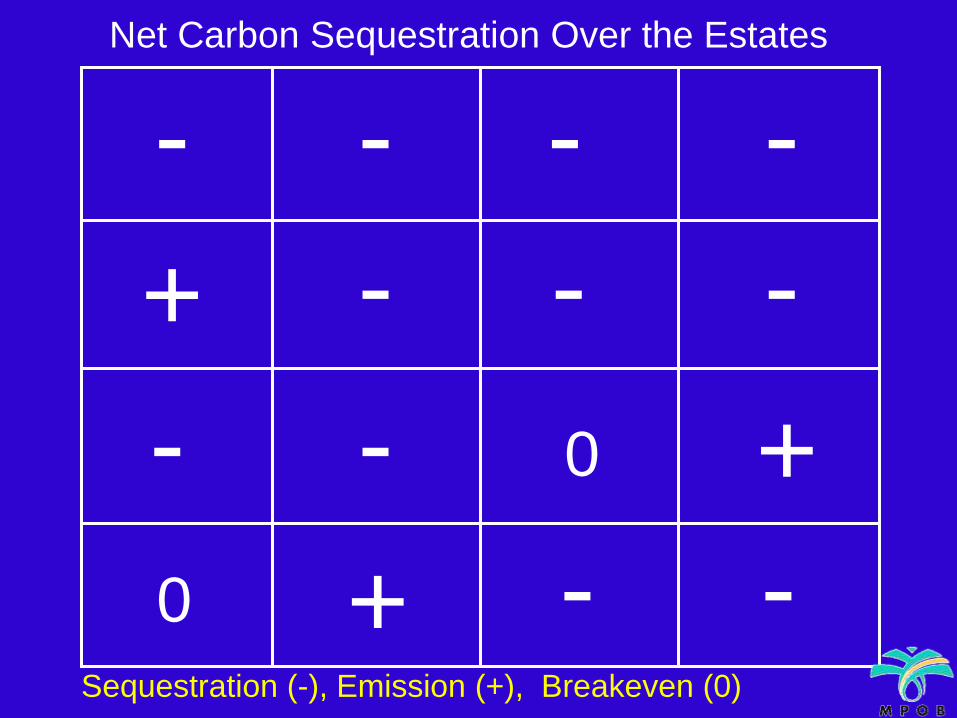
Net Carbon Sequestration Over the Estates
Sequestration (-), Emission (+), Breakeven (0)

Potential Carbon Balance (tCe/ha/yr) based
on Improvements of Practices1981-2005¹ Peninsular Sabah Sarawak Malaysia
Sequestration 1.908 3.401 2.596 2.356
Biogas POME 0.598 0.535 0.309 0.564
Total 2.505 3.936 3.905 2.919
Emission 3.786 7.572 12.812 5.254
Biogas POME -0.598 -0.535 -0.309 -0.564
CH4, N2O, CO Zero burn
-0.702 -0.694 -0.426 -0.681
Total 2.486 6.344 12.076 4.010
Potential net 0.020 (-2.408) (-8.172) -1.090
(Source: Basri and Chan, 2007, 1 = mean acreage at 2.44 million ha; 2007 3.40million ha with 2.36, 1.28 and 0.66 million ha in Peninsular, Sabah andSarawak respectively)

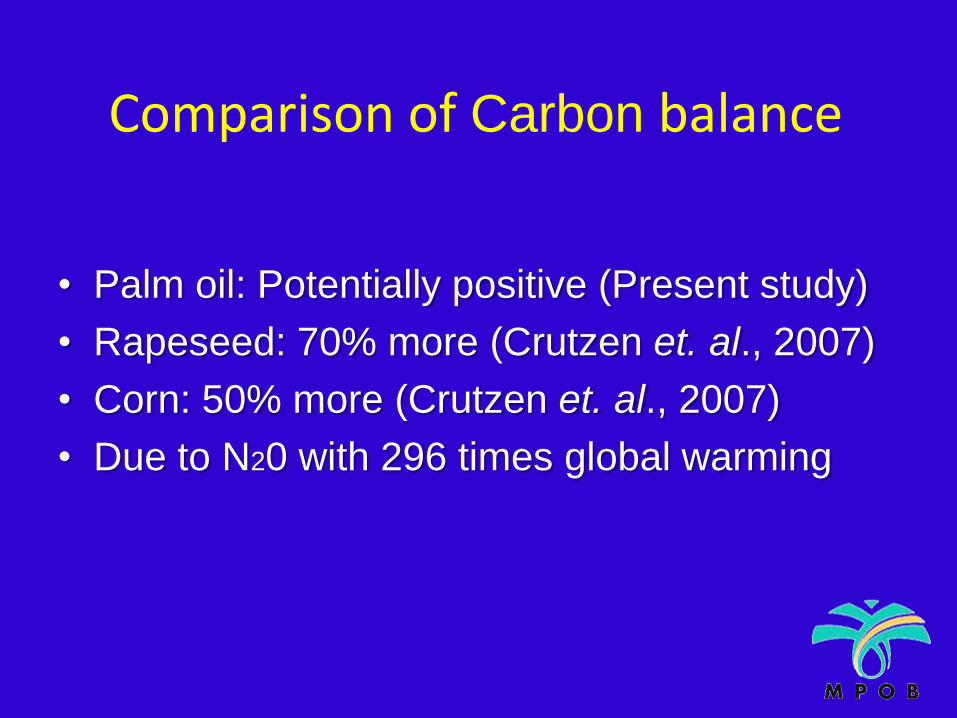
Comparison of Carbon balance
• Palm oil: Potentially positive (Present study)
• Rapeseed: 70% more (Crutzen et. al., 2007)
• Corn: 50% more (Crutzen et. al., 2007)
• Due to N20 with 296 times global warming

Total Carbon at National Level
• 60% under forest
• 10% more than 50% pledged at Rio Summit
• Forest net sink (Azmi Khalid, 2007 at Bali)
• Based on Article 3.3 and 3.4 UNFCCC
• Take into account afforestation, reforestation,
land under harvesting, land not harvested,
deforestation, forest management, crop land,
grazing and re vegetation
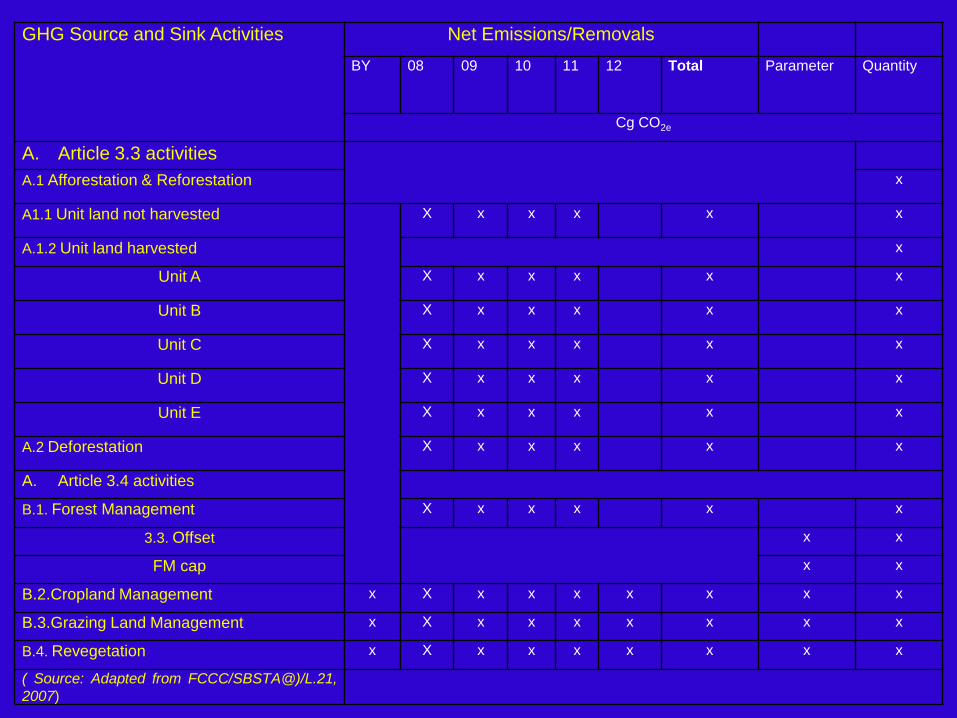
GHG Source and Sink Activities Net Emissions/Removals
BY 08 09 10 11 12 Total Parameter Quantity
Cg CO2e
A. Article 3.3 activities
A.1 Afforestation & Reforestation x
A1.1 Unit land not harvested X x x x x x
A.1.2 Unit land harvested x
Unit A X x x x x x
Unit B X x x x x x
Unit C X x x x x x
Unit D X x x x x x
Unit E X x x x x x
A.2 Deforestation X x x x x x
A. Article 3.4 activities
B.1. Forest Management X x x x x x
3.3. Offset x x
FM cap x x
B.2.Cropland Management x X x x x x x x x
B.3.Grazing Land Management x X x x x x x x x
B.4. Revegetation x X x x x x x x x
( Source: Adapted from FCCC/SBSTA@)/L.21,
2007)
Climate Change, Carbon Market and ISO Standards
• ISO 14064 Parts -1, -2 and -3 and ISO 14065
• Worldwide uptake e.g. EU ETS, WRI/WBCSD
• Voluntary and Regulated Schemes
• Use in non-signatory countries, CDM projects,
UNEP programme , VCS
• Other ISO standards, ISO 14040, ISO 14025,
ISO 14062
The Way Forward on Carbon Balance
• Harmonized use of ISO standards
• Harmonized Codes of Practice
• Normalize life cycle impact over supply chain
• Provide informed environmentally preferred
choices of products
• New standards ISO 14066 and ISO 14067
Conclusion
• Valuable lessons learned on palm oil footprint
• Success depends on multilateral discussion
on standardized methodologies
• Newer ISO C standards being developed
• Palm oil industry on way to low carbon
economy