overcoming process improvement obstacles: a … process improvement obstacles: a jmp / evop case...
TRANSCRIPT
Overcoming Process Improvement Obstacles:
A JMP / EVOP case study
Noah Wass, Elkhart Plastics, Ridgefield, WA 98642
Stephen W. Czupryna, Objective Experiments, Bellingham, WA 98225
ABSTRACT Design of Experiments (DOE) is a proven
process improvement technique. However,
process improvement teams can encounter
insurmountable obstacles to running designed
experiments with examples ranging from
equipment restrictions, around-the-clock
production and financial barriers to fear-of-
the-unknown at the management level. In
these cases, experimenters need a more subtle
approach to process improvement.
One option is Evolutionary Operation or
EVOP (pronounced “EVE-OP”), a
methodology originally developed by George
E. P. Box1 during his work at Imperial
Chemical Industries in the UK. In 1969, Mr.
Box co-authored a seminal book on the subject
with Norman Draper2.
EVOP’s basic philosophy is that:
“…a process should be operated so as to
produce not only a product but also
information on how to improve the
product”.2
CASE STUDY PURPOSE The main intention of this paper is to help
others use EVOP to overcome process
improvement obstacles. By doing so, the
authors hope to positively impact colleagues,
acquaintances, Quality Engineers, Process
Engineers, Manufacturing Engineers and other
process improvement enthusiasts.
EVOP OVERVIEW To attain process improvement information as
suggested by Box & Draper, EVOP
practitioners plan and make small,
simultaneous changes to process settings
during periods of normal production. Some
example process settings include temperature,
line speed, % additives, tooling and voltage.
Product data is accumulated for each
combination of process settings and analyzed
to gain valuable process insight. This process
is then repeated many times either by line
workers and supervisors as a normal
production routine or, as shown in this case
study, by a diverse team working in support of
manufacturing operations.
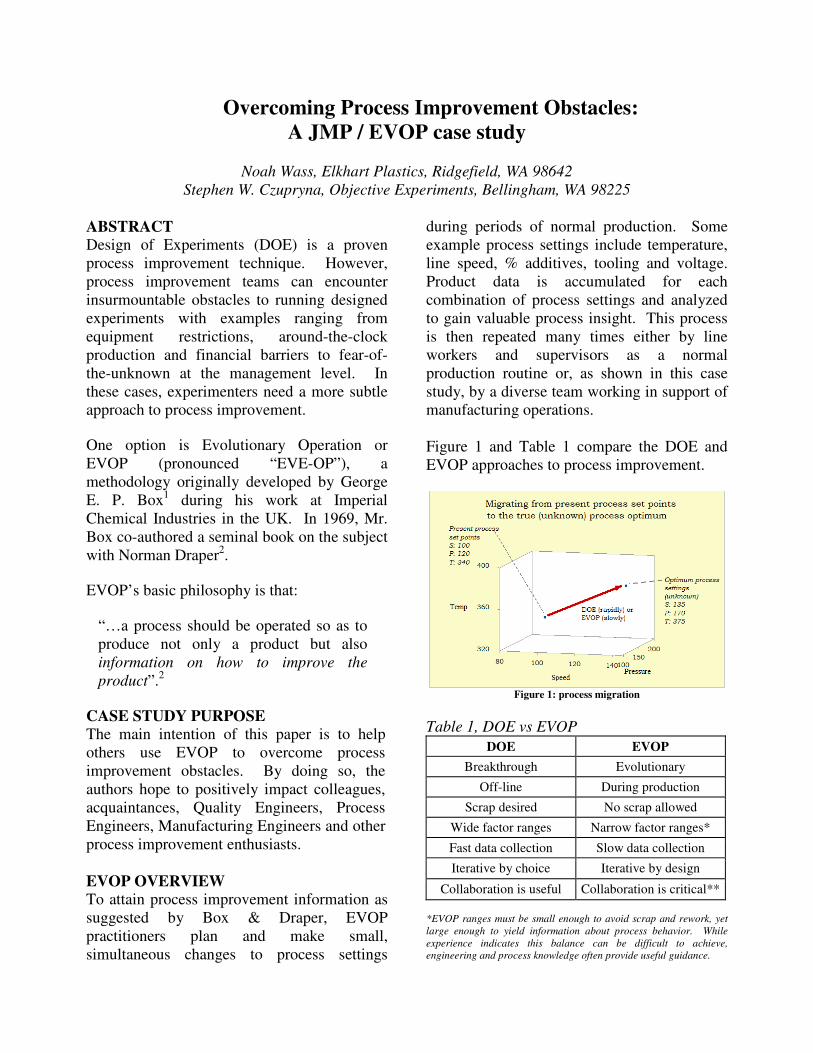
Figure 1 and Table 1 compare the DOE and
EVOP approaches to process improvement.
Figure 1: process migration
Table 1, DOE vs EVOP
DOE EVOP
Breakthrough Evolutionary
Off-line During production
Scrap desired No scrap allowed
Wide factor ranges Narrow factor ranges*
Fast data collection Slow data collection
Iterative by choice Iterative by design
Collaboration is useful Collaboration is critical**
*EVOP ranges must be small enough to avoid scrap and rework, yet
large enough to yield information about process behavior. While
experience indicates this balance can be difficult to achieve,
engineering and process knowledge often provide useful guidance.

** Experience indicates that the #1 key to EVOP success is a
collaborative approach and advance buy-in from Front Line Workers,
Supervisors, Maintenance staff and others. A useful tip for EVOP
practitioners - take personal responsibility before the work begins for
any process disruptions to assure others don’t feel threatened.
AN ALTERNATIVE TO CONSIDER Many EVOP practitioners use a factorial
approach3 to inch the process toward its
optimum settings and this approach has
worked well for many decades. This paper
presents the reader with an alternate to
consider - the use of quadratic, I-Optimal
designs generated by JMP’s Custom Designer.
The advantage of this approach is that
quadratic models reveal more process nuances
than an interaction model with only a bit more
work. The disadvantage is that the quadratic
approach takes more patience.
Nothing valuable is lost by taking time.
Abraham Lincoln
One situation where EVOP is often
appropriate is where operators routinely adjust
process settings to “get good product”. In this
case, EVOP can give structure to these
adjustments and thus draw out the information
needed to eliminate process tinkering.
OTHER APPLICATIONS FOR EVOP EVOP might prove useful for the following if
DOE is not an option.
� metal die casting
� metal heat treating
� food manufacturing
� plastics extrusion, injection molding and
thermoforming
� non-woven fabric production
DEATH, TAXES & ENTROPY This case study is about the improvement of a
40+ year old, well-maintained production line
that had been retrofitted with digital controls.
Unfortunately, operator turnover and a history
of periodic moth-balling meant that much past
process knowledge was lost. By decree,
process settings had remained constant for
many years but as expected frictional wear,
evolving heat transfer behavior, corrosion and
other entropic inevitabilities resulted in
continuously diminishing process satisfaction.
In short, the process was burning money.
Then, the company was sold and the new
owners, understandably, wanted better results,
higher profits and fewer customer complaints
and they wanted it without a single capital
request. DOE was considered, but an around-
the-clock, 7 day/week production schedule
prevented its use. EVOP was deemed to be
the best alternative.
EVOP TEAM A team of experienced Line Operators, an
R&D Engineer and a Quality Engineer jointly
managed the EVOP work described in this
case study and other people were called in as
needed. Hereinafter, this group is referred to
collectively as the team. Nobody on the team
had EVOP experience. However, both
engineers had read the Box & Draper book.
STEP 1 – STOP, LOOK & LISTEN The best first step to process improvement
work (DOE, EVOP or otherwise) is to seek the
advice and cooperation of process operators
and maintenance staff as they almost always
provide vital process insight. Skip this step at
your own peril.
Figure 2, Front Line Workers – the key to process improvement4
In addition, many process improvement efforts
fail because the goals are not carefully defined

in advance. A useful document titled
Checklist for Asking the Right Question5
provided a lean, simple solution and a superb
forum for group discussion. Despite some
pressure to “get going”, the team took time to
develop the following goal statement.
Using a careful evolutionary approach,
maximum operator involvement, sound
engineering judgement, validated data and
the JMP Custom Design generator, the
primary goals are:
� maximize learning
� move response R1 from 220 to 325
� no additional scrap
The target of 325 was not arbitrarily
determined, rather it was based on operator
input, engineering judgement and best-in-class
benchmarking.
STEP 2 – CHOOSE A STRATEGY The team reviewed the history of the process
noting that much knowledge had been lost
over time and that the same process settings
had been used for many years. They further
noted the low output measurement costs.
Within this context, the team decided to
execute a series of I-Optimal quadratic
designs, rather than take the textbook
interaction approach. The rationale was that I-
Optimal designs are well known to be efficient
in terms of the process knowledge gained for
the amount of work done.
STEP 3 - CREATE A PLAN Like DOE, EVOP requires careful planning
that starts with an understanding of the
process. Based on input from production,
maintenance and engineering personnel, five
process factors were identified for inclusion as
shown in Figure 3.
Figure 3: Process Block Diagram
In addition to the 5 factors, the process
diagram shows the usual lurking variable and
two responses of interest, R1 and R2. Only R1
is covered in this case study.
Table 2 shows available factor ranges, the
present setting for each factor and the test
range for the first quadratic plan. Note the
ranges for F1 to F4 are symmetrical around the
present setting. However, engineering
knowledge suggested the safest approach to F5
was to test a lower setting, but not a higher
setting.
Table 2, process factors
RANGE
BASELINE
SETTINGS
RANGE,
EVOP-1
F1 100-200 120 118-122
F2 200-350 325 320-330
F3 1000-2000 1850 1830-1870
F4 10-25 22 21-23
F5 1-7 2 1-2
EVOP plan design
The JMP Custom Designer was used
throughout the study. Figure 4 shows the
screen used to create the work plan. The red
rectangle emphasizes the narrow factor ranges.
Critically, the Custom Designer allows the
user to determine and then specify the number
of replicate runs desired for estimation of
response variation. The value of this Custom
Designer feature cannot be overstated.

Figure 4: Creating EVOP quadratic plan #1 (EVOP-1)
Figure 5 is the first phase work plan. Note that
factor levels change simultaneously from one
run to the next. Clearly, EVOP is not one-
factor-at-a-time experimentation!
Figure 5: part of the EVOP-1 work plan
The team saw real value in the wide variety of
settings for each factor. Table 3 provides a
factorial-vs-quadratic plan comparison.
Table 3, factor setting granularity
X FACTORIAL QUADRATIC
F2 1830, 1870 1830, 1838, 1846, 1848, 1850,
1862, 1864, 1866, 1870
F5 1, 2 1, 1.25, 1.35, 1.4, 1.5, 1.65, 1.9, 2
STEP 4: VALIDATE MEASUREMENTS The team knew that measurement noise was a
given so they resisted pressure to start the
EVOP plan immediately and instead ran a
measurement system analysis (MSA). JMP’s
EMP measurement systems analysis method6
provides copious graphical and tabular insight
as shown in Figures 6 to 10.
Initial MSA results for Operator A, B and C
Figure 6: Average chart
Figure 7: Range chart
Figure 8: Parallelism plot

Figure 9: EMP results
Figure 10: Effective resolution
JMP’s highly visual, easy-to-understand MSA
output quickly highlighted a few areas of
concern. First, the Range Chart clearly
indicates that the measurement system has
repeatability issue.
Second, the Parallelism Chart highlights a
measurement system bias. The 0.08 Bias
Impact was deemed significant in light of the
small changes expected in R1 during the
process improvement work.
Third, the Effective Resolution output
indicated that the recorded value of R1 should
be reduced by 1 digit.
First things first
Measurements would be needed at all hours of
the day so the measurement system had to
accommodate all 3 operators. Resisting
building pressure to move forward, the team
elected to first work on the measurement
system. The Bias Impact was eventually
reduced to < 0.02, the Intraclass Correlation
Coefficient was improved to 0.96 and the Test-
Retest Error was cut by more than half.
STEP 5 - ESTABLISH BASELINE Recall that one of the goals was to gain
maximum understanding of the process and
with that in mind, the team collected baseline
data and used JMP’s Control Chart Builder to
evaluate the results. See Figure 11 and note
that all data presented in this case study are
heavily obscured for confidentiality purposes.
Figure 11: a look at the existing process
Donald Wheeler recommends evaluation of an
IR chart within the context of the process and
without automatic detection rules7. This
evaluation was easy with JMP’s IR chart in
hand and the team concluded that the process
was in a steady state of statistical control.
When the team invoked the standard Western
Electric detection rules as a double-check, they
drew the same conclusion.
Between an experimental rock and a financial
hard place
At this point, considerable resources had been
consumed, but no “hard results” had been
delivered to the new owners. The team was
challenged and at one point it was uncertain if
the work would continue. However, using
JMP’s array of crystal-clear graphics, the
engineers and operators jointly explained the
following gains to the new owners and secured
the OK to proceed.
� 2 significant measurement system problems
were addressed before they could do further
harm to the company and its customer.
Henceforth, less good product would be

rejected and less off-spec product would be
improperly shipped to customers
� a clear process baseline was in hand
� a carefully crafted, well-balanced strategy
and detailed plan were in place
� operators were involved in the work,
building inter-departmental cooperation
STEP 6 – COLLECT PROCESS DATA Each run was maintained for a significant
period of time. The response was measured at
various intervals with the average assigned to
R1 for each run.
As a fail-safe plan, production line operators
were instructed to return the process to its
historical setting if they saw unexplained
degradation or other sign of trouble.
During the lengthy data collection process,
process behavior charts were used to better
understand the small run-to-run differences
(see Figure 12) and the more significant plan-
to-plan differences.
Figure 12, Baseline-vs-EVOP1, Run 1
STEP 7 – ANALYZE PROCESS DATA Like DOE, EVOP is best managed by
checking important pre-requisites before
launching into the review of the process model
and before making important process
decisions. For example, the team immediately
checked for constant s and then did a visual
sanity check of the 8 replicate runs. JMP’s
Variability Chart provided a powerful way to
check repeatability as shown in Figure 13.
Figure 13: Variability Chart
Had the team discovered significant
repeatability problems, they would have to
stand down on the work until the cause was
found and remediated.
Fit model
Once the data is fit to the chosen model, JMP
provides a number of ways to assess model
quality. The Actual by Predicted plot is
particularly useful because it’s graphical and
easy to understand as shown in Figure 14.
Figure 14: Actual by predicted plot
JMP makes it easy to see that the model
predicts well. For example, the indicated point
has a predicted value of about 215 and an
actual value of about 211.

Interpret the model
JMP’s Sorted Parameter Estimates table and
the JMP Prediction Profiler made it easy for
the team to separate the vital few model terms
from the trivial many. Analysis of the
Prediction Profiler (Figure 15) indicated the
following significant predictors of R1:
� main effects F1, F3 and F5
� the F3*F4 and F1*F3 interactions
� the quadratic term F3*F3
Figure 15: Sorted parameter estimates
As another sanity check, the team saw that the
confidence interval around the predicted value in
the Prediction Profiler contained the SPC chart
average of about 218 when F1 to F5 were set to the
baseline settings as shown in Figure 16.
Figure 16: JMP Prediction Profiler, baseline process settings
Contextual check
The team knew that all predictive models have
a measure of uncertainty and for the narrow
factor ranges typical of EVOP work, the
uncertainty loomed large. The team
approached with caution and pondered an
important question - Does the model make
sense within the context of the process?
Common sense is genius dressed
in its work clothes
Ralph Waldo Emerson
The team used the JMP Prediction Profiler in a
group setting as an interactive, graphical
representation of the process. For example,
moving the red marker along the F3 scale
clearly demonstrated to everyone the strong
F3*F4 interaction. See Figure 17.
Figure 17: F4*F3 interaction, graphically demonstrated
The team determined that the strong main
effects F1 and F3 were supported by operator,
engineering and maintenance knowledge and
after lengthy consideration. They further
concluded that interactions F1*F3 and F3*F4
did not contradict sound engineering
judgement and common sense. However, the
generally positive main effect F5 did not
support their previous assessment.
STEP 8 – DETERMINE NEW RANGES Based on new process knowledge gained in
EVOP-1, the team developed their EVOP-2
plan (Table 4) and repeated steps 3, 6 & 7.
Positive slope
Negative slope

Table 4, EVOP Plan 2
RANGE,
EVOP-1
RANGE,
EVOP-2
RATIONALE
F1 118-122 122-126 Strong positive slope of F1 in
Prediction Profiler
F2 320-330 320-330 F2’s flat response curve in
Prediction Profiler
F3 1830-
1870
1810-
1830
Strong negative slope of F3 in
Prediction Profiler
F4 21-23 23-25 Decrease in F3 causes a more
positive slope in F4 due to the
strong F3*F4 interaction, see
Figure 16
F5 1-2 2-3 Positive slope of F5 in
prediction profiler
Iterate toward the sweet spot
EVOP-2 data was collected and analyzed
leading to the development of EVOP-3. The
results of EVOP-3 then lead to the
development of EVOP-4 and so forth. An
important point is that every single decision
was based on direct observations and data, not
on opinion, hunch, theory, vote, first
principles, consensus, edict or flip-of-a-coin.
As process knowledge accumulated, factor
ranges were gradually widened to generate
increasingly useful process insight. In the end,
more than 10 iterations were needed to move
the process to its new settings.
STEP 9 – SUSTAIN GEMBA FOCUS The team understood the effect of entropy and
its inexorable push toward chaos and disaster.
They also understood the presence of raw
material variation, energy supply fluctuation,
tooling wear, gradual equipment misalignment
and the accumulating effects of repairs. With
all of that in mind, the team developed a plan
to address future process degradation. The
details of this plan are outside the scope of this
paper.
Acknowledge
The team acknowledged the vital contributions
of front line operators, supervisors and
maintenance staff, giving them a sense of
ownership in the new process. While this is an
intangible benefit of collaborative work on the
factory floor, it is nonetheless vital to long
term success.
Monitor
As a countermeasure to long-term process
degradation, the team put a system in place to
track key factors and responses over time.
Some team members accepted personal
responsibility to monitor the data and look for
process shifts.
GHOSTS IN THE MACHINE The industrial process under study was
complex and the team made mistakes. Some
mistakes lead to the rework of an EVOP plan
and on one occasion, the process had to be
abruptly returned to the original process
settings. Some decisions resulted in lower
rather than higher R1. But the team’s
persistence meant that these mistakes turned
into new knowledge and, eventually, a high
level of process understanding.
FINAL RESULTS The final process model and simulated set
points are shown in Figure 18. While the
effort fell short of the original goal of 325,
overall improvement proved satisfactory to the
new owners after a dramatic drop in both
process scrap and customer complaints.
EVOP was indeed the right framework for the
process improvement work.
Figure 18: the new process
KEYS TO SUCCESS The primary key to success was the team’s
collaborative mindset. Interestingly, there was
no Team Leader. Instead, the work was done
by a diverse group of people on the factory
floor, interacting with each other, as equals, in
a spirit of data-centric continuous

improvement. JMP provided a perfect
complement to this approach with its clear,
concise graphics and accessible quantitative
analysis tools.
Another key to EVOP success is persistence.
Like running designed experiments, EVOP
rarely goes perfectly according to plan and a
strong sense of determination is vital. It is
suggested that the faint-of-heart steer well
clear of EVOP.
EPILOGUE The authors further believe the collaborative
mindset and philosophical underpinnings
described in this case study yield superior
financial and technical results compared to
common dictatorial process improvement
practices. We specifically caution against the
use of:
� arbitrary improvement targets
� arbitrary deadlines and Progress Reports
� investigations into operator error
� spreadsheets for data storage and analysis
� debate in stuffy conference rooms
REFERENCES [1] George E. P. Box, Evolutionary Operation: a Method for
Increasing Industrial Productivity, The Journal of the Royal
Statistical Society, 1957, 6(2): 81-101
[2] George Box and Norman Draper, Evolutionary Operation, a
Statistical Method for Process Improvement, 1969, John Wiley &
Sons, Inc., Page 5.
[3] George Box and Norman Draper, Evolutionary Operation, a
Statistical Method for Process Improvement, 1969, John Wiley &
Sons, Inc., Chapter 3
[4] Photo courtesy of Wikimedia user National Archives Bot
[5] William D. Kappele, Performing Objective Experiments Using
JMP, 5th edition, August 2011, Objective Experiments. Checklist
is available at www.objexp.com.
[6] Donald J. Wheeler, EMP III, Evaluating the Measurement
Process, SPC Press, 2010
[7] Donald J. Wheeler, Understanding Variation, the Key to
Managing Chaos, SPC Press, 2000
AUTHOR BIOGRAPHIES Noah Wass is Engineering Manager at Elkhart
Plastics, Inc., a custom rotational molding
company in Ridgefield, WA. He graduated
from Western Washington University with a
degree in Plastics Engineering Technology.
Noah has extensive hands-on experience with
measurement systems analysis, design of
experiments and statistical process control.
Stephen W. Czupryna was a Quality
Engineering Consultant and Instructor with
Objective Experiments in Bellingham, WA.
He has more than 20 years of hands-on
manufacturing and quality experience, a B.S.
degree in Economics and an A.S. in Laser
Electro-Optics. He earned his Lean Six Sigma
Black Belt certification from the Pyzdek
Institute in 2009.