outlook and policy in 2019 - bnm
TRANSCRIPT

81Annual Report 2018
Outlook and
Policy in 2019
Outlook and Policy in 2019
83 The International Economic Outlook83 The Malaysian Economy88 External Sector89 Inflation Outlook 90 Monetary Policy90 Fiscal Policy93 Box Article: When the Future Starts Today: Inflation Expectations of Malaysian Households

82 Annual Report 2018
Outlook and
Policy in 2019

83
Outlook and Policy in 2019
THE INTERNATIONAL ECONOMIC OUTLOOK
In 2019, the global economy is projected to moderate towards its long-term trend, characterised by slower growth in both advanced and major emerging economies. In the advanced economies, labour market strength will continue to support domestic demand, and improvements among selected emerging markets such as Brazil and India will provide some impetus to global growth. Nevertheless, uncertainty is likely to remain elevated, given the persistence of key risks, notably from global trade disputes, political uncertainty and sudden shifts in investor sentiment. These risks will pose headwinds to growth.
Global economy to expand moderately in 2019
In the advanced economies, economic activity is projected to moderate in 2019. Labour market conditions remain mixed. While unemployment rates in the United States and euro area are hovering at 50-year and decade lows respectively, wage growth has remained modest. Nevertheless, in the low inflation environment, this will support consumer confidence and household spending. Moderating investments and external demand will affect overall growth. In the US, fiscal policy will provide less support, while the accumulated effects of gradual monetary policy normalisation are expected to have an impact on economic activity. In the United Kingdom, the prolonged uncertainty surrounding Brexit developments will likely affect both consumer spending and investment decisions. In PR China, ongoing structural reforms to rebalance the economy are leading to slower, but more sustainable growth. Trade disputes, if unresolved, are expected to further dampen business sentiment in PR China. Proactive counter-cyclical monetary and fiscal policy interventions should help forestall the risk of a sharp slowdown in growth. In other Asian economies,
growth will likely moderate despite stable domestic demand, as exports react to the slowdown in the advanced economies and PR China.
Lower crude oil prices will reduce the energy import bill and pressure on inflation, which will support higher spending especially in net oil importing economies. Some economies will benefit from country-specific tailwinds. In India, the negative effects from past domestic policy adjustments (e.g. demonetisation and GST implementation) will continue to fade, while Brazil continues on a gradual recovery since 2017.
Despite the projected growth, prospects for the global economy will be contingent upon the outcome of several key risk factors. Central banks in major advanced economies are adopting a more patient and cautious approach to monetary policy normalisation given the uncertain growth prospects. Global trade developments will remain a key factor affecting the 2019 outlook. Beyond the economic impact of higher trade tariffs, prolonged policy uncertainty could adversely affect investment decisions and thus, longer-term productivity growth. In this environment, investor uncertainty will remain elevated and financial markets will likely experience bouts of volatility. This poses further risks of greater volatility in capital flows to emerging market economies. The overall balance of risks to the global growth outlook is tilted to the downside.
THE MALAYSIAN ECONOMY
Against the backdrop of a challenging global environment, the Malaysian economy is expected to sustain its growth momentum, expanding by 4.3% – 4.8% in 2019 (2018: 4.7%). The external sector is expected to register a more moderate expansion in tandem with the moderation in global growth. Private sector activity will remain the anchor of growth amid continued rationalisation in the public sector. Labour market conditions are
Annual Report 2018

84 Annual Report 2018
Outlook and
Policy in 2019
expected to remain supportive of growth, while inflation is projected to be broadly stable compared to 2018.
The Malaysian economy is projected to grow by 4.3% – 4.8% in 2019
Growth will be supported by the gradual recovery from the unanticipated commodity disruptions in 2018, which will also benefit the manufacturing sector and trade activity. In addition, output from new manufacturing production facilities that will begin operating in 2019 will lend further support to growth. These facilities include large oil refinery and petrochemical facilities, as well as E&E, chemicals and rubber plants. On the demand side, private sector spending will continue to drive growth. Following the lapse of one-off factors in 2018, private consumption growth is expected to moderate, but remain firm. Household spending will benefit from continued employment and income growth. Employers surveys indicate that salary increments are expected to be sustained between 4.9% – 5.2%1 in 2019 while the unemployment rate is projected to remain relatively unchanged (3.3% – 3.5%; 2018: 3.4%). Policy measures such as the price ceiling on retail fuel prices, minimum wage adjustment and targeted cash transfers will lend further support to household expenditure. The normalisation of destocking activities by firms will serve as an additional support to growth in 2019. This is partly due to firms readjusting their inventories after the strong demand during the tax holiday period in 2018, which led to firms drawing down from their inventories. In addition, E&E firms which had large stock drawdown towards
the end of 2018 in anticipation of weak demand, are less likely to have another significant drawdown in their inventories.
The growth projection is subject to several downside risks, mainly from the global environment. Unresolved trade tensions between the US and PR China, and a slower-than-expected global growth will affect Malaysia primarily via the trade and investment channel. The uncertain pace of the monetary policy normalisation in the US could heighten financial market volatility across emerging market economies, leading to volatile two-way capital flows and currency fluctuations. Volatility in the global oil price could also affect export performance and mining sector investment. On the domestic front, a re-occurrence of the commodity supply disruption, partly from unanticipated weather patterns, could affect the recovery in the mining and agriculture sectors. In addition, the oversupply situation in the property market could dampen activity in the construction sector.
The strong fundamentals and the diversified nature of the economy will help Malaysia weather these risks and vulnerabilities while preserving macroeconomic and financial stability. These include a healthy labour market, stable inflation rate, continued surplus in the current account of the balance of payments, deep financial markets, as well as a strong financial sector. Exchange rate flexibility and sufficient level of international reserves further enhance the economy’s capability to withstand external shocks. Moreover, commitment by the Government to fiscal, structural and institutional reforms will contribute to inclusive and sustainable growth going forward.
1 Based on Malaysian Employers Federation Salary Survey, as well as Korn Ferry’s and Mercer’s Total Remuneration Surveys.
Domestic Demand to Continue to be the Key Driver of Growth
Domestic demand will remain the anchor of growth in 2019, underpinned by continued expansion in private sector activity. Public sector expenditure, however, is expected to weigh on growth amid the completion of large-scale projects by public corporations and continued reprioritisation of government spending. The external sector is projected to register a more moderate growth in line with modest global growth and trade activity.
Private consumption is projected to expand by 6.6% in 2019. After recording a strong growth in 2018, household spending is expected to normalise closer to its long term average of 6.7%.1 Although consumer sentiments have moderated from the recent peak, growth will remain firm supported by key fundamental drivers, namely stable labour market conditions and continued wage growth. The implementation of several government measures, particularly in alleviating rising cost of living, is expected to lend further support to
1 The long term average of 6.7% refers to the period from 1990 to 2018.

85Annual Report 2018
Outlook and
Policy in 2019
consumption spending, especially by lower income households. These measures include the price ceiling on retail fuel prices, higher minimum wage and Bantuan Sara Hidup cash transfers.
Labour market conditions are expected to be stable in 2019, with continued employment and income growth. This is underpinned by steady expansion in services and manufacturing sectors, reinforced by the recovery from commodity supply disruptions. As such, unemployment rate is projected to be relatively unchanged (3.3% – 3.5%; 2018: 3.4%) while salary increments are expected to be sustained between 4.9% – 5.2%2 in 2019. In the long run, the rollout of government policies such as the tiered levy and social security contribution for foreign workers is a positive step in reducing the reliance on foreign labour and spurring the creation of higher skilled, higher income jobs in the economy.
Private investment is projected to register a growth of 4.9% in 2019. The ongoing multi-year projects would continue to support investment activity, particularly in the manufacturing and services sectors. This includes capital spending in the E&E and primary-related manufacturing sub-sectors as well as the transport, storage and communication services sub-sectors. By type of asset, investments in machinery and equipment are expected to benefit from firms' efforts to enhance automation and efficiency. Nonetheless, the moderating global economic conditions and softening business sentiments could affect investment activity. In addition, investments in structures would likely remain moderate amid the oversupply in the broad property segment.
Public consumption is expected to expand at a moderate pace of 1.2%, attributable to a decline in spending on supplies and services amid stable emoluments growth. This is in line with the Government’s continued commitment to rationalise non-critical spending without affecting public service delivery and to increase efficiency through cost reduction in the public sector.
Public investment is projected to contract by 7.1% due mainly to lower investment by public corporations following the completion of large-scale projects. Capital spending by the General Government is expected to be mainly channeled towards upgrading and improving public infrastructure and amenities.
Table 1
Real GDP by Expenditure (2010=100)
2018p 2018p 2019f 2018p 2019f
% of GDP Annual change (%) Contribution to growth (ppt)
Domestic Demand1 92.9 5.6 4.4 5.2 4.1 Private sector expenditure 72.8 7.2 6.2 5.1 4.5 Consumption 55.5 8.1 6.6 4.4 3.7 Investment 17.4 4.5 4.9 0.8 0.8 Public sector expenditure 20.1 0.1 -1.8 0.0 -0.4 Consumption 12.8 3.3 1.2 0.4 0.2 Investment 7.3 -5.2 -7.1 -0.4 -0.5 Gross Fixed Capital Formation 24.6 1.4 1.3 0.4 0.3Change in Stocks -1.3 -1.5 0.6Net Exports of Goods and Services 8.4 13.4 0.1 1.0 0.0 Exports 70.6 1.5 0.1 1.1 0.0 Imports 62.2 0.1 0.0 0.1 0.0Real Gross Domestic Product (GDP) 100.0 4.7 4.3 ~ 4.8 4.7 4.3 ~ 4.8
1 Excluding stocksp Preliminaryf Forecast
Note: Figures may not necessarily add up due to rounding
Source: Department of Statistics, Malaysia and Bank Negara Malaysia
2 Based on Malaysian Employers Federation Salary Survey, as well as Korn Ferry’s and Mercer’s Total Remuneration Surveys.

86 Annual Report 2018
Outlook and
Policy in 2019
All Economic Sectors are Projected to Expand
On the supply side, all economic sectors would continue to expand in 2019, with the services and manufacturing sectors remaining the key contributors to overall growth.
Economic activity in the services sector will expand at a more moderate pace. Growth in wages and employment will support expansion in the wholesale and retail trade, food and beverages and accommodation sub-sectors. The information and communication sub-sector will be driven by higher demand for broadband services, due to lower subscription prices. Sustained financing activity will continue to benefit the finance and insurance sub-sector. Nevertheless, slower global trade activity would impact growth in the transport and storage sub-sector.
The manufacturing sector is projected to record a slightly lower growth. The primary-related cluster will benefit from the recovery of commodity supply disruptions. The operationalisation of the large oil refinery and petrochemical facilities in Johor will boost production of refined petroleum and petrochemical products. Growth in the E&E cluster, however, is expected to moderate due to lower external demand for semiconductors. Nevertheless, additional production from new manufacturing plants and modernisation of existing facilities will provide continued support for the growth of the E&E cluster.
Growth in the construction sector is expected to moderate in 2019, due to the completion of large petrochemical projects in the civil engineering sub-sector. Continued progress of large transportation and utility projects will provide support to growth. The residential and non-residential sub-sectors, however, are expected to remain subdued amid the oversupply of residential and commercial properties.
Growth in both the mining and agriculture sectors is projected to register a turnaround in 2019. The recovery in natural gas production in East Malaysia will support growth in the mining sector. This will more than offset the decline in crude oil output due to production constraints and extension of voluntary supply adjustments by PETRONAS. Meanwhile, higher palm oil output amid the recovery in palm oil yield and continued expansion in mature oil palm areas will contribute to growth in the agriculture sector.
Table 1
Real GDP by Kind of Economic Activity (2010=100)
2018p 2018p 2019f 2018p 2019f
% of GDP Annual change (%) Contribution to growth (ppt)1
Services 55.5 6.8 5.7 3.7 3.2
Manufacturing 23.0 5.0 4.8 1.2 1.1
Mining and quarrying 7.9 -1.5 0.8 -0.1 0.1
Agriculture 7.8 -0.4 2.8 0.0 0.2
Construction 4.5 4.2 3.0 0.2 0.1
Real GDP 100.01 4.7 4.3 ~ 4.8 4.7 4.3 ~ 4.8
1 Figures may not necessarily add up due to rounding and exclusion of import duties component p Preliminary f Forecast Source: Department of Statistics, Malaysia and Bank Negara Malaysia

87Annual Report 2018
Outlook and
Policy in 2019
Potential Output and the Output Gap of the Malaysian Economy
Potential output is the highest level of output that an economy can produce with efficient deployment of its existing resources – comprising capital, labour and technology. Producing output beyond this potential level risks overheating in the economy and the subsequent onset of inflationary pressures, while the converse reflects an underutilisation of resources and disinflationary pressures. Thus, the level of potential output and its relation to actual output (also known as the output gap1), aids the Bank in carrying out its mandate of maintaining price stability for sustainable economic growth.2
In 2018, potential output expanded by 5.0% (2011-2017 average: 5.0%). There was a moderation in capital expenditure growth, particularly from the public sector, following the near-completion of a few large infrastructure projects and the review of several development projects. Nonetheless, this trend was offset by stronger labour force expansion during the year (2.4%; 2017: 2.0%) to meet the sustained production strength in the services and manufacturing sectors.
In 2018, actual GDP growth trailed potential output growth, mainly due to supply disruptions in the agriculture and mining sectors that led to an underutilisation of resources. The output gap remained negligible during the year, contributing to relatively benign price pressures in the economy. This is consistent with the stable inflation rate of 1.0% (core inflation: 1.6%) registered during the year.
Going forward, the output gap is expected to turn marginally negative in 2019, as actual output continues to be impacted by both domestic and external headwinds. Potential output growth is also expected to slow slightly in 2019 owing to a slower pace of capital expenditure and labour force expansion. Inflationary pressure in 2019 is therefore expected to remain subdued.
Chart 1: Actual and Potential Output
-10
-5
0
5
0
50
100
150
200
250
300
350
1999 2001 2003 2005 2007 2009 2011 2013 2015 2017 2019f
RM billion % of PotentialAsian Financial Crisis
Global Financial CrisisTechBubbleBurst
Potential Output (LHS)
Actual Output (LHS)
Output gap (RHS)
Year
20172018e2019f
Annual Growth in Potential Output (%)5.05.0
4.6 ~ 5.1
Actual output Potential output
Output gap to turn marginally negative in 2019
e Estimatef Forecast
Source: Department of Statistics, Malaysia and Bank Negara Malaysia estimates
1 More formally, the output gap as a percentage of potential output is defined as2 Central Bank of Malaysia Act 2009.
x 100%.(Actual output level - Potential output level)Potential output level

88 Annual Report 2018
Outlook and
Policy in 2019
EXTERNAL SECTOR
External sector to register a more moderate growth
While the export sector will soften in 2019 in line with the more moderate expansion in the global economy and trade activity, Malaysia’s well-diversified export structure, in terms of both products and markets will contribute to sustain the expansion in gross exports. The current account balance is projected to remain in surplus, albeit narrowing to 1.5% – 2.5% of GNI.
Export growth to remain positive
Malaysia’s exports are expected to record a positive growth of 3.4% in 2019 (2018: 6.8%). The impact of the trade tensions and moderating demand from major economies will be significant. There are, however, mitigating factors. These include sustained demand from selected emerging economies, especially among ASEAN countries. Positive growth in manufactured exports will cushion the impact of an expected decline in commodity exports. This decline is attributable to lower mineral prices and crude oil production.
Manufactured exports are projected to expand by 4.8% in 2019 (2018: 9.1%) supported by continued, albeit moderating demand from key trade partners. Capacity expansions and the commencement of new production from several approved investments, particularly in the export-oriented manufacturing sector, will allow firms to tap into the continued global demand for growth segments in specific products. In the E&E sector, the operationalisation of new manufacturing plants, as well as modernisation and automation of existing facilities allow firms to gain from industry demand for semiconductors in the automotive and medical industries. In the non-E&E manufactures segment, the announced expansion and operations of new plants, particularly for the production of rubber and chemical products, will also provide support to growth in these export segments.
There are, however, factors which will weigh on exports performance in 2019. Lower mineral prices and crude oil production are expected to more than offset the increase in LNG and CPO output, resulting in continued contraction in commodity exports. The ongoing trade tensions between the US and PR China will also affect export growth both directly through lower demand from affected countries and indirectly through slower
production in the global value chains. While the trade actions implemented so far2 are expected to lower export growth by 0.6 – 1.0 ppt in 2019, there could be some offsetting effects from trade diversion of US’ imports away from PR China to Malaysia. The potential for this to occur is more likely if these products already account for a significant share of US import market and manufacturers have the capacity to ramp up production. The trade diversion could therefore reduce the negative impact of trade tensions on export growth, potentially by about 0.1 – 0.4 ppt.
Imports supported by continued domestic demand
Gross imports are projected to expand by 4.5% in 2019 (2018: 4.9%) on account of a turnaround in intermediate and capital imports. Higher imports of crude petroleum as input for the large oil refinery facility and continued growth in manufactured exports will support the increase in intermediate imports. Capital import growth is expected to rebound due to a low base effect in 2018 and continued investment activity in the manufacturing and services sectors. Consumption imports will be driven primarily by demand for imported food and beverages.
Table 4.1
External Trade
2013-2017 average
2018p 2019f
Annual change (%)
Gross exports 6.1 6.8 3.4 of which: Manufactured 8.1 9.1 4.8 Agriculture -0.2 -14.2 -2.2 Minerals -1.2 7.2 -6.5
Gross imports 6.8 4.9 4.5 of which: Capital goods 3.9 -3.3 2.7 Intermediate goods 5.9 -3.9 3.7 Consumption goods 10.4 2.5 1.4
Trade balance (RM billion) 86.4 120.5 114.9
p Preliminaryf Forecast
Source: Department of Statistics, Malaysia and Bank Negara Malaysia
2 Trade actions that have already been implemented since early 2018 include (i) blanket tariffs on solar panels, steel and aluminium; (ii) +25% tariff on USD50 billion worth of PR China imports and subsequent retaliation by PR China; (iii) +10% on USD200 billion worth of PR China imports and subsequent retaliation by PR China.

89Annual Report 2018
Outlook and
Policy in 2019
The services deficit is expected to be sustained, reflecting continued deficit in several major components of the services account. In particular, the transportation deficit is expected to remain sizeable as firms continue to rely heavily on foreign freight providers for trade activity. Payments for professional and technical services are expected to rise as businesses automate their operations. Payments for construction services, however, are expected to be lower following the completion of several large-scale projects. The travel account surplus will increase in tandem with projected higher tourist arrivals and per capita spending. Tourism Malaysia targets tourist arrivals to increase to 28.1 million in 2019, from 25.8 million in 2018.
The income account is projected to record a wider deficit, attributable to the increase in the number of locally-incorporated foreign firms which continue to earn sizeable profits. This reflects Malaysia’s continued position as an attractive profit centre for foreign direct investments. The higher FDI income payment is expected to outweigh the income accrued to Malaysian firms investing abroad. DIA income in the mining sector3 would most likely decline due to lower oil prices. The deficit in the secondary income account is expected to be sustained amid continued outward remittances by foreign workers.
Overall, the current account is projected to continue registering a surplus in 2019, albeit narrowing to 1.5% – 2.5% of GNI. Of significance, the current account is expected to remain in surplus in the
absence of significant and persistent shocks, including a sharp slowdown in the global economy and a decline in commodity prices. This is due in large part to Malaysia’s diversified export base which helps to mitigate the impact of shocks to the external sector.
INFLATION OUTLOOK
Broadly stable average headline inflation in 2019
Headline inflation is expected to average between 0.7% – 1.7% in 2019 (2018: 1.0%). The inflation projection incorporates some cost pass-through from domestic cost factors, but the upward impact will be offset by the expected lower global oil prices and the implementation of price ceilings on domestic retail fuel prices. Underlying inflation, as measured by core inflation,4 is expected to be sustained amid the steady expansion in economic activity and in the absence of strong demand pressures.
For 2019 as a whole, several domestic cost factors including those arising from policy developments are expected to lead to moderate upward pressure on headline inflation compared to 2018. These factors include the lapse in the combined impact of the changes in consumption tax policy5 towards the end of the year. In addition, other domestic cost factors, including the increase in the minimum wage and higher electricity tariff surcharge for businesses, could raise input costs for firms and thus, be passed on to retail prices. Externally, tighter supply conditions amid sustained global demand for key food commodities such as corn6 are projected to sustain global food prices, and in turn, domestic food prices through higher input costs.
The impact of the higher cost factors on headline inflation will, however, be offset by the expected lower global oil prices. Although the Organization of the Petroleum Exporting Countries (OPEC) and several non-OPEC producers agreed in December 2018 to
Table 4.2
Current Account of Balance of Payments1
Item (Net)2018p 2019f
RM billion
Goods 121.4 116.2
Services -19.7 -19.8
Primary income -49.4 -50.2
Secondary income -18.8 -18.2
Current account balance 33.5 28.0
% of GNI 2.4 1.5 ~ 2.5
1 The data are compiled in accordance with the Sixth Edition of the International Monetary Fund (IMF)’s Balance of Payments and International Investment Position Manual (BPM6)
p Preliminaryf Forecast
Note: Figures may not necessarily add up due to rounding
Source: Department of Statistics, Malaysia and Bank Negara Malaysia
4 Core inflation excludes price-volatile and price-administered items whose price movements are not likely to be related to changes in demand conditions. Core inflation also excludes the estimated direct impact of consumption tax policy changes.
5 Refers to the combined impact of the zerorisation of the Goods and Services Tax (GST) rate and the implementation of the Sales and Services Tax (SST).
6 Based on the Food and Agriculture Organization of the United Nations (FAO) Cereal Supply and Demand Brief in March 2019.
3 The mining sector constituted one-third of investment income receipts in 2018.
90 Annual Report 2018
Outlook and
Policy in 2019
cut oil production, the growth in global oil supply is expected to be supported by an expansion in US shale oil production. With moderate growth in global oil demand, the International Monetary Fund (IMF) projects crude oil prices to average at USD59 per barrel in 2019, a 14% decline from the 2018 average price of USD69 per barrel (2018: +30%).7 Along with the implementation of price ceilings for RON95 petrol and diesel until mid-2019,8 domestic fuel prices are expected to average lower in 2019 and have a downward impact on headline inflation.
Headline inflation declined to -0.7% in January 2019, reflecting mainly the lower domestic fuel prices. While headline inflation could remain low in the near term due to key policy measures, underlying inflation is expected to be sustained, supported by the steady expansion in economic activity. Meanwhile, improving labour productivity and ongoing investments for capacity expansion will help contain any excessive demand pressure on inflation. In the labour market, the unemployment rate is expected to be relatively unchanged at 3.3% – 3.5% in 2019 (2018: 3.4%) as employment growth will be matched by the expansion in the labour force. Nominal wage growth is also expected to remain stable. The Malaysian Employers Federation (MEF) reports that employers expect salary increments to average at 4.9% in 2019 (2018: 4.9%).9 Firms’ productive capacity will continue to expand, supported by sustained private investment growth of 4.9% in 2019 (2018: 4.5%).
There are several risks to the inflation outlook. First, the trajectory of headline inflation will be dependent on global oil prices. Second, domestic food prices are subject to the potential expansion in the list of controlled food items, weather conditions which could affect food supply, and the cost of imported inputs to food production. Third, the strength of growth in both Malaysia and its trading partners could affect the extent of demand pressure on domestic inflation.
MONETARY POLICY
Monetary policy in 2019 will focus on promoting steady growth of the Malaysian economy and price stability
Monetary policy in 2019 will focus on supporting the steady growth of the Malaysian economy amid an environment of relatively low inflation. Growth of the domestic economy is expected to be sustained with continued support from private sector spending. However, there remain downside risks to the domestic growth outlook. In addition to the downside risks emanating from the global environment, commodity-related supply disruptions could continue to weigh on domestic growth prospects. Headline inflation is projected to be broadly stable. Underlying inflation, as measured by core inflation, is expected to be sustained amid the steady expansion in economic activity and in the absence of strong demand pressures. The priority of the Monetary Policy Committee (MPC) would thus be to ensure that the stance of monetary policy remains accommodative and supportive of real economic activity amid relatively contained risks to inflation.
At the same time, monetary policy will also consider the prevailing monetary and financial conditions. While risks of financial imbalances are expected to remain contained, the MPC is cognisant of challenges emanating from potential continued volatility in global capital flows. In this regard, the Bank will continue to ensure sufficient liquidity and orderly market conditions that remain supportive of financial intermediation activity.
The broad range of policy options available provide the Bank with flexibility to manage emerging risks. This policy toolkit includes monetary policy, micro- and macroprudential measures. Measures to further deepen the domestic financial markets will also contribute to orderly market conditions. The combined effect of these policies will ensure that policy efficacy is maintained without the overburdening of any single policy tool.
FISCAL POLICY
The Government remains committed to fiscal consolidation
Fiscal policy in 2019 aims to strengthen the Government’s fiscal position by pursuing gradual fiscal consolidation while lending continued support for growth,
7 Average price of UK Brent, West Texas Intermediate (WTI) and Dubai Fateh crude oil, equally weighted, as published by the IMF in the January 2019 update to the World Economic Outlook.
8 Since March 2019, retail fuel prices are subject to price ceilings of RM2.08 per litre for RON95 petrol and RM2.18 per litre for diesel, until the implementation of the targeted fuel subsidy.
9 Based on the 2018 MEF Salary Surveys for Executives and Non-Executives. The salary increment figures used are simple averages of employers’ expectations of salary increments for both executives and non-executives.
91Annual Report 2018
Outlook and
Policy in 2019
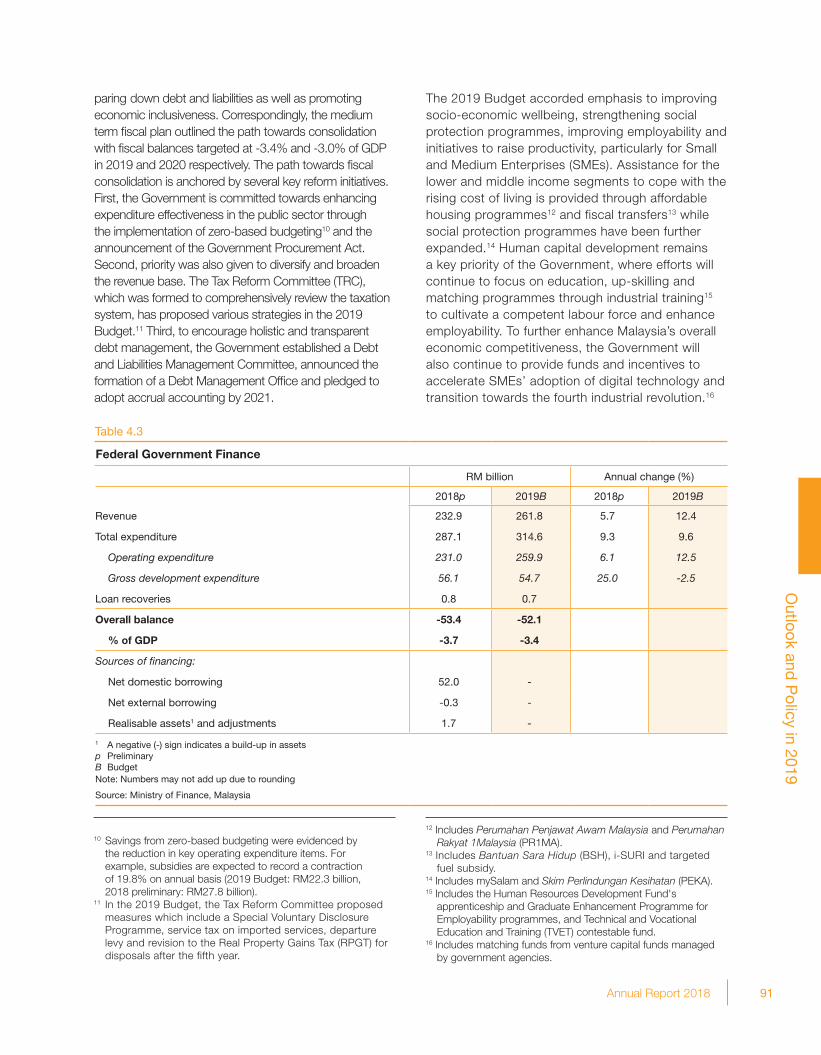
paring down debt and liabilities as well as promoting economic inclusiveness. Correspondingly, the medium term fiscal plan outlined the path towards consolidation with fiscal balances targeted at -3.4% and -3.0% of GDP in 2019 and 2020 respectively. The path towards fiscal consolidation is anchored by several key reform initiatives. First, the Government is committed towards enhancing expenditure effectiveness in the public sector through the implementation of zero-based budgeting10 and the announcement of the Government Procurement Act. Second, priority was also given to diversify and broaden the revenue base. The Tax Reform Committee (TRC), which was formed to comprehensively review the taxation system, has proposed various strategies in the 2019 Budget.11 Third, to encourage holistic and transparent debt management, the Government established a Debt and Liabilities Management Committee, announced the formation of a Debt Management Office and pledged to adopt accrual accounting by 2021.
Federal Government Finance
RM billion Annual change (%)
2018p 2019B 2018p 2019B
Revenue 232.9 261.8 5.7 12.4
Total expenditure 287.1 314.6 9.3 9.6
Operating expenditure 231.0 259.9 6.1 12.5
Gross development expenditure 56.1 54.7 25.0 -2.5
Loan recoveries 0.8 0.7
Overall balance -53.4 -52.1
% of GDP -3.7 -3.4
Sources of fi nancing:
Net domestic borrowing 52.0 -
Net external borrowing -0.3 -
Realisable assets1 and adjustments 1.7 -
1 A negative (-) sign indicates a build-up in assetsp PreliminaryB BudgetNote: Numbers may not add up due to rounding
Source: Ministry of Finance, Malaysia
Table 4.3
10 Savings from zero-based budgeting were evidenced by the reduction in key operating expenditure items. For example, subsidies are expected to record a contraction of 19.8% on annual basis (2019 Budget: RM22.3 billion, 2018 preliminary: RM27.8 billion).
11 In the 2019 Budget, the Tax Reform Committee proposed measures which include a Special Voluntary Disclosure Programme, service tax on imported services, departure levy and revision to the Real Property Gains Tax (RPGT) for disposals after the fifth year.
The 2019 Budget accorded emphasis to improving socio-economic wellbeing, strengthening social protection programmes, improving employability and initiatives to raise productivity, particularly for Small and Medium Enterprises (SMEs). Assistance for the lower and middle income segments to cope with the rising cost of living is provided through affordable housing programmes12 and fiscal transfers13 while social protection programmes have been further expanded.14 Human capital development remains a key priority of the Government, where efforts will continue to focus on education, up-skilling and matching programmes through industrial training15 to cultivate a competent labour force and enhance employability. To further enhance Malaysia’s overall economic competitiveness, the Government will also continue to provide funds and incentives to accelerate SMEs’ adoption of digital technology and transition towards the fourth industrial revolution.16
12 Includes Perumahan Penjawat Awam Malaysia and Perumahan Rakyat 1Malaysia (PR1MA).
13 Includes Bantuan Sara Hidup (BSH), i-SURI and targeted fuel subsidy.
14 Includes mySalam and Skim Perlindungan Kesihatan (PEKA).15 Includes the Human Resources Development Fund's
apprenticeship and Graduate Enhancement Programme for Employability programmes, and Technical and Vocational Education and Training (TVET) contestable fund.
16 Includes matching funds from venture capital funds managed by government agencies.

92 Annual Report 2018
Outlook and
Policy in 2019
Source: Ministry of Finance, Malaysia
% of GDP% of GDP
External debt1Domestic debt Overall balance (RHS)
Chart 4.1: Federal Government Fiscal Balance and Debt
The Government remains committed to fiscal consolidation and reforms
1 External debt comprises foreign currency debt (offshore borrowing) and non-resident holdings of RM-denominated debt (MGS, GII, T-bills and Sukuk Perumahan Kerajaan)
p PreliminaryB Budget
-4.6-6.7
-5.3-4.7 -4.3 -3.8 -3.4 -3.2 -3.1 -3.0 -3.7 -3.4
-8
-6
-4
-2
0
2
4
6
8
-60
-40
-20
0
20
40
60
2008
2009
2010
2011
2012
2013
2014
2015
2016
2017
2018
p
2019
B
50.7% 51.8%
Going forward, the Government has indicated its commitment towards ensuring fiscal sustainability and a stronger governance framework through the implementation of holistic fiscal reforms. The Fiscal Policy Committee (FPC) and the Public Finance Committee (PFC) were tasked to assess and strike a balance between being fiscally prudent and ensuring efficient spending and investment for economic growth. The introduction of a Fiscal Responsibility Act in 2021 is another step towards more progressive fiscal reforms. It will further solidify fiscal discipline, strengthen governance and accountability, and promote greater transparency.

93Annual Report 2018
Outlook and
Policy in 2019
77Annual Report 2018
When the Future Starts Today: Infl ation Expectations of Malaysian Households
By Zul-Fadzli Abu Bakar and Nur Aimi Abdul Ghani
Assessments on infl ation expectations are of great importance in central banking, both in advanced and emerging market economies. Central banks care about infl ation expectations given their prospective infl uence on key economic and fi nancial variables such as actual infl ation, households’ consumption and saving decisions, fi rms’ price- and wage-setting decisions, as well as fi nancial asset valuations.
The concept of infl ation expectations applies to households, fi rms, professional forecasters and fi nancial markets. While the beliefs of future infl ation hold across these different economic agents, their expectations are not interchangeable as they provide different insights (Table 1) (Coibion et al., 2018).
Given these different types of inflation expectations, this article focuses specifically on inflation expectations of households1 in Malaysia, using data from the Bank Negara Malaysia Consumer Sentiment Survey (BNM CSS). It aims to explain the formation of these expectations, seeking insights into how households process information to inform their future price outlook. It then explores factors that contribute to biases in inflation expectations. As inflation expectations may influence households’ spending decisions, the article also examines the relationship between inflation expectations and households’ spending decisions.
1 In the BNM CSS, a household is defi ned as related and/or unrelated persons who usually live together and make common provisions for food and other living essentials.
Table 1: Differences between Inflation Expectations of Households, Firms, Professional Forecasters and Financial Markets
Households’ view of how prices will evolve
in the future
Survey ofhouseholds
Consumption & saving decisions, wage
bargaining
Inflationary sentiments
of firms
Survey of firms
Pricing strategy, investment, hiring and wage-setting decisions
Expected inflation rate of professional economic
forecasters
Survey of professional economic forecasters
View on broader economic conditions
Market-implied, i.e. derived from prices of financial
instruments
Financial markets’ expectations of
future prices
Financial asset valuations
How are they commonly measured?
What insights dothey provide?
What are they?
Source: Coibion et al. (2018)
Households
Financialmarkets
Professionalforecasters
Firms
94 Annual Report 2018
Outlook and
Policy in 2019
78 Annual Report 2018
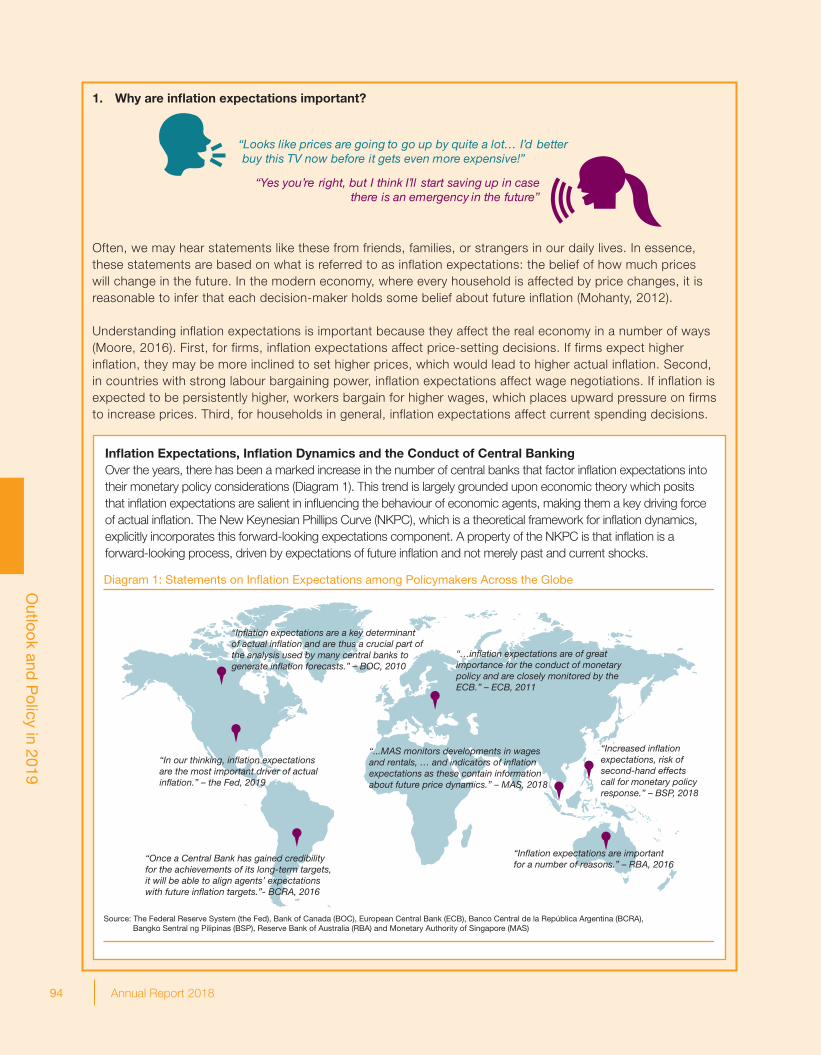
Infl ation Expectations, Infl ation Dynamics and the Conduct of Central BankingOver the years, there has been a marked increase in the number of central banks that factor infl ation expectations into their monetary policy considerations (Diagram 1). This trend is largely grounded upon economic theory which posits that infl ation expectations are salient in infl uencing the behaviour of economic agents, making them a key driving force of actual infl ation. The New Keynesian Phillips Curve (NKPC), which is a theoretical framework for infl ation dynamics, explicitly incorporates this forward-looking expectations component. A property of the NKPC is that infl ation is a forward-looking process, driven by expectations of future infl ation and not merely past and current shocks.
1. Why are infl ation expectations important?
Often, we may hear statements like these from friends, families, or strangers in our daily lives. In essence, these statements are based on what is referred to as inflation expectations: the belief of how much prices will change in the future. In the modern economy, where every household is affected by price changes, it is reasonable to infer that each decision-maker holds some belief about future inflation (Mohanty, 2012).
Understanding inflation expectations is important because they affect the real economy in a number of ways (Moore, 2016). First, for firms, inflation expectations affect price-setting decisions. If firms expect higher inflation, they may be more inclined to set higher prices, which would lead to higher actual inflation. Second, in countries with strong labour bargaining power, inflation expectations affect wage negotiations. If inflation is expected to be persistently higher, workers bargain for higher wages, which places upward pressure on firms to increase prices. Third, for households in general, inflation expectations affect current spending decisions.
Diagram 1: Statements on Inflation Expectations among Policymakers Across the Globe
“Inflation expectations are a key determinantof actual inflation and are thus a crucial part ofthe analysis used by many central banks togenerate inflation forecasts.” – BOC, 2010
“In our thinking, inflation expectationsare the most important driver of actualinflation.” – the Fed, 2019
“…inflation expectations are of great importance for the conduct of monetary policy and are closely monitored by the ECB.” – ECB, 2011
“...MAS monitors developments in wages and rentals, … and indicators of inflation expectations as these contain information about future price dynamics.” – MAS, 2018
“Increased inflation expectations, risk of second-hand effects call for monetary policy response.” – BSP, 2018
“Inflation expectations are important for a number of reasons.” – RBA, 2016
Source: The Federal Reserve System (the Fed), Bank of Canada (BOC), European Central Bank (ECB), Banco Central de la República Argentina (BCRA), Bangko Sentral ng Pilipinas (BSP), Reserve Bank of Australia (RBA) and Monetary Authority of Singapore (MAS)
“Once a Central Bank has gained credibility for the achievements of its long-term targets, it will be able to align agents’ expectations with future inflation targets.”- BCRA, 2016
“Looks like prices are going to go up by quite a lot… I’d better buy this TV now before it gets even more expensive!”
“Yes you’re right, but I think I’ll start saving up in case there is an emergency in the future”
“Ya betul, tapi saya rasa saya akan mula berjimat untuk kecemasan pada masa depan”
“Nampaknya harga akan semakin meningkat dengan lebih banyak... Baik saya beli TV ini sekarang sebelum harga jadi lebih mahal!”

95Annual Report 2018
Outlook and
Policy in 2019
79Annual Report 2018
2. How are household infl ation expectations measured?
Household infl ation expectations are measured through surveys
Unlike actual infl ation itself, infl ation expectations are unobserved. As such, their measurements rely on inference. A standard approach globally is to directly question households what they expect infl ation to be in the following year through periodic surveys catered to extract household economic information (Table 2). There are variations to this question, which may be in qualitative or quantitative form, and either general or specifi c:2
For Malaysia, similar questions are featured as part of the BNM CSS. Each month, around 1,000 respondents are interviewed from samples designed to be representative of the Malaysian population, with respondents ranging from 18 to 74 years old. The BNM CSS commenced in 2013 to bridge information gaps pertaining to consumer expectations on economic growth, infl ation, wage growth and borrowing cost.3 This survey also gathers households’ demographics such as their household size, income and location.
Infl ation expectations affect actual infl ation because they infl uence spending, price- and wage-setting decisions. They can cause a long-lasting impact to actual infl ation, whereby one round of price increases triggers further rounds as infl ationary psychology takes hold. Consequently, modern central banking practices involve anticipating future infl ation and managing infl ation expectations to ensure price stability. From a policy perspective, this forward-looking element opens the door to expectations management and communications as added tools of monetary policy.
Notwithstanding this, the sources of infl ation expectations, as well as the actual drivers of infl ation itself, need to be assessed holistically for monetary policy considerations. Notably, whether infl ation expectations and actual infl ation are demand- or supply-driven. The early 2007 – July 2008 period provides a good example, a time when global commodity prices, as measured by the IMF Commodity Price Index, increased by 83%, leading to rising global infl ation. In the euro area, concerns of rising infl ation expectations were at the forefront of policy discussions as there were risks of second-round effects to actual prices from price- and wage-setting behaviour. In other words, if rising infl ation expectations were not managed, the commodity price shock may have had longer-lasting effects to actual infl ation if fi rms were setting higher prices and households were bargaining for higher wages in anticipation of the higher future infl ation. This, along with other considerations, led the European Central Bank (ECB) to increase its policy rate by 25 basis points in July 2008.
In Malaysia, the monetary policy stance was maintained during this period despite the increase in supply-driven infl ation pressures. While the risks to infl ation were on the upside, it was assessed that the risks to growth were on the downside given the weakening global growth, and thus reduced the likelihood of second-round effects to infl ation. As the global fi nancial crisis intensifi ed, policy rates were consequently reduced by 150 basis points from October 2008 to February 2009.
Inflation expectations are only one of the many determinants of inflation. Ultimately, monetary policy must give due consideration to the overall inflation outlook, in addition to economic growth prospects and risks of financial imbalances.
2 These questions are adapted from the University of Michigan Survey of Consumers for American households (Meyer and Venkatu, 2011).3 The Malaysian Institute of Economic Research (MIER) also conducts a similar survey on consumer sentiments in Malaysia. The main
differences between MIER’s survey and that of BNM's are the coverage of topics and frequency of survey.
Qualitative and general: “During the next 12 months, do you think that prices in general will go up, go down, or remain the same?”
Quantitative and specifi c: “During the next 12 months, how much do you think prices of fuel will go up, go down, or do you think they will remain the same?”

96 Annual Report 2018
Outlook and
Policy in 2019
80 Annual Report 2018
Table 2: Surveys on Infl ation Expectations of Households in Various Countries
Country Survey Year started Frequency Coverage Expectation horizon
United StatesUniversity of Michigan, Survey of Consumers
1946 MonthlyMinimum of 500
households 1-year & 5-year ahead
EUEuropean Commission, Business and Consumer
Survey1961 Monthly
More than 41,000 households
1-year ahead
Australia Melbourne Institute, Consumer Attitudes,
Sentiments and Expectations in Australia Survey
1974 Monthly 1,200 households 1-year ahead
JapanBank of Japan, Opinion Survey on the General
Public’s Views and Behavior1993 Quarterly 4,000 households 1-year & 5-year ahead
New ZealandReserve Bank of New
Zealand, Household Infl ation Expectations Survey
1995 Quarterly 1,000 households 1-year & 5-year ahead
CanadaBank of Canada, the Canadian Survey of
Consumer Expectations2015 Quarterly 1,000 households
1-year, 2-year & 5-year ahead
IndonesiaBank Indonesia,
Consumer Expectation Survey
1999 Monthly 4,600 households 6-month ahead
IndiaReserve Bank of India,
Infl ation Expectations Survey of Households
2005 Quarterly 6,000 households 3-month & 1-year ahead
SingaporeSKBI-MasterCard Index of Infl ation
Expectations Survey2011 Quarterly 400 households 1-year & 5-year ahead
MalaysiaBNM Consumer
Sentiment Survey2013 Monthly 1,000 households
1-year & 2- to 3-year ahead
Source: University of Michigan, European Commission, Melbourne Institute, Bank of Japan, Reserve Bank of New Zealand, Bank of Canada, Bank Indonesia, Reserve Bank of India, Singapore Management University, and Bank Negara Malaysia
3. How do Malaysian households form their infl ation expectations?
Households form their infl ation expectations through a combination of past, current and forward-looking beliefs
To interpret the level and changes of infl ation expectations, it is useful to understand how they are formed. Households place different weights on a host of factors when constructing their infl ation expectations (Rowe, 2016). On the one hand, “backward-looking” households develop infl ation expectations by extrapolating past and current infl ation experiences into the future. These past and current infl ation experiences are also referred to as infl ation perceptions, which are the beliefs of how much prices have changed (Table 3). Sentiments surrounding income also shape infl ation perceptions because changes in income relative to price affect the perceived impact of price changes, and thereby households’ views toward affordability (Ranyard et al., 2008; Gärling and Gamble, 2006; Gamble, 2006).
81Annual Report 2018
On the other hand, “forward-looking” households consider expectations of future broader economic developments, such as their sentiments on the economy. In reality, households can integrate both backward- and forward-looking factors in shaping their infl ation expectations.
On average, Malaysian households place weights on both backward- and forward-looking factors (Chart 1).4 Past sentiments on the domestic economy, recent shopping experiences and current income levels are important backward-looking factors, reflecting their role as easy, accessible and personal ways to form predictions. The forward-looking aspect is also important, with households also considering their expectations of the future strength of the Malaysian economy when forming inflation expectations.
4 The estimates are derived using an Ordinary Least Squares (OLS) regression of infl ation expectations against factors identifi ed in the literature to affect infl ation expectations. The regression also controls for time effects. The estimates shown are statistically signifi cant at the 1% level.
Table 3: Differences Between Infl ation Expectations, Infl ation Perceptions and Actual Infl ation
Infl ation expectations Infl ation perceptions Actual infl ation
Defi nitionThe belief of how much prices will
change in the future
The belief of howmuch prices have
changed from the past
How much prices have changed from last year, based on a single basket of goods and services in the Consumer Price Index (CPI)
Infl uenced byIndividual’s information
sets of the past, present and future
Individual’s information sets of the
past and present
Average consumption patterns of Malaysian households and
average prices in the economy
Source: Bank Negara Malaysia, Arioli et al. (2017)
Chart 1: Selected Factors Estimated to Determine Inflation Expectations of Malaysian Households
Households consider both backward- and forward-looking factors when forming inflation expectations
Note: Other factors that are considered include expectations for future interest rate on savings, expectations for future interest rates on loans and various sources of inflation information such as the mass media and internet. The factors chosen are based on Rowe (2016).
0 5 10 15 20
Expectations for future strengthof the Malaysian economy
Household income
Actual inflation1
Recent shopping experiences
Past sentiments about theMalaysian economy
Past and current
Future
Relative importance (%)2
1 Actual inflation refers to Consumer Price Index (CPI) inflation of the current and past three months2 Relative importance refers to how much the factors contribute to the movements in inflation expectations relative to other factors considered
Source: Bank Negara Malaysia estimates using data from the Bank Negara Malaysia Consumer Sentiment Survey and Department of Statistics, Malaysia

97Annual Report 2018
Outlook and
Policy in 2019
81Annual Report 2018
On the other hand, “forward-looking” households consider expectations of future broader economic developments, such as their sentiments on the economy. In reality, households can integrate both backward- and forward-looking factors in shaping their infl ation expectations.
On average, Malaysian households place weights on both backward- and forward-looking factors (Chart 1).4 Past sentiments on the domestic economy, recent shopping experiences and current income levels are important backward-looking factors, reflecting their role as easy, accessible and personal ways to form predictions. The forward-looking aspect is also important, with households also considering their expectations of the future strength of the Malaysian economy when forming inflation expectations.
4 The estimates are derived using an Ordinary Least Squares (OLS) regression of infl ation expectations against factors identifi ed in the literature to affect infl ation expectations. The regression also controls for time effects. The estimates shown are statistically signifi cant at the 1% level.
Table 3: Differences Between Infl ation Expectations, Infl ation Perceptions and Actual Infl ation
Infl ation expectations Infl ation perceptions Actual infl ation
Defi nitionThe belief of how much prices will
change in the future
The belief of howmuch prices have
changed from the past
How much prices have changed from last year, based on a single basket of goods and services in the Consumer Price Index (CPI)
Infl uenced byIndividual’s information
sets of the past, present and future
Individual’s information sets of the
past and present
Average consumption patterns of Malaysian households and
average prices in the economy
Source: Bank Negara Malaysia, Arioli et al. (2017)
Chart 1: Selected Factors Estimated to Determine Inflation Expectations of Malaysian Households
Households consider both backward- and forward-looking factors when forming inflation expectations
Note: Other factors that are considered include expectations for future interest rate on savings, expectations for future interest rates on loans and various sources of inflation information such as the mass media and internet. The factors chosen are based on Rowe (2016).
0 5 10 15 20
Expectations for future strengthof the Malaysian economy
Household income
Actual inflation1
Recent shopping experiences
Past sentiments about theMalaysian economy
Past and current
Future
Relative importance (%)2
1 Actual inflation refers to Consumer Price Index (CPI) inflation of the current and past three months2 Relative importance refers to how much the factors contribute to the movements in inflation expectations relative to other factors considered
Source: Bank Negara Malaysia estimates using data from the Bank Negara Malaysia Consumer Sentiment Survey and Department of Statistics, Malaysia

98 Annual Report 2018
Outlook and
Policy in 2019
82 Annual Report 2018
Households who are pessimistic on economic or fi nancial conditions may be more likely to have higher infl ation expectations. As these households struggle to make ends meet, either due to insuffi cient income or rising prices, they are likely to anticipate higher future infl ation (Ehrmann et al., 2015). In other countries, it was found that fi nancially constrained households also pay more attention to price changes compared to less constrained households, and that households in general are more receptive to bad news than good news. In totality, this could lead to higher infl ation expectations (Ehrmann et al., 2015; Snir and Levy, 2011, Baumeister et al., 2001).
Most Malaysian households’ infl ation expectations are anchored at a relatively stable rate of 1 – 4%, though disparity is still observed
Some households tend to over-predict future infl ation, which is also referred to as positive expectations bias, while others may be more inclined to under-predict, which is called negative infl ation expectations bias. This disparity is evident in Malaysia when the infl ation expectations bias is grouped by demographic groups (Chart 2). Lower-income households, large households, working age individuals, households with less job security, and households in Kuala Lumpur have greater tendency for higher infl ation expectations.5 Some of the groups, such as lower-income households, consume more necessities (e.g. food) which typically exhibit higher rates of infl ation. The tendency for upward bias for these groups may also refl ect their cost of living burden and concerns about insuffi cient income. Indeed, a common grievance voiced by these groups is that the actual infl ation rate is not refl ective of the actual price increases they experience on the ground.
5 The estimates are derived using an Ordinary Least Squares (OLS) regression of infl ation expectations bias against demographic characteristics to quantify their contributions to the over-prediction or under-prediction of future infl ation. All the estimates shown are statistically signifi cant at the 10% level, except for elderly respondents and respondents residing in less-urbanised states.
Chart 2: Contribution of Main Demographic Characteristics to Inflation Expectations Bias
Certain households have greater tendency towards higher inflation expectations
Relative inflation expectations bias1 (percentage points)
-1.0
-0.5
0.0
0.5
1.0
1.5
Low
Hig
h
Sm
all
Larg
e
Wor
king
age
Eld
erly
Full
time
Tem
por
ary
Kua
la L
ump
ur
Income level Householdsize
Age Employmentstatus
Regions
Less
-urb
anis
ed s
tate
s2
Note: For income level, low refers to monthly household income below RM5,000 while high, above RM8,000. For household (HH) size, small refers to number of HH members below four while large, above seven. For age, working age refers to respondents aged between 20-59 while elderly, 60-74. For employment status, full time refers to permanent employees working eight hours a day or five days a week, while temporary refers to employees under a short-term, non-contractual or ad-hoc work arrangement. The methodology is based on Leung (2009)
1 The bias refers to 1-year ahead inflation expectations minus actual inflation outcomes. The relative inflation expectations bias should be interpreted relative to a baseline respondent who represents a HH that earns RM5,000-RM8,000, has a HH size of between 4-7 members, is aged between 18-19, is self-employed (e.g. sole proprietor or independent professional) and is residing outside Kuala Lumpur and less-urbanised states2 Less-urbanised states are states with urbanisation levels of below 55%, according to the 2010 Population and Housing Census of Malaysia. These states include Sabah, Sarawak, Pahang and Kelantan
Source: Bank Negara Malaysia estimates using data from the Bank Negara Malaysia Consumer Sentiment Survey and Department of Statistics, Malaysia
83Annual Report 2018
Notwithstanding the disparity across groups, for most periods, overall households’ infl ation expectations deviate on the upside from the actual infl ation outcomes (Chart 3). This observation is not unique to Malaysia. Households, in both advanced and emerging economies, commonly display deviations in infl ation expectations from the actual infl ation outcomes (Coibion et al. 2018, Kliesen, 2015, Mohanty, 2012, Gnan et al. 2009, Deutsche Bundesbank, 2001). For countries with a longer history of household survey data, namely the United States, Australia, Japan and the Philippines, the positive bias can range between 1 and 4 percentage points. On average, most households’ infl ation expectations in Malaysia are broadly anchored at a relatively stable rate of 1 – 4%, close to the actual infl ation long-run average of 3% (1980 – 2018).
Chart 3: Inflation Expectations of Malaysian Households
Actual InflationInflation Expectations (as reported one year ago)
-2
0
2
4
6
8
A M J J A S O N D J F M A M J J A S O N D J F M A M J J A S O N D J F M A M J J A S O N D
Positive bias
2018 201920172016
Negative bias
Annual growth (%)
In line with experiences of other countries, inflation expectations of Malaysian households are typicallydifferent from the actual inflation outcomes
Note: The shaded area refers to the 1 standard deviation above and below the mean inflation expectations
Source: Bank Negara Malaysia estimates using data from the Bank Negara Malaysia Consumer Sentiment Survey and Department of Statistics, Malaysia
Average Household Inflation Expectations Bias Across Selected Countries Since 2015
0.0
0.5
1.0
1.5
2.0
2.5
3.0
3.5
4.0
Japan Australia New Zealand Malaysia Philippines United States2
Inflation expectations bias1 (percentage points)
United Kingdom2
1 The bias is calculated by taking 1-year ahead mean inflation expectations minus actual inflation outcomes2 Inflation expectations for the United States and the United Kingdom are based on the median instead of the mean
Source: Bank Negara Malaysia estimates using data from the Bank Negara Malaysia Consumer Sentiment Survey, Department of Statistics, Malaysia and the respective household surveys

99Annual Report 2018
Outlook and
Policy in 2019
83Annual Report 2018
Notwithstanding the disparity across groups, for most periods, overall households’ infl ation expectations deviate on the upside from the actual infl ation outcomes (Chart 3). This observation is not unique to Malaysia. Households, in both advanced and emerging economies, commonly display deviations in infl ation expectations from the actual infl ation outcomes (Coibion et al. 2018, Kliesen, 2015, Mohanty, 2012, Gnan et al. 2009, Deutsche Bundesbank, 2001). For countries with a longer history of household survey data, namely the United States, Australia, Japan and the Philippines, the positive bias can range between 1 and 4 percentage points. On average, most households’ infl ation expectations in Malaysia are broadly anchored at a relatively stable rate of 1 – 4%, close to the actual infl ation long-run average of 3% (1980 – 2018).
Chart 3: Inflation Expectations of Malaysian Households
Actual InflationInflation Expectations (as reported one year ago)
-2
0
2
4
6
8
A M J J A S O N D J F M A M J J A S O N D J F M A M J J A S O N D J F M A M J J A S O N D
Positive bias
2018 201920172016
Negative bias
Annual growth (%)
In line with experiences of other countries, inflation expectations of Malaysian households are typicallydifferent from the actual inflation outcomes
Note: The shaded area refers to the 1 standard deviation above and below the mean inflation expectations
Source: Bank Negara Malaysia estimates using data from the Bank Negara Malaysia Consumer Sentiment Survey and Department of Statistics, Malaysia
Average Household Inflation Expectations Bias Across Selected Countries Since 2015
0.0
0.5
1.0
1.5
2.0
2.5
3.0
3.5
4.0
Japan Australia New Zealand Malaysia Philippines United States2
Inflation expectations bias1 (percentage points)
United Kingdom2
1 The bias is calculated by taking 1-year ahead mean inflation expectations minus actual inflation outcomes2 Inflation expectations for the United States and the United Kingdom are based on the median instead of the mean
Source: Bank Negara Malaysia estimates using data from the Bank Negara Malaysia Consumer Sentiment Survey, Department of Statistics, Malaysia and the respective household surveys

100 Annual Report 2018
Outlook and
Policy in 2019
84 Annual Report 2018
Source: Bank Negara Malaysia Consumer Sentiment Survey
Diagram 2: Household Sources of Information about Inflation
2015 2018
Family orfriends24%
Internet9%
Shoppingexperience
20%
Mass media 45%
Academicarticles
1%
29%Mass media
26%
Family orfriends
24%
Shoppingexperience
2%
Academicarticles
17%Internet
The role of the internet as a source of infomation on inflation has markedly increased over time
4. Why do infl ation expectations differ from actual infl ation?
Infl ation expectations are unlikely to be the same as the actual infl ation outcomes because forming accurate beliefs about future prices is challenging and costly, even for professional forecasters. It is found that in countries with extremely high infl ation such as Argentina, households appear to be much more well-informed on infl ation as its impact is acutely felt; whereas in countries with low infl ation, households pay less attention to infl ation given the relatively lower potential fi nancial cost of ignoring infl ation (Cavallo et al., 2017). In Malaysia, when respondents were asked whether they understood what the term “infl ation” means, 77% of them answered no. The low awareness among households would likely contribute to biases in their infl ation expectations. The wedge between infl ation expectations and actual infl ation outturns is driven by diverse information sets, different spending patterns and unanticipated shocks.
First, diverse information sets. Households rely on various information sources in informing their views on price developments. In Malaysia, households appear to be largely dependent on information sources that are relatively accessible when forming infl ation expectations. These include mass media, family and friends, as well as recent shopping experiences (Diagram 2).
These information sets and their importance are different from those used to construct the actual infl ation rate, which is measured by the Consumer Price Index. This could lead to infl ation expectations being different from the actual infl ation outcome.
Second, the different types of items consumed. Households typically over-estimate future infl ation of frequently-purchased items and necessities, such as transport and food (Diagram 3). Repeated shopping experiences of the same items (usually non-durable necessities), coupled with their corresponding price increases are more easily recalled and are therefore vivid in one’s recollection when forming expectations. It was estimated that households in Malaysia who rely on recent shopping experiences as an information source tend to over-predict infl ation by 1.2 percentage points (ppt) compared to households who do not rely on recent shopping experiences. This is compounded by memory bias, whereby increases in prices are more easily recalled rather than price declines (Loke and Khong, 2017).

101Annual Report 2018
Outlook and
Policy in 2019
85Annual Report 2018
-0.5 0 0.5 1
Clothing
Bills/ Utility
Electronics
Food away from home
Food at home
Transport
Less frequently-purchased: +0.1 ppt
Frequently-purchased: +1.7 percentage points (ppt)
Source: Bank Negara Malaysia estimates using data from the Bank Negara Malaysia Consumer Sentiment Survey and Department of Statistics, Malaysia
Diagram 3: Contribution of Key Consumer Items to Inflation Expectations Bias
Households have a higher tendency to over-predict the future inflation of frequently-purchased and necessity items
Contribution to inflation expectations bias
Necessities Discretionary Items
1.1 ppt 0.7 ppt
Contribution to inflation expectations bias
Third, unanticipated shocks. Even if households are able to use all existing information to inform future infl ation expectations, there remains a possibility of unforeseen events. In 2018, the actual infl ation outcome was lower than expected mainly due to the zerorisation of the Goods and Services Tax (GST) rate,6 which led to a broad-based decline in the prices of goods and services that were previously subjected to the GST. As a result, there was a positive bias as infl ation expectations of households over-predicted actual infl ation outcomes by an average of 3.4 ppt (Chart 4).
6 The zerorisation of the GST rate was between 1 June 2018 and 31 August 2018. Subsequently, the GST was replaced by the Sales and Services Tax (SST) effective 1 September 2018.
Source: Bank Negara Malaysia estimates using data from the Bank Negara Malaysia Consumer Sentiment Survey and Department of Statistics, Malaysia
-2
-1
0
1
2
3
4
5
N D J F M A M J J A S O N D J F M A M J J A S O N D J F M A M J J A S O N D
2016 2017 20182015
Over-prediction
Inflation expectations bias*(percentage points)
Under-prediction
*The bias is calculated by taking 1-year ahead inflation expectations minus actual inflation outcomes
Inflation expectations bias is subject to unanticipated shocks to the actual inflation outcomes
GSTzerorisation
OPECproduction cut
2016: 1.6 ppt2017: -0.3 ppt2018: 3.4 ppt
Chart 4: Inflation Expectations Bias: Over- and Under-Predictions Relative to Actual Inflation

102 Annual Report 2018
Outlook and
Policy in 2019
86 Annual Report 2018
In 2017, the actual inflation outcome was higher than anticipated due to global oil prices that increased unexpectedly following the Organization of the Petroleum Exporting Countries (OPEC)’s agreement to cut production from 1 January 2017.7 Subsequently, the inflation expectations of households under-predicted actual inflation, with a negative bias of -0.3 ppt.
5. Do infl ation expectations of households affect spending decisions?
Higher infl ation expectations could increase or decrease households’ current spending (Table 4). Higher infl ation expectations would lead to higher current real spending when households decide to frontload future purchases to protect themselves against a costlier future environment. In addition, assuming unchanged nominal interest rates, higher infl ation expectations would lower real interest rates, thereby encouraging borrowers to spend.
Higher current real spending from higher infl ation expectations:
Type ofhouseholds Reasons
General
Frontloading of future purchases
Higher infl ation expectations signal that it is costlier to spend in the future, so it is favourable to frontload future spending today
Borrowers
Lower real interest rates for debt repayments
The lower real interest rates lead to a perceived increase in wealth for borrowers. If borrowers have higher propensity to consume out of wealth than lenders, aggregate spending will increase
Lower current real spending from higher infl ation expectations:
Type of households Reasons
General
Uncertainty and increased precaution
Higher infl ation expectations may signal an environment of economic uncertainty, whereby households will tend to withhold spending and increase savings for precautionary purposes
Financialinvestors
Lower real income from fi nancial assets
Higher infl ation expectations are a tax on real fi nancial income due to the lower expected real returns. For households that rely on fi nancial income, this discourages spending
Source: Mian et al. (2013), Bachmann et al. (2015) and Coibion et al. (2018)
Table 4: The Impact of Higher Infl ation Expectations to Current Real Spending
7 The stronger-than-expected global oil demand since the second quarter of 2017 amid production cuts led to falling inventories, which also supported the increase in oil prices. The rise in global oil prices was further compounded by unexpected supply disruptions in the US Gulf Coast due to Hurricane Harvey at the end of August and geopolitical tensions in the Middle East towards the end of the year.
On the other hand, higher infl ation expectations could lead to a decline in current real spending if households associate the higher infl ation expectations with broader economic uncertainty, thereby preferring to save for precautionary reasons. For fi nancial investors, the lower real interest rates also reduce expected real income from fi nancial assets, discouraging spending. Overall, the effect of infl ation expectations on real spending would depend on which of these factors dominate.
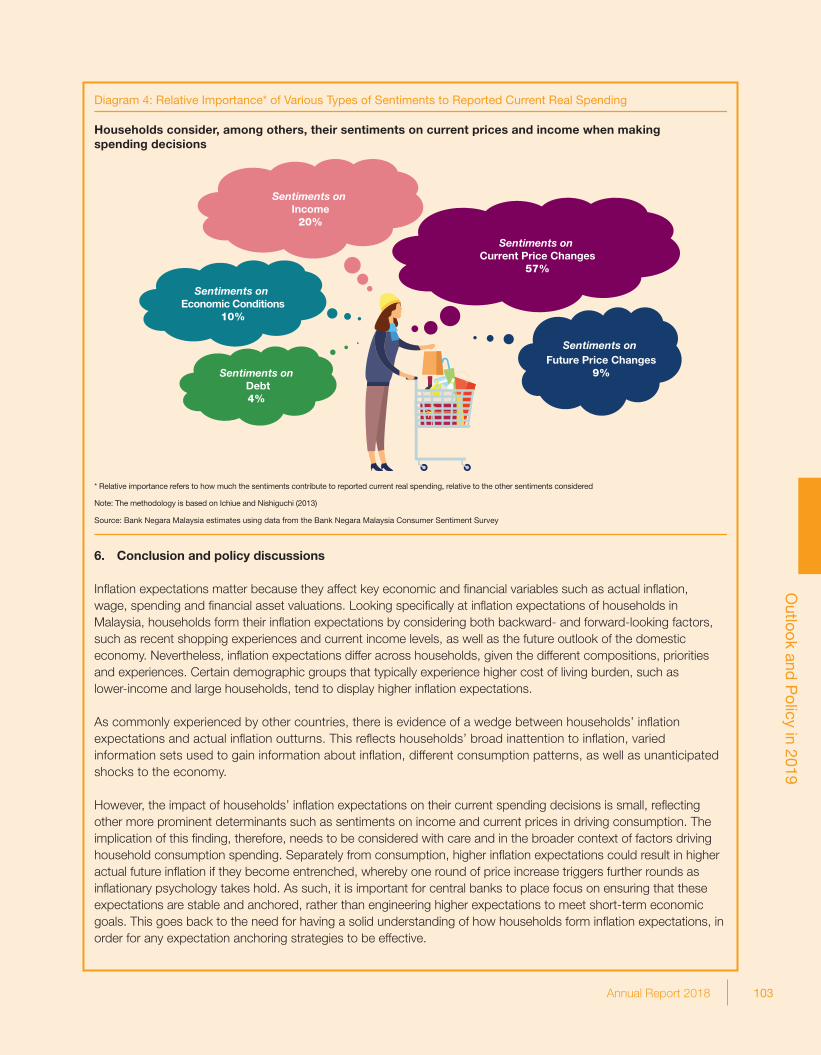
Households' sentiments on current prices, income, the overall economy, and their debt burden also infl uence their spending decisions (Diagram 4). For Malaysian households, while sentiments on income and current prices are the major factors that infl uence reported current real spending, there is still a role for infl ation expectations, though small. Notably, there are other more prominent determinants of real spending decisions in Malaysia that are not captured by the BNM CSS, such as wealth (Bank Negara Malaysia, 2013).
87Annual Report 2018
* Relative importance refers to how much the sentiments contribute to reported current real spending, relative to the other sentiments considered
Source: Bank Negara Malaysia estimates using data from the Bank Negara Malaysia Consumer Sentiment Survey
Households consider, among others, their sentiments on current prices and income when makingspending decisions
Diagram 4: Relative Importance* of Various Types of Sentiments to Reported Current Real Spending
Sentiments on Economic Conditions
10%
Sentiments on Current Price Changes
57%
Sentiments on Future Price Changes
9%Sentiments on Debt4%
Sentiments on Income
20%
Note: The methodology is based on Ichiue and Nishiguchi (2013)
6. Conclusion and policy discussions
Infl ation expectations matter because they affect key economic and fi nancial variables such as actual infl ation, wage, spending and fi nancial asset valuations. Looking specifi cally at infl ation expectations of households in Malaysia, households form their infl ation expectations by considering both backward- and forward-looking factors, such as recent shopping experiences and current income levels, as well as the future outlook of the domestic economy. Nevertheless, infl ation expectations differ across households, given the different compositions, priorities and experiences. Certain demographic groups that typically experience higher cost of living burden, such as lower-income and large households, tend to display higher infl ation expectations.
As commonly experienced by other countries, there is evidence of a wedge between households’ infl ation expectations and actual infl ation outturns. This refl ects households’ broad inattention to infl ation, varied information sets used to gain information about infl ation, different consumption patterns, as well as unanticipated shocks to the economy.
However, the impact of households’ infl ation expectations on their current spending decisions is small, refl ecting other more prominent determinants such as sentiments on income and current prices in driving consumption. The implication of this fi nding, therefore, needs to be considered with care and in the broader context of factors driving household consumption spending. Separately from consumption, higher infl ation expectations could result in higher actual future infl ation if they become entrenched, whereby one round of price increase triggers further rounds as infl ationary psychology takes hold. As such, it is important for central banks to place focus on ensuring that these expectations are stable and anchored, rather than engineering higher expectations to meet short-term economic goals. This goes back to the need for having a solid understanding of how households form infl ation expectations, in order for any expectation anchoring strategies to be effective.
103Annual Report 2018
Outlook and
Policy in 2019
87Annual Report 2018
* Relative importance refers to how much the sentiments contribute to reported current real spending, relative to the other sentiments considered
Source: Bank Negara Malaysia estimates using data from the Bank Negara Malaysia Consumer Sentiment Survey
Households consider, among others, their sentiments on current prices and income when makingspending decisions
Diagram 4: Relative Importance* of Various Types of Sentiments to Reported Current Real Spending
Sentiments on Economic Conditions
10%
Sentiments on Current Price Changes
57%
Sentiments on Future Price Changes
9%Sentiments on Debt4%
Sentiments on Income
20%
Note: The methodology is based on Ichiue and Nishiguchi (2013)
6. Conclusion and policy discussions
Infl ation expectations matter because they affect key economic and fi nancial variables such as actual infl ation, wage, spending and fi nancial asset valuations. Looking specifi cally at infl ation expectations of households in Malaysia, households form their infl ation expectations by considering both backward- and forward-looking factors, such as recent shopping experiences and current income levels, as well as the future outlook of the domestic economy. Nevertheless, infl ation expectations differ across households, given the different compositions, priorities and experiences. Certain demographic groups that typically experience higher cost of living burden, such as lower-income and large households, tend to display higher infl ation expectations.
As commonly experienced by other countries, there is evidence of a wedge between households’ infl ation expectations and actual infl ation outturns. This refl ects households’ broad inattention to infl ation, varied information sets used to gain information about infl ation, different consumption patterns, as well as unanticipated shocks to the economy.
However, the impact of households’ infl ation expectations on their current spending decisions is small, refl ecting other more prominent determinants such as sentiments on income and current prices in driving consumption. The implication of this fi nding, therefore, needs to be considered with care and in the broader context of factors driving household consumption spending. Separately from consumption, higher infl ation expectations could result in higher actual future infl ation if they become entrenched, whereby one round of price increase triggers further rounds as infl ationary psychology takes hold. As such, it is important for central banks to place focus on ensuring that these expectations are stable and anchored, rather than engineering higher expectations to meet short-term economic goals. This goes back to the need for having a solid understanding of how households form infl ation expectations, in order for any expectation anchoring strategies to be effective.

104 Annual Report 2018
Outlook and
Policy in 2019
88 Annual Report 2018
To gain a complete understanding of the impact of infl ation expectations on the Malaysian economy, infl ation expectations of fi rms and fi nancial markets should also be assessed in order to obtain a comprehensive picture that includes insights on price- and wage-setting decisions, as well as fi nancial market valuations.
As ruminated by Tan Sri Dato’ Abdul Aziz bin Haji Taha, the second Malaysian Governor of Bank Negara Malaysia, nearly four decades ago – “Once businessmen and consumers discern an absence of will by the authorities to resist infl ation, their expectations of rising infl ation will be strengthened and they begin to act in a way that will make these expectations self-fulfi lling” (Bank Negara Malaysia, 1989).
Today, this statement remains highly relevant. For central banks, continuous research on the drivers of infl ation expectations, clarity in communication and educational pursuit in addressing inattention to infl ation – from the concept of infl ation to the technicalities of its formulation – will go a long way in preventing the unhinging of infl ation expectations.
References
Arioli, Rodolfo, Colm Bates, Heinz Dieden, Ioana Duca, Roberta Friz, Christian Gayer, Geoff Kenny, Aidan Meyler, Iskra Pavlova, “EU Consumers’ Quantitative Infl ation Perceptions and Expectations: An Evaluation,” European Central Bank Occasional Paper Series, 2017.
Bachmann, Rüdiger, Tim O. Berg, and Eric R. Sims, “Infl ation Expectations and Readiness to Spend: Cross-Sectional Evidence,” American Economic Journal: Economic Policy, 7(1), 1-35, 2015.
Bank Negara Malaysia, “Central Banking In An Era of Change, Landmark Speeches: 1959 –1988,” 1989.
Bank Negara Malaysia, “Evolving Household Balance Sheets and Implication for Private Consumption,” Annual Report, pages 70-73, 2013.
Baumeister, Roy F., Ellen Bratslavsky, Catrin Finkenauer, and Kathleen D. Vohs, “Bad is Stronger Than Good,” Review of General Psychology 5(4): 323-70, 2001.
Cavallo, Alberto, Guillermo Cruces, and Ricardo Perez-Truglia, “Infl ation Expectations, Learning, and Supermarket Prices: Evidence from Survey Experiments,” American Economic Journal: Macroeconomics 9(3): 1-35, 2017.
Coibion, Olivier, Yuriy Gorodnichenko, Saten Kumar, and Mathieu Pedemonte, “Infl ation Expectation as a Policy Tool?,” NBER Working Paper No. 24788, 2018.
Deutsche Bundesbank, “The Information Content of Survey Data on Expected Price Developments for Monetary Policy,” January Monthly Report 53(1), 35–49, 2001.
Doepke, Matthias, and Martin Schneider, “Infl ation and the Redistribution of Nominal Wealth,” Journal of Political Economy, Volume 114, (Number 6), 1069-109, 2006.
Ehrmann, Michael, Damjan Pfajar, and Emiliano Santoro, “Consumers’ Attitudes and Their Infl ation Expectations,” Finance and Economics Discussion Series, Divisions of Research & Statistics and Monetary Affairs, Federal Reserve Board, 2015.
Gamble, Amelie, “Euro Illusion or the Reverse? Effects of Currency and Income on Evaluation of Prices of Consumer Products,” Journal of Economics Psychology, 27(4), 531-540, 2006.
Gärling, Tommy, and Amelie Gamble, “Change in Perceived Value of Money without Change in Nominal Representation,” Göteborg Psychological Report No. 36:4, Göteborg University, Department of Psychology, 2006.

105Annual Report 2018
Outlook and
Policy in 2019
89Annual Report 2018
Gnan, Ernest, Johann Scharler, and Maria Antoinette Silgoner, “Infl ation Expectations – Role and Measurement for Monetary Policy,” Monetary Policy & the Economy, Oesterreichische Nationalbank (Austrian Central Bank), Issue 2, pages 41-67, 2009.
Hoover, Kevin D, “Phillips Curve,” The Concise Encyclopedia of Economics, 2008.
Ichiue, Hibiki, and Shusaku Nishiguchi, “Infl ation Expectations and Consumer Spending at the Zero Bound,” Bank of Japan Working Paper Series, 2013.
Kliesen, Kevin, “How Accurate Are Measures of Long-Term Infl ation Expectations?,” Federal Reserve Bank of St. Louis, 2015.
Leung, Christina, “The Demographics of Household Infl ation Perceptions and Expectations,” Reserve Bank of New Zealand, 2009.
Loke, Po Ling and Farina Adam Khong, “Infl ation: Perception vs. Reality,” Bank Negara Malaysia First Quarter 2017 Quarterly Bulletin, 2017.
Meyer, Brent, and Guhan Venkatu, “Demographic Differences in Infl ation Expectations: What Do They Really Mean?,” Federal Reserve Bank of Cleveland, 2011.
Mian, Atif, Rao Kamalesh, and Amir Sufi , “Household Balance Sheets, Consumption, and the Economic Slump,” The Quarterly Journal of Economics, Volume 128, Issue 4, Pages 1687–1726, 2013.
Mohanty, Deepak, “The Importance of Infl ation Expectations,” Speech at the S P Jain Institute of Management & Research, Mumbai, 2012.
Moore, Angus, “Measures of Infl ation Expectations in Australia,” Reserve Bank of Australia Bulletin, December 23-31, 2016.
Pasaogullari, Mehmet, and Timothy Bianco, “Survey-Based Measures of Infl ation Expectations,” Federal Reserve Bank of Cleveland, 2010.
Ranyard, Rob, Fabio Del Missier, Nicolao Bonini, Darren Duxbury, and Barbara Summers, “Perceptions and Expectations of Price Changes and Infl ation: A Review and Conceptual Framework,” Journal of Economic Psychology 29.4: 378-400, 2008.
Rowe, Jeremy, “How Are Households’ Infl ation Expectations Formed?,” Bank of England Quarterly Bulletin, vol. 56(2), pages 82-86, 2016.
Snir, Avichai and Daniel Levy, “Shrinking Goods and Sticky Prices: Theory and Evidence,” Working Paper Series 17/11, The Rimini Centre for Economic Analysis, 2011.

106 Annual Report 2018
Outlook and
Policy in 2019