education policy outlook: australia - oecd.org policy outlook... · education policy outlook this...
TRANSCRIPT

EDUCATION POLICY OUTLOOK: AUSTRALIA
June 2013

EDUCATION POLICY OUTLOOK
This policy profile on education in Australia is part of the new Education Policy Outlook series,
which will present comparative analysis of education policies and reforms across OECD countries. Building on the substantial comparative and sectorial policy knowledge base available within the OECD, the series will result in a biannual publication (first volume in 2014). It will develop a comparative outlook on education policy by providing: a) analysis of individual countries’ educational context, challenges and policies (education policy profiles) and of international trends and b) comparative insight on policies and reforms on selected topics.
Designed for policy makers, analysts and practitioners who seek information and analysis of
education policy taking into account the importance of national context, the country policy profiles will offer constructive analysis of education policy in a comparative format. Each profile will review the current context and situation of the country’s education system and examine its challenges and policy responses, according to six policy levers that support improvement:
Students: How to raise outcomes for all in terms of 1) equity and quality and 2) preparing students for the future
Institutions: How to raise quality through 3) school improvement and 4) evaluation and assessment
System: How the system is organised to deliver education policy in terms of 5) governance and 6) funding.
Some country policy profiles will contain spotlight boxes on selected policy issues. They are meant to draw attention to specific policies that are promising or showing positive results and may be relevant for other countries.
Special thanks to the Australian Government for their active input during consultations and their constructive feedback on this report.
Authors: This country policy profile was prepared by Beatriz Pont, Diana Toledo Figueroa, Juliana
Zapata and Sylvain Fraccola (statistics and design), from the Education Policy Outlook team, which is part of the Policy Advice and Implementation Division, led by Richard Yelland. Editorial support was provided by Lynda Hawe and Susan Copeland. This profile builds on the knowledge and expertise of many project teams across the OECD’s Directorate for Education and Skills, to whom we are grateful.
Sources: This country profile draws on OECD indicators from the Programme for International
Student Assessment (PISA), the Teaching and Learning International Survey (TALIS) and the annual publication Education at a Glance, and refers to country and thematic studies such as OECD work on early
childhood education and care, teachers, school leadership, evaluation and assessment for improving school outcomes, equity and quality in education, governing complex education systems, vocational education and training, and tertiary education.
Most of the figures quoted in the different sections refer to Annex B, which presents a table of the main indicators for the different sources used throughout the country profile. Hyperlinks to the reference publications are included throughout the text for ease of reading, and also in the References and further reading section, which lists both OECD and non-OECD sources.
More information is available from the OECD Directorate for Education and Skills (www.oecd.org/edu) and its web pages on Education Policy Outlook (www.oecd.org/edu/policyoutlook.htm).

EDUCATION POLICY OUTLOOK: AUSTRALIA © OECD 2013 3
TABLE OF CONTENTS
Highlights ......................................................................................................................................................................... 4
Equity and quality Policies target diverse subgroups of student population .................................................................................................. 6
Preparing students for the future Fluid transitions to further education or labour market ..................................................................................................... 8
School improvement Positive environments, fostering leadership and teaching.............................................................................................. 10
Evaluation and assessment to improve student outcomes Practices vary widely across the country........................................................................................................................ 12
Governance States and territories, key policy actors in national education agenda ........................................................................... 13
Funding Clarifying sources of school funding a key goal ............................................................................................................. 16
Annex A: Structure of Australia’s education system ....................................................................................................... 18
Annex B: Statistics ......................................................................................................................................................... 19
References and further reading ...................................................................................................................................... 23
Figures
Figure 1. Student performance in reading and impact of economic, social and cultural status .................................... 5 Figure 2. Upper secondary and tertiary attainment ...................................................................................................... 5 Figure 3. Reading performance and percentage of low and top performers ................................................................ 7 Figure 4. Students in education and not in education, by educational attainment and work status .............................. 9 Figure 5. School principals' and students' views on learning environment ................................................................. 11 Figure 6. Student assessment by purpose ................................................................................................................. 13 Figure 7. Decisions in public lower secondary schools, by level of government ........................................................ 15 Figure 8. Expenditure on educational institutions as a percentage of GDP ................................................................ 17
Spotlights
Spotlight 1. Working for equity through early education ............................................................................................... 7 Spotlight 2. Responding to skills challenges ................................................................................................................ 9 Spotlight 3. Assessing and reporting on education progress ...................................................................................... 13 Spotlight 4. Responding to the challenges of providing appropriate resources to all schools .................................... 17

EDUCATION POLICY OUTLOOK: AUSTRALIA © OECD 2013 4
HIGHLIGHTS
Australia’s educational context
Students: One of the highest PISA performers among OECD countries, Australia has fair and inclusive
practices that strive for equity, quality and high completion rates for upper secondary and tertiary education. Australia has fewer underperforming students than the OECD average, a high proportion of children enrolled in early childhood education, and comprehensive school until age 16. However, overall PISA reading performance has not improved since 2000, and rural and indigenous populations have lower academic performance and less access to tertiary education than the national average. Effective secondary and tertiary pathways in Australia aim to have students well prepared for social and labour market integration.
Institutions: Australia’s schools have positive learning environments, strong pedagogical leadership and well-prepared teachers, all supported with an effective evaluation and assessment framework. Students' instruction times and teachers' teaching time are among the highest across OECD countries. The evaluation and assessment framework is well conceived and can help generate improvements in the classroom with clearer information for schools on areas to improve.
Governance and funding: Australia works in a decentralised environment, and the education system is steered nationally through agreements with states and territories, focused on education priorities and funding. School funding lacks transparency and coherence, and outcomes of numerous studies have shown that it is difficult to determine how individual schools are funded.
Key policy issues
Australia’s high education performance can be complemented with further focus on reducing inequities by tackling system-level policies which hinder equity in education, including school choice, support or funding. Continued support for professional development of teachers and school leaders can be combined with clearer evaluation and assessment information on how schools can improve. Strengthening the incentives for attaining skills demanded by the labour market is also important. A particular issue within a decentralised environment is the need for clarity in policy and in funding.
Recent policy responses
To strengthen performance and support disadvantaged and indigenous populations, Australia has made key investments in early childhood education and care, with a National Early Childhood Development Strategy (2009), has developed a number of strategies for Aboriginals peoples and Torres Islanders, and has focused on skills development, defining completion objectives for vocational education and training and ways to strengthen apprenticeships.
Various efforts are being made to raise the quality of teachers and school leadership by creating a specialised institution (the Australian Institute for Teaching and School Leadership), setting standards, and developing an accountability system which includes a new website with key information on performance (MySchool) (2010).
Given the lack of clarity in funding, the Australian Government commissioned a Review of Funding for Schooling (Final Report, December, 2011), which examined current challenges and proposed recommendations for a new funding approach. In response, the Australian Government has introduced into Parliament the Australian Education Bill 2012 which aims to shift towards needs-based education funding.

EDUCATION POLICY OUTLOOK: AUSTRALIA © OECD 2013 5
Australia achieves higher-than-average scores in PISA, and the impact of socio-economic status on attainment is lower than the OECD average, although its PISA results have not improved since 2000 (Figure 1).
Figure 1. Student performance in reading and relationship between student performance and the economic, social and cultural status (ESCS), for 15-year-olds, PISA 2009
Source: OECD (2010), PISA 2009 Results: What Students Know and Can Do: Student Performance in Reading, Mathematics and Science (Volume I), OECD Publishing, Paris, http://dx.doi.org/10.1787/9789264091450-en
Secondary and tertiary education attainment in Australia is higher than the OECD average: 84% of 25-34 year-olds have attained secondary education (compared to the OECD average of 82%) and 45% have attained tertiary education (compared to the OECD average of 39%) (Figure 2).
Figure 2. Upper secondary and tertiary attainment for 25-34 year-olds, 2011
Source: OECD (2013), Education at a Glance 2013: OECD Indicators, OECD Publishing, Paris, http://dx.doi.org/10.1787/eag-2013-en.
400
450
500
550
600
Mean readingperformance
Sco
re p
oin
ts
Overall strength of therelationship betweenstudent performance
and the ESCS
0
5
10
15
20
% o
f va
ria
tio
n e
xp
lain
ed
by t
he
ES
CS
Australia
OECD average
0
20
40
60
80
100
Upper secondary Tertiary education
% o
f a
tta
inm
en
t (
po
pu
latio
n)
Australia
OECD average

EDUCATION POLICY OUTLOOK: AUSTRALIA © OECD 2013 6
EQUITY AND QUALITY:
POLICIES TARGET DIVERSE SUBGROUPS OF STUDENT POPULATION
Australia has positive indicators in equity. Among countries that are high performers in PISA 2009,
Australia has a smaller-than-average proportion of students below proficiency Level 2, although these results have not improved since 2000, either in relation to other countries or to Australia’s own performance in previous assessments. The impact of socio-economic background on performance at age 15 is similar to the OECD average (see Figure 3). Boys scored 37 points less than girls in reading (compared to the OECD average of 39 points), but significantly outperformed girls in mathematics.
Fair and inclusive policies contribute to an equitable education system. Australia has comprehensive
school until age 16. About 81% of children are enrolled in early childhood education in the year before school (Australian Bureau of Statistics, 2012), and government subsidies are available (as fee reimbursements). Australia is one of several high-performing OECD countries, including the Nordic countries and Canada, that does not have student tracking until the age of 16. It also limits its use of vertical and horizontal differentiation within schools. In addition, Australia’s grade repetition rate is 8.4%, below the OECD average of 13%.
Australia has a high degree of school choice which, if not well targeted, can contribute to segregation of
students. Around 96% of students attend a school that competes for enrolments with at least one other school. Evidence shows that school choice, along with other factors, may undermine equity in the education system by segregating students into schools based on their socio-economic background. It is important to ensure that there are mechanisms to mitigate this negative effect.
Rural and Indigenous students, including Aboriginal and Torres Strait Islanders, have lower performance
and completion rates across Australia. Students in rural schools perform 56 score points lower than students in Australian cities or large city schools. The Indigenous population, which represents up to 2.5% of the population, has a strong start in education: 95% of 4-14 year-olds participate in education, although they face low attainment rates, with 20% of Indigenous people 15 and over completing Year 12 or equivalent. Raising their performance and attainment can contribute to raising overall equity and quality of education.
The challenge: Continuing to reduce inequities between students from different socio-economic and ethnic backgrounds by tackling system-level policies which hinder equity in education.
Recent policies and practices
Investing in the Early Years – A National Early Childhood Development Strategy (2009) was developed to give all children “the best start in life” (see Spotlight 1).
The Smarter Schools National Partnership for Low Socio-economic Status School Communities (2008-09 to 2014-15) is a comprehensive strategy that focuses on the learning and well-being of disadvantaged students to support their transitions to further education, work and community participation. This programme will distribute about AUD 1.5 billion to over 1 700 schools in socio-economically disadvantaged communities, with additional funding provided by the states and territories.
The Aboriginal and Torres Strait Islander Education Action Plan (2010-14) aims to close the gap between
Aboriginals and Torres Strait Islanders and their peers. It identifies outcomes, targets and performance indicators and national, systemic and local actions in six priority domains that evidence shows will contribute to improved educational outcomes.

EDUCATION POLICY OUTLOOK: AUSTRALIA © OECD 2013 7
Figure 3. Mean score in reading performance and percentage of low and top performers, for 15-year-olds, PISA 2009
Source: OECD (2010), PISA 2009 Results: What Students Know and Can Do: Student Performance in Reading, Mathematics and Science (Volume I), OECD Publishing, Paris, http://dx.doi.org/10.1787/9789264091450-en.
Spotlight 1. Working for equity through early education
To support greater equity by giving students an early start in education, Australia has defined and implemented the National Early Childhood Development Strategy (2009) to aid all levels of government to build a more effective and better coordinated national early childhood development system, support the diverse needs of Australian children and their families, and improve their health, safety, early learning and well-being. The initiative covers children from before birth to 8 years, particularly those who are socio-economically disadvantaged.
The strategy sets out six priority areas to be developed as resources allow, recognising the different starting points of states and territories:
strengthen universal maternal, child and family health services
provide support for vulnerable children
engage parents and the community in understanding the importance of early childhood development
improve early childhood infrastructure
strengthen the workforce across early childhood development and family support services
build better information and a solid evidence base.
The strategy includes the following initiatives:
The National Partnership on Early Childhood Education aims to ensure universal access to quality early childhood education, delivered by university-trained early childhood teachers, for 15 hours a week, 40 weeks a year.
The National Quality Framework for Early Childhood Education and Care (NQF) (2009) aims to raise quality and consistency in education and care services. The NQF now applies to long-day care, family day care, care outside of school hours, and preschools/kindergartens.
The National Partnership Agreement for Indigenous Early Childhood Development targets early learning, support for Indigenous families, and improved health for mothers and their children. As part of the agreement, a network of 38 Children and Family Centres is being established, offering integrated early childhood and parenting services. The first centre opened in 2011, and all centres are on track to be established by 2014.
0
5
10
15
20
400
450
500
550
600
Australia OECD average
To
p p
erf
orm
ers
an
d lo
w-
pe
rfo
rmin
g s
tud
en
ts (
%)
Sco
re p
oin
ts Mean reading performance
Low-performing students(below Level 2)
Top performers(level 5 or above)

EDUCATION POLICY OUTLOOK: AUSTRALIA © OECD 2013 8
PREPARING STUDENTS FOR THE FUTURE: FLUID TRANSITIONS TO FURTHER EDUCATION OR LABOUR MARKET
Labour market perspectives can play an important role in the decision to stay in education. In Australia,
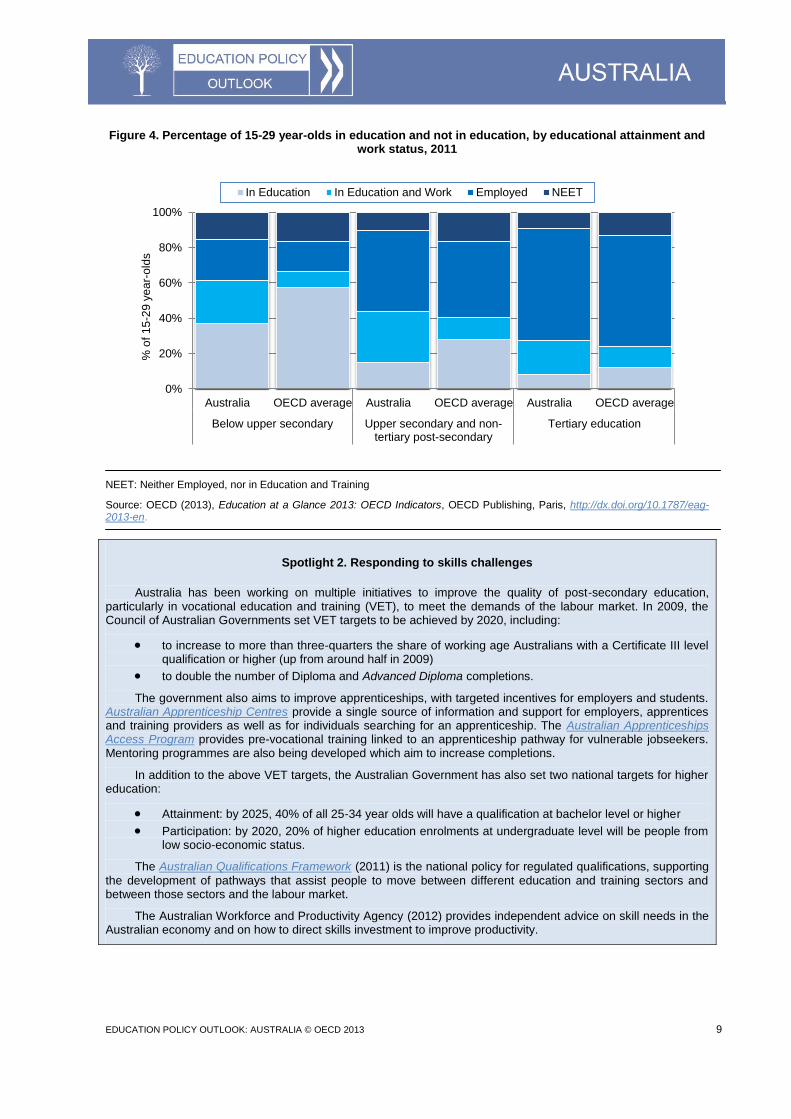
unemployment rates are lower than the OECD average. The share of 15-29 year-olds not in education and not employed (11.5%) is below the OECD average (see Figure 4), but there is scope to increase the capacity and responsiveness of skills developed in vocational education and training.
Upper secondary education is not compulsory in Australia, and examinations vary across the states and
territories. A challenge shared by countries at this level is to provide relevant education that will prepare young adults for work and, at the same time, provide capacity for further learning. In Australia, 84% of 25-34 year-olds attained upper secondary level education (above the OECD average of 82%, see Figure 2). In most cases, Australian general and vocational programmes are offered in upper secondary schools. Successful completers are awarded a Senior Certificate of Education, giving access to both general and vocational programmes.
Vocational education and training (VET) in Australia is provided at the general secondary and tertiary
education levels, and employers are well-engaged in the system. VET can facilitate entry into the labour market through work-study programmes, Technical and Further Education institutes and private Registered Training Organisations. VET in schools enables upper secondary students to study units toward a recognised VET qualification while completing a Senior Certificate. There is a well established flexible qualification system that provides autonomy and innovation, underpinned with data and research. Current reforms have aimed to shape a more demand-driven VET system (see Spotlight 2), introducing more flexibility in the length of apprenticeships and ensuring support through a common procedure for assessing them.
In tertiary education, Australia's attainment is higher than the OECD average (see Figure 2). It has the
sixth highest graduation rate among OECD countries in academic programmes (tertiary-type A), and the eighth highest graduation rate in vocationally oriented programmes (tertiary-type B). About 19.8% of all tertiary students are foreign, the highest rate of foreign tertiary students among OECD countries in 2011. The participation of Aboriginal and Torres Strait Islander people in higher education is below that of the Australian population as a whole. A recent Review of Higher Education Access (2012) highlights the need for co-operation between different stakeholders and outlines a roadmap to help increase the access of Aboriginal and Torres Strait Islander students to university education. As in other OECD countries, the expansion of tertiary education implies providing a sufficiently wide offer of studies to address the skills needs of the labour market as well as the interests of the student population.
The challenge: Enhancing skills to meet the demands of the rapidly changing economy.
Recent policies and practices
The National Partnership on Youth Attainment and Transitions (2009) aims to retain youth in education, and
to improve their transition to further education, training or employment to align to the Council of Australian Governments' goal of a 90% upper secondary (Year 12 equivalent) attainment rate by 2015. It clarifies actors' responsibilities to achieve targets and provides funding to programmes related to student engagement, attainment and transition.
Australia has been active on the skills agenda (see Spotlight 2). The National Partnership Agreement on Skills Reform (2008, renewed in 2012) details national reforms, including a new entitlement to a subsidised training place for up to the first Certificate III qualification and income-contingent loans for Diploma and Advanced Diploma qualifications. The National Agreement for Skills and Workforce Development commits Commonwealth
1
and state and territory governments to addressing access and social inclusion issues through collaborative action in skills. The National Foundation Skills Strategy for Adults (2012) aims to help working age Australians increase their English language, literacy and numeracy skills for improved economic and social participation.
The Advancing Quality in Higher Education plan (2012-14) introduces various performance measurement initiatives to improve teaching and learning in higher education. The Higher Education Participation and Partnerships Program provides additional funding to help universities attract, support, and retain students from disadvantaged backgrounds. These students may receive financial support through income support grants for eligible students and income contingent loans available to all students.
EDUCATION POLICY OUTLOOK: AUSTRALIA © OECD 2013 9
Figure 4. Percentage of 15-29 year-olds in education and not in education, by educational attainment and work status, 2011
NEET: Neither Employed, nor in Education and Training
Source: OECD (2013), Education at a Glance 2013: OECD Indicators, OECD Publishing, Paris, http://dx.doi.org/10.1787/eag-2013-en.
Spotlight 2. Responding to skills challenges
Australia has been working on multiple initiatives to improve the quality of post-secondary education, particularly in vocational education and training (VET), to meet the demands of the labour market. In 2009, the Council of Australian Governments set VET targets to be achieved by 2020, including:
to increase to more than three-quarters the share of working age Australians with a Certificate III level qualification or higher (up from around half in 2009)
to double the number of Diploma and Advanced Diploma completions.
The government also aims to improve apprenticeships, with targeted incentives for employers and students. Australian Apprenticeship Centres provide a single source of information and support for employers, apprentices and training providers as well as for individuals searching for an apprenticeship. The Australian Apprenticeships Access Program provides pre-vocational training linked to an apprenticeship pathway for vulnerable jobseekers. Mentoring programmes are also being developed which aim to increase completions.
In addition to the above VET targets, the Australian Government has also set two national targets for higher education:
Attainment: by 2025, 40% of all 25-34 year olds will have a qualification at bachelor level or higher
Participation: by 2020, 20% of higher education enrolments at undergraduate level will be people from low socio-economic status.
The Australian Qualifications Framework (2011) is the national policy for regulated qualifications, supporting
the development of pathways that assist people to move between different education and training sectors and between those sectors and the labour market.
The Australian Workforce and Productivity Agency (2012) provides independent advice on skill needs in the Australian economy and on how to direct skills investment to improve productivity.
0%
20%
40%
60%
80%
100%
Australia OECD average Australia OECD average Australia OECD average
Below upper secondary Upper secondary and non-tertiary post-secondary
Tertiary education
% o
f 1
5-2
9 y
ea
r-o
lds
In Education In Education and Work Employed NEET

EDUCATION POLICY OUTLOOK: AUSTRALIA © OECD 2013 10
SCHOOL IMPROVEMENT:
POSITIVE ENVIRONMENTS, FOSTERING LEADERSHIP AND TEACHING
The key to raising achievement in Australia’s 9 435 schools is developing the conditions for school leaders and teachers to succeed. Overall, Australia’s learning environments are similar to those in other OECD
countries. Students report good relations with their teachers and indicate that their teachers motivate them to read (see Figure 5). The number of hours students are taught per year in primary, lower and upper secondary schools is among the highest in OECD countries.
Australia is making efforts to raise the profile of school leaders. According to PISA 2009, Australian school
principals perform tasks related to pedagogical leadership: about 64% reported that they observe instruction in classrooms (higher than the OECD average of 50%) and 93% said they use student results to develop the school’s educational goals (higher than the OECD average of 75%). At the same time, Australian teachers reported receiving less feedback from principals than the average in OECD's 2008 Teaching and Learning International Survey (TALIS). Preparatory training for school leaders is optional and varies across states and territories. Ensuring quality provision is key for effective school leadership. In 2007, a majority of principals reported that they did not feel well-prepared for their first leadership post, and only 36% of primary school deputy principals and 24% of secondary deputy principals wished to apply for a principal post. However, this may have changed in recent years.
Teachers are well-prepared, but more professional development could help them improve the disciplinary
climate in the classroom. Teachers have university degrees, and the ratio of teachers’ salaries to the earnings of tertiary-educated workers is above the 2011 OECD average. Teachers have a heavy teaching workload, with more teaching time than in other OECD countries (873 hours per academic year in primary school compared to the OECD average of 790 hours). Most teachers (97%) reported in TALIS that they participate in professional development activities, although the average number of days (9) was about half of that reported by teachers in countries participating in TALIS (15). About 44% reported having a high need for professional development (below the TALIS average of 53%). Australia was the only country in the TALIS survey where the number of days that teachers spent on professional development was significantly associated with improvements in the disciplinary climate in the classroom.
The challenge: Providing school leaders and teachers with adequate development opportunities.
Recent policies and practices
Australia has taken actions to strengthen the teaching and school leadership profession. The Australian Institute for Teaching and School Leadership was established in 2010 and has developed national approaches to build capacity in this area.
The Australian Professional Standards for Teachers (2010) comprises seven standards in four career
stages (graduate, proficient, highly accomplished and lead teacher) and three domains (professional knowledge, practice and engagement).
The Australian Professional Standards for Principals is based on three leadership requirements that principals draw upon within five areas of professional practice: leading teaching and learning; developing self and others; leading improvement, innovation and change; leading the management of the school; and engaging and working with the community.
The National Partnership on Improving Teacher Quality (2009-13) provides funding (AUD 550 million) to
states and territories to attract the best graduates through additional pathways into teaching, improving the quality of teacher training in partnership with universities, ensuring national consistency in the registration of teachers to support better mobility within the teaching force, enhancing their skills and knowledge through better performance management and professional learning, and retaining the best teachers through better rewards for teachers and leaders in remote areas and hard-to-staff schools.

EDUCATION POLICY OUTLOOK: AUSTRALIA © OECD 2013 11
Figure 5. The learning environment, PISA 2009
Source: OECD (2010), PISA 2009 Results: What Makes a School Successful? Resources, Policies and Practices (Volume IV), OECD Publishing, Paris, http://dx.doi.org/10.1787/9789264091559-en.
-0.3
-0.2
-0.1
0.0
0.1
0.2
0.3
0.4
0.5
Teacher-student relations(students' views)
Classrooms conducive tolearning (students' views)
School principalsinvolvement in school
matters (principals' views)
Australia Index: OECD average=0

EDUCATION POLICY OUTLOOK: AUSTRALIA © OECD 2013 12
EVALUATION AND ASSESSMENT TO IMPROVE STUDENT OUTCOMES: PRACTICES VARY WIDELY ACROSS THE COUNTRY
Australia has clear national goals and a well-conceived evaluation and assessment framework, while
there is less clear articulation on how it can generate improvements in classroom practice. The Council of Australian Governments and the Standing Council on School Education and Early Childhood help to ensure that the different levels of government work together to consolidate a national evaluation and assessment framework. At the same time, there is a great diversity of practices based on locally defined school improvement frameworks. Realising the full potential of the overall framework involves establishing strategies to strengthen the linkages to classroom practice (see Figure 6).
System evaluations use clear standard frameworks for reporting key performance measures. There is a
stable set of national measures on school education and a procedure for monitoring at the state and territory level. A priority is to strengthen information systems that provide data on students’ socio-economic and Indigenous status so their progress towards national goals can be more easily monitored (see Spotlight 3). More monitoring of private schools is also advisable.
Schools are expected to perform self-evaluations, and some form of external review mechanism is
increasingly common. Literacy and numeracy test results are widely used to inform evaluations. Some issues at the national level can be clarified, such as the relationship between accountability and improvement. Aligning self-evaluations with external evaluations, such as by using common criteria, could be beneficial, as could broadening the scope and increasing the frequency of external reviews.
Teachers are granted extensive autonomy, but there are few opportunities for professional feedback, and the quality of teacher appraisals can vary widely. Aligning teaching standards with a competency-based career
structure could be beneficial. Teachers would then be held accountable for their practices, and established career pathways could help to define how careers can progress and identify professional development needs. Teacher appraisals used to assess and improve performance should remain as they are, but evaluations conducted at schools could be improved and be validated by external inspectors.
There is a coherent system for assessing student learning against national goals. The current strategy for
school student assessment is a combination of the National Assessment Program – Literacy and Numeracy (NAPLAN) and teacher-based assessments, which implies a considerable investment in teacher capacity. The current prominence of NAPLAN within the student assessment framework requires particular care about not reducing the importance of teacher-based assessment, and the extent to which NAPLAN is balanced in its representation of the depth and breadth of intended student learning goals.
The challenge: Providing clear information on the strengths and weaknesses of schools and on best practices to help achieve objectives.
Recent policies and practices
Australia has developed a number of strategies for reporting on education progress, including the recent Myschool website (see Spotlight 3).
The Australian Early Development Index (2009) is a population-based measure of how children have developed by the time they start school. It can be used by policy makers, communities and other organisations to aid in program delivery and policy development. Information is collected every three years.
Student performance has been monitored nationally since 2008 through the National Assessment Program – Literacy and Numeracy. It currently assesses students in Years 3, 5, 7 and 9 in reading, writing, language conventions (spelling, grammar and punctuation) and numeracy.
An Australian Teacher Performance and Development Framework will be in place from 2013. It aims to improve teaching through continuous assessment, feedback and performance appraisal, and by providing professional development opportunities to all teachers. The framework is underpinned by the Australian Professional Standards for Teachers.

EDUCATION POLICY OUTLOOK: AUSTRALIA © OECD 2013 13
Figure 6. Percentage of students in schools where the principal reported assessments of students in national modal grade for 15-year-olds, PISA 2009
Source: OECD (2010), PISA 2009 Results: What Makes a School Successful? Resources, Policies and Practices (Volume IV), OECD Publishing, Paris http://dx.doi.org/10.1787/9789264091559-en.
GOVERNANCE: STATES AND TERRITORIES,
0
20
40
60
80
100
To make decisions about students’
retention or promotion
To monitor the school’s progress from year to
year
To make judgements about teachers’ effectiveness
To identify aspects ofinstruction or the
curriculum that couldbe improved
% o
f stu
de
nts
Australia OECD average
Spotlight 3. Assessing and reporting on education progress
The National Education Agreement establishes five performance indicators that allow for reporting on national progress towards achieving the agreed outcomes. Additionally, the National Agreement for Skills and Workforce Development identifies long term objectives for skills and workforce development including the outcomes, performance indicators and targets against which progress can be measured. Other national progress reports include:
the "National Report on Schooling in Australia" published annually by the Australian Curriculum, Assessment and Reporting Authority
the "Annual National Report of the Australian Vocational Education and Training System" published by the Australian Government
"Education 2011: Comparing performance across Australia", the annual "National Education Agreement Performance Report", published by the COAG Reform Council
"Skills and Workforce Development 2011: Comparing performance across Australia", also published annually by the COAG Reform Council
The "Report on Government Services", published annually by the Australian Government Productivity Commission.
These reports provide information on all public and private schools.
In addition, the Australian Government launched the My School website in 2010. The website, which will be expanded over time, provides for the first time a wide range of information on Australian schools, the context in which schools operate, their capacities, and student outcomes. Since its launch, the website has been updated annually to provide more detailed information, including 2010 data on school funding, four-year results of student performance in literacy and numeracy in the National Assessment Program – Literacy and Numeracy (and the gains made by students over a two-year period), as well as VET information (for secondary schools) on enrolment and completion by level and industry area. Updates are planned to continue on an annual basis.
The Australian Government also launched two new websites in 2012:
My Skills provides information to connect individuals and employers with training organisations that
best suit their needs. It will be progressively updated as new functionality and data become available.
My University provides students with information about higher education providers, including course information and fees, student demographics, student satisfaction and graduate destination survey results, student services and campus facilities, research student numbers and scholarships.

EDUCATION POLICY OUTLOOK: AUSTRALIA © OECD 2013 14
KEY POLICY ACTORS IN NATIONAL EDUCATION AGENDA
Australia’s six states and two territories are in charge of delivering school and vocational education. Together with the Council of Australian Governments, the Standing Council on School Education and Early Childhood and the Standing Council on Tertiary Education, Skills and Employment work to develop a shared national policy framework. Other bodies shape education policy:
The Australian Children’s Education Quality and Care Authority provides support to the implementation of the National Quality Framework for Early Childhood Education and Care.
The Australian Qualifications Framework Council is responsible for the Australian Qualifications Framework, which unifies all qualifications into one comprehensive framework.
The Australian Curriculum, Assessment and Reporting Authority develops curriculum, student-assessment policies and national data collection, and reports on school education outcomes.
The Australian Institute of Teaching and School Leadership is responsible for delivering national reforms for teachers and school leaders.
Other stakeholders include unions (e.g. Australian Education Union, Independent Education Union), industry groups (e.g. Australian Chamber of Commerce and Industry, Australian Industry Group), non-government associations (e.g. Independent Schools Council Australia), and Aboriginal and parents groups.
States and territories make most education decisions in schools and vocational education and training
(VET). Intergovernmental arrangements between national and state governments define education goals through national agreements. States make most planning, structure and resource decisions, including personnel management. Early childhood education and care services may be operated by a range of providers, such as government authorities or non-government schools, community-based organisations, or private-for-profit providers. The policy and funding responsibility for VET, shared by the Australian Government, states and territories, could benefit from a clearer administrative division for consistency.
Greater autonomy has been granted to all of Australia’s 9 435 schools (71% public and 29% private) since
2003. Schools take 49% of decisions and the states take 51%, with schools making most decisions regarding the organisation of instruction (see Figure 7).
Decision-making in higher education is shared between the Australian Government and higher education
providers. While the Australian Government has policy responsibility, Australian universities have the authority to accredit their courses and are also responsible for their academic and quality assurance standards. Most other higher education institutions are accredited by the Tertiary Education Quality and Standards Agency, which maintains the National Register of Higher Education Providers.
The challenge: Within a decentralised approach, ensuring there is alignment and reform capacity across states and territories to deliver reforms, while maintaining a national vision.
Recent policies and practices
The Melbourne Declaration on Educational Goals for Young Australians, agreed by Australian education
ministers in 2008, sets the direction of education for the next ten years. Its objectives include supporting quality teaching and school leadership, supporting education at different levels, promoting a quality national curriculum and assessment, improving outcomes for indigenous and disadvantaged youth, and improving accountability and transparency.
To set a national vision, the National Education Agreement aims to ensure that all students are engaged in schooling, to help raise student achievement, and to reduce inequities in education, especially for students from Indigenous or socio-economically disadvantaged status. It is further developed through National Partnership Agreements which define objectives, outputs and milestones related to delivery of specific strategies and policies.
In 2011, two new national regulators were established at the tertiary level: the Australian Skills Quality Authority (ASQA) for VET and the Tertiary Education Quality and Standards Agency (TEQSA) for higher education. The ASQA seeks greater national consistency and increased rigour in registering training providers, accrediting courses and monitoring the quality of the system. The TEQSA aims to ensure that students receive high-quality education at any higher education institution.

EDUCATION POLICY OUTLOOK: AUSTRALIA © OECD 2013 15
Figure 7. Percentage of decisions taken in public lower secondary schools at each level of government, 2010
Source: OECD (2012), Education at a Glance 2012: OECD Indicators, OECD Publishing, Paris, http://dx.doi.org/10.1787/eag-2012-en.
0
20
40
60
80
100
Australia OECD average
% o
f d
ecis
ion
s ta
ke
n
School
Local
Regional or Sub-regional
Central or State

EDUCATION POLICY OUTLOOK: AUSTRALIA © OECD 2013 16
FUNDING: CLARIFYING SOURCES OF SCHOOL FUNDING A KEY GOAL
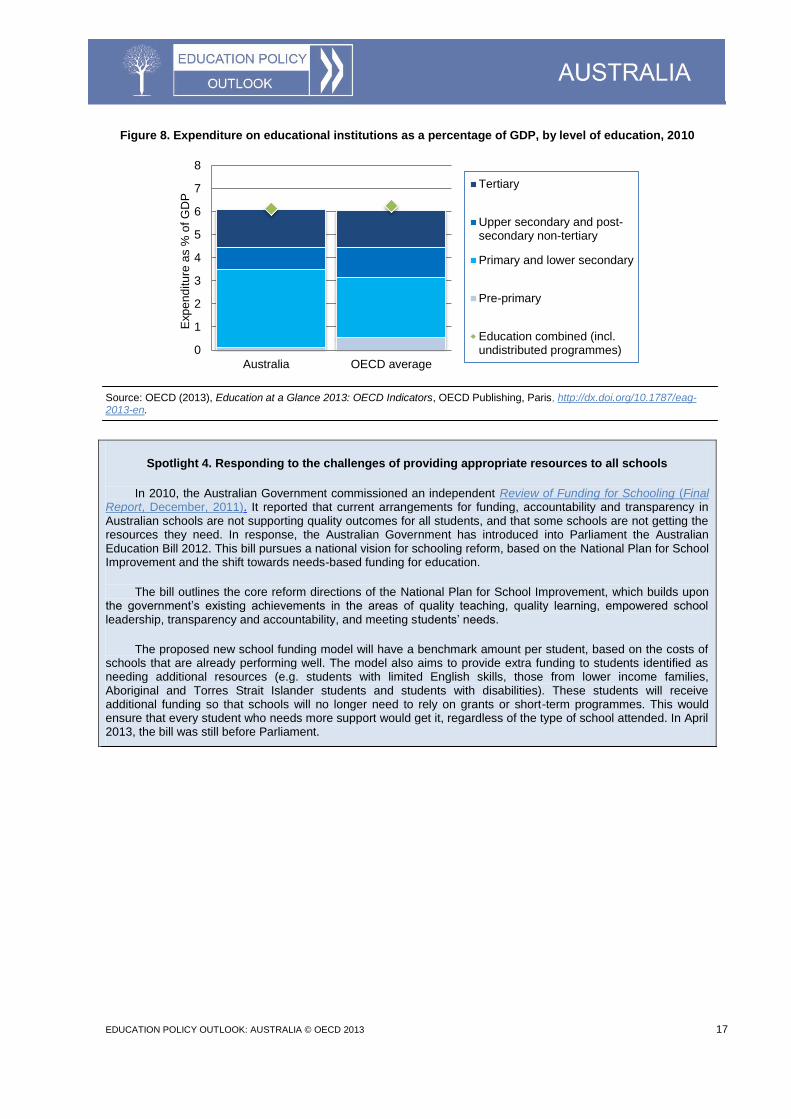
Australia's investment in education institutions is similar to the OECD average. Expenditure on education
institutions at all levels is 6.1% of GDP (slightly below the OECD average of 6.3%) (see Figure 8). Between 2005 and 2010, Australia has increased spending by 0.8 percentage points (above the OECD average of 0.4 percentage points). As in most OECD countries, a large portion of the expenditure on educational institutions is from public sources (74.1% in Australia, compared to the 2010 OECD average of 83.6%). The share of private expenditure
2 is 25.9% (above the OECD average of 16.4%). Most of the private funds are from household
expenditure.
Australia allocates similar amounts of annual expenditure per student across the different levels of
education. The annual expenditure per student from primary to tertiary education of USD 10 825 is above the 2010 OECD average of USD 9 313. But this indicator does not take into account public subsidies, which are high in Australia.
Funding for schools varies depending on whether the school is public or private. Government (public)
schools are resourced by state and territory governments (91.4% their own expenditure and 9% provided by the Australian Government via the National Schools Specific Purpose Payments, associated with the National Education Agreement). Around 66% of Australian students attend government schools and are entitled to free education, but families may have to pay for school supplies. Non-government (private) schools receive public funding from the Australian Government (72% of public expenditure and 28% provided by states and territories). About 33% of students attend non-government schools and pay tuition ranging from free to AUD 15 000 per year.
The Australian Government has primary responsibility for public funding of higher education institutions.
This funding is largely provided through the Commonwealth Grant Scheme. Students pay tuition fees directly or through income-contingent loans. Of public and private expenditure for tertiary education, 53.5% comes from private sources (compared to the 2010 OECD average of 31.6%), and 39.0% is exclusively from household expenditures. The government provides additional financial support for students with disadvantaged backgrounds. Funding for vocational education and training institutions varies across states and territories. The Australian Government funds VET through the National Agreement for Skills and Workforce Development and the National Partnership Agreement on Skills Reform, as well as directly co-funding employers for some training. Funding is more complex, in part due to the multiple types of VET institutions, and more transparent funding criteria are required for both institutions and student fees.
Funding for schools lacks transparency and coherence. Numerous studies show that it is difficult to
determine how individual schools are funded. This lack of transparency prompts concerns about efficiency and equity in education, particularly given the prevalence of private schools compared with other OECD countries. Evidence, including a study commissioned by the government (see Spotlight 4), indicates that government schools, most affected by inequitable funding, become less attractive to students from upper socio-economic status who move to private schools. With restricted resources, government schools then have a growing share of students needing the most support.
The challenge: Achieving consistency and transparency in funding.
Recent policies and practices
A recent review of school funding highlighted the need for more transparency, coherence and efficiency in the system. Actions are underway to improve the situation (see Spotlight 4). Other initiatives address this issue:
The Intergovernmental Agreement on Federal Financial Relations (2009) aims to improve the quality and effectiveness of government services by setting clearer responsibilities for each level of government, reducing Commonwealth prescriptions on service delivery to states and allowing for greater flexibility.
The Smarter Schools National Partnerships (2008) are part of a funding approach that engages all school
systems (including the non-government sector) in partnerships to improve educational outcomes for all students, particularly disadvantaged students. The partnerships focus on raising literacy and numeracy outcomes (until 2012), improving teacher quality (until 2012), and addressing educational disadvantage associated with socio-economically disadvantaged school communities (until 2015). Over 2 500 Australian schools in both government and non-government sectors participate in these national partnerships.
EDUCATION POLICY OUTLOOK: AUSTRALIA © OECD 2013 17
Figure 8. Expenditure on educational institutions as a percentage of GDP, by level of education, 2010
Source: OECD (2013), Education at a Glance 2013: OECD Indicators, OECD Publishing, Paris, http://dx.doi.org/10.1787/eag-2013-en.
Spotlight 4. Responding to the challenges of providing appropriate resources to all schools
In 2010, the Australian Government commissioned an independent Review of Funding for Schooling (Final Report, December, 2011). It reported that current arrangements for funding, accountability and transparency in Australian schools are not supporting quality outcomes for all students, and that some schools are not getting the resources they need. In response, the Australian Government has introduced into Parliament the Australian Education Bill 2012. This bill pursues a national vision for schooling reform, based on the National Plan for School Improvement and the shift towards needs-based funding for education.
The bill outlines the core reform directions of the National Plan for School Improvement, which builds upon the government’s existing achievements in the areas of quality teaching, quality learning, empowered school leadership, transparency and accountability, and meeting students’ needs.
The proposed new school funding model will have a benchmark amount per student, based on the costs of schools that are already performing well. The model also aims to provide extra funding to students identified as needing additional resources (e.g. students with limited English skills, those from lower income families, Aboriginal and Torres Strait Islander students and students with disabilities). These students will receive additional funding so that schools will no longer need to rely on grants or short-term programmes. This would ensure that every student who needs more support would get it, regardless of the type of school attended. In April 2013, the bill was still before Parliament.
0
1
2
3
4
5
6
7
8
Australia OECD average
Exp
en
ditu
re a
s %
of G
DP
Tertiary
Upper secondary and post-secondary non-tertiary
Primary and lower secondary
Pre-primary
Education combined (incl.undistributed programmes)

EDUCATION POLICY OUTLOOK: AUSTRALIA © OECD 2013 18
ANNEX A: STRUCTURE OF AUSTRALIA’S EDUCATION SYSTEM

EDUCATION POLICY OUTLOOK: AUSTRALIA © OECD 2013 19
ANNEX B: STATISTICS
# List of key Indicators AustraliaAverage
or totalMin Max
1Public expenditure on education as a percentage
of GDP, 2010 (EAG 2013)5.2 % 5.8 % 3.8 % 8.8 %
2GDP per capita, 2010, in equivalent USD converted using
PPPs (EAG2013) 40 801 15 195 84 672
3 GDP growth 2011 (OECD National Accounts) 2.3 % 1.8 % -7.1 % 8.5 %
4 Population density, Inhab/km2, 2010 (OECD Statistics) 2.9 138 2.9 492
5 Young people, aged less than 15, 2010 (OECD Statistics) 18.9 % 17.3 % 13 % 28.1 %
6 Foreign-born population, 2009 (OECD Statistics) 26.5 % 14.1 % 0.8 % 36.9 %
7 Mean reading performance (PISA 2009) 515 493 425 539
8 Change in Mean reading performance, 2000-09 (PISA 2009) -13 1 -31 40
9Change in Mean mathematics performance, 2003-09 (PISA
2009)-10 0 -24 33
10 Change in Mean science performance, 2006-09 (PISA 2009) 0 3 -12 30
11Enrolment rates in early childhood education and primary
education, ages 3 and 4, 2011 (EAG 2013)40 % 74.4 % 11.6 % 98 %
12Population that has attained below upper secondary
education, 25-64 year-olds, 2011 (EAG 2013)26 % 25 % 7 % 68 %
13Population that has attained at least upper secondary
education, 25-34 year-olds, 2011 (EAG 2013)84 % 82 % 43 % 98 %
14Population that has attained tertiary education, 25-34 year-olds
(EAG 2013)45 % 39 % 19 % 64 %
15
Population whose highest level of education is vocational
upper secondary or post-secondary non-tertiary, 2011 (EAG
2013)
19.3 % 33.5 % 8.4 % 73.9 %
Below upper secondary 5.9 % 12.6 % 2.7 % 39.3 %
Upper secondary and post-secondary non-tertiary 3.8 % 7.3 % 2.2 % 19.2 %
Tertiary education 2.8 % 4.8 % 1.5 % 12.8 %
17 First age of selection in the education system (PISA 2009) 16 14 10 16
Students below Level 2 14.2 % 18.8 % 5.8 % 40.1 %
Students at level 5 or above 12.8 % 7.6 % 0.4 % 15.7 %
Between schools 2 692 3 616 665 6 695
Within schools 7 631 5 591 2 795 8 290
20
Students reporting that they have repeated at least a grade in
primary, lower secondary or upper secondary schools (PISA
2009)
8.4 % 13 % 0 % 36.9 %
Proficiency levels on the reading scale (PISA 2009)
18
19
Background information
Political context
Economy
Society
Students: Raising outcomes
Education outcomes
Unemployment rates, 25-64 year-olds, 2011 (EAG 2013)
16
Between- and within-school variance in reading performance (PISA 2009)
Policy lever 1: Equity and quality

EDUCATION POLICY OUTLOOK: AUSTRALIA © OECD 2013 20
# List of key Indicators Australia
average
or totalMin Max
21Variance in student performance explained by student socio-
economic status (PISA 2009)13 % 14 % 6 % 26 %
22
Difference in reading performance between native students
and students with an immigrant background, after accounting
for socio-economic status (PISA 2009)
-11.0 27 -17.0 85.0
23Gender differences in student performance on the reading
scale (PISA 2009)-37 -39 -55 -22
General programmes 71 % 50 % 18 % 82 %
Pre-vocational/ vocational programmes 51 % 47 % 4 % 99 %
25Change in upper secondary graduation rates (average annual
growth rate 1995-2011), (EAG 2013)m 0.6 % -1 % 3.6 %
Tertiary-type 5A 50 % 40 % 21 % 60 %
Tertiary-type 5B 17 % 11 % 0 % 29 %
Tertiary-type 5A (average annual growth rate 1995-2011) 3 % 4 % -1 % 11 %
Tertiary-type 5B (average annual growth rate 1995-2011) -0.4 % 0 % -20 % 14 %
27Youth population not in education, employment or training 15-
29 year olds, 2011 (EAG 2013)11.5 % 15.8 % 6.9 % 34.6 %
28Index of teacher-student relations based on students’ reports
(PISA 2009)0.11 0 -0.42 0.44
29Index of disciplinary climate based on students' reports (PISA
2009)-0.07 0 -0.40 0.75
Primary education m 41 % 15 % 60 %
Lower secondary education m 39 % 11 % 56 %
Upper secondary education m 34 % 7 % 47 %
Primary education 873 790 589 1 120
Lower secondary education 811 % 709 415 1 120
Upper secondary education 802 664 369 1 120
Primary education 0.92 % 0.82 0.44 1.34
Lower secondary education 0.91 % 0.85 0.44 1.34
Upper secondary education 0.91 % 0.89 0.44 1.40
33Change in teachers’ salaries between 2000 and 2011 in lower
secondary education (2000 = 100), (EAG 2013)3.04 % 16 % -9 % 103 %
34Impact of teacher appraisal and feedback upon teaching, 2007-
08 (TALIS 2008)19.4 % 33.9 % 10.9 % 69.1 %
35Teachers who wanted to participate in more development than
they did in the previous 18 months, 2007-08 (TALIS 2008)55.2 % 55 % 31 % 85 %
36School principals’ views of their involvement in school matters,
Mean Index, (PISA 2009)0.42 -0.02 -1.29 1.03
Upper secondary graduation rates, 2011 (EAG 2013)
24
Graduation rates, first-time graduates, 2011 (EAG 2013)
Ratio of teachers’ salaries to earnings for full-time, full-year adult workers with tertiary education,
2011 (EAG 2013)
32
30
31
Number of teaching hours per year in public institutions, 2011 (EAG 2013)
Policy lever 2: Preparing students for the future
26
Institutions: Improving schools
Policy lever 3: School improvement
Teachers younger than 40 years-old, 2011 (EAG 2013)

EDUCATION POLICY OUTLOOK: AUSTRALIA © OECD 2013 21
# List of key Indicators Australiaaverage
or totalMin Max
To make decisions about students’ retention or promotion 67.9 % 78 % 1 % 100 %
To monitor the school’s progress from year to year 82.9 % 77 % 35 % 98 %
To make judgements about teachers’ effectiveness 44.3 % 47 % 8 % 85 %
To identify aspects of instruction or the curriculum that could
be improved86.1 % 77 % 47 % 98 %
Once every two years or less 50.1 % 35.8 % 13.8 % 65.6 %
At least once per year 41.4 % 52.2 % 27.6 % 68.6 %
Monthly or more than once per month 8.5 % 12 % 3.3 % 29.8 %
Central or state government 51 % 36 % 0 % 87 %
Regional or sub-regional government m 6 % 0 % 36 %
Local government m 17 % 4 % 100 %
School government 49 % 41 % 5 % 86 %
Pre-primary education 8 899 6 762 2 280 20 958
Primary education 9 463 7 974 1 860 21 240
Secondary education 10 350 9 014 2 470 17 633
Tertiary education 15 142 13 528 6 501 25 576
Public sources 74.1 % 83.6 % 57.9 % 97.6 %
All private sources 25.9 % 16.4 % 2.4 % 42.1 %
Public sources, index of change in expenditure on educational
institutions (2000-2010) 159 136 101 195
All private sources, index of change in expenditure on
educational institutions (2000-2010) 159 211 104 790
Note: The average, minimums and maximums refer to OECD countries except in TALIS where they refer to
participating countries. "m" refers to data not available.
PISA values that are statistically significant are indicated in bold.
Policy lever 6: Funding
38
Decisions taken at each level of government in public lower secondary education, 2011 (EAG 2012)
39
Assessment purposes (PISA 2009)
37
Frequency and source of teacher appraisal and feedback, 2007-08 (TALIS 2008)
41
Annual expenditure per student by educational Institutions, for all services, in equivalent USD
converted using PPPs for GDP, 2010 (EAG 2013)
40
Relative proportions of public and private expenditure on educational institutions, 2010 (EAG 2013)
Policy lever 4: Evaluation and assessment to improve student outcomes
Systems: Organising the system
Policy lever 5: Governance
EDUCATION POLICY OUTLOOK: AUSTRALIA © OECD 2013 22
NOTES
1. The term “Commonwealth” refers to the Commonwealth of Australia.
2. Private expenditure refers to household expenditure, and expenditure of other private sources, such as private businesses and non-profit organisations, as well as expenditure by private companies on work-based element of school-and work-based training of apprentices and students.

EDUCATION POLICY OUTLOOK: AUSTRALIA © OECD 2013 23
REFERENCES AND FURTHER READING
Australian Bureau of Statistics (ABS), www.ausstats.abs.gov.au.
ABS (2008), National Aboriginal and Torres Strait Islander Social Survey (NATSISS), Education, ABS, Canberra, Australia. http://www.abs.gov.au/ausstats/[email protected]/Latestproducts/4714.0Main%20Features82008?opendocument&tabname=Summary&prodno=4714.0&issue=2008&num=&view.
Australian Curriculum, Assessment and Reporting Authority (ACARA), www.acara.edu.au.
Australian Institute for Teaching and School Leadership (AITSL), www.aitsl.edu.au.
Australian Qualifications Framework (AQF), www.aqf.edu.au.
Australian Skills Quality Authority (ASQA), www.asqa.gov.au.
Australian Workforce and Productivity Agency, www.awpa.gov.au.
Council of Australian Governments (COAG), www.coag.gov.au.
COAG Standing Council on Tertiary Education, Skills and Employment, www.scotese.natese.gov.au.
Bernie, B.A. (2008), “The Premiers' Conferences: An Historical Sketch From the Beginnings to 1930”, Australian Journal of Public Administration, Vol. 6, Issue 8, pp. 410-417.
Department of Education, Employment and Workplace Relations, www.deewr.gov.au.
Department of Industry, Innovation, Climate Change, Science, Research and Tertiary Education, www.innovation.gov.au.
Dinham, S. (2011), “Pilot study to test the exposure draft of the National Professional Standard for Principals: Final report”, commissioned by the Australian Institute for Teaching and School Leadership (AITSL), July 2011, http://www.aitsl.edu.au/verve/_resources/PilotStudy_NPSPrincipals.pdf (accessed 21 March 2012).
Dowling, A. (2007), “Australia’s School Funding System”, Policy Analysis and Program Evaluation Unit, ACER, December 2007, http://www.acer.edu.au/documents/PolicyBriefs_Dowling07.pdf.
Gonski, D. et al. (2011), "Review of Funding for Schooling: Final Report", Australian Government, December 2011, http://www.deewr.gov.au/Schooling/ReviewofFunding/Documents/Review-of-Funding-for-Schooling-Final-Report-Dec-2011.pdf.
McKenzie, P. et al. (2011), “Staff in Australia’s Schools 2010: Main Report on the Survey”, ACER, November 2011, http://www.deewr.gov.au/Schooling/Documents/SiASMainReport.pdf (accessed 21 March 2012).
Ministerial Council for Education, Early Childhood Development and Youth Affairs, www.mceecdya.edu.au
My School website, www.myschool.edu.au.
My Skills website, www.myskills.gov.au.
MyUniversity website, www.myuniversity.gov.au.
OECD Directorate for Education and Skills, www.oecd.org/edu.
OECD Directorate for Education and Skills, Thematic Review of Tertiary Education, http://www.oecd.org/edu/highereducationandadultlearning/thematicreviewoftertiaryeducation.htm.
OECD (2008), Learning for Jobs: OECD Reviews of Vocational Education and Training: Australia, OECD Publishing, Paris, www.oecd.org/education/highereducationandadultlearning/41631383.pdf.

EDUCATION POLICY OUTLOOK: AUSTRALIA © OECD 2013 24
OECD (2009), Creating Effective Teaching and Learning Environments: First Results from TALIS, OECD Publishing, Paris, www.sourceoecd.org/education/9789264056053.
OECD (2010), PISA 2009 Results: What Students Know and Can Do: Student Performance in Reading, Mathematics and Science (Volume I), OECD Publishing, Paris, http://dx.doi.org/10.1787/9789264091450-en.
OECD (2010), PISA 2009 Results: Overcoming Social Background: Equity in Learning Opportunities and Outcomes (Volume II), OECD Publishing, Paris, http://dx.doi.org/10.1787/9789264091504-en.
OECD (2010), PISA 2009 Results: Learning to Learn: Student Engagement, Strategies and Practices (Volume III), OECD Publishing, Paris, http://dx.doi.org/10.1787/9789264083943-en.
OECD (2010), PISA 2009 Results: What Makes a School Successful? Resources, Policies and Practices (Volume IV),
OECD Publishing, Paris, http://dx.doi.org/10.1787/9789264091559-en.
OECD (2010), PISA 2009 Results: Learning Trends: Changes in Student Performance Since 2000 (Volume V), OECD Publishing, Paris, http://dx.doi.org/10.1787/9789264091580-en.
OECD Economic Surveys - Country Index, www.oecd.org/eco/surveys
OECD (2010), Learning for Jobs, OECD Publishing, Paris, http://dx.doi.org/10.1787/9789264087460-en.
OECD (2011), Economic Policy Reforms: Going for Growth 2011: Country Notes, http://dx.doi.org/10.1787/growth-2011-en.
OECD (2011), OECD Reviews of Evaluation and Assessment in Education: Australia 2011, OECD Publishing, Paris,
http://dx.doi.org/10.1787/9789264116672-en.
OECD (2011), PISA In Focus 6: When students repeat grades or are transferred out of school: What does it mean for education systems?, OECD, Paris, http://www.oecd.org/pisa/pisainfocus/48363440.pdf.
OECD (2012), Education at a Glance 2012: OECD Indicators, OECD Publishing, Paris, http://dx.doi.org/10.1787/eag-2012-en.
OECD (2012), Equity and Quality in Education: Supporting Disadvantaged Students and Schools, OECD Publishing, Paris, http://dx.doi.org/10.1787/9789264130852-en.
OECD (2012), Starting Strong III: A Quality Toolbox for Early Childhood Education and Care, OECD Publishing, Paris, http://dx.doi.org/10.1787/9789264123564-en. and http://www.oecd.org/edu/school/startingstrongiiiaqualitytoolboxforecec.htm.
OECD (2012), OECD Economic Surveys: Australia 2012, OECD Publishing, Paris, http://dx.doi.org/10.1787/eco_surveys-aus-2012-en.
OECD (2013), Education at a Glance 2013: OECD Indicators, OECD Publishing, Paris, http://dx.doi.org/10.1787/eag-2013-en.
Tertiary Education Quality and Standards Authority (TEQSA), www.teqsa.gov.au.
Zanderigo, T., E. Dowd and S. Turner (2012), Delivering School Transparency in Australia: National Reporting through My School, Strong Performers and Successful Reformers in Education, OECD Publishing, Paris, http://dx.doi.org/10.1787/9789264175884-en.