outlier detection in laser scanner point · pdf fileoutlier detection in laser scanner point...
TRANSCRIPT
OUTLIER DETECTION IN LASER SCANNER POINT CLOUDS
S. Sotoodeh Institute of Geodesy and Photogrammetry, ETHZ, Switzerland
Commission V, WG V/3
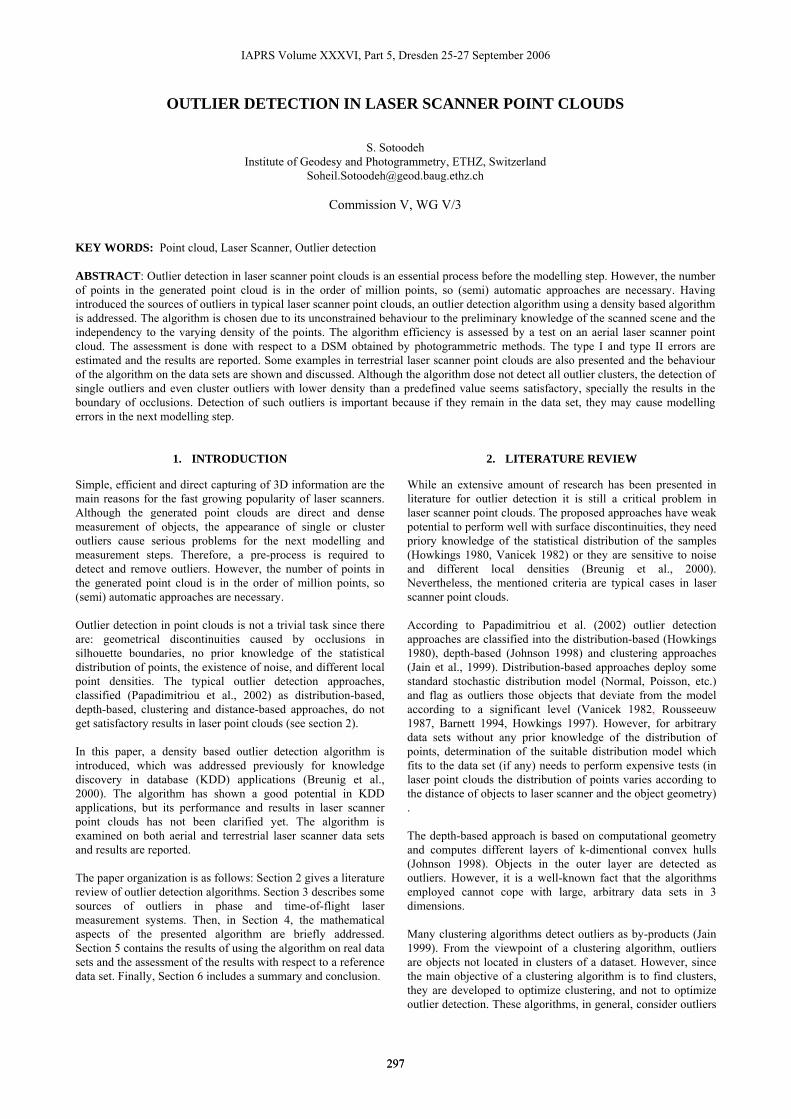
KEY WORDS: Point cloud, Laser Scanner, Outlier detection ABSTRACT: Outlier detection in laser scanner point clouds is an essential process before the modelling step. However, the number of points in the generated point cloud is in the order of million points, so (semi) automatic approaches are necessary. Having introduced the sources of outliers in typical laser scanner point clouds, an outlier detection algorithm using a density based algorithm is addressed. The algorithm is chosen due to its unconstrained behaviour to the preliminary knowledge of the scanned scene and the independency to the varying density of the points. The algorithm efficiency is assessed by a test on an aerial laser scanner point cloud. The assessment is done with respect to a DSM obtained by photogrammetric methods. The type I and type II errors are estimated and the results are reported. Some examples in terrestrial laser scanner point clouds are also presented and the behaviour of the algorithm on the data sets are shown and discussed. Although the algorithm dose not detect all outlier clusters, the detection of single outliers and even cluster outliers with lower density than a predefined value seems satisfactory, specially the results in the boundary of occlusions. Detection of such outliers is important because if they remain in the data set, they may cause modelling errors in the next modelling step.
1. INTRODUCTION
Simple, efficient and direct capturing of 3D information are the main reasons for the fast growing popularity of laser scanners. Although the generated point clouds are direct and dense measurement of objects, the appearance of single or cluster outliers cause serious problems for the next modelling and measurement steps. Therefore, a pre-process is required to detect and remove outliers. However, the number of points in the generated point cloud is in the order of million points, so (semi) automatic approaches are necessary. Outlier detection in point clouds is not a trivial task since there are: geometrical discontinuities caused by occlusions in silhouette boundaries, no prior knowledge of the statistical distribution of points, the existence of noise, and different local point densities. The typical outlier detection approaches, classified (Papadimitriou et al., 2002) as distribution-based, depth-based, clustering and distance-based approaches, do not get satisfactory results in laser point clouds (see section 2). In this paper, a density based outlier detection algorithm is introduced, which was addressed previously for knowledge discovery in database (KDD) applications (Breunig et al., 2000). The algorithm has shown a good potential in KDD applications, but its performance and results in laser scanner point clouds has not been clarified yet. The algorithm is examined on both aerial and terrestrial laser scanner data sets and results are reported. The paper organization is as follows: Section 2 gives a literature review of outlier detection algorithms. Section 3 describes some sources of outliers in phase and time-of-flight laser measurement systems. Then, in Section 4, the mathematical aspects of the presented algorithm are briefly addressed. Section 5 contains the results of using the algorithm on real data sets and the assessment of the results with respect to a reference data set. Finally, Section 6 includes a summary and conclusion.
2. LITERATURE REVIEW
While an extensive amount of research has been presented in literature for outlier detection it is still a critical problem in laser scanner point clouds. The proposed approaches have weak potential to perform well with surface discontinuities, they need priory knowledge of the statistical distribution of the samples (Howkings 1980, Vanicek 1982) or they are sensitive to noise and different local densities (Breunig et al., 2000). Nevertheless, the mentioned criteria are typical cases in laser scanner point clouds. According to Papadimitriou et al. (2002) outlier detection approaches are classified into the distribution-based (Howkings 1980), depth-based (Johnson 1998) and clustering approaches (Jain et al., 1999). Distribution-based approaches deploy some standard stochastic distribution model (Normal, Poisson, etc.) and flag as outliers those objects that deviate from the model according to a significant level (Vanicek 1982, Rousseeuw 1987, Barnett 1994, Howkings 1997). However, for arbitrary data sets without any prior knowledge of the distribution of points, determination of the suitable distribution model which fits to the data set (if any) needs to perform expensive tests (in laser point clouds the distribution of points varies according to the distance of objects to laser scanner and the object geometry) . The depth-based approach is based on computational geometry and computes different layers of k-dimentional convex hulls (Johnson 1998). Objects in the outer layer are detected as outliers. However, it is a well-known fact that the algorithms employed cannot cope with large, arbitrary data sets in 3 dimensions. Many clustering algorithms detect outliers as by-products (Jain 1999). From the viewpoint of a clustering algorithm, outliers are objects not located in clusters of a dataset. However, since the main objective of a clustering algorithm is to find clusters, they are developed to optimize clustering, and not to optimize outlier detection. These algorithms, in general, consider outliers
297
IAPRS Volume XXXVI, Part 5, Dresden 25-27 September 2006
297
from a more global perspective, which also has some major drawbacks (Breunig et. al., 2000). The above three approaches for outlier detection are not appropriate for large, arbitrary data sets (Papadimitriou et. al. 2002). Nevertheless, this is often the case with laser point clouds. The following two approaches seem to be more appropriate. The distance-based approach was originally proposed by E.M. Knorr and R.T. Ng (Knorr 2000). An object in a data set P is a distance-based outlier if at least a fraction b of the objects in the object set is further than r from it. This outlier definition is based on a single, global criterion determined by the parameters r and b. This can lead to problems when the data set has both dense and sparse regions (Breunig et. al., 2000). The density-based approach was proposed by (M. Breunig, et al. 2000) for KDD applications. It relies on the local outlier factor (LOF) of each object, which depends on the local density of its neighborhood. The neighborhood is defined by the distance to the MinPts-th nearest neighbor. The MinPts is a predefined value, which corresponds to the minimum number of points in calculation of density. The algorithm is not only independent of the prior knowledge of the scanned objects, distribution or density of sampled points but also does not suffer from the different local point densities. In section 4 the basics of the algorithm are briefly described, the reader is referred to Breunig et. al., 2000 for more detail, and the result of applying the algorithm on real point clouds (aerial and terrestrial) are presented in section 5. Outliers in point clouds may have different sources. In the next section, some sources of the outliers in terrestrial laser point clouds are described and in section 5 the behaviour of the presented algorithm to different outlier types are shown.
3. SOURCES OF OUTLIERS IN LASER SCANNER POINT CLOUDS
According to (Howkings 1980) an outlier is an observation that deviates so much from other observations as to arouse suspicion that it was generated by a different mechanism. Big errors or outliers can cause from different sources and they are mainly measurements that do not belong to the local neighborhood and do not obey the local surface geometry; thus they cause serious problems in the further steps such as segmentation or mesh generation. Here some important reasons of the appearance of outliers are described, in particular for terrestrial phase measurement and time-of-flight systems. 3.1 Boundaries of occlusions
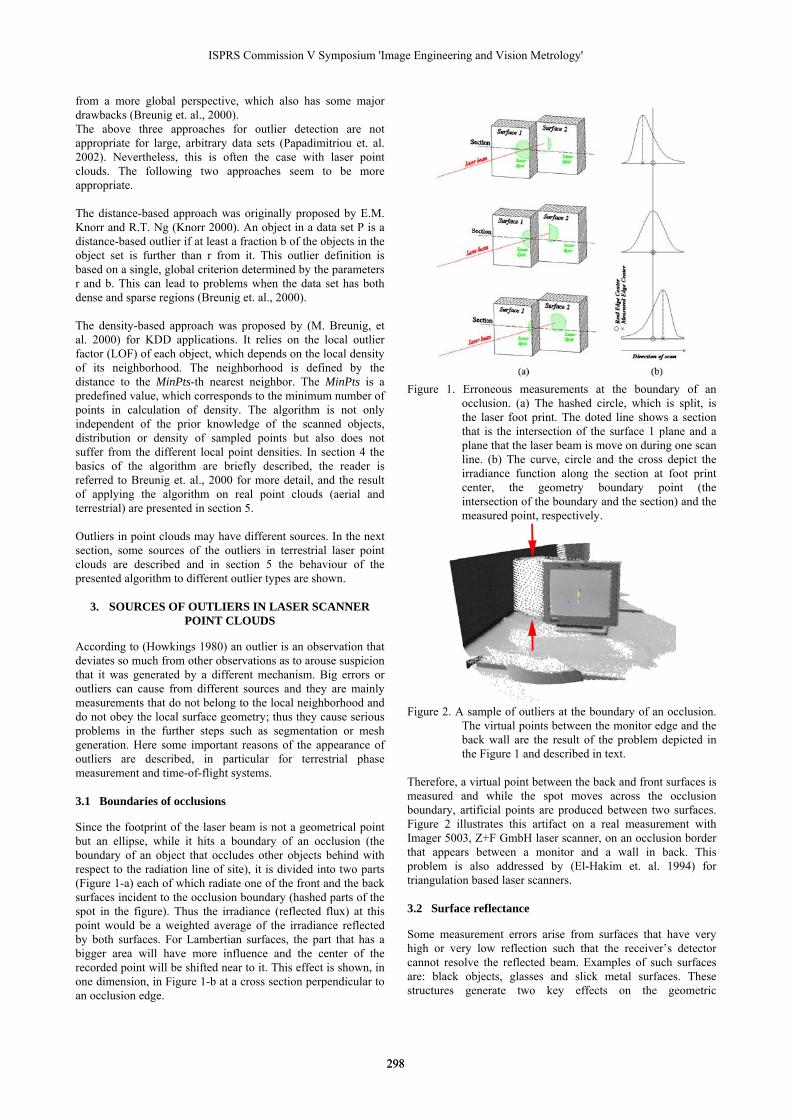
Since the footprint of the laser beam is not a geometrical point but an ellipse, while it hits a boundary of an occlusion (the boundary of an object that occludes other objects behind with respect to the radiation line of site), it is divided into two parts (Figure 1-a) each of which radiate one of the front and the back surfaces incident to the occlusion boundary (hashed parts of the spot in the figure). Thus the irradiance (reflected flux) at this point would be a weighted average of the irradiance reflected by both surfaces. For Lambertian surfaces, the part that has a bigger area will have more influence and the center of the recorded point will be shifted near to it. This effect is shown, in one dimension, in Figure 1-b at a cross section perpendicular to an occlusion edge.
Figure 1. Erroneous measurements at the boundary of an
occlusion. (a) The hashed circle, which is split, is the laser foot print. The doted line shows a section that is the intersection of the surface 1 plane and a plane that the laser beam is move on during one scan line. (b) The curve, circle and the cross depict the irradiance function along the section at foot print center, the geometry boundary point (the intersection of the boundary and the section) and the measured point, respectively.
Figure 2. A sample of outliers at the boundary of an occlusion.
The virtual points between the monitor edge and the back wall are the result of the problem depicted in the Figure 1 and described in text.
Therefore, a virtual point between the back and front surfaces is measured and while the spot moves across the occlusion boundary, artificial points are produced between two surfaces. Figure 2 illustrates this artifact on a real measurement with Imager 5003, Z+F GmbH laser scanner, on an occlusion border that appears between a monitor and a wall in back. This problem is also addressed by (El-Hakim et. al. 1994) for triangulation based laser scanners.
3.2 Surface reflectance
Some measurement errors arise from surfaces that have very high or very low reflection such that the receiver’s detector cannot resolve the reflected beam. Examples of such surfaces are: black objects, glasses and slick metal surfaces. These structures generate two key effects on the geometric
298
ISPRS Commission V Symposium 'Image Engineering and Vision Metrology'
298
measurement: a bias in the distance measurement, as well as an increase in noise level (Baraldin, 2004). 3.3 Multi path reflection
When the laser beam hits a surface under a quite low incidence angle, most of the laser beam is not directly reflected back into the receiver, but first deflected onto other close surfaces and then reflected back into the receiver. This secondary reflection is more effective than the first reflection directly from the first surface. Therefore incorrect measurements appear in the point cloud. Some of these artefacts (e.g. weak reflections) can be detected by the sensor itself with a simple pre-processing relative to the physical properties of the reflected beam or with a filtering process (Bornaz 2004). Nevertheless, the pre-processing procedures cannot remove all the outliers and still an outlier detection process is needed. The approach should detect outliers disregarding the source of them and does not suffer from the problem of the other approaches. The following chapter describes a density based algorithm that satisfies these properties. It has two main properties; first unconstrained behaviour to the preliminary knowledge of the scanned scene, and second the independency to the varying density of the points.
4. THE LOF ALGORITHM
The algorithm needs some basic definitions that are as follows (Breunig et. al., 2000): K-distance of a point p: For any positive integer k, the k-distance of point p, denoted as k-distance(p), is defined as the distance d(p,o) between p and a point o∈D such that (D is a point set for which outliers should be detected): (i) for at least k points o’∈D-{p} it holds that d(p,o’) ≤ d(p,o), (ii) for at most k-1 points o’∈D-{p} it holds that d(p,o’) < d(p,o) K-distance neighborhood of a point p: Given the k-distance of p, the k-distance neighborhood of p contains every point whose distance from p is not greater than the k-distance, i.e. Nk(p) = { q ∈ D-{p} | d(p, q) ≤ k-distance(p) } These points q are called the k-nearest neighbors of p. Reachability distance of a point p with respect to point o: Let k be a natural number. The reachability distance of point p with respect to point o is defined as reach-distk (p, o) = max { k-distance(o), d(p, o) } If point p is far away from o, then the reachability distance between the two is simply their actual distance. However, if they are “sufficiently” close, the actual distance is replaced by the k-distance of o. The reason is that in this way, the statistical fluctuations (noise) of d(p,o) for all the p's close to o can be significantly reduced. The strength of this smoothing effect can be controlled by the parameter k. The higher the value of k, the more similar the reachability distances for points within the same neighborhood.
Local reachability density of a point p: The local reachability density of p is defined as
( )
( , )( ) 1/
( )MinPts p
MinPtso N
MinPtsMinPts
reach dist p olrd p
N p∈
⎧ ⎫−⎪ ⎪
= ⎨ ⎬⎪ ⎪⎩ ⎭
∑
Intuitively, the local reachability density of a point p is the inverse of the average reachability distance based on the MinPts nearest neighbors of p. And finally the local outlier factor (LOF) is defined as
( )
( )( )
( )( )
MinPts
MinPts
o N p MinPtsMinPts
MinPts
lrd olrd p
LOF pN p
∈=∑
The outlier factor of point p captures the degree to which p is called an outlier. It is the average of the ratio of the local reachability density of p and those of p’s MinPts-nearest neighbors. It is easy to see that the lower p's local reachability density is, and the higher the local reachability densities of p's MinPts-nearest neighbors are, the higher is the LOF value of p. Breunig et. al. show that the value of LOF for a point deep inside a cluster is approximately 1. Similarly, the intuitive property of laser scanner point clouds, dense regular sampling, implies that the LOF value of points that are measured correctly should be 1. All outliers have the common property to not obey the local point density, and so the LOF value of them should show bigger values than 1. Moreover, the local behaviour of the factor avoids the problem of different densities over a whole scan, which may happen due to the varying distance of objects and the scanner. Thus the algorithm should function well over both close and far point clusters and should detect the single and even clustered outliers in which the number of points is smaller than the MinPts value that defines the local neighbourhood. Outlier clusters that have more points than this value cannot be detected, since the radius of the neighbourhood defined by MinPts does not touch the points outside the cluster. Thus the point is considered as a point deep inside that cluster and not as an outlier. Therefore the selection of MinPts has direct influence on the performance of the algorithm. Breunig et. al. show some guidelines of selecting the lower and upper bands of MinPts. However the selection of the bands is application dependent.
5. EFFICIENCY CHECK AND RESULTS
To assess the explained algorithm, it was examined on both aerial and terrestrial laser scanner point clouds, with dense clusters and most of the outlier types described in Section 3. Below the result of both tests are reported. 5.1
Aerial case
A part of the ALS point cloud of Espoonlahti A1 was used. The area contains an urban area (Figure 3b). The data is captured by TopoSys, Falcon2 ALS with the nominal accuracy of σxyz = 0.22m. A reference surface was required to find out the reference outliers and inliers and to compare with the result of the algorithm. Here, a surface extracted from an aerial stereo pair was considered, which was available from the same area. Having the reference surface, reference outliers were selected as points that were far from the reference surface with respect to
1http://www.fgi.fi/osastot/foto/projektit/www_treeextr/espoonlahti.html 2 http://www.toposys.com/
299
IAPRS Volume XXXVI, Part 5, Dresden 25-27 September 2006
299
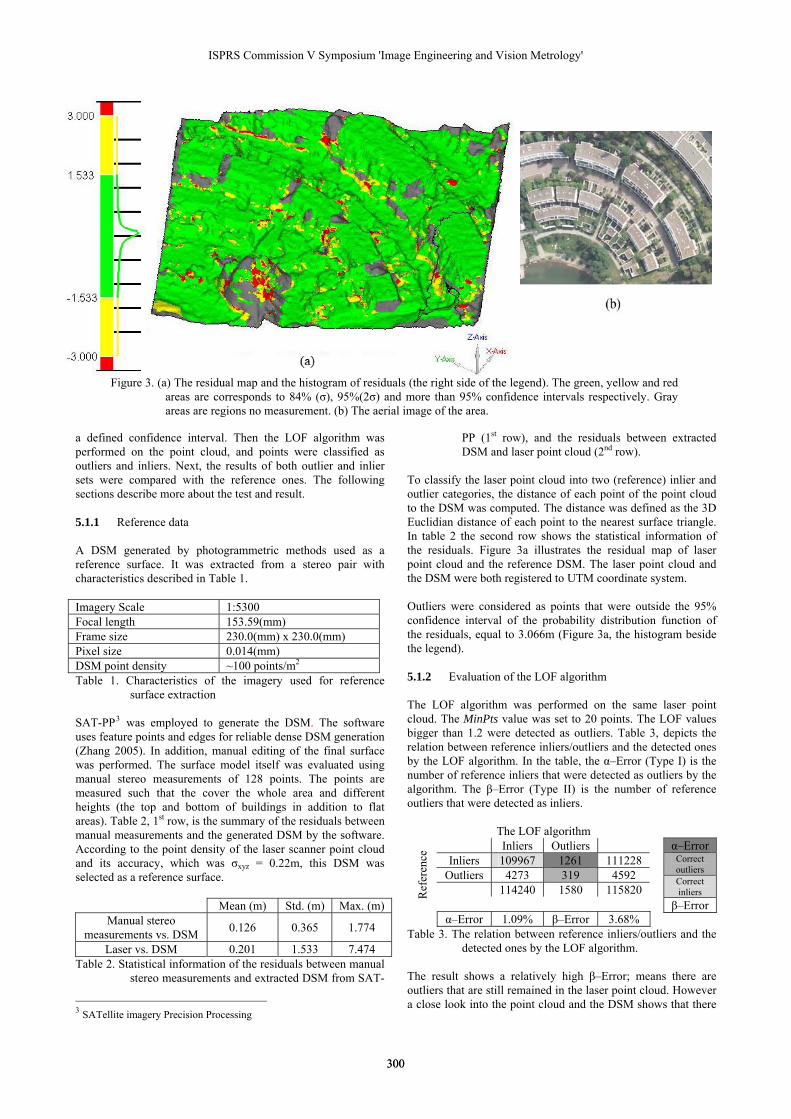
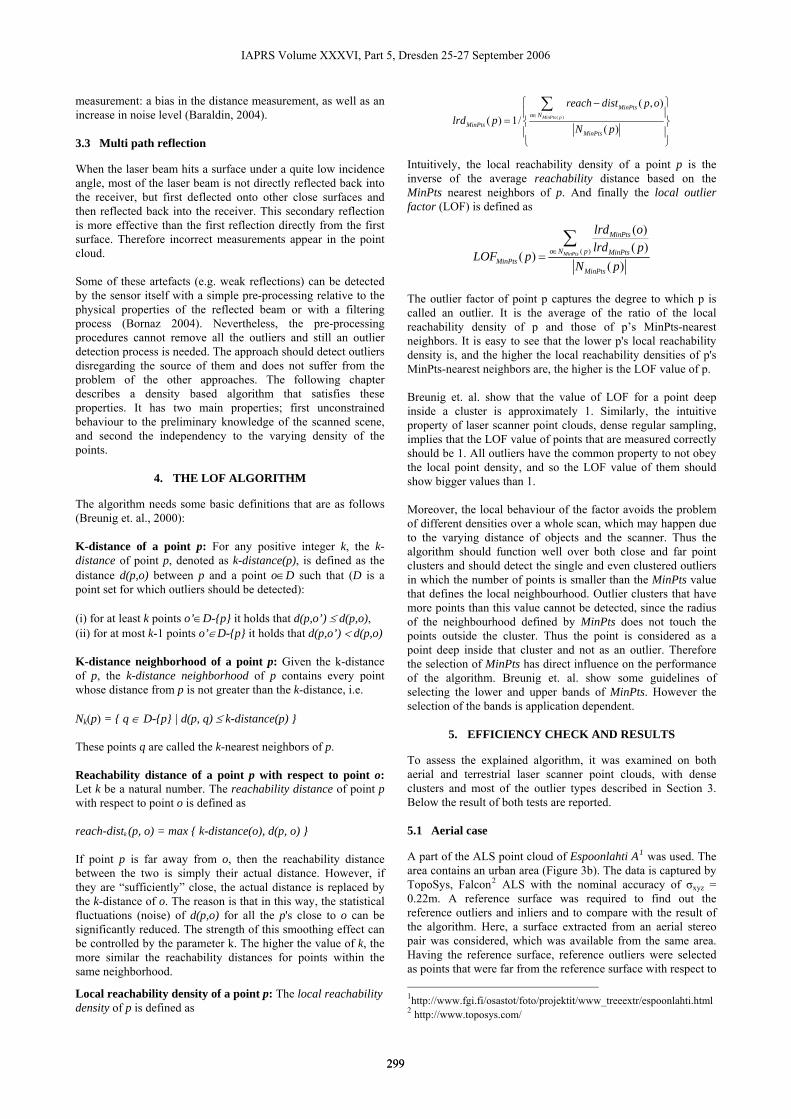
Figure 3. (a) The residual map and the histogram of residuals (the right side of the legend). The green, yellow and red areas are corresponds to 84% (σ), 95%(2σ) and more than 95% confidence intervals respectively. Gray areas are regions no measurement. (b) The aerial image of the area.
a defined confidence interval. Then the LOF algorithm was performed on the point cloud, and points were classified as outliers and inliers. Next, the results of both outlier and inlier sets were compared with the reference ones. The following sections describe more about the test and result. 5.1.1 Reference data A DSM generated by photogrammetric methods used as a reference surface. It was extracted from a stereo pair with characteristics described in Table 1. Imagery Scale 1:5300 Focal length 153.59(mm) Frame size 230.0(mm) x 230.0(mm) Pixel size 0.014(mm) DSM point density ~100 points/m2 Table 1. Characteristics of the imagery used for reference
surface extraction SAT-PP3 was employed to generate the DSM. The software uses feature points and edges for reliable dense DSM generation (Zhang 2005). In addition, manual editing of the final surface was performed. The surface model itself was evaluated using manual stereo measurements of 128 points. The points are measured such that the cover the whole area and different heights (the top and bottom of buildings in addition to flat areas). Table 2, 1st row, is the summary of the residuals between manual measurements and the generated DSM by the software. According to the point density of the laser scanner point cloud and its accuracy, which was σxyz = 0.22m, this DSM was selected as a reference surface.
Mean (m) Std. (m) Max. (m) Manual stereo
measurements vs. DSM 0.126 0.365 1.774
Laser vs. DSM 0.201 1.533 7.474 Table 2. Statistical information of the residuals between manual
stereo measurements and extracted DSM from SAT-
5.1.2
3 SATellite imagery Precision Processing
PP (1st row), and the residuals between extracted DSM and laser point cloud (2nd row).
To classify the laser point cloud into two (reference) inlier and outlier categories, the distance of each point of the point cloud to the DSM was computed. The distance was defined as the 3D Euclidian distance of each point to the nearest surface triangle. In table 2 the second row shows the statistical information of the residuals. Figure 3a illustrates the residual map of laser point cloud and the reference DSM. The laser point cloud and the DSM were both registered to UTM coordinate system. Outliers were considered as points that were outside the 95% confidence interval of the probability distribution function of the residuals, equal to 3.066m (Figure 3a, the histogram beside the legend).
Evaluation of the LOF algorithm The LOF algorithm was performed on the same laser point cloud. The MinPts value was set to 20 points. The LOF values bigger than 1.2 were detected as outliers. Table 3, depicts the relation between reference inliers/outliers and the detected ones by the LOF algorithm. In the table, the α–Error (Type I) is the number of reference inliers that were detected as outliers by the algorithm. The β–Error (Type II) is the number of reference outliers that were detected as inliers.
The LOF algorithm Inliers Outliers
Inliers 109967 1261 111228 Outliers 4273 319 4592
114240 1580 115820
Ref
eren
ce
α–Error 1.09% β–Error 3.68%
α–Error Correct outliers Correct inliers
β–Error
Table 3. The relation between reference inliers/outliers and the detected ones by the LOF algorithm.
The result shows a relatively high β–Error; means there are outliers that are still remained in the laser point cloud. However a close look into the point cloud and the DSM shows that there
300
ISPRS Commission V Symposium 'Image Engineering and Vision Metrology'
300
5.2
are two reasons. First, there are points that are inside a cluster of outliers and if the cluster has point density more than MinPts it is not detectable by the algorithm. If a higher value of MinPts is set it causes that object point clusters that have less points than MinPts are also being detected as outliers (it raises the α–Error). This is because the algorithm is blind to figure out the difference between a cluster of object points and outliers. Second, there are still some areas in the reference DSM that are not a part of the real surface. These are mainly the areas that are difficult for matching algorithms to get reliable results such as a cluster of trees (Figure 3, a cluster in the bottom left of the figure). On the other hand, the algorithm detected the single or cluster outliers that have the point density less than MinPts.
Terrestrial case
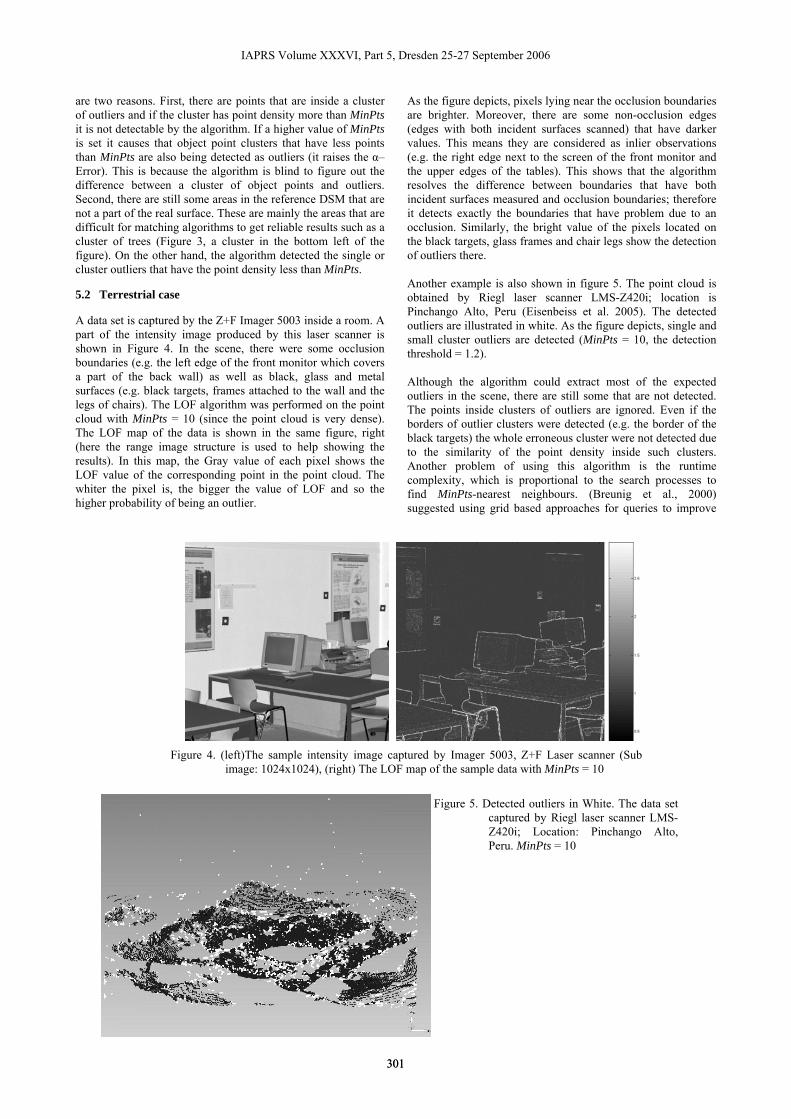
A data set is captured by the Z+F Imager 5003 inside a room. A part of the intensity image produced by this laser scanner is shown in Figure 4. In the scene, there were some occlusion boundaries (e.g. the left edge of the front monitor which covers a part of the back wall) as well as black, glass and metal surfaces (e.g. black targets, frames attached to the wall and the legs of chairs). The LOF algorithm was performed on the point cloud with MinPts = 10 (since the point cloud is very dense). The LOF map of the data is shown in the same figure, right (here the range image structure is used to help showing the results). In this map, the Gray value of each pixel shows the LOF value of the corresponding point in the point cloud. The whiter the pixel is, the bigger the value of LOF and so the higher probability of being an outlier.
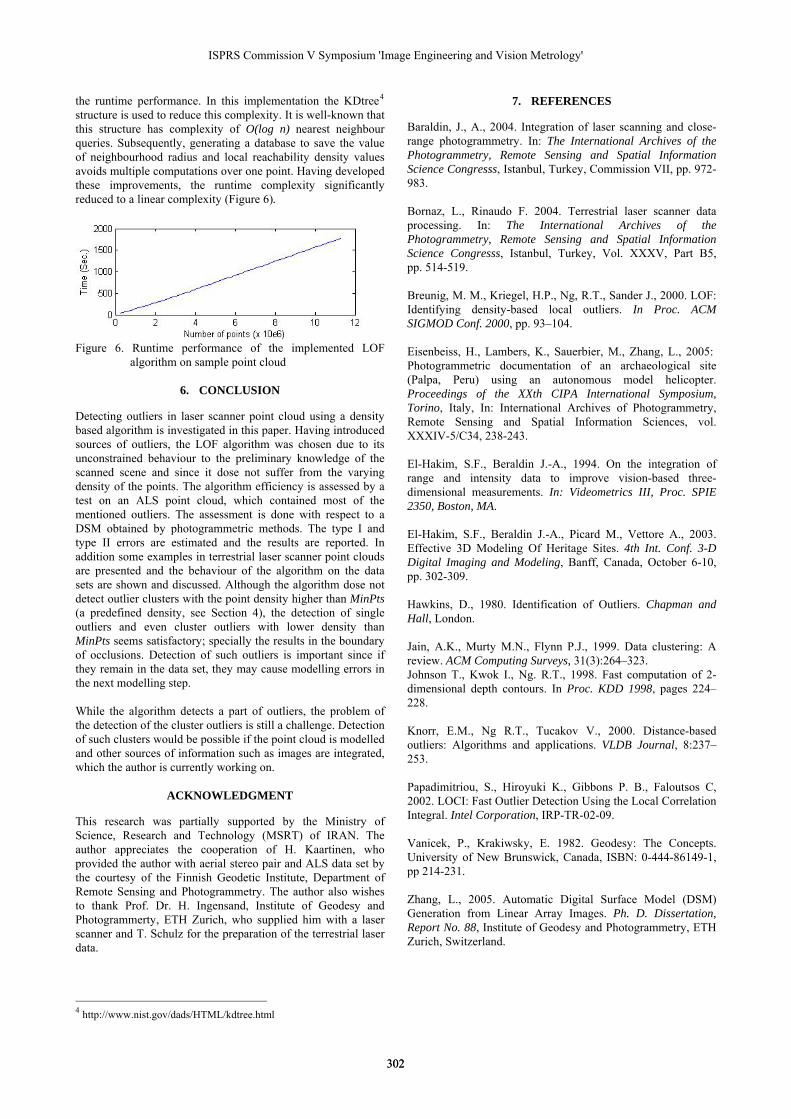
As the figure depicts, pixels lying near the occlusion boundaries are brighter. Moreover, there are some non-occlusion edges (edges with both incident surfaces scanned) that have darker values. This means they are considered as inlier observations (e.g. the right edge next to the screen of the front monitor and the upper edges of the tables). This shows that the algorithm resolves the difference between boundaries that have both incident surfaces measured and occlusion boundaries; therefore it detects exactly the boundaries that have problem due to an occlusion. Similarly, the bright value of the pixels located on the black targets, glass frames and chair legs show the detection of outliers there. Another example is also shown in figure 5. The point cloud is obtained by Riegl laser scanner LMS-Z420i; location is Pinchango Alto, Peru (Eisenbeiss et al. 2005). The detected outliers are illustrated in white. As the figure depicts, single and small cluster outliers are detected (MinPts = 10, the detection threshold = 1.2). Although the algorithm could extract most of the expected outliers in the scene, there are still some that are not detected. The points inside clusters of outliers are ignored. Even if the borders of outlier clusters were detected (e.g. the border of the black targets) the whole erroneous cluster were not detected due to the similarity of the point density inside such clusters. Another problem of using this algorithm is the runtime complexity, which is proportional to the search processes to find MinPts-nearest neighbours. (Breunig et al., 2000) suggested using grid based approaches for queries to improve
Figure 4. (left)The sample intensity image captured by Imager 5003, Z+F Laser scanner (Sub image: 1024x1024), (right) The LOF map of the sample data with MinPts = 10
Figure 5. Detected outliers in White. The data set captured by Riegl laser scanner LMS-Z420i; Location: Pinchango Alto, Peru. MinPts = 10
301
IAPRS Volume XXXVI, Part 5, Dresden 25-27 September 2006
301
the runtime performance. In this implementation the KDtree4 structure is used to reduce this complexity. It is well-known that this structure has complexity of O(log n) nearest neighbour queries. Subsequently, generating a database to save the value of neighbourhood radius and local reachability density values avoids multiple computations over one point. Having developed these improvements, the runtime complexity significantly reduced to a linear complexity (Figure 6).
Figure 6. Runtime performance of the implemented LOF
algorithm on sample point cloud
6. CONCLUSION
Detecting outliers in laser scanner point cloud using a density based algorithm is investigated in this paper. Having introduced sources of outliers, the LOF algorithm was chosen due to its unconstrained behaviour to the preliminary knowledge of the scanned scene and since it dose not suffer from the varying density of the points. The algorithm efficiency is assessed by a test on an ALS point cloud, which contained most of the mentioned outliers. The assessment is done with respect to a DSM obtained by photogrammetric methods. The type I and type II errors are estimated and the results are reported. In addition some examples in terrestrial laser scanner point clouds are presented and the behaviour of the algorithm on the data sets are shown and discussed. Although the algorithm dose not detect outlier clusters with the point density higher than MinPts (a predefined density, see Section 4), the detection of single outliers and even cluster outliers with lower density than MinPts seems satisfactory; specially the results in the boundary of occlusions. Detection of such outliers is important since if they remain in the data set, they may cause modelling errors in the next modelling step. While the algorithm detects a part of outliers, the problem of the detection of the cluster outliers is still a challenge. Detection of such clusters would be possible if the point cloud is modelled and other sources of information such as images are integrated, which the author is currently working on.
ACKNOWLEDGMENT
This research was partially supported by the Ministry of Science, Research and Technology (MSRT) of IRAN. The author appreciates the cooperation of H. Kaartinen, who provided the author with aerial stereo pair and ALS data set by the courtesy of the Finnish Geodetic Institute, Department of Remote Sensing and Photogrammetry. The author also wishes to thank Prof. Dr. H. Ingensand, Institute of Geodesy and Photogrammerty, ETH Zurich, who supplied him with a laser scanner and T. Schulz for the preparation of the terrestrial laser data.
4 http://www.nist.gov/dads/HTML/kdtree.html
7. REFERENCES
Baraldin, J., A., 2004. Integration of laser scanning and close-range photogrammetry. In: The International Archives of the Photogrammetry, Remote Sensing and Spatial Information Science Congresss, Istanbul, Turkey, Commission VII, pp. 972-983. Bornaz, L., Rinaudo F. 2004. Terrestrial laser scanner data processing. In: The International Archives of the Photogrammetry, Remote Sensing and Spatial Information Science Congresss, Istanbul, Turkey, Vol. XXXV, Part B5, pp. 514-519. Breunig, M. M., Kriegel, H.P., Ng, R.T., Sander J., 2000. LOF: Identifying density-based local outliers. In Proc. ACM SIGMOD Conf. 2000, pp. 93–104. Eisenbeiss, H., Lambers, K., Sauerbier, M., Zhang, L., 2005: Photogrammetric documentation of an archaeological site (Palpa, Peru) using an autonomous model helicopter. Proceedings of the XXth CIPA International Symposium, Torino, Italy, In: International Archives of Photogrammetry, Remote Sensing and Spatial Information Sciences, vol. XXXIV-5/C34, 238-243. El-Hakim, S.F., Beraldin J.-A., 1994. On the integration of range and intensity data to improve vision-based three-dimensional measurements. In: Videometrics III, Proc. SPIE 2350, Boston, MA. El-Hakim, S.F., Beraldin J.-A., Picard M., Vettore A., 2003. Effective 3D Modeling Of Heritage Sites. 4th Int. Conf. 3-D Digital Imaging and Modeling, Banff, Canada, October 6-10, pp. 302-309. Hawkins, D., 1980. Identification of Outliers. Chapman and Hall, London. Jain, A.K., Murty M.N., Flynn P.J., 1999. Data clustering: A review. ACM Computing Surveys, 31(3):264–323. Johnson T., Kwok I., Ng. R.T., 1998. Fast computation of 2-dimensional depth contours. In Proc. KDD 1998, pages 224–228. Knorr, E.M., Ng R.T., Tucakov V., 2000. Distance-based outliers: Algorithms and applications. VLDB Journal, 8:237–253. Papadimitriou, S., Hiroyuki K., Gibbons P. B., Faloutsos C, 2002. LOCI: Fast Outlier Detection Using the Local Correlation Integral. Intel Corporation, IRP-TR-02-09. Vanicek, P., Krakiwsky, E. 1982. Geodesy: The Concepts. University of New Brunswick, Canada, ISBN: 0-444-86149-1, pp 214-231. Zhang, L., 2005. Automatic Digital Surface Model (DSM) Generation from Linear Array Images. Ph. D. Dissertation, Report No. 88, Institute of Geodesy and Photogrammetry, ETH Zurich, Switzerland.
302
ISPRS Commission V Symposium 'Image Engineering and Vision Metrology'
302