orange county public schools · hereby issue the comprehensive annual financial report (cafr) of...
TRANSCRIPT

ORANGE COUNTY PUBLIC SCHOOLS
Orlando, Florida
Comprehensive Annual Financial Report
For the Fiscal Year
Ended June 30, 2015
Prepared By: Finance Department

ORANGE COUNTY PUBLIC SCHOOLS
Comprehensive Annual Financial Report
For the Fiscal Year Ended June 30, 2015
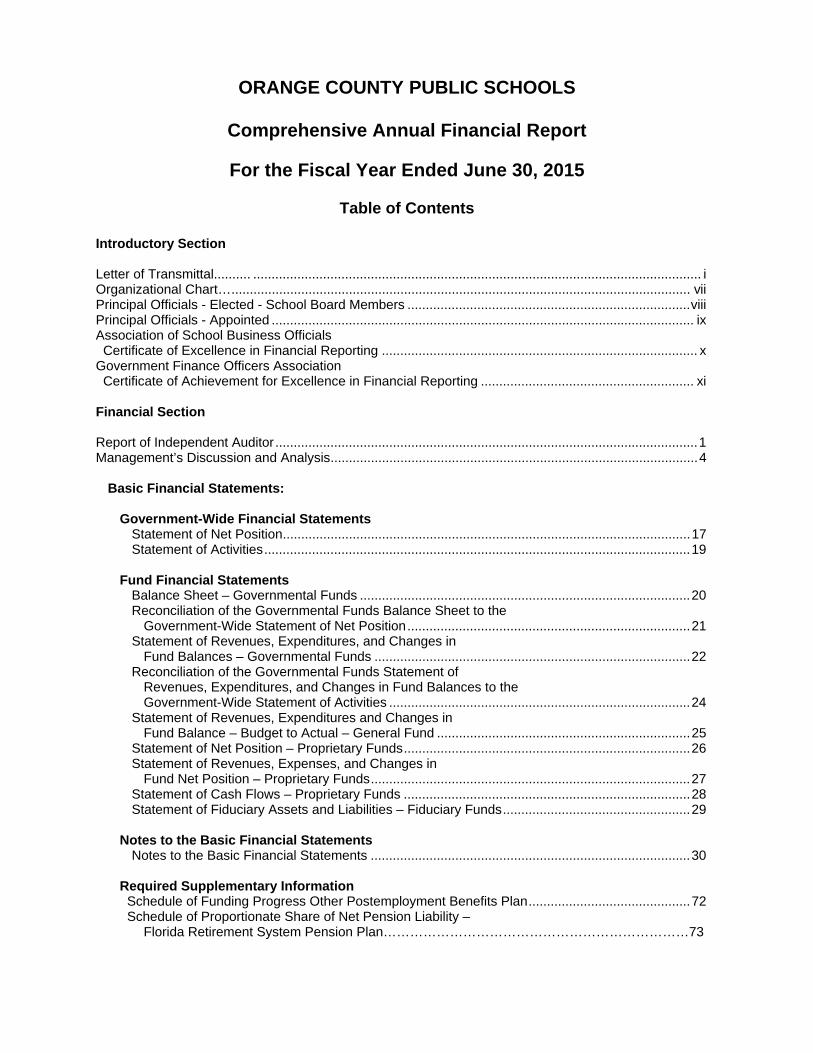
Table of Contents Introductory Section Letter of Transmittal.......... .......................................................................................................................... i Organizational Chart… ............................................................................................................................. vii Principal Officials - Elected - School Board Members ............................................................................. viii Principal Officials - Appointed ................................................................................................................... ix Association of School Business Officials Certificate of Excellence in Financial Reporting ...................................................................................... x Government Finance Officers Association Certificate of Achievement for Excellence in Financial Reporting .......................................................... xi
Financial Section Report of Independent Auditor ................................................................................................................... 1 Management’s Discussion and Analysis .................................................................................................... 4 Basic Financial Statements: Government-Wide Financial Statements Statement of Net Position ............................................................................................................... 17 Statement of Activities .................................................................................................................... 19 Fund Financial Statements Balance Sheet – Governmental Funds .......................................................................................... 20 Reconciliation of the Governmental Funds Balance Sheet to the Government-Wide Statement of Net Position ............................................................................. 21 Statement of Revenues, Expenditures, and Changes in Fund Balances – Governmental Funds ...................................................................................... 22 Reconciliation of the Governmental Funds Statement of Revenues, Expenditures, and Changes in Fund Balances to the Government-Wide Statement of Activities .................................................................................. 24 Statement of Revenues, Expenditures and Changes in Fund Balance – Budget to Actual – General Fund ..................................................................... 25 Statement of Net Position – Proprietary Funds .............................................................................. 26 Statement of Revenues, Expenses, and Changes in Fund Net Position – Proprietary Funds ....................................................................................... 27 Statement of Cash Flows – Proprietary Funds .............................................................................. 28 Statement of Fiduciary Assets and Liabilities – Fiduciary Funds ................................................... 29 Notes to the Basic Financial Statements Notes to the Basic Financial Statements ....................................................................................... 30 Required Supplementary Information Schedule of Funding Progress Other Postemployment Benefits Plan ............................................ 72
Schedule of Proportionate Share of Net Pension Liability – Florida Retirement System Pension Plan……………………………………………………………73

Schedule of Contributions – Florida Retirement System………………………………….………….…………………………….74
Schedule of Proportionate Share of Net Pension Liability – Health Insurance Subsidy Pension Plan………………………………………………………….…75
Schedule of Contributions – Health Insurance Subsidy Pension Plan…………………………………………………………….76
Supplemental Information Non-Major Fund Information .............................................................................................................. 77 Combining and Individual Fund Statements and Schedules: Combining Balance Sheet – Non-Major Governmental Funds ...................................................... 78 Combining Statement of Revenues, Expenditures, and Changes in Fund Balances – Non-Major Governmental Funds .................................................................... 81 Schedules of Revenues, Expenditures and Changes in Fund Balance(s) – Budget to Actual: Food Service – Special Revenue Fund .......................................................................................... 87 Other Federal Programs – Special Revenue Fund ........................................................................ 88 ARRA Federal Programs – Special Revenue Fund ....................................................................... 89 Other – Special Revenue Fund ...................................................................................................... 90 State Board of Education and Capital Outlay Bond Issue – Debt Service Fund ........................... 91 Other Debt Service – Debt Service Fund ....................................................................................... 92 Public Education Capital Outlay – Capital Projects Fund .............................................................. 93 Capital Outlay & Debt Service – Capital Projects Fund ................................................................. 94 Section 1011.71(2), Florida Statutes, Local Capital Improvement Tax – Capital Projects Fund .................................................................................................................. 95 Other – Capital Projects Fund ........................................................................................................ 96 Proprietary Fund – Internal Service Funds ........................................................................................ 97 Combining Statement of Net Position – Internal Service Funds .................................................... 98 Combining Statement of Revenues, Expenses, and Changes In Fund Net Assets – Internal Service Funds ............................................................................. 99 Combining Statement of Cash Flows – Internal Service Funds .................................................. 100 Fiduciary Fund – Agency Funds ...................................................................................................... 101 Statement of Changes in Assets and Liabilities – Fiduciary Funds ............................................. 102 Statistical Section Statistical Section Information ................................................................................................................ 103 Financial Trend Information: Net Position by Component Last Ten Fiscal Years ............................................................................... 104 Changes in Net Position Last Ten Fiscal Years..................................................................................... 105 Governmental Activities Tax Revenues by Source Last Ten Fiscal Years ............................................ 106 Fund Balances of Governmental Funds Last Ten Fiscal Years ............................................................ 107 Changes in Fund Balances of Governmental Funds Last Ten Fiscal Years ......................................... 108

Summary of Revenues, Expenditures (by Major Object) and Changes in Fund Balances: General Fund Last Ten Fiscal Years ................................................................................................... 110 Special Revenues Fund – Other Federal Programs Last Ten Fiscal Years ........................................ 111 Special Revenues Fund – ARRA Federal Programs Last Six Fiscal Years ........................................ 112 Special Revenues Fund – Food Service Last Ten Fiscal Years.......................................................... 113 Debt Service Funds Last Ten Fiscal Years… ...................................................................................... 114 Capital Projects Funds Last Ten Fiscal Years ..................................................................................... 115 Revenue Capacity Information: General Governmental Tax Revenues by Source Last Ten Fiscal Years ............................................. 116 Assessed and Estimated Actual Value of Taxable Property Last Ten Fiscal Years .............................. 117 Property Tax Rates – Direct and Overlapping Governments Last Ten Fiscal Years ............................ 118 Principal Taxpayers 2015 Fiscal Year ................................................................................................... 119 Principal Taxpayers 2006 Fiscal Year ................................................................................................... 120 Property Tax Levies and Collections Last Ten Fiscal Years ................................................................. 121 Debt Capacity Information: Ratios of Outstanding Debt by Type Last Ten Fiscal Years .................................................................. 122 Computation of Direct and Overlapping Bonded Debt September 30, 2014 ......................................... 123 Anticipated Capital Outlay Millage Levy Required to Cover Certificates of Participation Payments Last Ten Fiscal Years ............................................................. 124 Demographic and Economic Information: Demographic and Economic Statistics Last Ten Fiscal Years .............................................................. 125 Principal Employers Orlando Metropolitan Statistical Area (MSA) Last Ten Fiscal Years…. ............... 126 Operating Information: School Building Information & Full-Time Equivalent Enrollment Data Last Ten Years ......................... 127 Number of Personnel Last Ten Fiscal Years ......................................................................................... 132 Teacher Base Salaries (10 month) Last Ten Fiscal Years .................................................................... 133 Food Service Operating Data Last Ten Fiscal Years ............................................................................ 134 Schedule of Insurance in Force as of June 30, 2015 ............................................................................ 135 Single Audit Section Schedule of Expenditures of Federal Awards ........................................................................................ 137 Report of Independent Auditor on Compliance for Each Major Program and on Internal Control Over Compliance Required by OMB Circular A-133 .................................................. 140
Schedule of Findings and Questioned Costs ......................................................................................... 142
Schedule of Prior Audit Findings ............................................................................................................ 144 Other Reports Section Report of Independent Auditor on Internal Control Over Financial Reporting and on Compliance and Other Matters Based on an Audit of the Financial Statements Performed in Accordance with Government Auditing Standards ..................................... 145


December 7, 2015 To the Members of the School Board of Orange County
and the Citizens of Orange County, Florida: State law requires that all school districts publish within nine months of the close of each fiscal year a complete set of financial statements presented in conformity with accounting principles generally accepted in the United States (GAAP) and audited in accordance with generally accepted auditing standards (GAAS) by an independent certified public accountant. Pursuant to that requirement, we hereby issue the comprehensive annual financial report (CAFR) of Orange County Public Schools (the “School Board” or the “District”) for the fiscal year ended June 30, 2015. This report consists of management’s representations concerning the finances of the District. Consequently, management assumes full responsibility for the completeness and reliability of all of the information presented in this report. To provide a reasonable basis for making these representations, management of the District has established a comprehensive internal control framework that is designed both to protect the government’s assets from losses, theft, or misuse and to compile sufficient reliable information for the preparation of the District’s financial statements in conformity with GAAP. Because the cost of internal controls should not outweigh their benefits, the District’s comprehensive framework of internal controls has been designed to provide reasonable rather than absolute assurance that the financial statements will be free from material misstatement. As management, we assert that, to the best of our knowledge and belief, this financial report is complete and reliable in all material respects. The District’s financial statements have been audited by Cherry Bekaert LLP, a firm of licensed certified public accountants. The goal of the independent audit was to provide reasonable assurance that the basic financial statements of Orange County Public Schools for the fiscal year ended June 30, 2015 are free of material misstatement. The independent audit involved examining, on a test basis, evidence supporting the amounts and disclosures in the financial statements; assessing the accounting principles used and significant estimates made by management; and evaluating the overall financial statement presentation. The independent auditor concluded, based upon the audit, that there was a reasonable basis for rendering unmodified opinions that Orange County Public Schools’ basic financial statements for the fiscal year ended June 30, 2015, are fairly presented in conformity with GAAP. The independent auditor’s report is presented as the first component of the financial section of this report. The independent audit of the financial statements of the District was part of a broader, federally mandated “Single Audit” designed to meet the special needs of federal grantor agencies. The District is required to undergo an annual single audit in conformity with the provisions of the Single Audit Act of 1996 and the United States Office of Management and Budget (“OMB”) Circular A-133, Audits of States, Local Governments and Non-Profit Organizations. The standards governing Single Audit engagements require an independent auditor to report not only on the fair presentation of the financial statements, but also on the audited government’s internal controls and legal requirements involving the administration of federal awards. Information related to this single audit, including the schedule of expenditures of federal awards, findings and questioned costs, summary of prior audit findings, and the independent auditor’s report on compliance with applicable requirements, are included in the Single Audit section. The independent auditor’s report on the system of internal control is included in the other reports section.
i

This report includes all funds of the District, The School Board of Orange County Employee Benefits Trust (Trust), The Orange School Board Leasing Corporation, Inc. (Leasing Corporation), and The Foundation for Orange County Public Schools, Inc. (Foundation), which comprise the reporting entity. The Trust administers the District’s employee group health and life insurance program. The Leasing Corporation was formed by the School Board to be the lessor in connection with financing the acquisition and/or construction of certain educational facilities. The Foundation is a separate not-for-profit corporation organized and operated as a direct-support organization. The Foundations purpose is exclusively educational and charitable for the constituents of Orange County. The Foundation is included as a discretely presented component unit. GAAP require that management provide a narrative introduction, overview, and analysis to accompany the basic financial statements in the form of Management’s Discussion and Analysis (MD&A). This letter of transmittal is designed to complement the MD&A and should be read in conjunction with it. The District’s MD&A can be found immediately following the report of the independent auditor.
Profile of the Government
The District and its governing board were created pursuant to Section 4, Article IX of the Constitution of the State of Florida. The District is an independent taxing and reporting entity managed, controlled, operated, administered, and supervised by the district school officials in accordance with Chapter 1001, Florida Statutes. The Board consists of eight members. The school board chairman is elected at large by the citizens of Orange County. Should a tie vote exist on any particular issue, the chairman’s side prevails. The seven board members are elected in districts by the public. All board members serve four-year staggered terms. The superintendent is selected by the Board and serves as chief executive officer of the school system. The Board is responsible for setting policy, while the superintendent is responsible for administration and management of the schools. The superintendent is also specifically delegated the responsibility of maintaining a uniform system of records and accounts in the District by Section 1010.01, Florida Statutes, as prescribed by the State Board of Education. The geographic boundaries of the District are those of Orange County. The District is in the center of the State of Florida and encompasses an area of about 1,000 square miles. During the 2014-15 fiscal year, the District operated 184 schools, including 123 elementary schools, 3 K-8 schools, 35 middle schools, 19 high schools, and 4 specialized schools with a total of 178,941 full-time equivalent students (FTE) not including charter schools. In addition, the District sponsored 35 charter schools with a total of 11,439 FTE. The District opened two additional elementary schools in fiscal year 2015-2016. The estimated number for full-time equivalent students is 192,034 for fiscal year 2015-2016. Orange County Public Schools is the 10th largest district in the nation and the 4th largest in Florida. The District also provides Career and Technical education within Orange County. Instruction takes place throughout four technical centers on five campuses, 19 high schools, 35 middle schools, and various community and business sites, located throughout Orange County. The annual budget serves as the foundation for the District’s financial planning and control. The District is required to advertise, hold a public hearing and adopt a tentative budget no later than 34 days after certification of value by the property appraiser which occurs around July 1 of each year. The final millage and budget must be adopted within 65-80 days of certification. The appropriated budget is prepared by fund, function (e.g., instruction), and object (e.g., salaries). Each school as well as department has their own budget. The school’s budget is based on the number and classification of the students attending that school and each principal plays an integral role in developing their school’s budget. Budget-to-actual comparisons are provided in this report, by function, for each individual governmental fund for which an appropriated annual budget has been adopted. For the general fund, this comparison is presented as part of the basic financial statements for the governmental funds. For all other governmental funds with appropriated annual budgets, these comparisons are presented in the combining and individual fund section of this report.
ii
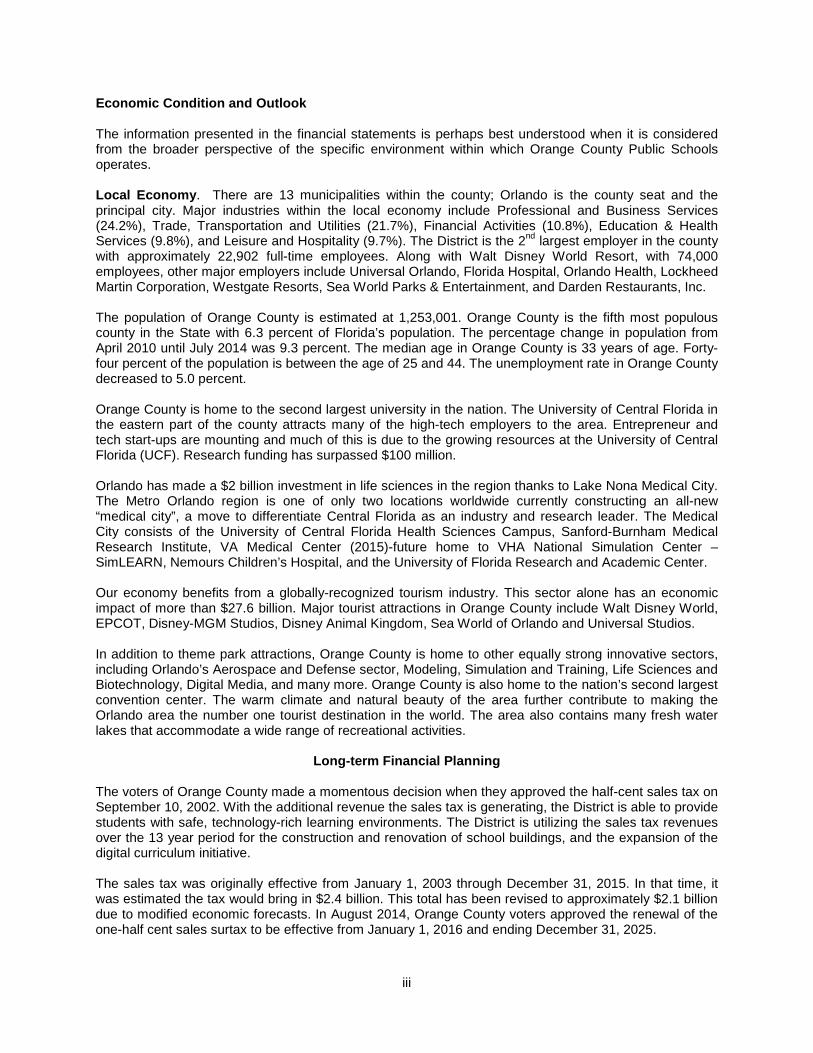
Economic Condition and Outlook The information presented in the financial statements is perhaps best understood when it is considered from the broader perspective of the specific environment within which Orange County Public Schools operates. Local Economy. There are 13 municipalities within the county; Orlando is the county seat and the principal city. Major industries within the local economy include Professional and Business Services (24.2%), Trade, Transportation and Utilities (21.7%), Financial Activities (10.8%), Education & Health Services (9.8%), and Leisure and Hospitality (9.7%). The District is the 2nd largest employer in the county with approximately 22,902 full-time employees. Along with Walt Disney World Resort, with 74,000 employees, other major employers include Universal Orlando, Florida Hospital, Orlando Health, Lockheed Martin Corporation, Westgate Resorts, Sea World Parks & Entertainment, and Darden Restaurants, Inc. The population of Orange County is estimated at 1,253,001. Orange County is the fifth most populous county in the State with 6.3 percent of Florida’s population. The percentage change in population from April 2010 until July 2014 was 9.3 percent. The median age in Orange County is 33 years of age. Forty-four percent of the population is between the age of 25 and 44. The unemployment rate in Orange County decreased to 5.0 percent. Orange County is home to the second largest university in the nation. The University of Central Florida in the eastern part of the county attracts many of the high-tech employers to the area. Entrepreneur and tech start-ups are mounting and much of this is due to the growing resources at the University of Central Florida (UCF). Research funding has surpassed $100 million. Orlando has made a $2 billion investment in life sciences in the region thanks to Lake Nona Medical City. The Metro Orlando region is one of only two locations worldwide currently constructing an all-new “medical city”, a move to differentiate Central Florida as an industry and research leader. The Medical City consists of the University of Central Florida Health Sciences Campus, Sanford-Burnham Medical Research Institute, VA Medical Center (2015)-future home to VHA National Simulation Center – SimLEARN, Nemours Children’s Hospital, and the University of Florida Research and Academic Center. Our economy benefits from a globally-recognized tourism industry. This sector alone has an economic impact of more than $27.6 billion. Major tourist attractions in Orange County include Walt Disney World, EPCOT, Disney-MGM Studios, Disney Animal Kingdom, Sea World of Orlando and Universal Studios. In addition to theme park attractions, Orange County is home to other equally strong innovative sectors, including Orlando’s Aerospace and Defense sector, Modeling, Simulation and Training, Life Sciences and Biotechnology, Digital Media, and many more. Orange County is also home to the nation’s second largest convention center. The warm climate and natural beauty of the area further contribute to making the Orlando area the number one tourist destination in the world. The area also contains many fresh water lakes that accommodate a wide range of recreational activities.
Long-term Financial Planning The voters of Orange County made a momentous decision when they approved the half-cent sales tax on September 10, 2002. With the additional revenue the sales tax is generating, the District is able to provide students with safe, technology-rich learning environments. The District is utilizing the sales tax revenues over the 13 year period for the construction and renovation of school buildings, and the expansion of the digital curriculum initiative. The sales tax was originally effective from January 1, 2003 through December 31, 2015. In that time, it was estimated the tax would bring in $2.4 billion. This total has been revised to approximately $2.1 billion due to modified economic forecasts. In August 2014, Orange County voters approved the renewal of the one-half cent sales surtax to be effective from January 1, 2016 and ending December 31, 2025.
iii

The District, in cooperation with Orange County, continues to work with developers desiring to build residential communities within the county to ensure sufficient school capacity. The student growth from these new communities impact existing and future school sites in the District. These inter-local agreements include the prepayment of school impact fees, developer contributions per unit, site development, and site acquisition. In November 2010, voters approved a one-mill special millage to take effect in 2011 for the 2012 fiscal year. This millage is for a period of up to four years. Its purpose is to preserve existing programs that were in jeopardy due to the loss of a 0.25 mill critical needs operating millage and expiring Federal American Recovery and Reinvestment Act programs. The special millage generated approximately $92.9 million in 2015 fiscal year. In November 2014, the voters of Orange County approved the renewal of the current one mill ad valorem millage for essential operating expenses in order to preserve academic programs, retain highly qualified teachers, and protect arts, athletics and student activities beginning July 1, 2015, and ending four (4) fiscal years later on June 30, 2019, with annual reporting to ensure proper fiscal stewardship of these funds to the citizens of Orange County.
Major Initiatives Digital Technology and Curriculum. The District is planning for a state requirement that one half of the curriculum materials be digital beginning in 2015-2016 and that Common Core assessments begin in 2014-2015. In fiscal year 2014 the District began pilot programs at seven schools. They include 1 high school, 3 middle schools and 3 elementary schools. The pilot has expanded to nine additional sites, which includes two 9th grade centers, for a total of sixteen sites. There is planned expansion in FY16. The district roll out will be, in part, dependent upon state funding. Common Core. Common Core is a clear college and career ready standard for kindergarten through 12th grade in English language arts/literacy and mathematics. Forty three states have voluntarily adopted and are working to implement the standards, which are designed to ensure that students graduating from high school are prepared to take credit bearing introductory courses in two or four-year college programs. Costs associated with implementation of Common Core standards will include professional development, curriculum materials, assessments, training instructional staff to teach common core standards, and development and/or procurement of new materials.
Accomplishments
Orange County Public Schools was named a co-winner of the 2014 Broad Prize for Urban Education. This award is considered the Nobel Prize for education. The Broad Prize is the largest education award in the country given to school districts. The shared $1 million Broad Prize was awarded to OCPS and one other large urban district. The Broad Prize is awarded each year to honor urban school districts that demonstrate the greatest overall performance and improvement in student achievement while reducing achievement gaps among low-income students and student of color. OCPS will receive $500,000 in senior scholarships for the class of 2015. During the 2010-2011 school year, Florida began the transition from the FCAT to the FCAT 2.0 and Florida End-of-Course (EOC) Assessments. In 2014-2015, FCAT 2.0 Reading and FCAT 2.0 Mathematics were replaced by the Florida Standards Assessments. The Florida Standards Assessments (FSA) in English Language Arts, Mathematics, and end-of-course (EOC) subjects, including Algebra 1, Algebra 2, and Geometry, will serve Florida students by measuring education gains and progress. End-of-course assessments were administered for the first time in spring 2015 to middle and high school levels. These assessments are part of Florida’s Next Generation Strategic Plan for increasing student achievement and improving college and career readiness. To encourage forward-thinking practices, beginning in the 2015-2016 school year, the Florida Approved Courses and Tests (FACT) initiative shall be implemented to expand student choices in selecting high-quality online courses, including, but not limited to, massive open online courses and instruction for promotion or graduation. Such courses and instruction may be provided using a blended learning model
iv


This page intentionally left blank.
vi

CIT
IZE
NS
OF
OR
AN
GE
CO
UN
TY
SC
HO
OL
BO
AR
D O
FO
RA
NG
E C
OU
NT
Y
SU
PE
RIN
TE
ND
EN
TB
arba
ra J
enki
ns
Ch
ief
Op
era
tio
ns
Off
ice
rM
icha
el E
uge
ne
Ch
ief
of
Sta
ffC
ath
y P
ope
Ch
ief
Fac
ilit
ies
Off
ice
rJo
hn M
orr
is
Dep
uty
Su
per
inte
nd
ent
Jesu
s Ja
ra
Ch
ief
Fin
an
cia
l O
ffic
er
Ric
har
d C
olli
ns
Are
a S
up
eri
nte
nd
ent
Eas
tA
nna
Dia
z
Are
a S
up
eri
nte
nd
ent
Wes
tB
ridg
et W
illia
ms
Are
a S
up
eri
nte
nd
ent
So
uth
we
stH
aro
ld B
ord
er
Are
a S
up
eri
nte
nd
ent
So
uth
ea
st
Mar
ia V
azq
ue
z
Are
a S
up
eri
nte
nd
ent
No
rth
Joh
n W
righ
t
SC
HO
OL
BO
AR
DA
TT
OR
NE
YD
iego
Ro
drig
ue
z
Ora
nge
Cou
nty
Pub
lic S
choo
ls1A
S70
1re
vise
d: 1
/14/
15
Ch
ief
Ac
ade
mic
Off
ice
rS
cott
Frit
z
Ex
ec
uti
ve M
an
age
rO
ffic
e o
f th
e S
up
eri
nte
nd
en
tS
usa
n A
da
ms
Min
ori
ty A
ch
ieve
men
t O
ffic
er
Jam
es
La
wso
n
vii

ORANGE COUNTY PUBLIC SCHOOLS PRINCIPAL OFFICIALS – ELECTED
SCHOOL BOARD MEMBERS (Members are elected for four-year terms)
For the Fiscal Year Ended June 30, 2015
District 1 Joie Cadle
2002 - 2018
District 2 Daryl Flynn 2006 – 2018
District 3 Linda Kobert 2014 – 2018
District 4 Pam Gould 2012 - 2016
District 5 Kathleen “Kat” Gordon
2000 – 2016
District 6 Nancy Robbinson
2008 - 2016
District 7 Christine Moore
2008-2016 Vice-Chairman
District Wide Bill Sublette 2010 – 2018
Chairman
viii

ORANGE COUNTY PUBLIC SCHOOLS PRINCIPAL OFFICIALS – APPOINTED
For the Fiscal Year Ended June 30, 2015
Barbara Jenkins Superintendent
Jesus Jara Deputy Superintendent Cathy Pope Chief of Staff Richard Collins Chief Financial Officer Scott Fritz Chief Academic Officer John Morris Chief Facilities Officer Michael Eugene Chief Operations Officer James Lawson Minority Achievement Officer Anna Diaz Area Superintendent East John Wright Area Superintendent North Bridget Williams Area Superintendent West Maria Vazquez Area Superintendent Southeast Harold Border Area Superintendent Southwest
ix

Association of School Business Officials International
The Certificate of Excellence in Financial Reporting Award
is presented to
Orange County Public Schools
For Its Comprehensive Annual Financial Report (CAFR) For the Fiscal Year Ended June 30, 2014
The CAFR has been reviewed and met or exceeded
ASBO International’s Certificate of Excellence standards
Mark C. Pepera, MBA, RSBO, SFO John D. Musso, CAE, RSBA President Executive Director
x

xi

This page intentionally left blank.

Report of Independent Auditor
The Honorable Members of the School Board of Orange County Public Schools Orlando, Florida
Report on the Financial Statements
We have audited the accompanying financial statements of the governmental activities, the discretely presented component unit, each major fund, and the aggregate remaining fund information of Orange County Public Schools, Florida (the “District”), as of and for the year ended June 30, 2015, and the related notes to the financial statements, which collectively comprise the District’s basic financial statements as listed in the table of contents.
Management’s Responsibility for the Financial Statements
Management is responsible for the preparation and fair presentation of these financial statements in accordance with accounting principles generally accepted in the United States of America; this includes the design, implementation, and maintenance of internal control relevant to the preparation and fair presentation of financial statements that are free from material misstatement, whether due to fraud or error.
Auditor’s Responsibility
Our responsibility is to express opinions on these financial statements based on our audit. We did not audit the financial statements of the discretely presented component unit nor the fiduciary funds, which represent 100 percent of the assets, net position, and revenues of the component units and 3.3 percent, 0 percent, and 0 percent of the assets, net position, and revenues, respectively, of the aggregate remaining fund information. Those statements were audited by other auditors whose reports have been furnished to us, and our opinion, insofar as it relates to the amounts included for the discretely presented component unit and fiduciary funds, is based solely on the reports of the other auditors. We conducted our audit in accordance with auditing standards generally accepted in the United States of America and standards applicable to financial audits contained in Government Auditing Standards, issued by the Comptroller General of the United States. Those standards require that we plan and perform the audit to obtain reasonable assurance about whether the financial statements are free from material misstatement.
An audit involves performing procedures to obtain audit evidence about the amounts and disclosures in the financial statements. The procedures selected depend on the auditor’s judgment, including the assessment of the risks of material misstatement of the financial statements, whether due to fraud or error. In making those risk assessments, the auditor considers internal control relevant to the entity’s preparation and fair presentation of the financial statements in order to design audit procedures that are appropriate in the circumstances, but not for the purpose of expressing an opinion on the effectiveness of the entity’s internal control. Accordingly, we express no such opinion. An audit also includes evaluating the appropriateness of accounting policies used and the reasonableness of significant accounting estimates made by management, as well as evaluating the overall presentation of the financial statements.
We believe that the audit evidence we have obtained is sufficient and appropriate to provide a basis for our audit opinions.
1

Opinions
In our opinion, based on our audit and the reports of the other auditors, the financial statements referred to above present fairly, in all material respects, the respective financial position of the governmental activities, the discretely presented component unit, each major fund, and the aggregate remaining fund information of the District as of June 30, 2015, and the respective changes in financial position and, where applicable, cash flows, and the respective budgetary comparison for the General Fund thereof for the year then ended in accordance with accounting principles generally accepted in the United States of America.
Emphasis of Matter
Change in Accounting Principle
As described in Note 1 to the financial statements, effective July 1, 2014, the District adopted the provisions of Governmental Accounting Standards Board (“GASB”) Statement No. 68, Accounting and Financial Reporting for Pensions – an amendment of GASB Statement No. 27 and GASB Statement No. 71, Pension Transition for Contributions Made Subsequent to the Measurement Date – an amendment of GASB Statement No. 68. Our opinions are not modified with respect to this matter.
Other Matters
Required Supplementary Information
Accounting principles generally accepted in the United States of America require that the management’s discussion and analysis and other post-employment benefits and pension schedules on pages 72 through 76 be presented to supplement the basic financial statements. Such information, although not a part of the basic financial statements, is required by the Governmental Accounting Standards Board, who considers it to be an essential part of financial reporting for placing the basic financial statements in an appropriate operational, economic, or historical context. We have applied certain limited procedures to the required supplementary information in accordance with auditing standards generally accepted in the United States of America, which consisted of inquiries of management about the methods of preparing the information and comparing the information for consistency with management’s responses to our inquiries, the basic financial statements, and other knowledge we obtained during our audit of the basic financial statements. We do not express an opinion or provide any assurance on the information because the limited procedures do not provide us with sufficient evidence to express an opinion or provide any assurance.
Other Information
Our audit was conducted for the purpose of forming opinions on the financial statements that collectively comprise the District’s basic financial statements. The introductory section, combining and individual fund statements and schedules, and statistical section, as listed in the table of contents, are presented for purposes of additional analysis and are not a required part of the basic financial statements. The schedule of expenditures of federal awards is presented for purposes of additional analysis as required by the Office of Management and Budget Circular A-133, Audits of States, Local Governments, and Non-Profit Organizations and is also not a required part of the basic financial statements.
The combining and individual fund statements and schedules and the schedule of expenditures of federal awards are the responsibility of management and were derived from and relate directly to the underlying accounting and other records used to prepare the basic financial statements. Such information has been subjected to the auditing procedures applied in the audit of the basic financial statements and certain additional procedures, including comparing and reconciling such information directly to the underlying accounting and other records used to prepare the basic financial statements or to the basic financial statements themselves, and other additional procedures in accordance with auditing standards generally accepted in the United States of America by us and the other auditor. In our opinion, the combining and individual fund statements and schedules and the schedule of expenditures of federal awards are fairly stated in all material respects in relation to the basic financial statements as a whole.
2

The introductory and statistical sections have not been subjected to the auditing procedures applied in the audit of the basic financial statements and, accordingly, we do not express an opinion or provide any assurance on them.
Other Reporting Required by Government Auditing Standards
In accordance with Government Auditing Standards, we have also issued our report dated December 7, 2015 on our consideration of the District’s internal control over financial reporting and on our tests of its compliance with certain provisions of laws, regulations, contracts, and grant agreements and other matters. The purpose of that report is to describe the scope of our testing of internal control over financial reporting and compliance and the results of that testing, and not to provide an opinion on the internal control over financial reporting or on compliance. That report is an integral part of an audit performed in accordance with Government Auditing Standards in considering the District’s internal control over financial reporting and compliance.
Orlando, Florida December 7, 2015
3

ORANGE COUNTY PUBLIC SCHOOLS MANAGEMENT’S DISCUSSION AND ANALYSIS
June 30, 2015
As management of the District School Board of Orange County (the “District”), we offer readers of the District’s financial statements this narrative overview and analysis of the financial activities of the District for the fiscal year ended June 30, 2015. Financial Highlights
The assets and deferred outflows of the District exceeded its liabilities and deferred inflows at the close of the most recent fiscal year by $3,093,290,043 (net position).
The District’s total net position increased by $241,764,068. This increase is primarily attributable to the ongoing investment of the District in new schools and the renovation of existing schools supported by sales tax proceeds and other capital outlay revenues.
Total revenues of $2,121,230,590 were comprised of general revenues in the amount of $1,957,120,555, or 92.3 percent, and program specific revenues from charges for services, grants and contributions in the amount of $164,110,035, or 7.7 percent.
For the year ended June 30, 2015, the District had $1,879,466,522 in expenses related to governmental activities; $164,110,035 of which were offset by program specific charges or services, grants and other sources. General revenues (primarily taxes and state funding programs) of $1,957,120,555 were sufficient to provide for the District’s programs.
As of the close of the current fiscal year, the District’s governmental funds reported combined ending fund balances of $1,653,221,591, an increase of $49,493,929 in comparison with the prior year. Approximately 4.9 percent of this total amount, $80,311,859, is available for spending at the District’s discretion for the purposes defined for each governmental fund (unassigned fund balance). The remaining balance of $1,572,909,732 has been designated as Nonspendable, Restricted, Committed or Assigned.
At the end of the current fiscal year, unassigned fund balance for the general fund was $80,311,859 or 5.3 percent of total general fund expenditures.
The District’s total long-term debt for bonds, COP’s, and capital leases decreased by $34,469,932 or 2.6 percent, during the current fiscal year due to principal payments.
Overview of the Financial Statements This discussion and analysis is intended to serve as an introduction to the District’s basic financial statements. The District’s basic financial statements comprise three components: 1) government-wide financial statements, 2) fund financial statements, and 3) notes to the financial statements. This report also contains other supplementary information in addition to the basic financial statements. Government-wide financial statements. The government-wide financial statements (or district-wide financial statements) are designed to provide a broad overview of the District’s finances, in a manner similar to a private-sector business. The statement of net position presents information on all of the District’s assets, deferred outflows, liabilities, and deferred inflows, with the difference between the two reported as net position. Over time, increases or decreases in net position may serve as a useful indicator of whether the financial position of the District is improving or deteriorating.
4

ORANGE COUNTY PUBLIC SCHOOLS MANAGEMENT’S DISCUSSION AND ANALYSIS
June 30, 2015
The statement of activities provides information showing how the District’s net position changed during the most recent fiscal year. All changes in net position are reported as soon as the underlying event giving rise to the change occurs, regardless of the timing of related cash flows. Thus, revenues and expenses are reported in this statement for some items that will only result in cash flows in the future fiscal periods (e.g., uncollected taxes, other post employment benefits, and earned but unused vacation and sick leave). All of the District’s activities and services are reported in the government-wide financial statements, including instruction, pupil support services, instructional support services, administrative support services, facility maintenance, transportation, and food services. Property taxes, state assistance, and interest and investment earnings finance most of these activities. Additionally, all capital and debt financing activities are reported here. The District currently does not report any business-type activities, which would include functions that are intended to recover all or a significant portion of their costs through user fees and charges. The government-wide financial statements include not only the District itself (known as the primary government), but also the School Board of Orange County Employee Benefits Trust and the Orange County School Board Leasing Corporation. The School Board of Orange County Employee Benefits Trust (Trust) and the Orange County School Board Leasing Corporation (Corporation), although also legally separate, were formed to administer the District’s group health and life insurance program and facilitate financing for the acquisition of facilities and equipment, respectively. Due to the substantive economic relationships between the District and the Trust and Corporation, their financial activities have been included as an integral part of the primary government. Fund financial statements. A fund is a grouping of related accounts that is used to maintain control over resources that have been segregated for specific activities or objectives. The District, like other state and local governments, uses fund accounting to ensure and demonstrate compliance with finance-related legal requirements. All of the funds of the District can be divided into three categories: governmental funds, proprietary funds, and fiduciary funds. Governmental funds. Governmental funds are used to account for essentially the same functions reported as governmental activities in the government-wide financial statements. However, unlike the government-wide financial statements, governmental fund financial statements focus on near-term inflows and outflows of spendable resources, as well as on balances of spendable resources available at the end of the fiscal year. Such information may be useful in evaluating a government’s near-term financing requirements. Because the focus of governmental funds is narrower than that of the government-wide financial statements, it is useful to compare the information presented for governmental funds with similar information presented for governmental activities in the government-wide financial statements. By doing so, readers may better understand the long-term impact of the District’s near-term financing decisions. Both the governmental fund balance sheet and the governmental fund statement of revenues, expenditures, and changes in fund balances provide a reconciliation to facilitate this comparison between governmental funds and governmental activities. The District maintains 11 individual governmental funds. Information is presented separately in the governmental balance sheets and in the governmental statements of revenues, expenditures and changes in fund balances for the General Fund and Capital Projects – Other Fund, which are considered to be major funds. Data from the other 9 governmental funds are combined into a single, aggregated presentation. Individual fund data for each of these nonmajor governmental funds is provided in the form of combining statements elsewhere in this report.
5

ORANGE COUNTY PUBLIC SCHOOLS MANAGEMENT’S DISCUSSION AND ANALYSIS
June 30, 2015
The District adopts an annual appropriated budget for its general fund. A budgetary comparison statement has been provided for the general fund to demonstrate compliance with this budget. Proprietary funds. The District maintains one type of proprietary fund – internal service funds. Internal service funds are an accounting device used to accumulate and allocate costs internally among the District’s various functions. The District uses internal service funds to account for its self-insurance programs, employee benefits trust and printing services. Because these services benefit the District’s governmental functions, they have been included within governmental activities in the government-wide financial statements. The three internal service funds are combined into a single, aggregated presentation in the proprietary fund financial statements. Individual fund data for the internal service funds are provided in the form of combining statements elsewhere in this report. Fiduciary funds. Fiduciary funds, which for the District consist solely of agency funds, are used to account for resources held for the benefit of parties outside the District. Fiduciary funds are not reflected in the government-wide financial statements because the resources of those funds are not available to support the District’s own programs. The accounting used for fiduciary funds is similar to that used for proprietary funds, except that agency funds do not report changes in fiduciary net assets, as agency fund assets should equal liabilities. Notes to the financial statements. The notes provide additional information that is essential to fully understanding the data provided in the government-wide and fund financial statements. Other information. The combining statements referred to earlier in connection with nonmajor governmental funds and internal service funds are presented immediately following the notes to the financial statements. Government-Wide Financial Analysis As noted earlier, net position may serve over time as a useful indicator of a government’s financial position. In the case of the District, assets and deferred outflows exceeded liabilities and deferred inflows by $3,093,290,043 at the close of the most recent fiscal year.
6

ORANGE COUNTY PUBLIC SCHOOLS MANAGEMENT’S DISCUSSION AND ANALYSIS
June 30, 2015
Governmental Activities PercentageJune 30, 2015 June 30, 2014 Change
Current and Other Assets 1,891,276,134$ 1,834,400,075$ 3.1%
Capital Assets 3,379,313,587 3,287,312,679 2.8%Total Assets 5,270,589,721 5,121,712,754 2.9%
Deferred Outflows 195,235,054 40,679,761 379.9%Total Deferred Outflows 195,235,054 40,679,761 379.9%
Long-Term Liabilities 1,976,703,510 1,582,672,906 24.9%Other Liabilities 156,043,318 166,279,742 -6.2%
Total Liabilities 2,132,746,828 1,748,952,648 21.9%
Deferred Inflows 239,787,903 - 100.0%Total Deferred Inflows 239,787,903 - 100.0%
Net PositionNet Invesment in Capital Assets 2,077,277,202 1,913,435,179 8.6%Restricted 1,279,210,000 1,199,843,608 6.6%Unrestricted (deficit) (263,197,159) 300,161,080 -187.7%
Total Net Position 3,093,290,043$ 3,413,439,867$ -9.4%
Summary of Net Position
The largest portion of the District’s net position (67.2 percent) reflect its investment in existing capital assets (e.g., land, buildings, machinery, and equipment), net of accumulated depreciation and less any related debt used to acquire those assets that is still outstanding. The District uses these capital assets to provide educational and related services to its students; consequently, these assets are not available for future spending. Although the District’s investment in capital assets is reported net of related debt, it should be noted that the resources needed to repay this debt must be provided from other sources, since the capital assets themselves cannot be used to liquidate these liabilities. A portion of the District’s net position (36.9 percent) reflects its restricted net position for capital projects. The District will use these resources in a continuing effort to build and refurbish sufficient classroom space for the growing student population in Orange County, Florida. The balance of ($263,197,159) is shown as unrestricted (deficit) net position. The decrease in unrestricted net position is primarily a result from a $561,913,892 effect from the adoption of GASB 68. Overall, the District’s net position decreased by ($320,149,824) primarily due to the adoption of GASB 68. Prior to the adoption of GASB 68, the District reported an increase in net position of $241,764,068 for the current fiscal year end. The increase is primarily attributed to the building of capital fund reserves for future school renovations and construction projects and expansion of the digital curriculum initiative.
7

ORANGE COUNTY PUBLIC SCHOOLS MANAGEMENT’S DISCUSSION AND ANALYSIS
June 30, 2015
Governmental ActivitiesPercentage
June 30, 2015 June 30, 2014 Change
RevenuesProgram Revenues
Charges for Services 21,681,151$ 24,310,027$ -10.8%Operating Grants and Contributions 78,619,599 73,936,637 6.3%Capital Grants and Contributions 63,809,285 57,022,637 11.9%
General RevenuesProperty Taxes 787,688,840 719,883,967 9.4%Local Sales Tax 209,231,028 191,770,163 9.1%
FEFP Not Restricted to Specific ProgramsGrants and Contributions not Restricted to Specific Programs 927,235,614 919,722,211 0.8%Investment Earnings 13,142,839 22,125,795 -40.6%Miscellaneous 19,822,234 17,961,383 10.4%
Total Revenues 2,121,230,590 2,026,732,820 4.7%
ExpensesInstruction 980,500,950$ 930,705,914$ 5.4%Student Personnel Services 52,618,608 47,188,554 11.5%Instructional Media Services 15,715,124 15,938,431 -1.4%Instruction and Curriculum Development 78,648,709 69,778,905 12.7%Instructional Staff Training Services 56,362,038 58,521,286 -3.7%Instruction Related Technology 11,790,895 12,953,843 -9.0%Board of Education 4,647,303 4,354,904 6.7%General Administration 11,239,101 10,766,361 4.4%School Administration 106,137,125 101,263,993 4.8%Facilities Services 66,466,826 47,179,926 40.9%Fiscal Services 6,266,407 6,236,177 0.5%Food Services 84,404,556 85,609,991 -1.4%Central Services 14,750,356 25,248,570 -41.6%Pupil Transportation Services 76,109,464 77,734,689 -2.1%Operation of Plant 108,568,604 102,198,884 6.2%Maintenance of Plant 35,909,409 35,551,349 1.0%Administrative Technology Services 21,921,750 21,709,350 1.0%Community Services 10,832,534 12,617,196 -14.1%Interest on Long-Term Debt 53,174,813 78,297,429 -32.1%Unallocated Depreciation 83,401,950 79,690,646 4.7%
Total Expenses 1,879,466,522 1,823,546,398 3.1%
Increase in Net Position 241,764,068 203,186,422 19.0%
Net Position - Beginning 3,413,439,867 3,210,253,445 6.3%Cumulative Effect of Change in (561,913,892) - -100.0%
Accounting PrincipleRestated Beginning Net Position 2,851,525,975 3,210,253,445 -11.2%
Net Position - Ending 3,093,290,043$ 3,413,439,867$ -9.4%
Summary of Changes in Net Position
For the Fiscal Year Ended
8
ORANGE COUNTY PUBLIC SCHOOLS MANAGEMENT’S DISCUSSION AND ANALYSIS
June 30, 2015
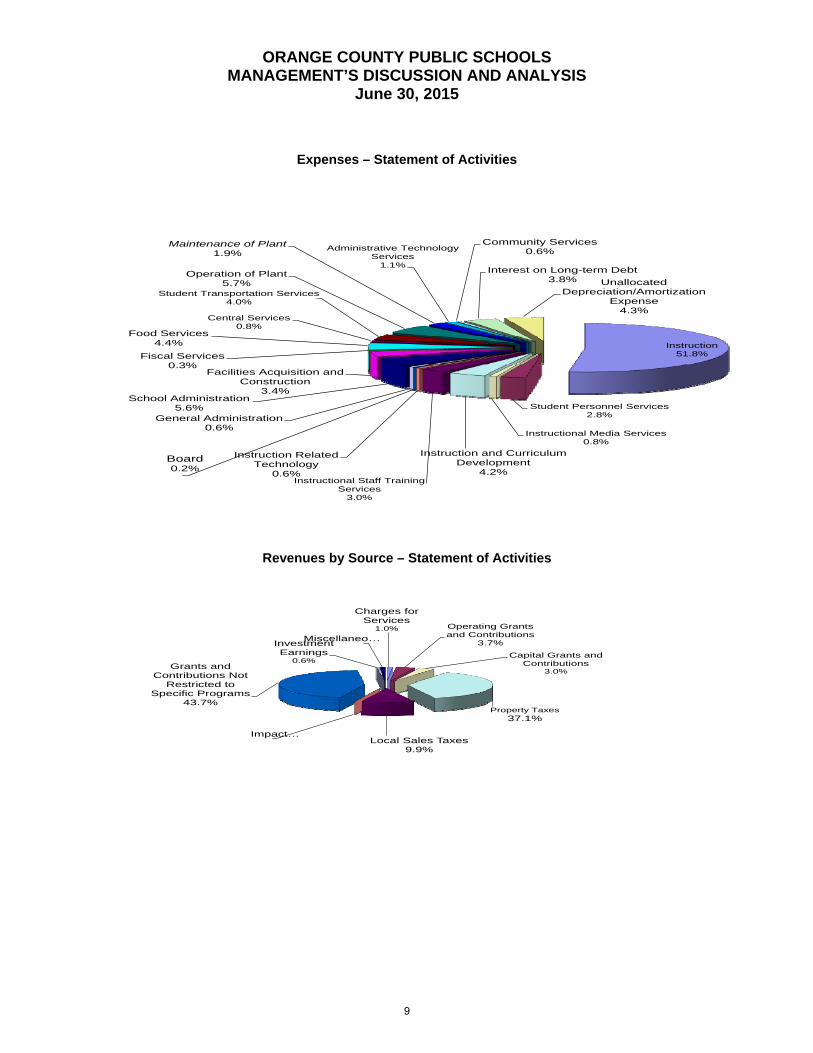
Expenses – Statement of Activities
Instruction51.8%
Student Personnel Services2.8%
Instructional Media Services0.8%
Instruction and Curriculum Development
4.2%Instructional Staff Training
Services3.0%
Instruction Related Technology
0.6%
Board0.2%
General Administration0.6%
School Administration5.6%
Facilities Acquisition and Construction
3.4%
Fiscal Services0.3%
Food Services4.4%
Central Services0.8%
Student Transportation Services4.0%
Operation of Plant5.7%
Maintenance of Plant1.9%
Administrative Technology Services
1.1%
Community Services0.6%
Interest on Long-term Debt3.8% Unallocated
Depreciation/Amortization Expense
4.3%
Revenues by Source – Statement of Activities
Charges for Services
1.0% Operating Grants and Contributions
3.7%
Capital Grants and Contributions
3.0%
Property Taxes37.1%
Local Sales Taxes9.9%
Impact …
Grants and Contributions Not
Restricted to Specific Programs
43.7%
Investment Earnings
0.6%
Miscellaneo…
9

ORANGE COUNTY PUBLIC SCHOOLS MANAGEMENT’S DISCUSSION AND ANALYSIS
June 30, 2015
Financial Analysis of the Government’s Funds As noted earlier, the District uses fund accounting to ensure and demonstrate compliance with finance-related legal requirements. Governmental Funds. The focus of the District’s governmental funds is to provide information on near-term inflows, outflows and balances of spendable resources. Such information is useful in assessing the District’s financing requirements. As of the end of the current fiscal year, the District’s governmental funds reported combined ending fund balances of $1,653,221,591, an increase of $49,493,929 in comparison with the prior year. Approximately 4.9 percent of this total amount $80,311,859 constitutes unassigned fund balance. The remainder of fund balance is Nonspendable $5,132,846, Restricted $1,307,522,804, Committed $.00 or Assigned $260,254,081 to indicate that it is not available for new spending. The General Fund is the chief operating fund of the District. At the end of the current fiscal year, unassigned fund balance of the general fund was $80,311,859, while total fund balance was $367,906,411. As a measure of the general fund’s liquidity, it may be useful to compare both unassigned fund balance and total fund balance to total expenditures. Unassigned fund balance represents 5.3 percent of total general fund expenditures, while total fund balance represents 24.4 percent of that same amount. The fund balance of the District’s general fund decreased by $40,759,979 during the current fiscal year. The decrease was due to the current year spending down of reserved funds for planned expenditures for several major initiatives including salary increases and the expansion of digital curriculum. The Other Capital Projects Fund, which is used to account for capital project activity funded sources such as Certificates of Participation, Sales Tax and Impact Fees, has a total fund balance of $1,010,602,295 all of which is reserved for specific capital projects. The net increase in fund balance during the current year in the other capital projects fund was $80,145,562 and resulted primarily from building capital fund reserves for future renovation projects. It should also be noted that $1,010,602,295 the total fund balance has been restricted for capital projects at year-end. General Fund Budgetary Highlights There was an increase of $38,327,398 between the original budget and the final amended General Fund budget in total. The increase was due to salary increases given during the year and the expansion of the digital curriculum initiative. The General Fund actual revenues exceeded the budgeted revenues by approximately $12.0 million. Other local revenue exceeded the budget by $13.4 million. The State revenue was higher by approximately $3.2 million. The General Fund actual expenditures were less than the budgeted appropriations by approximately $77.9 million. This was due to the delay of planned expenditures for several major initiatives.
10

ORANGE COUNTY PUBLIC SCHOOLS MANAGEMENT’S DISCUSSION AND ANALYSIS
June 30, 2015
Capital Asset and Debt Administration Capital assets. The District’s investment in capital assets as of June 30, 2015, amounts to $3,379,313,586 (net of accumulated depreciation). This investment in capital assets includes land, construction in progress, improvements other than buildings, buildings and fixed equipment, furniture, fixtures and equipment, motor vehicles, audio-visual materials, and computer software. The total increase in the District’s investment in capital assets (net of accumulated depreciation) for the current fiscal year was $92,000,907 (2.8 percent). Major capital asset events during the current fiscal year included the following:
Rebuilding of Apopka Elementary School Rebuilding of Clay Springs Elementary School Rebuilding of Cypress Creek High School Rebuilding of Dr. Phillips Elementary School Rebuilding of Dr. Phillips High School Construction of Eagle Creek Elementary School Rebuilding of Freedom High School Rebuilding of Hunters Creek Middle School Construction of Independence Elementary School Rebuilding of John Young Elementary School Rebuilding of Lakeview Middle School Rebuilding of Lake Silver Elementary School Rebuilding of Lake Weston Elementary School Rebuilding of Lake Whitney Elementary School Rebuilding of Little River Elementary School Rebuilding of Lovell Elementary School Rebuilding of Mid Florida Tech Rebuilding of Ocoee Elementary School Rebuilding of Pineloch Elementary School Rebuilding of Shingle Creek Elementary School Rebuilding of Transportation Support Building Rebuilding of Waterford Elementary School Rebuilding of Wheatley Elementary School Construction of 21-M-E-2 Avalon Park Area Construction of 2-K8-E-1
11

ORANGE COUNTY PUBLIC SCHOOLS MANAGEMENT’S DISCUSSION AND ANALYSIS
June 30, 2015
Governmental ActivitiesJune 30, 2015 June 30, 2014
Land 273,315,801$ 259,362,874$ Improvements Other Than Buildings 8,910,061 8,777,707 Buildings and Fixed Equipment 2,893,230,599 2,808,196,242 Furniture, Fixtures, and Equipment 58,179,572 55,136,455 Motor Vehicles 40,575,586 40,869,505 Construction in Progress 100,198,661 109,733,585 Computer Software 4,903,306 5,236,311
Total Capital Assets 3,379,313,586$ 3,287,312,679$
Summary of Capital Assets
(net of depreciation)
Additional information on the District’s capital assets can be found in the Note 4 to the financial statements. Long-term debt. At the end of the current fiscal year, the District had total long-term debt outstanding of $1,307,855,761 none of which is considered to be general “bonded debt” (i.e., backed by the full faith and credit of the District). The District’s debt consisted of lease-purchase agreements payable, state school bonds payable, and obligations under capital leases, which are secured by specific revenue sources or the underlying assets.
Governmental ActivitiesJune 30, 2015 June 30, 2014
Lease-Purchase Agreements Payable 1,292,614,623$ 1,316,597,318$ State School Bonds Payable 11,519,000 16,325,000 Obligations Under Capital Leases 3,722,138 9,403,375
Total Debt 1,307,855,761$ 1,342,325,693$
Summary of Outstanding Debt
During the current fiscal year, the District’s total long-term debt decreased by $34,469,932 (2.6 percent). The District’s Moody’s rating changed for its certificates of participation from an “Aa3” to “Aa2” rating. Fitch rating remained the same “AA” rating. The S&P rating was upgraded from “AA-“ to “AA” for its certificates of participation. Additional information on the District’s long-term debt that can be found in Notes 5-10 to the financial statements.
12

ORANGE COUNTY PUBLIC SCHOOLS MANAGEMENT’S DISCUSSION AND ANALYSIS
June 30, 2015
Economic Factors and New Year’s Budgets and Rates The following factors were considered in preparing the District’s budget for the 2016 fiscal year:
The unemployment rate in June 2015 for the District (Orlando, Florida) was 5.0 percent, a decrease of 1.9 percent from the prior year rate of 6.9 percent. The State’s average unemployment rate as of June 2015 was 5.5 percent. Florida’s unemployment rate has decreased 0.8 percent since last year while the nation’s also decreased 0.8 percent during the same time period from 6.3 to 5.5 percent.
Residential housing continues to rebound, with more housing developments being approved. Related to the District’s student population, it is expected to continue to increase over the next few years.
The cost of health benefits will continue to increase due to the Federal Patient Protection and Affordable Care Act.
The District continues to expand its digital curriculum initiative and has budgeted funds to build infrastructure and add devices for all students at additional schools.
Unassigned fund balance in the general fund at June 30, 2015 was $80,311,859. The District has assigned $249,568,939. Of this amount, $174,122,255 was assigned for Encumbrances and Budget Appropriations which are included in the 2016 fiscal year budget. The remainder, $75,446,684 for Other Postemployment Benefits (OPEB), is a long term liability and as such is not included in the 2016 fiscal year budget.
Although current estimates indicate that no subsequent reductions will be required, the historical experience where adjustments were made in four of the past five years causes some concern regarding the consistency of state funding for the current year. The district has therefore been proactive and set aside adequate reserves to deal with such a contingency should it materialize. Requests for Information This financial report is to provide a general overview of the District’s finances for all those with an interest in the government’s finances. Questions concerning any of the information provided in this report or requests for additional financial information should be addressed to the Chief Financial Officer, Orange County Public Schools, 445 W. Amelia Street, Orlando, Florida, 32801.
13

This page intentionally left blank.
14

Basic Financial Statements
15

This page intentionally left blank.
16

PrimaryGovernment
The Foundationfor Orange
Governmental County PublicActivities Schools, Inc.
ASSETSCash 422,436,941$ 164,513$ Investments 1,380,855,010 1,584,097 Accounts Receivable 18,613,017 - Interest Receivable 1,044,559 - Deposits Receivable 225,000 186,166 Due From Other Agencies 62,900,866 - Inventories 5,150,741 - Prepaid Expenses 50,000 17,411 Capital Assets: Non-Depreciable 373,514,462 - Depreciable (Net) 3,005,799,124 22,760
Total Assets 5,270,589,720 1,974,947
DEFERRED OUTFLOWS OF RESOURCESAccumulated decrease in fair value of hedging derivatives 45,460,285 - Deferred Amount on Refunding 20,621,548 - Pension 129,153,221 -
Total Deferred Outflows of Resources 195,235,054 -
LIABILITIESAccounts Payable and Other Current Liabilities 67,777,574 700,559 Due to Other Agencies 3,345,109 - Estimated Unpaid Claims 13,100,000 - Matured Debt Payable 2,539,257 - Accrued Interest Payable 22,493,426 - Unearned Revenue 46,787,952 90,750 Long-Term Liabilities: Portion Due or Payable Within One Year: Bonds Payable 3,660,000 - Obligations Under Capital Lease 1,822,878 - Lease-Purchase Agreements Payable 37,133,445 - Compensated Absences Payable 11,680,801 - Estimated Insurance Claims Payable 5,752,720 - Net Pension Liability 9,418,772 - Portion Due or Payable After One Year: Bonds Payable 7,859,000 - Obligations Under Capital Lease 1,899,260 - Lease-Purchase Agreements Payable 1,255,481,178 - Compensated Absences Payable 103,348,004 - Estimated Insurance Claims Payable 7,988,786 - Hedging Derivative Instruments 45,460,285 - Other Post Employment Benefits 75,446,684 - Net Pension Liability 409,751,697 -
Total Liabilities 2,132,746,828 791,309
DEFERRED INFLOWS OF RESOURCESPension 239,787,903 -
NET POSITIONNet Investment in Capital Assets 2,077,277,202 22,760 Restricted for: Capital Projects 1,142,279,408 - Debt Service 83,830,552 - Food Service 18,392,977 - State Grants 6,642,154 517,004 State Categorical Programs 2,369,743 - Post-Secondary 25,695,166 - Unrestricted (deficit) (263,197,159) 643,874
Total Net Position 3,093,290,043$ 1,183,638$
The accompanying notes are an integral part of the basic financial statements.
Component Unit
ORANGE COUNTY PUBLIC SCHOOLSSTATEMENT OF NET POSITION
June 30, 2015
17

This page intentionally left blank.
18

Net
(E
xpen
se)
Rev
enu
e an
dC
han
ges
in N
et P
osi
tio
nP
rim
ary
Go
vern
men
tT
he
Fo
un
dat
ion
Op
erat
ing
Cap
ital
for
Ora
ng
eC
har
ges
fo
rG
ran
ts a
nd
Gra
nts
an
dG
ove
rnm
enta
lC
ou
nty
Pu
blic
Fu
nct
ion
s/P
rog
ram
sE
xpen
ses
Ser
vice
sC
on
trib
uti
on
sC
on
trib
uti
on
sA
ctiv
itie
sS
cho
ols
, In
c.P
rim
ary
Go
vern
men
t: G
over
nmen
tal A
ctiv
ities
:
Inst
ruct
ion
980,
500,
950
$
3,94
5,22
6$
-
$
-$
(9
76,5
55,7
24)
$
-
$
Pup
il P
erso
nnel
Ser
vice
s52
,618
,608
-
-
-
(52,
618,
608)
-
In
stru
ctio
nal M
edia
Ser
vice
s15
,715
,124
-
-
-
(15,
715,
124)
-
In
stru
ctio
n an
d C
urric
ulum
Dev
elop
men
t78
,648
,709
-
-
-
(78,
648,
709)
-
In
stru
ctio
nal S
taff
Tra
inin
g S
ervi
ces
56,3
62,0
38
-
-
-
(5
6,36
2,03
8)
-
Inst
ruct
iona
l Rel
ated
Tec
hnol
ogy
11,7
90,8
95
-
-
-
(1
1,79
0,89
5)
-
Boa
rd o
f Edu
catio
n4,
647,
303
-
-
-
(4
,647
,303
)
-
G
ener
al A
dmin
istr
atio
n11
,239
,101
-
-
-
(11,
239,
101)
-
S
choo
l Adm
inis
trat
ion
106,
137,
125
-
-
-
(1
06,1
37,1
25)
-
Fac
ilitie
s A
cqui
sitio
n &
Con
stru
ctio
n66
,466
,826
-
-
58
,900
,738
(7
,566
,088
)
-
F
isca
l Ser
vice
s6,
266,
407
-
-
-
(6
,266
,407
)
-
F
ood
Ser
vice
s84
,404
,556
10
,172
,084
78,6
19,5
99
-
4,
387,
127
-
Cen
tral
Ser
vice
s14
,750
,356
-
-
-
(14,
750,
356)
-
P
upil
Tra
nspo
rtat
ion
Ser
vice
s76
,109
,464
59
4,73
8
-
-
(75,
514,
726)
-
O
pera
tion
of P
lant
108,
568,
604
-
-
-
(1
08,5
68,6
04)
-
Mai
nten
ance
of P
lant
35,9
09,4
09
-
-
-
(3
5,90
9,40
9)
-
Adm
inis
trat
ive
Tec
hnol
ogy
Ser
vice
s21
,921
,750
-
-
-
(21,
921,
750)
-
C
omm
unity
Ser
vice
s10
,832
,534
6,
969,
103
-
-
(3,8
63,4
31)
-
Inte
rest
on
Long
-Ter
m D
ebt
53,1
74,8
13
-
-
-
(5
3,17
4,81
3)
-
Dep
reci
atio
n -
Una
lloca
ted
(a)
83,4
01,9
50
-
-
4,90
8,54
7
(7
8,49
3,40
3)
-
Tot
al P
rimar
y G
over
nmen
t1,
879,
466,
522
$
21,6
81,1
51$
78,6
19,5
99$
63
,809
,285
$
(1,7
15,3
56,4
87)
-
Co
mp
on
ent
Un
its
: T
he F
ound
atio
n fo
r O
rang
e C
ount
y P
ublic
S
choo
ls, I
nc.
1,95
4,43
9
-
2,02
0,43
4
-
-
65
,995
Tot
al C
ompo
nent
Uni
ts1,
954,
439
$
-$
2,02
0,43
4$
-$
-
65,9
95
Gen
eral
Rev
enue
s: T
axes
:
Pro
pert
y T
axes
, Lev
ied
for
Gen
eral
Pur
pose
s64
8,24
7,46
2
-
Pro
pert
y T
axes
, Lev
ied
for
Cap
ital P
roje
cts
139,
441,
378
-
Sal
es T
axes
209,
231,
028
-
Flo
rida
Edu
catio
n F
inan
ce P
rogr
am50
6,30
5,20
2
-
G
rant
s an
d C
ontr
ibut
ions
Not
Res
ticte
d to
Spe
cific
Pro
gram
s42
0,93
0,41
2
-
M
isce
llane
ous
19,8
22,2
34
-
U
nres
tric
ted
Inve
stm
ent E
arni
ngs
13,1
42,8
39
-
Tot
al G
ener
al R
even
ues
and
Tra
nsfe
rs1,
957,
120,
555
-
Cha
nges
in N
et P
ositi
on24
1,76
4,06
8
65
,995
Net
Pos
ition
- B
egin
ning
; as
rest
ated
2,85
1,52
5,97
5
1,11
7,64
3
Net
Pos
ition
- E
ndin
g3,
093,
290,
043
$
1,18
3,63
8$
(a)
Exc
lude
s di
rect
dep
reci
atio
n ex
pens
e of
pro
gram
s.
The
acc
ompa
nyin
g no
tes
to th
e ba
sic
finan
cial
sta
tem
ents
are
an
inte
gral
par
t of t
he fi
nanc
ial s
tate
men
ts.
Pro
gra
m R
even
ues
Co
mp
on
ent
Un
its
OR
AN
GE
CO
UN
TY
PU
BL
IC S
CH
OO
LS
ST
AT
EM
EN
T O
F A
CT
IVIT
IES
Fo
r th
e F
isca
l Yea
r E
nd
ed J
un
e 30
, 201
5
19

Other CapitalProjects - Nonmajor Total
General Capital Projects Governmental GovernmentalFund Fund Funds Funds
ASSETSCash 257,784,086$ 154,467,041$ 185,814$ 412,436,941$ Investments 116,642,457 864,752,659 262,983,426 1,244,378,542 Accounts Receivable 598,413 - 2,407 600,820 Interest Receivable - 907,297 135,371 1,042,668 Due From Other Funds 17,222,768 - - 17,222,768 Due From Internal Accounts 50,149 - - 50,149 Due From Other Agencies 14,266,258 29,516,185 19,118,423 62,900,866 Inventories 3,318,550 - 1,814,297 5,132,847
Total Assets 409,882,681$ 1,049,643,182$ 284,239,738$ 1,743,765,601$
LIABILITIES AND FUND BALANCESLiabilities: Salaries and Wages Payable 24,273,041$ -$ 2,023,012$ 26,296,053$ Payroll Deductions and Withholdings Payable 44,795 - - 44,795 Accounts Payable 13,711,654 5,895,891 1,850,728 21,458,273 Construction Contracts Payable 600,990 9,096,470 391,912 10,089,372 Construction Contracts Payable - Retained Percentage 86,064 8,129,066 205,276 8,420,406 Due to Other Funds - 15,919,460 1,303,308 17,222,768 Due to Internal Funds 2,689 - - 2,689 Due to Other Agencies 3,247,706 - 97,403 3,345,109 Matured Debt Payable - - 2,539,257 2,539,257 Sales Tax Payable 9,331 - - 9,331 Unearned Revenue - - 1,115,957 1,115,957
Total Liabilities 41,976,270 39,040,887 9,526,853 90,544,010
Fund Balances: Nonspendable 3,318,550 - 1,814,297 5,132,847 Spendable: Restricted 34,707,063 1,010,602,295 262,213,446 1,307,522,804 Assigned 249,568,939 - 10,685,142 260,254,081 Unassigned 80,311,859 - - 80,311,859
Total Fund Balances 367,906,411 1,010,602,295 274,712,885 1,653,221,591
Total Liabilities and Fund Balances 409,882,681$ 1,049,643,182$ 284,239,738$ 1,743,765,601$
The accompanying notes are an integral part of the basic financial statements.
ORANGE COUNTY PUBLIC SCHOOLSBALANCE SHEET
GOVERNMENTAL FUNDSJune 30, 2015
20

Total Fund Balances - Governmental Funds 1,653,221,591$
Amounts reported for governmental activities in the statement of net position are different because:
Capital assets, net of accumulated depreciation, used in governmental activities are notfinancial resources and, therefore, are not reported as assets in the governmental funds. Non-Depreciable Assets 373,514,462$ Depreciable Assets 3,005,799,124
3,379,313,586
Interest on long-term debt is accrued as a liability in the government-wide statementsbut is not recognized in the governmental funds until due, except for accrued interestreceived as part of a debt issue. Accrued Interest Payable - Government-Wide Statement of Net Position (22,493,426)
Internal service funds are used by management to charge the costs of its self-insuranceprograms and the print shop. The assets and liabilities of the internal servicefunds are included in governmental activities in the statement of net position, less furnitureand equipment, net of accumulated depreciation. Total Assets - Internal Service Funds 164,752,196$ Less, Total Liabilities - Internal Service Funds (73,971,868) Less, Depreciable Assets Reported Above (17,183)
90,763,145
Deferred outflows and inflows of resources related to pensions are applicable to future periods and, therefore, are not reported in the funds.
Deferred outflows of resources related to pensions 129,153,221$ Deferred inflows of resources related to pensions (239,787,903)
(110,634,682)
Deferred outflows of resources related to accumulated fair value of hedging derivatives are applicable to future periods and, therefore, are not reported in the funds. 45,460,285
Deferred outflows of resources related to the deferred amount on refunding 20,621,548 are applicable to future periods and, therefore, are not reported in the funds.
Long-term liabilities are not due and payable in the current period and; therefore, are notreported as liabilities in the governmental funds. Long-term liabilities at year-end consist of: Bonds Payable (11,519,000)$ Obligations Under Capital Lease (3,722,138) Certificates of Participation Payable (1,292,614,623) Compensated Absences Payable (115,028,805) Hedging Derivative Instruments (45,460,285) Other Post Employment Benefits (75,446,684) Net Pension Liability (419,170,469)
(1,962,962,004)
Total Net Position- Governmental Activities 3,093,290,043$
The accompanying notes are an integral part of the basic financial statements.
ORANGE COUNTY PUBLIC SCHOOLSRECONCILIATION OF THE GOVERNMENTAL FUNDS BALANCE SHEET
TO THE GOVERNMENT-WIDE STATEMENT OF NET POSITIONJune 30, 2015
21

Other CapitalProjects - Nonmajor Total
General Capital Projects Governmental GovernmentalFund Fund Funds Funds
REVENUESFederal Direct Sources: Reserve Officer Training Corps (ROTC) 1,289,826$ -$ -$ 1,289,826$ Other Federal Direct Sources - - 13,721,433 13,721,433
Total Federal Direct 1,289,826 - 13,721,433 15,011,259
Federal Through State Sources: Food Service - - 77,367,802 77,367,802 Other Federal Through State Sources 5,518,486 - 123,163,678 128,682,164
Total Federal through State 5,518,486 - 200,531,480 206,049,966
State Sources: Florida Education Finance Program 506,305,202 - - 506,305,202 Workforce Development 33,791,013 - - 33,791,013 Categorical Programs 232,218,078 - - 232,218,078 Food Service - - 1,251,797 1,251,797 CO&DS Withheld for SBE/COBI Bond - - 4,860,059 4,860,059 CO&DS Distribution 110,847 - 2,306,298 2,417,145 Public Education Capital Outlay - - 7,204,905 7,204,905 Other State Sources 3,612,964 - - 3,612,964
Total State Sources 776,038,104 - 15,623,059 791,661,163
Local Sources: Ad Valorem Taxes 648,247,462 - 139,441,378 787,688,840 Local Sales Taxes - 209,231,028 - 209,231,028 Impact Fees - 56,532,082 - 56,532,082 Food Service - - 10,172,084 10,172,084 Interest Income 2,434,138 8,277,716 1,804,853 12,516,707 Postsecondary Vocational Course Fees 2,800,310 - - 2,800,310 Other Local Sources 19,784,072 2,086,258 6,633,199 28,503,529
Total Local Sources 673,265,982 276,127,084 158,051,514 1,107,444,580
Total Revenues 1,456,112,398$ 276,127,084$ 387,927,486$ 2,120,166,968$
The accompanying notes are an integral part of the basic financial statements.
ORANGE COUNTY PUBLIC SCHOOLSSTATEMENT OF REVENUES, EXPENDITURES, AND
CHANGES IN FUND BALANCES - GOVERNMENTAL FUNDSFor the Fiscal Year Ended June 30, 2015
22

Other CapitalProjects - Nonmajor Total
General Capital Projects Governmental GovernmentalFund Fund Funds Funds
EXPENDITURESCurrent: Instruction 964,645,071$ -$ 41,515,852$ 1,006,160,923$ Pupil Personnel Services 41,549,249 - 12,704,008 54,253,257 Instructional Media Services 15,865,810 - 327,590 16,193,400 Instruction and Curriculum Development 51,034,505 - 29,937,238 80,971,743 Instructional Staff Training Services 29,598,775 - 28,158,744 57,757,519 Instructional Related Technology 11,988,248 - 160,838 12,149,086 Board of Education 4,723,998 - - 4,723,998 General Administration 6,744,697 - 4,644,560 11,389,257 School Administration 108,478,612 - 921,618 109,400,230 Facilities Acquisition & Construction 6,836,687 48,054,735 2,436,233 57,327,655 Fiscal Services 6,272,055 - 173,519 6,445,574 Food Services 534,456 - 85,312,947 85,847,403 Central Services 13,591,826 - 1,599,292 15,191,118 Pupil Transportation Services 61,749,471 - 7,278,386 69,027,857 Operation of Plant 109,663,661 - 375,076 110,038,737 Maintenance of Plant 35,760,573 - 13,570 35,774,143 Administrative Technology Services 20,212,983 - 1,941,954 22,154,937 Community Services 818,860 - 10,116,979 10,935,839 Capital Outlay: Facilities Acquisition & Construction 2,289,832 147,926,787 28,965,559 179,182,178 Other Capital Outlay 12,773,430 - 3,262,918 16,036,348 Debt Service: Principal - - 43,207,841 43,207,841 Interest and Fiscal Charges - - 60,306,054 60,306,054
Total Expenditures 1,505,132,799 195,981,522 363,360,776 2,064,475,097
Excess (Deficiency) of Revenues Over (Under) Expenditures (49,020,401) 80,145,562 24,566,710 55,691,871
OTHER FINANCING SOURCES (USES)Face Value of Refunding Bonds - - 8,569,000 8,569,000 Premium on Refunding Bonds - - 760,867 760,867 Refunding Lease-Purchase Agreements - - 413,255,000 413,255,000 Premium on Refunding Lease-Purchase Agreements - - 47,230,914 47,230,914 Payments to Refunding Bond Escrow Agent - - (477,069,241) (477,069,241) Proceeds from the Sale of Capital Assets 963,845 - - 963,845 Insurance Loss Recoveries 91,673 - - 91,673 Transfer In 7,204,905 - 116,664,481 123,869,386 Transfer Out - - (123,869,386) (123,869,386)
Total Other Financing Sources (Uses) 8,260,423 - (14,458,365) (6,197,942)
Net Change in Fund Balances (40,759,978) 80,145,562 10,108,345 49,493,929
Fund Balances, Beginning 408,666,389 930,456,733 264,604,540 1,603,727,662
Fund Balances, Ending 367,906,411$ 1,010,602,295$ 274,712,885$ 1,653,221,591$
The accompanying notes are an integral part of the basic financial statements.
(continued)
ORANGE COUNTY PUBLIC SCHOOLSSTATEMENT OF REVENUES, EXPENDITURES, AND
CHANGES IN FUND BALANCES - GOVERNMENTAL FUNDSFor the Fiscal Year Ended June 30, 2015
23

Net Change in Fund Balances - Governmental Funds 49,493,929$
Amounts reported for governmental activities in the statement of activities are different because:
Capital outlays are reported in governmental funds as expenditures. However, in thestatement of activities, the cost of those assets is allocated over their estimated useful livesas depreciation expense. This is the amount of capital outlays, donations, in excessof depreciation expense and gain on sale of capital assets in the current period.
Capital Outlay - Facilities and Construction 179,182,178$ Capital Outlay - Other Capital Outlay 16,036,348 Donated Assets 437,490 Net Loss on Sale of Capital Assets (10,370,118) Less, Depreciation Expense (93,284,990)
92,000,908
Proceeds of refunding debt are reported as other financing sources in the governmental funds, while payments to the escrow agent for advance-refunding of outstanding debt are shown as otherfinancing uses. Government-wide statements are affected only to the extent these amounts differ. Other long-term debt proceeds provide current financial resources to governmental funds, but issuingdebt increases long-term liabilities in the statement of net position. Repayment of long-term debt is anexpenditure in the governmental funds, but the repayment reduces long-term liabilities in the statementof net position. This is the net effect of these transactions.
Certificates of Participation (413,255,000)$ Premium on Certificates of Participation (47,230,914) Bonds (8,569,000) Principal Payments to Bond Escrow Agent 477,069,241
8,014,327
Repayment of long-term liabilities is an expenditure in the governmental funds, but the repaymentreduces long-term liabilities in the statement of net position.
Bonds Payable 4,190,000$ Obligations Under Capital Leases 5,681,236 Certificates of Participation 33,336,605
43,207,841
Interest on long-term debt is recognized as an expenditure in the governmental funds when due,but is recognized as interest accrues in the statement of activities.
Prior Year Accrual 24,994,490$ Less, Current Year Accrual 22,493,426
2,501,064
Deferred charges associated with long-term debt issued in a prior period are reported in thestatement of activities, but are not a current financial resource and, therefore, are not reportedin the governmental funds. This is the net increase in deferred charges during the current period. 3,869,311
In the statement of activities, the cost of compensated absences is measured by the amountsearned during the year, while in the governmental funds expenditures are recognized based onthe amounts actually paid for compensated absences. This is the net amount of compensated absencespaid in excess of the amount earned in the current period. (7,229,063)
Other Post-Employment Benefits (OPEB) costs are recorded in the governmental funds underthe pay-as-you-go method, but under the full accrual method in the Government-Widestatements.
Prior Year Accrual 79,408,945$ Less, Current Year Accrual 75,446,684
3,962,261 In the statement of activities, the cost of pension benefits is measured by the decrease in the
net pension liability during the year, while in the governmental funds, expenditures are recognizedbased on the amounts actually paid for the pension expense. This is the amount of the decreasein net pension liability in excess of the amount paid in the current period. 32,108,741
Internal service funds are used by management to charge the cost of certain activities, such asinsurance to individual funds. The net revenue of internal service funds is reportedwith governmental activities plus the depreciation reported above. 13,834,749
Change in Net Position - Governmental Activities 241,764,068$
The accompanying notes are an integral part of the basic financial statements.
For the Fiscal Year Ended June 30, 2015
ORANGE COUNTY PUBLIC SCHOOLSRECONCILIATION OF THE GOVERNMENTAL FUNDS
STATEMENT OF REVENUES, EXPENDITURES, AND CHANGES IN FUND BALANCESTO THE GOVERNMENT-WIDE STATEMENT OF ACTIVITIES
24

Variance withFinal Budget -
Original Final Actual Amounts Positive (Negative)REVENUESFederal Direct Sources: Reserve Officer Training Corps (ROTC) 1,096,182$ 1,096,182$ 1,289,826$ 193,644$
Total Federal Direct 1,096,182 1,096,182 1,289,826 193,644
Federal Through State Sources: Medicaid 4,300,000 4,300,000 5,518,486 1,218,486
Total Federal through State 4,300,000 4,300,000 5,518,486 1,218,486
State Sources: Florida Education Finance Program 522,449,147 522,449,147 506,305,202 (16,143,945) Workforce Development 33,401,545 33,401,545 33,791,013 389,468 Categorical Programs 216,281,688 216,281,688 232,218,078 15,936,390 CO&DS Withheld for SBE/COBI Bond 105,207 105,207 110,847 5,640 Other State Sources 600,000 600,000 3,612,964 3,012,964
Total State Sources 772,837,587 772,837,587 776,038,104 3,200,517
Local Sources: Ad Valorem Taxes 645,779,824 645,779,824 648,247,462 2,467,638 Interest Income 1,787,500 1,787,500 2,434,138 646,638 Postsecondary Vocational Course Fees 3,850,000 3,850,000 2,800,310 (1,049,690) Other Local Sources 14,093,470 14,093,470 19,784,072 5,690,602
Total Local Sources 665,510,794 665,510,794 673,265,982 7,755,188
Total Revenues 1,443,744,563 1,443,744,563 1,456,112,398 12,367,835
EXPENDITURESCurrent: Instruction 999,690,085 1,007,497,192 964,645,071 42,852,121 Pupil Personnel Services 40,910,106 41,891,976 41,549,249 342,727 Instructional Media Services 15,650,033 16,606,610 15,865,810 740,800 Instruction and Curriculum Development 48,277,493 52,061,772 51,034,505 1,027,267 Instructional Staff Training Services 27,322,691 30,314,162 29,598,775 715,387 Instructional Related Technology 12,266,972 12,070,583 11,988,248 82,335 Board of Education 4,126,927 4,914,427 4,723,998 190,429 General Administration 5,404,041 6,846,015 6,744,697 101,318 School Administration 101,920,229 109,291,569 108,478,612 812,957 Facilities Acquisition & Construction 7,114,646 6,924,814 6,836,687 88,127 Fiscal Services 7,439,708 6,430,380 6,272,055 158,325 Food Service - 555,469 534,456 21,013 Central Services 18,214,269 14,178,585 13,591,826 586,759 Pupil Transportation Services 61,370,513 61,956,255 61,749,471 206,784 Operation of Plant 114,172,463 113,302,723 109,663,661 3,639,062 Maintenance of Plant 33,096,837 35,959,417 35,760,573 198,844 Administrative Technology Services 47,395,781 46,240,132 20,212,983 26,027,149 Community Services 226,061 820,910 818,860 2,050 Capital Outlay: Facilities Acquisition & Construction - 2,289,832 2,289,832 - Other Capital Outlay - 12,773,430 12,773,430 - Debt Service: Interest and Fiscal Charges 105,269 105,269 - 105,269 Total Expenditures 1,544,704,124 1,583,031,522 1,505,132,799 77,898,723
Excess (Deficiency) of Revenues Over (Under) Expenditures (100,959,561) (139,286,959) (49,020,401) 90,266,558
OTHER FINANCIAL SOURCES Proceeds from Sale of Capital Assets - - 963,845 963,845 Loss Recoveries - - 91,673 91,673 Transfer In 20,329,382 20,329,382 7,204,905 (13,124,477) Total Other Financial Sources 20,329,382 20,329,382 8,260,423 (12,068,959)
Net Change in Fund Balance (80,630,179) (118,957,577) (40,759,978) 78,197,599
Fund Balance, Beginning 408,666,389 408,666,389 408,666,389 -
Fund Balance, Ending 328,036,210$ 289,708,812$ 367,906,411$ 78,197,599$
The accompanying notes are an integral part of the basic financial statements.
Budgeted Amounts
ORANGE COUNTY PUBLIC SCHOOLSSTATEMENT OF REVENUES, EXPENDITURES AND
CHANGES IN FUND BALANCE - BUDGET TO ACTUALGENERAL FUND
For the Fiscal Year Ended June 30, 2015
General Fund
25

GovernmentalActivities -
Internal ServiceFunds
ASSETSCurrent Assets: Cash 10,000,000$ Investments 136,476,467 Accounts Receivable 17,963,761 Interest Receivable 1,890 Deposits Receivable 225,000 Prepaid Items 50,000 Inventories 17,895 Total Current Assets 164,735,013 Noncurrent Assets: Furniture and Equipment 73,614 Less Accumulated Depreciation (56,431) Computer Software 1,100 Less Accumulated Depreciation (1,100) Total Noncurrent Assets 17,183
Total Assets 164,752,196
LIABILITIESCurrent Liabilities: Salaries and Wages Payable 23,561 Accounts Payable 1,434,805 Unearned Revenue 45,671,996 Estimated Unpaid Claims 18,852,720 Total Current Liabilities 65,983,082 Long-Term Liabilities: Estimated Insurance Claims Payable 7,988,786
Total Liabilities 73,971,868
NET POSITIONNet Investment in Capital Assets 17,183 Unrestricted 90,763,145
Total Net Position 90,780,328$
The accompanying notes are an integral part of the basic financial statements.
ORANGE COUNTY PUBLIC SCHOOLSSTATEMENT OF NET POSITION
PROPRIETARY FUNDSJune 30, 2015
26

GovernmentalActivities -
Internal ServiceFunds
OPERATING REVENUES Charges for Services 5,385,960$ Premium Revenues 197,029,690 Other Operating Revenues 685,153 Total Operating Revenues 203,100,803
OPERATING EXPENSES Salaries 827,337 Employees Benefits 316,336 Purchased Services 13,526,893 Energy Services 85,000 Material and Supplies 127,707 Capital Outlay 830 Claims Expenses 175,008,082 Depreciation 4,794
Total Operating Expenses 189,896,979
Operating Income 13,203,824
NONOPERATING REVENUES Interest 626,131
Total Nonoperating Revenues 626,131
Change in Net Position 13,829,955
Total Net Position, Beginning 76,950,373
Total Net Position, Ending 90,780,328$
The accompanying notes are an integral part of the basic financial statements.
For the Fiscal Year Ended June 30, 2015
ORANGE COUNTY PUBLIC SCHOOLSSTATEMENT OF REVENUES, EXPENSES, AND
CHANGES IN NET POSITIONPROPRIETARY FUNDS
27

GovernmentalActivities -
Internal ServiceFund
CASH FLOWS FROM OPERATING ACTIVITIES Receipts from Interfund Services Provided 202,214,065$ Payments to Suppliers of Goods or Services (186,077,250) Payments to Employees (1,167,389) Other Operating Cash Receipts 685,153
Net Cash Provided by Operating Activities 15,654,579
CASH FLOWS FROM INVESTING ACTIVITIES Investment Earnings 626,131 Purchases of Investments (13,803,918)
Net Cash Used in Investing Activities (13,177,787)
Net Increase in Cash 2,476,792
Cash, Beginning of Year 7,523,208
Cash, End of Year 10,000,000$
Reconciliation of Operating Income to Net Cash Provided by Operating Activities: Operating Income 13,203,824$ Adjustments to Reconcile Operating Income to Net Cash Provided by Operating Activities: Depreciation 4,794 Changes in Assets and Liabilities: Accounts Receivable (201,584) Deposits Receivable (70,000) Inventory 16,855 Accounts Payable (1,194,544) Salaries and Benefits Payable (23,716) Unearned Revenues 2,036,209 Estimated Unpaid Claims 1,882,741
Total Adjustments 2,450,755
Net Cash Provided by Operating Activities 15,654,579$
Noncash Investing Activities Net Increase in the Fair Value of Investments (163,755)$
The accompanying notes are an integral part of the basic financial statements.
ORANGE COUNTY PUBLIC SCHOOLSSTATEMENT OF CASH FLOWS
PROPRIETARY FUNDSFor the Fiscal Year Ended June 30, 2015
28

Agency FundsStudent and ClubActivities Funds
ASSETS Cash and Cash Equivalents 11,494,896$ Investments 3,196,701 Accounts Receivable, Net 41,222 Inventory 299,934
Total Assets 15,032,753$
LIABILITIES Accounts Payable 802,432$ Internal Accounts Payable 14,230,321
Total Liabilities 15,032,753$
The accompanying notes are an integral part of the basic financial statements.
ORANGE COUNTY PUBLIC SCHOOLSSTATEMENT OF FIDUCIARY ASSETS AND LIABILITIES
FIDUCIARY FUNDSJune 30, 2015
29

ORANGE COUNTY PUBLIC SCHOOLS
NOTES TO BASIC FINANCIAL STATEMENTS June 30, 2015
1. Summary of Significant Accounting Policies Reporting Entity Orange County Public Schools (the District) has direct responsibility for operation, control, and supervision of District schools and is considered a primary government for financial reporting. The District is considered part of the Florida system of public education. The governing body of the District is the Orange County District School Board (the Board), which is composed of eight elected members, seven board members elected by District and one Board Chairman elected at large. The appointed Superintendent of Schools (Superintendent) is the executive officer of the Board. Geographic boundaries of the District correspond with those of Orange County, Florida. Pursuant to Section 1001.51(11)(f), Florida Statutes, the Superintendent is responsible for keeping records and accounts of all financial transactions in the manner prescribed by the Florida State Board of Education. Criteria for determining if other entities are potential component units that should be reported within the District's basic financial statements are identified and described in the Governmental Accounting Standards Board’s (GASB) Codification of Governmental Accounting and Financial Reporting Standards, Sections 2100 and 2600. The application of these criteria provides for identification of any entities for which the Board is financially accountable and other organizations that the nature and significance of their relationship with the Board are such that exclusion would cause the District’s basic financial statements to be misleading or incomplete. As required by accounting principles generally accepted in the United States (GAAP), these basic financial statements present the District (the primary government) and its component units. The component units discussed below are included in the District’s reporting entity because of the significance of their operational or financial relationships with the District. Blended Component Units - The District’s employee group health and life insurance program, described in a subsequent note, is administered through the School Board of Orange County Employee Benefits Trust (Trust). Assets necessary to fund the program are transferred to the Trust; however, under the terms of the Trust Agreement, the School Board retains control of the assets. Due to the substantive economic relationship between the District and the Trust, the financial activities of the Trust are reported in the accompanying basic financial statements as an internal service fund. The Orange County School Board Leasing Corporation (Leasing Corporation) was formed to facilitate financing for the acquisition of facilities and equipment as further discussed in a subsequent note. The Board of Directors of the Leasing Corporation are members of the Board who elect to serve as ex-officio Directors. Due to the substantive economic relationship between the District and the Leasing Corporation, the financial activities of the Leasing Corporation are included in the accompanying basic financial statements as part of the debt service and capital project funds. Separate financial statements for the Leasing Corporation are not published. Discretely Presented Component Units - The component unit column in the government-wide financial statements includes the financial data of the Foundation for Orange County Public Schools, Inc. (the Foundation). The Foundation will be reported in a separate column in the basic financial statements to emphasize that it is legally separate from the District. The Foundation is a separate not-for-profit corporation organized and operated as a direct-support organization under Section 1001.453, Florida Statutes. The Foundation was formed to provide charitable
30

ORANGE COUNTY PUBLIC SCHOOLS
NOTES TO BASIC FINANCIAL STATEMENTS June 30, 2015
and educational aid to the District and to receive, hold, and administer property and to make expenditures for the benefit of the District. Because of the nature and significance of its relationship with the District, the Foundation is considered a component unit. An annual audit of the organization’s financial statements is conducted by independent certified public accountant and is filed in the District’s administrative office. Measurement Focus, Basis of Accounting and Financial Statement Presentation The accounting and financial reporting treatment applied to a fund is determined by its measurement focus. The basis of accounting refers to when revenues and expenditures are recognized in the accounts and reported in the financial statements. Basis of accounting relates to the timing of the measurement made, regardless of the measurement focus applied. Government-Wide Financial Statements – The Government-Wide Financial Statements are prepared under the economic resources measurement focus and the accrual basis of accounting. Revenues are recorded when earned and expenses are recorded at the time liabilities are incurred, regardless of when the related cash transaction takes place. Nonexchange transactions, in which the District gives or receives value without directly receiving or giving value in exchange, include property taxes, grants, entitlements and donations. On an accrual basis, revenue from property taxes is recognized in the fiscal year for which the taxes are levied. Revenue from grants, entitlements and donations is recognized in the fiscal year in which all eligibility requirements have been satisfied. The Statement of Net Position and the Statement of Activities present financial information about the District’s governmental activities. These statements include the financial activities of the government in its entirety, except for those that are fiduciary. Governmental activities, which normally are supported by taxes and inter-governmental revenues, are reported separately from business-type activities, which are generally supported by fees charged. The District currently does not have any business-type activities. The Statement of Net Position includes all assets, deferred outflows, liabilities, and deferred inflows of the District. The Statement of Activities presents a comparison between the direct expenses and program revenues for each function or program of the District’s governmental activities. Direct expenses are those that are specifically associated with a program or function and, therefore, are clearly identifiable to a particular function. Depreciation expenses associated with the District’s transportation and maintenance departments are allocated to the transportation and maintenance of plant functions, while remaining depreciation expenses are not readily associated with a particular function and are reported as unallocated. Amounts reported as program revenues include 1) charges for services provided to students for tuition, fees, rental, material, supplies, or other services, 2) operating grants and contributions, and 3) capital grants and contributions. Revenues that are not classified as program revenues, including all taxes, are presented as general revenues. The comparison of direct expenses with program revenues identifies the extent to which each governmental function is self-financing or draws from the general revenues of the District. The District eliminates from the Statement of Net Position and the Statement of Activities most interfund receivables and payables and transfers between funds as well as the transactions associated with its Internal Service Funds.
31

ORANGE COUNTY PUBLIC SCHOOLS
NOTES TO BASIC FINANCIAL STATEMENTS June 30, 2015
Fund Financial Statements – The Governmental Fund Financial Statements are prepared utilizing the current financial resource measurement focus and the modified accrual basis of accounting. Revenues are recognized in the accounting period in which they become susceptible to accrual, that is, both measurable and available. “Measurable” means the amount of the transaction can be determined and “available” means collectible within the current period or soon enough thereafter to be used to pay liabilities of the current period. Significant revenues “susceptible to accrual” include ad valorem taxes, reimbursable-type grants and interest on investments. The District considers revenues from ad valorem taxes as available if they are collected within sixty (60) days after year-end. Expenditures are recorded when the fund liability is incurred. However, exceptions include unmatured principal and interest on general long-term debt and accumulated sick and vacation pay, OPEB, claims and judgements and certain prepaid items which are recognized when due/paid. In applying the “susceptible to accrual” concept to revenues from federal and state sources, the legal contractual requirements of the numerous individual programs are used as guidance. There are, however, essentially two types of revenues. In one type, monies must be expended for the specific purpose or project before the District will receive any amounts; therefore, revenues are recognized based upon the occurrence of the expenditure. In the other type, monies are virtually unrestricted as to purpose of expenditure and are usually revocable only for failure to comply with prescribed legal and contractual requirements. These resources are reflected as revenues at the time of receipt or earlier if the “susceptible to accrual” criteria are met. In all cases, monies received before the revenue recognition criteria have been met are reported as deferred inflows or unearned revenue, as applicable. The Agency (Fiduciary) funds are purely custodial in nature (assets equal liabilities) and as such do not have a measurement focus. Agency funds use the accrual basis of accounting to recognize receivables and payables. The Proprietary Fund Financial Statements are prepared under the economic resources measurement focus and the accrual basis of accounting. Proprietary funds distinguish operating revenues and expenses from non-operating items. Operating revenues and expenses generally result from providing services and producing and delivering goods in connection with a proprietary fund’s principal ongoing operations. The principal operating revenues of the District’s internal service funds are for self-insurance (property, casualty, liability, and worker’s compensation), employee benefits (health and prescription), and printing provided to other funds. Operating expenses for the internal service funds include salaries, employee benefits, purchased services, energy services, materials and supplies, claims expenses, and depreciation on capital assets. All revenues and expenses not meeting this definition are reported as non-operating revenues and expenses. The fund statements provide information about the District’s funds, including fiduciary funds. Separate statements for each fund category – governmental, proprietary and fiduciary – are presented. The emphasis of fund financial statements is on major funds, each displayed in a separate column. All remaining governmental funds are aggregated and reported as non-major funds. The District reports the following major funds: General Fund - to account for all financial resources not required to be accounted for in another fund, and
for certain revenues from the State that are legally restricted to be expended for specific current operating purposes. The General Fund is the District’s primary operating fund.
32

ORANGE COUNTY PUBLIC SCHOOLS
NOTES TO BASIC FINANCIAL STATEMENTS June 30, 2015
Capital Projects - Other Capital Projects Fund - to account for the financial resources generated by certificates of participation, impact fees, lottery, sales tax and other local sources to be used for educational capital outlay needs, including new construction, renovation and remodeling projects and debt service payments.
Additionally the District reports the following non-major fund types: Special Revenue Funds - to account for the financial resources of the school food service program, certain
grant program resources, the extended day childcare program, and other such restricted resources. Debt Service Funds - to account for the accumulation of resources for, and the payment of, general long-
term debt principal, interest, and related debt issuance costs. Capital Projects Funds - to account for financial resources generated from allocations of state revenues and
by local capital improvement tax levy that are to be used for educational capital outlay needs, including new construction, renovation and remodeling projects.
Internal Service Funds - to account for the District's limited self-insurance programs and printing service
operations. Agency Funds - to account for resources of the school internal funds that are used to administer moneys
collected at all schools in connection with school, student athletic, class, and club activities. When both restricted and unrestricted resources are available for use, it is the District’s policy to use restricted resources first, and then unrestricted resources as they are needed. Budgetary Information The Board follows procedures established by State statutes and State Board of Education rules in establishing budget balances for governmental funds as described below: - Annually, budgets are prepared, public hearings are held, and original budgets are adopted for all
governmental fund types in accordance with procedures and time intervals prescribed by State Statutes and State Board of Education rules.
- Appropriations are controlled at the function level (e.g., instruction, pupil personnel services, and school
administration) and may be amended by resolution at any Board meeting prior to the due date for the annual financial report.
- Budgets are prepared using the same modified accrual basis as is used to account for governmental
funds. - Budgetary information is integrated into the accounting system and, to facilitate budget control, budget
balances are encumbered when purchase orders are issued. Appropriations lapse at fiscal year-end and encumbrances outstanding are honored from the subsequent year's appropriations.
- The reported budgetary data consists of the original budget as well as the final appropriated budget
after amendments approved by the Board.
33

ORANGE COUNTY PUBLIC SCHOOLS
NOTES TO BASIC FINANCIAL STATEMENTS June 30, 2015
Cash and Cash Equivalents Cash deposits are held in banks that qualify as public depositories under Florida law. All deposits are insured by Federal depository insurance and/or collateralized with securities held in Florida’s multiple financial institution collateral pool required by Sections 280.07 and 280.08, Florida Statutes. For the Internal Service Funds, the statement of cash flows considers cash as those accounts used as demand deposit accounts. Cash balances from all funds are combined and invested to extent available. Earnings are allocated monthly to each fund based on a rolling two month average balance of cash and investments. Investments Investments consist of amounts placed with various intergovernmental investment pools which hold a majority of U.S. government securities, municipal securities and repurchase agreements. The investment earnings are allocated to each fund based on a rolling two month average investment balance in that fund. Investments also consist the State of Florida’s Special Purpose Investment Account (SPIA) authorized in Section 17.61(1), Florida Statutes, Florida PRIME, Florida Education Investment Trust Fund (FEITF), corporate bonds, municipal bonds, commercial paper, and United States instrumentality securities. All investments are reported at fair value based on quoted market prices. The District’s investment in SPIA is part of an investment pool managed by the Florida Department of Treasury, where the District owns a share of the pool, not the underlying shares of the assets in the pool. The District relies on policies developed by the State Treasury for managing interest and credit risk for this external investment pool. The District’s investments in Florida PRIME, which the SBA indicates is a Securities and Exchange Commission 2a7-like external investment pool, are similar to money market funds in which shares are owned in the fund rather than the underlying investments. The District’s investments in the Florida Education Investment Trust Fund (FEITF), which FEITF indicates is a Securities and Exchange Commission 2a7-like external investment pool, are similar to money market funds in which shares are owned in the fund rather than the underlying investments. These investments are reported at fair value, which is amortized cost. Inventories Inventories consist of expendable supplies held for consumption in the course of District operations. Transportation, custodial and school supply inventories are stated at cost on a weighted average basis. Food service inventories are stated at cost on the last invoice basis, which approximates the first-in, first-out basis, except that United States Department of Agriculture donated foods are stated at their fair value as determined at the time of donation to the District’s food service program by the Florida Department of Agriculture and Consumer Services, Bureau of Food Distribution. The costs of inventories are recorded as expenditures when used rather than purchased. Capital Assets and Depreciation Expenditures for capital assets acquired or constructed for general District purposes are reported in the governmental fund that financed the acquisition or construction. The capital assets so acquired are reported at cost in the government-wide statement of net position, but are not reported in the governmental fund financial statements. Capital assets are defined by the District as those costing more than $1,000 for furniture, fixtures and equipment; motor vehicles; audio visual materials; computer software; improvements other than buildings; buildings and fixed equipment; and construction in progress and which have an estimated life of two or more years. All land purchases are capital assets regardless of cost. Such assets
34

ORANGE COUNTY PUBLIC SCHOOLS
NOTES TO BASIC FINANCIAL STATEMENTS June 30, 2015
are recorded at historical cost or estimated historical cost if purchased or constructed. Donated assets are recorded at fair value at the date of donation. The costs of normal maintenance and repairs that do not add to the values of the assets or materially extend assets lives are not capitalized and are expensed as incurred. Interest costs incurred during construction of capital assets are not considered material and are not capitalized as part of the cost of construction. Capital assets of the primary government, excluding land and construction in progress, are depreciated using the straight-line method over the following estimated useful lives:
Description Estimated Lives
Improvements other than buildings 15 yearsBuildings and fixed equipment 20 – 40 yearsFurniture, fixtures and equipment 5 - 15 yearsMotor Vehicles 5 – 10 yearsAudio visual materials and computer software 5 years
Current-year information relative to changes in capital assets is described in a subsequent note. Deferred Outflows/Inflows of Resources In addition to assets, the statement of financial net position reports separate section for deferred outflow of resources. This separate financial statement element, deferred outflows of resources, represents a consumption of net position that applies to a future period(s) and so will not be recognized as an outflow of resources (expense/expenditure) until that time. The District has three items that qualify for reporting in this category. They are accumulated decrease in fair value of hedging derivatives, deferred amount on refunding and pensions reported in the government-wide statements of net position. A deferred amount on refunding results from the difference in the carrying value of refunded debt and its reacquisition price. This amount is deferred and amortized over the shorter of the life of the refunded or refunding debt. In addition to liabilities, the statement of financial net position and a separate section for deferred inflow of resources. This separate financial statement element, deferred inflows of resources, represents an acquisition of net position that applies to a future period(s) and so will not be recognized as an inflow of resources (revenue) until that time. The District has one item that qualifies for reporting in this category, which are related to pensions. Unearned Revenue Unearned revenue consists primarily of health insurance premiums collected from employees during the fiscal year for the coverage period extending through the plan year end of September 30. Long-Term Liabilities Long-term liabilities that will be financed from resources to be received in the future by governmental funds are reported as liabilities in the government-wide statement of net position. Debt premiums and discounts, as well as deferred amounts on refunding, are deferred and amortized over the life of the debt using the effective interest method. Debt is reported net of the applicable bond premium or discount. Debt issuance costs are expensed as incurred.
35

ORANGE COUNTY PUBLIC SCHOOLS
NOTES TO BASIC FINANCIAL STATEMENTS June 30, 2015
In the governmental fund financial statements, bonds and other long-term obligations are not recognized as liabilities until due. Governmental fund types recognize debt premiums and discounts, as well as issuance costs and deferred amounts on refunding, during the current period. The face amount of debt issued is reported as another financing source while discounts on debt issuances and deferred amounts on refunding are reported as other financing uses. Issuance costs, whether or not withheld from the actual debt proceeds received, are reported as debt service expenditures. In the government-wide financial statements, compensated absences (i.e., paid absences for employee vacation leave and sick leave) are accrued as liabilities to the extent that it is probable that the benefits will result in termination payments. A liability is reported in the governmental fund financial statements only for the portion due and payable at year-end. Other Postemployment Benefits (OPEB) are reported in the government-wide financial statements. The District subsidizes the premium rates paid by Non-Medicare eligible retirees by allowing them to participate in the health plan at the blended group premium rates for both active and retired employees. OPEB is recorded by the District for the implicit subsidy for Non-Medicare eligible retirees because, on an actuarial basis, their current and future claims are expected to result in higher costs to the District than those of active employees. The District funds OPEB on a pay-as-you-go basis. As of October 1, 2014 the District makes healthcare available but no longer pays any portion of the healthcare benefits for Medicare eligible retirees. As a result no health care experience for this group, whether favorable or unfavorable, would reflect on the cost of insurance to the District. Additional information on OPEB is described in a subsequent note In the government-wide statement of net position, pension liabilities are recognized for the District’s proportionate share of each pension plan’s net pension liability. For purposes of measuring the net pension liability, deferred outflows of resources and deferred inflows of resources related to pension, and pension expense, information about the fiduciary net position of the Florida Retirement System (FRS) defined benefit plan and the Health Insurance Subsidy (HIS) defined benefit plan and additions to/deductions from the FRS’s and the HIS’s fiduciary net position have been determined on the same basis as they are reported by the FRS and HIS plans. For this purpose, benefit payments (including refunds of employee contributions are recognized when due and payable in accordance with benefit terms. Investments are reported at fair value. Changes in long-term debt for the current year are reported in a subsequent note. Fund Balance Flow Assumptions Sometimes the District will fund outlays for a particular purpose from both restricted and unrestricted sources (the total of restricted, assigned, and unassigned fund balance). In order to calculate the amounts to report as restricted, assigned, and unassigned fund balance in the governmental fund financial statements a flow assumption must be made about the order in which the resources are considered to be applied. It is the District’s procedure to consider restricted fund balance to have been depleted before using any of the components of unrestricted fund balance. Further, when the components of unrestricted fund balance can be used for the same purpose, assigned fund balance is depleted first followed by unassigned fund balance. Fund Balance Policies Fund balance of governmental funds is reported in various categories based on the nature of any limitations requiring the use of resources for specific purposes. The government itself can establish limitations on the use of resources through either a commitment (committed fund balance) or an assignment (assigned fund
36

ORANGE COUNTY PUBLIC SCHOOLS
NOTES TO BASIC FINANCIAL STATEMENTS June 30, 2015
balance). The Board does not have a policy regarding the commitment or assignment of fund balances, however, by resolution, the Board has given the ability to assign fund balance to the Superintendent and the Chief Financial Officer. As such, the District does not report any committed fund balance. Amounts in the assigned fund balance classification are intended to be used by the government for specific purposes. The District also assigns fund balance when appropriating fund balance to cover a gap between estimated revenue and appropriations in the subsequent year’s appropriated budget. State Revenue Sources Revenues from State sources for current operations are primarily from the Florida Education Finance Program administered by the Florida Department of Education (the Department) under the provisions of Section 1011.62, Florida Statutes. In accordance with this law, the District determines and reports the number of full-time equivalent (FTE) students and related data to the Department. The Department performs certain edit checks on the reported number of FTE and related data, and calculates the allocation of funds to the District. The District is permitted to amend its original reporting for a period of six months following the date of the original reporting. Such amendments may impact funding allocations for subsequent years. The Department may also adjust subsequent fiscal period allocations based upon an audit of the District's compliance in determining and reporting FTE and related data. Normally, such adjustments are treated as reductions or additions of revenue in the year when the adjustments are made. The State of Florida (the State) provides financial assistance to administer certain categorical educational programs. State Board of Education rules require that revenue earmarked for certain programs be expended only for the program that the money is provided, and require that the money not expended as of the close of the fiscal year be carried forward into the following year to be expended for the same categorical educational programs. The Department generally requires that categorical educational program revenues be accounted for in the General Fund. A portion of the fund balance of the General Fund is restricted in the governmental funds financial statements for the balance of categorical educational program resources. The State allocates gross receipts taxes, generally known as Public Education Capital Outlay money, to the District on an annual basis. The District is authorized to expend these funds only upon applying for and receiving an encumbrance authorization from the Department. A schedule of revenue from State sources for the current year is presented in a subsequent note. District Property Taxes The Board is authorized by State law to levy property taxes for district school operations, capital improvements, and debt service. Property taxes consist of ad valorem taxes on real and personal property within the District. The Orange County Property Appraiser determines the real and personal property values within the District. The Orange County Tax Collector then collects the taxes and remits them to the District. The Board adopted the fiscal year 2014-15 tax levy on September 09, 2014. Property values are assessed as of January 1 each year. Tax bills are mailed in October and taxes are payable between November 1 of the year assessed and March 31 of the following year at discounts of up to 4% for early payment. Taxes become delinquent after April 1 of the year following the year of assessment, taxes become an enforceable lien on property. State law provides for enforcement of collection of personal property taxes by seizure of the property to satisfy unpaid taxes, and for enforcement of collection of real property taxes by the sale of interest-bearing tax certificates to satisfy unpaid taxes. The procedures result in the collection of essentially all taxes prior to June 30 of the year following the year of assessment.
37

ORANGE COUNTY PUBLIC SCHOOLS
NOTES TO BASIC FINANCIAL STATEMENTS June 30, 2015
Property tax revenues are recognized in the government-wide financial statements when the Board adopts the tax levy. Property tax revenues are recognized in the governmental fund financial statements when the District receives taxes, except the revenue that is accrued for taxes collected by the Orange County Tax Collector at fiscal year-end but not yet remitted to the District. Because any delinquent taxes collected after June 30 would not be material, delinquent taxes receivable are not accrued and no delinquent tax revenue deferral is recorded. Millages and taxes levied for the current year are presented in a subsequent note. Federal Revenue Sources The District receives Federal awards for the enhancement of various educational programs. Federal awards are generally received based on applications submitted to, and approved by, various granting agencies. For Federal awards for which a claim to these grant proceeds is based on incurring eligible expenditures, revenue is recognized to the extent that eligible expenditures have been incurred. Impact of Recently Issued Accounting Principles In June 2012, the GASB issued Statement 68, Accounting and Financial Reporting for Pensions–an amendment of GASB Statement 27. GASB 68 improves accounting and financial reporting by state and local governments for pensions. It also improves information provided by state and local governmental employers about financial support for pensions that is provided by other entities. This Statement results from a comprehensive review of the effectiveness of existing standards of accounting and financial reporting for pensions with regard to providing decision-useful information, supporting assessments of accountability and inter-period equity, and creating additional transparency. This Statement is effective for fiscal years beginning after June 15, 2014. The District adopted this statement for fiscal year 2015. The implementation of Statement No. 68 resulted in a restatement of beginning net position, as well as related deferred outflows of resources and deferred inflows of resources due to recording of the District’s net pension liability on the statement of net position. In November 2013, the GASB issued Statement 71, Pension Transition for Contributions Made Subsequent to the Measurement Date – an amendment of GASB Statement 68. The objective of this Statement is to address an issue regarding application of the transition provisions of Statement No. 68, Accounting and Financial Reporting for Pensions. This Statement amends paragraph 137 of Statement 68 to require that, at transition, a government recognize a beginning deferred outflow of resources for its pension contributions, if any, made subsequent to the measurement date of the beginning net pension liability. This Statement is effective for fiscal years beginning June 15, 2014. The District adopted this statement for fiscal year 2015. The implementation of Statement No. 68 and 71 resulted in the reporting of the District’s net pension liability, as well as related deferred outflows of resources and deferred inflows of resources for its pension contributions made subsequent to the measurement date of the beginning net pension liability. In February 2015, the GASB issued Statement 72, Fair Value Measurement and Application. The objective of this Statement is to improve financial reporting by clarifying the definition of fair value for financial reporting purposes, establishing general principles for measuring fair value, providing additional fair value application guidance, and enhancing disclosures about fair value measurements. These improvements are based in part on the concepts and definitions established in Concepts Statement No. 6, Measurement of Elements of Financial Statements, and other relevant literature. The requirements of this Statement are effective for financial statements for periods beginning after June 15, 2015. Management is currently evaluating the impact of the adoption of this statement on the District’s financial statements.
38

ORANGE COUNTY PUBLIC SCHOOLS
NOTES TO BASIC FINANCIAL STATEMENTS June 30, 2015
GASB Statement 75, Accounting and Financial Reporting for Postemployment Benefits Other Than Pensions, effective for periods beginning after June 15, 2017, replaces the requirements of GASB Statement No. 45, Accounting and Financial Reporting by Employers for Postemployment Benefits Other Than Pensions. Among other things, GASB Statement No. 75 requires governments to report a liability on the face of the financial statements for the other postemployment benefits (“OPEB”) that they provide and requires governments in all types of OPEB plans to present more extensive note disclosures and required supplementary information about their OPEB liabilities. Management is currently evaluating the impact of the adoption of this statements on the District’s financial statements. Prior Period Restatement The District participates in the Florida Retirement System (FRS) defined benefit pension plan and the Health Insurance Subsidy (HIS) defined benefit plan administered by Florida Division of Retirement. As a participating employer, the District implemented GASB Statement No. 68, Accounting and Financial Reporting for Pensions, which requires employers participating in cost-sharing multiple-employer defined benefit pension plans to report the employers’ proportionate share of the net pension liabilities and related pension amounts of the defined benefit pension plans. The beginning net position of the District was decreased by $561,913,892. The District’s proportionate share of the net pension liabilities at July 1, 2014 totaled $419,170,469.
Governmental Activities
3,413,439,867$
(621,951,095)
60,037,203
Total prior period restatement (561,913,892)
Net position as restated, July 1, 2014 2,851,525,975$
Beginning net position as previously reported at June 30, 2014
Prior period restatement - Implementation GASB 68: Net pension liability, July 1, 2013Deferred outflows - District contibutions made during the fiscal year 2014, after the measurement date
39

ORANGE COUNTY PUBLIC SCHOOLS
NOTES TO BASIC FINANCIAL STATEMENTS June 30, 2015
2. Deposits and Investments As of June 30, 2015, the District had the following investments and maturities:
Investment MaturitiesLess Than
Investment Fair Value 6 Months 1 Year 2 Years 5 Years After
FL Special Purpose Investment Account (SPIA) 753,024,744$ 753,024,744$ -$ -$ -$ -$
FL Prime (formally SBA) 247,412,851 247,412,851 - - - -
Florida Education Investment Trust Fund 65,362,896 65,362,896 - - - -
Commercial Paper 797,624 797,624 - - - -
Money Market 13,929,148 13,929,148 - - - -
Certificates of Deposit 12,500,000 12,500,000 - - - -
Corporate Bonds 83,234,972 5,022,780 10,007,760 45,236,470 22,967,962 -
Obligations of United States Government
Agencies and Instrumentalities 162,879,913 4,012,114 10,280,534 51,122,723 97,464,542
Municpal Bonds 41,712,862 6,854,222 - 4,006,394 28,559,271 2,292,975
Total Investments, Primary Government 1,380,855,010$ 1,108,916,379$ 10,007,760$ 59,523,398$ 102,649,956$ 99,757,517$
Fiduciary Funds: FL Special Purpose Investment Account (SPIA) 3,196,701 3,196,701 - - - -
Total Investments, Reporting Entity 1,384,051,711$ 1,112,113,080$ 10,007,760$ 59,523,398$ 102,649,956$ 99,757,517$
Interest Rate Risk District policies limit the maturity of investments to a 5 year weighted average life as a means of limiting its exposure to fair value losses arising from rising interest rates. Also, at least 3 months of average disbursements should be invested in highly liquid funds with a maturity range of 0-90 days. The District has $204,592,775 in obligations of the United States Government Sponsored Agencies/Federal Instrumentalities and Municipal Bonds and $83,234,972 in Corporate Bonds. These securities included embedded options to call the entire security or a portion thereof, at the option of the issuer; or, depending on market conditions, the issuer may decide to leave the security intact, at stated interest rate, until final maturity. These securities have various call dates with final maturity dates being December 2028. Credit Risk Investments authorized by District policy are:
a. Direct Obligations of US Treasury; b. US Government Sponsored Agencies or Federal Instrumentalities; c. Investment in the Florida Prime Fund; d. Investment in the Florida Special Purpose Investment Account; e. Investment in the Florida Education Investment Trust Fund; f. Certificates of Deposit and Savings Accounts; g. Repurchase Agreements; h. State and/or Local Government Taxable or Tax-Exempt Debt; i. Corporate Notes; j. Commercial Paper; k. Money Market Funds;
40

ORANGE COUNTY PUBLIC SCHOOLS
NOTES TO BASIC FINANCIAL STATEMENTS June 30, 2015
Custodial Credit Risk Section 218.415(18), Florida Statutes, requires the District to earmark all investments and 1) if registered with the issuer or its agents, the investment must be immediately placed for safekeeping in a location that protects the governing body’s interest in the security; 2) if in a book entry form, the investment must be held for the credit of the governing body by a depository chartered by the Federal Government, the State, or any other State or territory of the United States which has a branch or principal place of business in this State, or by a national association organized and existing under the laws of the United States which is authorized to accept and execute trusts and which is doing business in this State, and must be kept by the depository in an account separate and apart from the assets of the financial institution; or 3) if physically issued to the holder but not registered with the issuer or its agents, must be immediately placed for safekeeping in a secured vault. The District’s $204,592,775 investments in obligations of United States Government Agencies and Instrumentalities and $83,234,972 in Corporate Bonds are held by the safekeeping agent, in the name of the District. Concentration of Credit Risk Composition of investment portfolio is limited by District policy to:
A. Direct Obligations of the U. S Treasury 100% B. U. S. Government Sponsored Agencies (Federal Instrumentalities) 80% C. Florida Prime Fund 100% D. Florida Special Purpose Investment Account 100% E. Florida Education Investment Trust Fund 100% F. Certificates of Deposit and Savings Accounts 100% G. Repurchase Agreements, fully collateralized by Direct Obligations of U. S. Government Securities 30% H. State and/or Local Govt. Taxable or Tax-Exempt Debt 20% I. Corporate Notes 20% J. Commercial Paper 30% K. Money Market Funds 100%
As of June 30, 2015, the District investments in the State of Florida Special Purpose Investment Account (SPIA) totaled $756,216,445 which is rated A+f by S&P with an effective duration of 2.67 years. These funds allocate investment earnings monthly. As of June 30, 2015, the District investments in the SBA totaled $247,412,851 which are 2a-7 like funds with a weighted maturity of 40 days and are AAA rated by S&P. These funds allocate investment earnings monthly. As of June 30, 2015, the District investments in the Florida Education Investment Trust Fund totaled $65,362,896. These funds are rated AAAm by S&P. The fund is also a 2a-7 fund with a weighted maturity of 32 days. As of June 30, 2015, the District investments in commercial paper were $797,624. These funds are rated A1, P1 as required by the district’s investment policy. The District holds these funds under a trust indenture in connection with several Certificates of Participation Series. All District investments are in compliance with District policy in relation to interest rate risk, credit risk, and concentration of credit risk.
41

ORANGE COUNTY PUBLIC SCHOOLS
NOTES TO BASIC FINANCIAL STATEMENTS June 30, 2015
3. Receivables The majority of receivables are due from other agencies. These receivables and the remaining accounts receivable are considered to be fully collectible. As such, no allowance for uncollectible accounts receivable is accrued. The following is a schedule of due from other agencies at June 30, 2015:
General Fund:Orange County Tax Collector
Unremitted Property Taxes 12,356,399$ Miscellaneous State Agencies 1,909,859
Other Capital Projects Fund:State of Florida - Department of Revenue
Unremitted Sales Tax Collections 16,048,202 Orange County Board of County Commissioners
Unremitted Impact Fee Collections 7,565,755 City of Orlando - Unremitted Impact Fee Collections 4,106,557 Miscellaneous Cities Impact Fee Collections 1,795,671
Nonmajor Governmental Funds:Capital Improvement Tax Fund:
Orange County Tax CollectorUnremitted Property Taxes 2,657,986
Capital Projects - Capital Outlay and Debt Service Fund:Florida Department of Education
Debt Service Bond Refunding 2,665,756 Special Revenue Funds:
Food Service Fund:Florida Department of Education
Meal Reimbursements 9,451,528 Other Federal Programs Fund:
Florida Department of EducationFederal Grant Reimbursements 2,382,656
Miscellaneous Grantor Agencies 1,051,006 ARRA Federal Programs Fund:
Florida Department of EducationFederal Grant Reimbursements 909,491
Total Due From Other Agencies 62,900,866$
42

ORANGE COUNTY PUBLIC SCHOOLS
NOTES TO BASIC FINANCIAL STATEMENTS June 30, 2015
4. Changes in Capital Assets Capital assets activity for the year ended June 30, 2015, is as follows: Primary Government
Balance BalanceJune 30, 2014 Additions Deletions June 30, 2015
Governmental Activities
Capital Assets Not Being Depreciated:Land 259,362,873$ 13,952,928$ -$ 273,315,801$ Construction in Progress 109,733,585 153,725,291 163,260,215 100,198,661
Total Capital Assets Not BeingDepreciated 369,096,458 167,678,219 163,260,215 373,514,462
Capital Assets Being Depreciated:Improvements Other Than Building 21,004,672 1,260,932 - 22,265,604 Buildings and Fixed Equipment 3,475,855,094 163,260,215 14,321,469 3,624,793,840 Furniture, Fixtures and Equipment 148,361,117 17,258,586 7,930,645 157,689,058 Motor Vehicles 122,805,764 9,456,760 7,391,122 124,871,402 Audio-Visual Materials 6,928 - - 6,928 Computer Software 7,388,291 1,518 53,968 7,335,841
Total Capital Assets BeingDepreciated 3,775,421,866 191,238,011 29,697,204 3,936,962,673
Less Accumulated Depreciation For:Improvements Other Than Building (12,226,965) (1,128,578) - (13,355,543) Buildings and Fixed Equipment (667,658,851) (69,243,907) (5,339,517) (731,563,241) Furniture, Fixtures and Equipment (93,224,660) (13,132,960) (6,848,134) (99,509,486) Motor Vehicles (81,936,258) (9,445,025) (7,085,467) (84,295,816) Audio-Visual Materials (6,928) - - (6,928) Computer Software (2,151,983) (334,520) (53,968) (2,432,535)
Total Accumulated Depreciation (857,205,645) (93,284,990) (19,327,086) (931,163,549)
Total Capital Assets BeingDepreciated, net 2,918,216,221 97,953,021 10,370,118 3,005,799,124
Governmental Activities CapitalCapital Assets, net 3,287,312,679$ 265,631,240$ 173,630,333$ 3,379,313,586$
All depreciation expense was charged to functions/programs of the primary government as follows:
Governmental Activities:Pupil Transportation Services 9,099,681$ Maintenance 783,359 Unallocated 83,401,950
Total Depreciation Expense 93,284,990$
43

ORANGE COUNTY PUBLIC SCHOOLS
NOTES TO BASIC FINANCIAL STATEMENTS June 30, 2015
5. Capital Leases The classes and amounts of property acquired by the District under capital leases are as follows:
Asset Description
Asset Balance
Buses, vehicles and equipment $13,219,028
The amortization of assets recorded under capital leases is included with depreciation expense in the accompanying financial statements. Following are the future minimum lease payments and the present value of the minimum lease payments as of June 30, 2015:
Fiscal Year Ending June 30 Total Principal Interest
2016 1,978,843$ 1,822,878$ 155,965$ 2017 1,978,843 1,899,260 79,583
Total Minimum Lease Payments 3,957,686 3,722,138 235,548
Less Interest (235,548) - -
Present Value of Minimum Payments 3,722,138$ 3,722,138$ 235,548$
The stated and imputed interest rate is 4.19%.
44

ORANGE COUNTY PUBLIC SCHOOLS
NOTES TO BASIC FINANCIAL STATEMENTS June 30, 2015
6. Certificates of Participation The District entered into a master financing arrangement on May 1, 1997, which was characterized as a lease-purchase agreement, with the Orange County School Board Leasing Corporation (Leasing Corporation) whereby the District secured financing of various educational facilities, vehicles, and equipment. The financing was accomplished through the issuance of Certificates of Participation (COPs):
Remaining FacilityAmount Amount Interest Rates Lease Term
Series Issued Outstanding (Percent) (19) Maturity (20)
2002-QZAB (1) $3,900,000 423,210$ None 20162006B (2) 111,165,000 111,165,000 4.25-5.00 20242007A (3) 165,425,000 14,635,000 4.00-5.00 20322008B (4) 105,000,000 105,000,000 Synthetic 4.412 20322008C (5) 47,845,000 37,720,000 Synthetic 4.615 20252008D (6) 49,255,000 44,950,000 4.00-5.00 20372008E (7) 51,020,000 51,020,000 Synthetic 5.112 20222009A (8) 185,000,000 185,000,000 4.00-5.50 20342009B-QSCB (9) 35,820,000 35,820,000 1.15 20242010A-QSCB (10) 36,229,000 36,229,000 None 20292012A (11) 58,530,000 34,670,000 5.00 20192012B (12) 79,295,000 75,935,000 3.00-5.00 20272013A (13) 19,290,000 19,190,000 2.00-5.00 20252014A (14) 63,840,000 63,840,000 5.00 20292015A (15) 107,420,000 107,420,000 2.88 20232015B (16) 59,325,000 59,325,000 2.71 20262015C (17) 132,340,000 132,340,000 5.00 20322015D (18) 114,170,000 114,170,000 5.00 2033
Total 1,228,852,210$
(1) On December 11, 2002, the master financing arrangement was amended and the Leasing Corporation issued COPs Series 2002-Qualified Zone Academy Bonds (QZAB). Under the terms of this lease agreement, the District is required to make 13 annual payments of $211,605 which are deposited with a Trustee and are to be invested with a qualified financial institution until maturity date and, when combined with interest earnings and net appreciation in market value, will be sufficient to pay off the principal balance, in full, at maturity on December 11, 2016.
(2) On March 9, 2006, the Leasing Corporation issued COPs Series 2006B to advance refund a portion of COPs Series 1999A and Series 2002A.
(3) On June 29, 2007, the Leasing Corporation issued COPs Series 2007A and Series 2007B to finance the cost of the acquisition and construction of certain educational facilities and related furniture, fixtures, equipment and technology; and costs associated with the issuance of Series 2007A and Series 2007B COPs.
(4) On April 11, 2008 the Leasing Corporation issued COPs Series 2008B to advance refund COPs Series 2007B.
(5) On June 30, 2008 the Leasing Corporation issued COPs Series 2008C to advance refund COPs Series 2000B.
45

ORANGE COUNTY PUBLIC SCHOOLS
NOTES TO BASIC FINANCIAL STATEMENTS June 30, 2015
(6) On September 8, 2008 the Leasing Corporation issued COPs Series 2008D to advance refund COPs Series 2002B.
(7) On September 8, 2008 the Leasing Corporation issued COPs Series 2008E to advance refund COPs Series 2007C.
(8) On March 11, 2009, the Leasing Corporation issued COPs Series 2009A to finance the cost of the acquisition and construction of certain educational facilities and related furniture, fixtures, equipment and technology; and costs associated with the issuance of Series 2009A COPs.
(9) On November 24, 2009, the Leasing Corporation issued COPs Series 2009B-Qualifed School Construction Bond (QSCB). The proceeds from the issue will be used for comprehensive updates for one middle school.
(10) On November 15, 2010, the Leasing Corporation issued COPs Series 2010A-Qualified School Construction Bond (QSCB). The proceeds from the issue will be used for comprehensive updates for two elementary schools and one new construction elementary school.
(11) On May 3, 2012, the Leasing Corporation issued COPs Series 2012A to advance refund COPs Series 2001A.
(12) On May 3, 2012, the Leasing Corporation issued COPs Series 2012B to advance refund COPs Series 2002A.
(13) On September 18, 2013, the Leasing Corporation issued COPs Series 2013A to advance refund a portion of COPs Series 2004A.
(14) On March 11, 2014, the Leasing Corporation issued COPs Series 2014A to advance refund a portion of COPs Series 2004A.
(15) On March 11, 2014, 2015, the Leasing Corporation entered into a forward refunding of the COPs Series 2005A. On April 1, 2015, the Leasing Corporation issued COPs Series 2015A.
(16) On June 10, 2014, the Leasing Corporation entered into a forward refunding of the COPs Series 2005B. On May 4, 2015, the leasing Corporation issued COPs Series 2015B.
(17) On December 9, 2014, the Leasing Corporation issued COPs Series 2015C to advance refund COPs Series 2006A.
(18) On January 21, 2015, the Leasing Corporation issued COPs Series 2015D to advance refund COPs Series 2007A.
(19) The lease payments are payable by the District, semiannually, on July 25 and January 25, except for the Series 2002 QZAB which is paid annually on December 10, and interest is paid by the Federal government in the form of annual tax credits to the bank or other eligible financial institution that holds the Certificates.
(20) As a condition of the financing arrangements, the District has given ground leases on District property to the Leasing Corporation, with a rental fee of $1 per year. The properties covered by the ground lease are, together with the improvement constructed thereon (facilities) and the vehicles and equipment purchased from the financing proceeds, leased back to the District. The lease agreements are automatically renewable through varying dates unless early terminated following the occurrence of an event of default or a non-appropriation of funds to make lease payments, all as described and defined in the leases. If the District fails to renew the lease and to provide for rent payments through to term, it may be required to surrender all facilities, vehicles, and equipment included under the terms of the lease agreements for the benefit of the securers of the COPs.
46

ORANGE COUNTY PUBLIC SCHOOLS
NOTES TO BASIC FINANCIAL STATEMENTS June 30, 2015
The District properties funded by the above-financing arrangement include the following:
Certificates Description of Property
Series 1997A Renovation and remodeling at eighteen elementary, four middle,two high schools, and two 9th grade centers.
Series 1999A Three new elementary and one new middle school; replacementof modular buildings; and a high school expansion/replacement.
Series 2000A Three elementary schools.
Series 2000B One high school.
Series 2001A Refunding of COPs, Series 1997A and 2000A.
Series 2002A Two alternative education schools; the replacement of oneelementary, one middle, and one high school; an addition at onemiddle school and concrete modular buildings at various sites.
Series 2002B Three new elementary schools and the replacement of one elementary school.
Series 2002-QZAB Comprehensive needs and renovation at one elementary school.
Series 2003 Financing and refinancing 295 premanufactured concrete modular structures.
Series 2004 Two middle schools, two elementary schools, portable classroomsto meet immediate needs and portable replacements.
Series 2005A Refunding of COPs, Series 1997A and 1999A.
Series 2005B Refunding of COPs, Series 2000A.
Series 2006A One replacement high school and four elementary schools.
Series 2006B Refunding of COPs, Series 1999A and 2002A.
Series 2007A/B One replacement high school, one replacement middle school, onetechnical center, one high school, and 2 elementary schools.
Series 2007C Refunding of COPs, Series 1997A
Series 2008B Refunding of COPs, Series 2007B
Series 2008C Refunding of COPs, Series 2000B
Series 2008D Refunding of COPs, Series 2002B
Series 2008E Refunding of COPs, Series 2007C
Series 2009A Two replacement high schools.
Series 2009B-QSCB Comprehensive needs and renovation at one middle school.
Series 2010A-QSCB Comprehensive needs at two elementary schools and one new elementary school.
Series 2012A Refunding of COPs, Series 2001A
Series 2012B Refunding of COPs, Series 2002A
Series 2013A Refunding of a portion of COPs, Series 2004A
Series 2014A Refunding of a portion of COPs, Series 2004A
Series 2015A Refunding of COPs, Series 2005A
Series 2015B Refunding of COPs, Series 2005B
Series 2015C Refunding of COPs, Series 2006A
Series 2015D Refunding of COPs, Series 2007A
47

ORANGE COUNTY PUBLIC SCHOOLS
NOTES TO BASIC FINANCIAL STATEMENTS June 30, 2015
The following is a schedule by years of future minimum lease payments under the above-reference lease agreements together with the present value of minimum lease payments as of June 30:
Total Principal Interest
2016 86,505,029$ 32,381,605$ 54,123,425$ 2017 91,892,081 38,116,605 53,775,477 2018 91,593,667 39,620,000 51,973,667 2019 91,934,756 41,675,000 50,259,756 2020 92,115,069 43,485,000 48,630,069
2021-2025 499,672,922 284,785,000 214,887,922 2026-2030 493,637,799 343,649,000 149,988,799 2031-2035 460,930,347 405,140,000 55,790,347
Total Minimum Lease Payments 1,908,281,671$ 1,228,852,210$ 679,429,462
Add: Unamortized Premium 63,762,413 63,762,413 - Less: Interest (679,429,462) - (679,429,462)
Total Certificates of Participation 1,292,614,623$ 1,292,614,623$ -$
Fiscal Year Ending June 30,
Hedged Debt and Hedging Derivative Instrument Payments As of June 30, 2015, aggregate debt service requirements of the District’s debt (fixed-rate and variable-rate) and net receipts/payments on associated hedging derivative instruments are as follows. These amounts assume that current interest rates on variable-rate bonds and the current reference rates of hedging derivative instruments will remain the same for their term. As these rates vary, interest payments on variable-rate bonds and net receipts/payments on the hedging derivative instruments will vary. Series 2008B COPs Swap Agreement - Swap Payments and Associated Debt. Assuming interest rates remain the same as at June 30, 2015, annual debt service requirements on the Series 2008B COPs and the interest rate swap would be as follows:
Fiscal YearEnding Interest Rate
June 30, Principal Interest Swaps, Net Total
2016 -$ 519,750$ 4,559,100$ 5,078,850$ 2017 - 519,750 4,559,100 5,078,850 2018 - 519,750 4,559,100 5,078,850 2019 - 519,750 4,559,100 5,078,850 2020 - 519,750 4,559,100 5,078,850
2021-2025 - 2,598,750 22,795,500 25,394,250 2026-2030 17,670,000 2,556,007 22,420,568 42,646,575 2031-2033 87,330,000 1,154,266 10,124,893 98,609,158
105,000,000$ 8,907,773$ 78,136,461$ 192,044,234$
48

ORANGE COUNTY PUBLIC SCHOOLS
NOTES TO BASIC FINANCIAL STATEMENTS June 30, 2015
Series 2008C COPs Swap Agreement - Swap Payments and Associated Debt. Assuming interest rates remain the same as at June 30, 2015, annual debt service requirements on the Series 2008C COPs and the interest rate swap would be as follows:
Fiscal YearEnding Interest Rate
June 30, Principal Interest Swap, Net Total2016 1,805,000$ 26,404$ 1,714,374$ 3,545,778$ 2017 1,920,000 25,141 1,632,337 3,577,477 2018 2,040,000 23,797 1,545,073 3,608,869 2019 2,160,000 22,369 1,452,355 3,634,723 2020 2,290,000 20,857 1,354,183 3,665,039
2021-2025 13,655,000 78,246 5,080,401 18,813,647 2026-2031 13,850,000 9,695 629,483 14,489,178
37,720,000$ 206,507$ 13,408,205$ 51,334,712$
Series 2008E COPs Swap Agreement - Swap Payments and Associated Debt. Assuming interest rates remain the same as at June 30, 2015, annual debt service requirements on the Series 2008E COPs and the interest rate swap would be as follows:
Fiscal YearEnding Interest Rate
June 30, Principal Interest Swaps, Net Total2016 -$ 234,692$ 2,572,428$ 2,807,120$ 2017 18,955,000 234,692 2,572,428 21,762,120 2018 19,975,000 147,499 1,616,717 21,739,216 2019 - 55,614 609,578 665,192 2020 - 55,614 609,578 665,192
2021-2023 12,090,000 166,842 1,828,733 14,085,575 51,020,000$ 894,953$ 9,809,463$ 61,724,416$
49

ORANGE COUNTY PUBLIC SCHOOLS
NOTES TO BASIC FINANCIAL STATEMENTS June 30, 2015
7. Derivative Instruments The fair value balances and notional amounts of derivative instruments outstanding at June 30, 2015, and the changes in fair value of such derivative instruments for the year then ended as reported in the 2015 financial statements are as follows:
Governmental ActivitiesHedging Derivatives: Classification Amount Classification Amount Notional
2008B Pay-fixed Interest Rate Swap Deferred Outflow (6,022,160)$ Liability (32,352,273)$ 105,000,000$ of Resources
2008C Pay-fixed Interest Rate Swap Deferred Outflow 61,750$ Liability (7,928,523)$ 37,720,000$ of Resources
2008E Pay-fixed Interest Rate Swap Deferred Outflow 1,179,887$ Liability (5,179,489)$ 51,020,000$ of Resources
Total Hedging Derivative Instruments (45,460,285)$
Change in Fair Value Fair Value at June 30, 2015
The fair values of the hedging derivatives take into consideration the prevailing interest rate environment and the specific terms and conditions of each swap. All fair values were estimated using the zero-coupon discounting method. This method calculates the future payments required by the swap, assuming that the current forward rates implied by the yield curve are the market’s best estimate of future spot interest rates. These payments are then discounted using the spot rates implied by the current yield curve for a hypothetical zero-coupon rate bond due on the date of each future net settlement payment on the swaps. Objective and Terms of Derivative Instruments The following table displays the objective and terms of the District’s derivative instruments outstanding at June 30, 2015, along with the credit rating of the associated counterparty:
AmountGovernmental Activities Effective Maturity of Cash CounterpartyHedging Derivatives: Objective Notional Date Date Received Terms Counterparty Credit Rating
Hedge changesin cash flows Pay 4.412%on the 2008B receive SIFMA Citibank, NA,
2008B Interest Rate Swap Certificates 105,000,000$ 6/29/2007 8/1/2032 N/A Swap Index New York A3,A,A
Hedge changesin cash flows Pay 4.615%on the 2008C receive SIFMA UBS AG,
2008C Interest Rate Swap Certificates 37,720,000$ 6/16/2002 8/1/2025 N/A Swap Index Stamford Branch A2,A,A
Hedge changesin cash flows Pay 5.112%on the 2008E receive SIFMA
2008E Interest Rate Swap Certificates 51,020,000$ 8/1/2007 8/1/2022 N/A Swap Index UBS AG A2,A,A
Credit Risk. The District is exposed to credit risk on hedging derivative instruments. The swap’s fair value represented the District’s credit exposure to the counterparty. Should the counterparty to this transaction fail to perform according to the terms of the swap contract, the District is left with variable rate bonds. As of June 30, 2015, the swap counterparties’ credit ratings are noted in the above table.
50

ORANGE COUNTY PUBLIC SCHOOLS
NOTES TO BASIC FINANCIAL STATEMENTS June 30, 2015
It is the District’s policy to enter into netting arrangements whenever it has entered into more than one derivative instrument transaction with counterparty. Under the terms of these arrangements, should one party become insolvent or otherwise default on its obligations, close-out netting provisions permit the nondefaulting party to accelerate and terminate all outstanding transactions and net the transactions’ fair values so that a single sum will be owed by, or owed to, the nondefaulting party. The District has no hedging derivative instruments in asset positions at June 30, 2015. Interest Rate Risk. The District is exposed to interest rate risk on its interest rate swaps. As the SIFMA swap index decreases, the District’s net payment on the swap increases which is offset by the variable rate paid on the hedged debt. Basis Risk. The District is exposed to basis risk should the variable rate it receives under the agreement be different than the rate it pays on its COPs. Under the requirements of the swap, the District receives a variable payment based on the SIFMA index from the counterparty. The 2008B and 2008E COPs are currently priced in a daily mode and the SIFMA index reflects weekly interest rates. The 2008C COPs are currently priced in a weekly mode and the SIFMA index reflects weekly interest rates. Should the weekly rates become higher than daily rates, the District maintains the option to change the mode on the COPs from a weekly mode to a daily mode. Termination risk. The District or its counterparties may terminate a derivative instrument if the other party fails to perform under the terms of the contract including if either parties credit rating falls below designated levels. 8. Bonds Payable Bonds payable at June 30, 2015, are as follows:
Bond Type
Interest Rates (Percent)
Annual Maturity To
Amount Outstanding
State School Bonds:
Series 2009-A 5.0 2019 $ 1,005,000
Series 2010-A Series 2014-B
4.0 5.0
2022 2019
1,945,000 8,569,000
Total Bonds payable $ 11,519,000 The various bonds were issued to finance capital outlay projects of the District.
51

ORANGE COUNTY PUBLIC SCHOOLS
NOTES TO BASIC FINANCIAL STATEMENTS June 30, 2015
State School Bonds The State Board of Education on behalf of the District issues these bonds. The bonds mature serially and are secured by a pledge of the District's portion of the State-assessed motor vehicle license tax. The State's full faith and credit is also pledged as security for these bonds. The State Board of Education and the State Board of Administration are responsible for administering principal and interest payments, investment of Debt Service Fund resources, and compliance with reserve requirements. Annual requirements to amortize all bonded debt outstanding as of June 30, 2015, are as follows:
9. Defeased Debt On January 14, 2015, the District issued COPs Series 2015C to advance refund COPs Series 2006A. The COPs Series 2015C of $132,340,000 (par value) with interest rate of 5.0% was issued to advance refund COPs Series 2006A with interest rates ranging from 4.6% to 5.0% and a par value of $145,215,000. The refunding of the 2006A Series resulted in an economic savings (difference between the present value of the debt service payments on the old and new debt) of $14,196,916 and decrease the District’s total debt service requirement by $20,447,484. The COPs final maturity was not extended and remains August 1, 2031. The COPs were issued at a net premium of $23,412,154 and after paying issuance costs of $600,900, the net proceeds were $158,368,820. The net proceeds from issuance of the COPs along with $3,218,566 of the District’s funds totaling $158,368,820 were used to provide funds for purpose of funding an escrow deposit, the proceeds of which will be applied to fully prepay on August 31, 2016, the COPs Series 2006A. As a result, $145,215,000 of the 2006A certificates are considered to be defeased in-substance and the liability for these certificates has been removed from the District’s government-wide financial statements in the current fiscal year. On February 25, 2015, the District issued COPs Series 2015D to advance refund a portion of the COPs Series 2007A. The COPs series 2015D of $114,170,000 (par value) with interest rates of 5.0% was issued to advance refund a portion of the COPs Series 2007A with interest rates ranging from 4.4% to 5.0% and a par value of $124,395,000. The refunding of the 2007A Series resulted in an economic savings (difference between the present value of the debt service payments on the old and new debt) of $12,906,875 and a decrease in the District’s total debt service requirement by $16,119,743. The COPs final maturity was not extended and remains August 1, 2032. The COPs were issued at a net premium of $23,818,760 and after paying issuance costs of $541,635, the net proceeds were $137,447,125. The net proceeds from issuance totaling $137,447,125 was used to provide funds for purpose of funding an escrow deposit, the proceeds of
Fiscal year ending June 30, Principal Interest Total
2016 $ 3,660,000 $ 598,732 $ 4,258,732 2017 3,067,000 381,860 3,448,860 2018 2,762,000 228,510 2,990,510 2019 837,000 90,410 927,410 2020 593,000 51,460 644,460
2021-2022 600,000 42,750 642,750
$ 11,519,000 $ 1,393,722 $ 12,912,722
52

ORANGE COUNTY PUBLIC SCHOOLS
NOTES TO BASIC FINANCIAL STATEMENTS June 30, 2015
which will be applied to fully prepay on August 1, 2017, the COPs Series 2007A. As a result, $124,395,000 of the 2007A certificates are considered to be defeased in-substance and the liability for these certificates has been removed from the District’s government-wide financial statements in the current fiscal year. On May 4, 2015, the District issued COPS Series 2015A to advance refund COPs Series 2005A. The COPs Series 2015A of $107,420,000 (par value) with interest rate of 2.9% was issued to advance refund COPs Series 2005A with interest rate ranging from 4.1% to 5.0% and a par value of $105,950,000. The refunding of the 2005A Series resulted in an economic savings of $8,792,995 (difference between the present value of the debt service payments on the old and new debt) which will decrease the District’s total debt service requirement by $12,666,005. The COPs final maturity was not extended and remains August 1, 2022. After paying issuance costs of $194,109, the net proceeds of the COPs issuance were $107,420,000. The net proceeds from issuance of the COPs along with $4,228.383 of the district funds totaling $111,454,274 were used to provide funds for purpose of funding an escrow deposit, the proceeds of which will be applied to fully prepay on August 1, 2015 the COPs Series 2005A. As a result, $105,950,000 of the 2005A certificates are considered defeased in-substance and the liability for these certificates has been removed from the District’s government-wide financial statements in the current fiscal year. On May 4, 2015, the District issued COPS Series 2015B to advance refund COPs Series 2005B. The COPs Series 2015B of $59,325,000 (par value) with interest rate of 2.7% were issued to advance refund COPs Series 2005B with interest rate ranging from 3.8% to 5.0% and a par value of $58,835,000. The refunding of the 2005B Series resulted in an economic savings (difference between the present value of the debt service payments on the old and new debt) of $9,346,858 which will decrease the District’s total debt service requirement by $11,110,411. The COPs final maturity was not extended and remains August 1, 2025. After paying issuance costs of $134,191, the net proceeds of the COPs issuance were $59,190,809. The net proceeds from issuance along with $1,100,696 of the District funds totaling $60,291,505 were used to provide funds for purpose of funding an escrow deposit, the proceeds of which will be applied to fully prepay on August 1, 2015 the COPs Series 2005B. As a result, $58,835,000 of the 2005B certificates are considered to be defeased in-substance and the liability for these certificates has been removed from the District’s government-wide financial statements in the current fiscal year. The Board defeased in-substance certain outstanding bonds and certificates of participation (COPs) by placing a portion of the proceeds of new bonds and new COPs in an irrevocable trusts to provide for all future debt service payments on the old debt. Accordingly, the trust account assets and the liability for the in-substance defeased COPs are not included in the District’s financial statements. On June 30, 2015, debt considered defeased in-substance are as follows:
AmountDebt Issues Outstanding
Certificates of Participation, Series 2005A 105,950,000$ Certificates of Participation, Series 2005B 58,835,000 Certificates of Participation, Series 2006A 145,215,000 Certificates of Participation, Series 2007A 124,395,000
Total Defeased Debt 434,395,000$
53

ORANGE COUNTY PUBLIC SCHOOLS
NOTES TO BASIC FINANCIAL STATEMENTS June 30, 2015
10. Changes in Long-Term Liabilities The following is a summary of changes in long-term liabilities:
Balance Balance Due InDescription June 30, 2014 Additions Deductions June 30, 2015 One Year
Certificates of Participation 1,286,123,813$ 413,255,000$ 470,526,603$ 1,228,852,210$ 32,381,605$ Add: Unamortized COPs
Premium (Discount) 30,473,505 47,230,914 13,942,006 63,762,413 4,751,840 Total Certificates of
Participation 1,316,597,318 460,485,914 484,468,609 1,292,614,623 37,133,445
Bonds Payable 16,325,000 8,569,000 13,375,000 11,519,000 3,660,000 Obligations Under Capital
Lease 9,403,375 - 5,681,237 3,722,138 1,822,878 Estimated Insurance Claims
Payable 12,458,765 9,258,045 7,975,304 13,741,506 5,752,720 Compensated Absences 107,799,742 18,115,850 10,886,787 115,028,805 11,680,801 Other Post-Employment Benefits 79,408,945 - 3,962,261 75,446,684 - Net Pension Liability 621,951,095 28,011,197 230,791,823 419,170,469 9,418,772 Derivative Instrument 40,679,761 6,022,160 1,241,636 45,460,285 -
Total 2,204,624,001$ 530,462,166$ 758,382,657$ 1,976,703,510$ 69,468,616$
For the governmental activities, compensated absences and other postemployment benefits are generally liquidated with resources of the General Fund. The estimated insurance claims are generally liquidated with resources of the Internal Service Funds. 11. Fund Balance Reporting Governmental Accounting Standards Board (GASB) has issued Statement No. 54, Fund Balance Reporting and Governmental Fund Type Definitions (GASB 54) to provide a more structured classification of fund balance and to improve the usefulness of fund balance reporting to the users of the District’s financial statements. The reporting standard establishes a hierarchy for fund balance classifications and the constraints imposed on the uses of those resources. GASB 54 provides for two major types of fund balances for governmental funds, which are nonspendable and spendable. Nonspendable fund balances are balances that cannot be spent because they are not expected to be converted to cash or they are legally or contractually required to remain intact. Examples of this classification are prepaid items, inventories, and principal (corpus) of an endowment fund. The District reports its inventories as nonspendable and does not have any prepaid items or nonspendable funds related to endowments. In addition to the nonspendable fund balance, GASB 54 has provided a hierarchy of spendable fund balances, based on spending constraints. Restricted - Fund balances that are constrained by external parties, constitutional provisions, or enabling legislation. Committed - Fund balances that contain self-imposed constraints of the government from its highest level of decision making authority such as school board resolutions.
54

ORANGE COUNTY PUBLIC SCHOOLS
NOTES TO BASIC FINANCIAL STATEMENTS June 30, 2015
Assigned - Fund balances that contain self-imposed constraints of the government to be used for a particular purpose. Unassigned – Fund balance of the general fund that does not have a constraint for any particular purpose. The District has classified its fund balances with the following hierarchy: Nonspendable: The District has inventories totaling $5,132,847 that are classified as nonspendable. Spendable: The District has classified the spendable fund balances as Restricted, Assigned and Unassigned and considered each to have been spent when expenditures are incurred. The District does not have a policy regarding the commitment or assignment of fund balances, however, by resolution, the Board has given the ability to assign fund balance to the Superintendent and the Chief Financial Officer. As such, the District does not report any Committed fund balance. When restricted, assigned, and unassigned funds are available for use, the District’s procedures are to use the restricted funds first, followed by the assigned funds and then the unassigned funds last. Restricted for State Categorical Programs, State Grants, Food Service, Debt Service and Capital Projects: Federal Laws, Florida Statutes and local ordinances require that certain revenues be specifically designated for the purposes of state categorical programs, food service, debt service, and capital projects. These funds have been included in the restricted category of fund balance. The restricted fund balances totaled $1,307,230,804 and represented $2,369,743 in State categorical programs, $25,695,166 Post Secondary Schools Rollover budget, $6,642,154 in State Grants, $18,392,977 in food service, $106,323,978 in debt service and $1,148,098,786 in capital projects. Assigned for School Operations and Other Purposes: The assigned fund balances totaled $260,254,081. For the General Fund, the Chief Financial Officer of the Board has assigned the OPEB liability of $75,446,684; Board Projects of $82,238,005; and K-12 School Rollover Budgets of $44,392,030. Also for the General Fund, the District reports as assigned outstanding purchase obligations of $6,329,266 that have not been previously reported as restricted and $41,162,954 needed to eliminate expected expenditures over expected revenues in the subsequent year budget approved by the Board. In addition, $10,685,142 of positive fund balance in non-General Funds that has not been reported as nonspendable or restricted is reported as assigned fund balance. Unassigned: The unassigned fund balance for the General Fund is $80,311,859.
55

ORANGE COUNTY PUBLIC SCHOOLS
NOTES TO BASIC FINANCIAL STATEMENTS June 30, 2015
Capital Projects -Other
Capital Nonmajor TotalProjects Governmental Governmental
General Fund Fund Funds FundsFund Balances: Nonspendable: Inventories General Fund 3,318,550$ -$ -$ 3,318,550$ Special Revenues - Food Service - - 1,814,297 1,814,297
Restricted: Categorical Programs 2,369,743 - - 2,369,743
Post Secondary Rollover Budgets 25,695,166 25,695,166 State Grants 6,642,154 - - 6,642,154 Special Revenues - Food Service - - 18,392,977 18,392,977 Debt Service - - 106,323,978 106,323,978 Capital Projects - 1,010,602,295 137,496,491 1,148,098,786
Assigned: School Operations:
Encumbrances 6,329,266 - - 6,329,266 Board Projects 82,238,005 - - 82,238,005 K-12 Schools Rollover Budgets 44,392,030 - - 44,392,030 Next Year's Budget Deficit 41,162,954 - - 41,162,954 Other Purposes OPEB 75,446,684 - - 75,446,684 Special Revenues - Other - - 10,685,142 10,685,142
Unassigned: 80,311,859 - - 80,311,859
Total Fund Balance 367,906,411$ 1,010,602,295$ 274,712,885$ 1,653,221,591$
Major Funds
The District has not established a contingency reserve or “Rainy Day Fund”. Instead the Board has approved in the budget to set aside 3 percent of recurring budgeted revenues at the beginning of each year to cover unforeseen events (e.g. revenue shortfalls, student enrollment under projections, etc.). At the end of fiscal year, the unassigned general fund balance was $80,311,859 or 4.2 percent of general fund total budgeted revenues for fiscal year 2016.
56
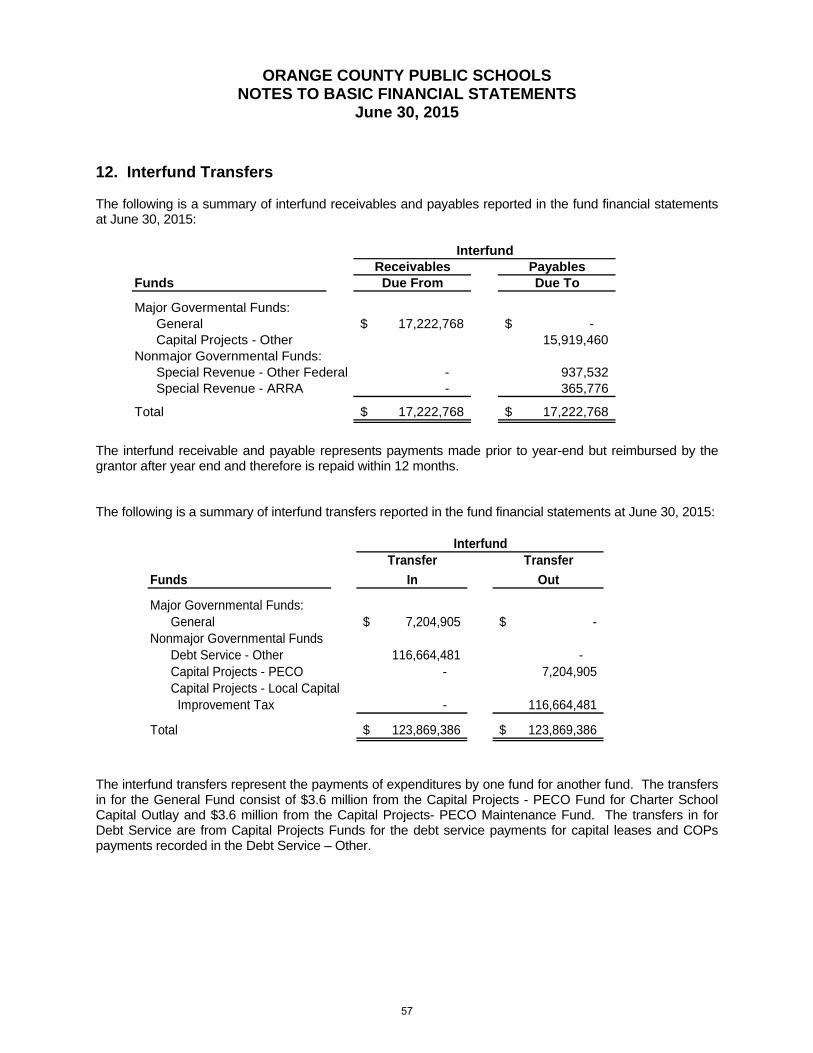
ORANGE COUNTY PUBLIC SCHOOLS
NOTES TO BASIC FINANCIAL STATEMENTS June 30, 2015
12. Interfund Transfers The following is a summary of interfund receivables and payables reported in the fund financial statements at June 30, 2015:
Receivables PayablesFunds Due From Due To
Major Govermental Funds:General 17,222,768$ -$ Capital Projects - Other 15,919,460
Nonmajor Governmental Funds: Special Revenue - Other Federal - 937,532 Special Revenue - ARRA - 365,776
Total 17,222,768$ 17,222,768$
Interfund
The interfund receivable and payable represents payments made prior to year-end but reimbursed by the grantor after year end and therefore is repaid within 12 months. The following is a summary of interfund transfers reported in the fund financial statements at June 30, 2015:
Transfer Transfer
Funds In Out
Major Governmental Funds:General 7,204,905$ -$
Nonmajor Governmental FundsDebt Service - Other 116,664,481 - Capital Projects - PECO - 7,204,905 Capital Projects - Local Capital Improvement Tax - 116,664,481
Total 123,869,386$ 123,869,386$
Interfund
The interfund transfers represent the payments of expenditures by one fund for another fund. The transfers in for the General Fund consist of $3.6 million from the Capital Projects - PECO Fund for Charter School Capital Outlay and $3.6 million from the Capital Projects- PECO Maintenance Fund. The transfers in for Debt Service are from Capital Projects Funds for the debt service payments for capital leases and COPs payments recorded in the Debt Service – Other.
57
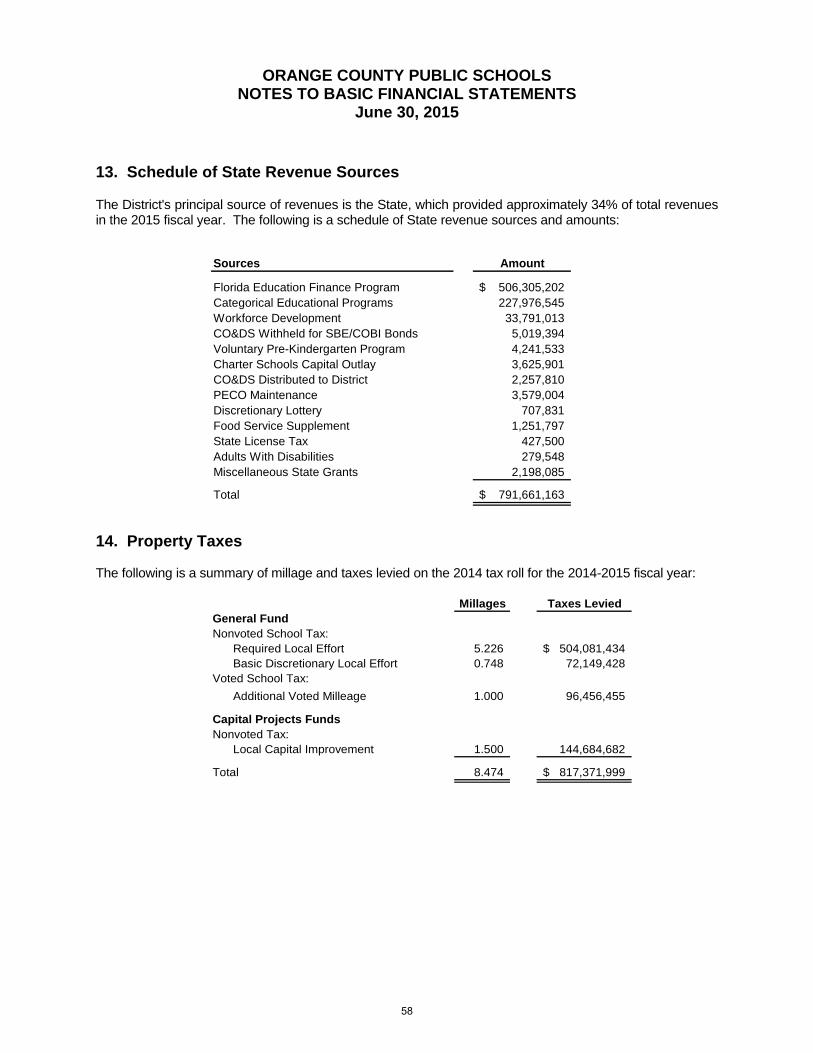
ORANGE COUNTY PUBLIC SCHOOLS
NOTES TO BASIC FINANCIAL STATEMENTS June 30, 2015
13. Schedule of State Revenue Sources The District's principal source of revenues is the State, which provided approximately 34% of total revenues in the 2015 fiscal year. The following is a schedule of State revenue sources and amounts:
Sources Amount
Florida Education Finance Program 506,305,202$ Categorical Educational Programs 227,976,545 Workforce Development 33,791,013 CO&DS Withheld for SBE/COBI Bonds 5,019,394 Voluntary Pre-Kindergarten Program 4,241,533 Charter Schools Capital Outlay 3,625,901 CO&DS Distributed to District 2,257,810 PECO Maintenance 3,579,004 Discretionary Lottery 707,831 Food Service Supplement 1,251,797 State License Tax 427,500 Adults With Disabilities 279,548 Miscellaneous State Grants 2,198,085
Total 791,661,163$
14. Property Taxes The following is a summary of millage and taxes levied on the 2014 tax roll for the 2014-2015 fiscal year:
Millages Taxes LeviedGeneral FundNonvoted School Tax:
Required Local Effort 5.226 504,081,434$ Basic Discretionary Local Effort 0.748 72,149,428
Voted School Tax:
Additional Voted Milleage 1.000 96,456,455
Capital Projects FundsNonvoted Tax:
Local Capital Improvement 1.500 144,684,682
Total 8.474 817,371,999$
58

ORANGE COUNTY PUBLIC SCHOOLS
NOTES TO BASIC FINANCIAL STATEMENTS June 30, 2015
15. State Retirement Programs Florida Retirement System. The Florida Retirement System (FRS) was created in Chapter 121, Florida Statutes, to provide a defined benefit pension plan for participating public employees. The FRS was amended in 1998 to add the Deferred Retirement Option Program under the defined benefit plan and amended in 2000 to provide a defined contribution plan alternative to the defined benefit plan for FRS members effective July 1, 2002. This integrated defined contribution pension plan is the FRS Investment Plan. Chapter 112, Florida Statutes, established the Retiree Health Insurance Subsidy (HIS) Program, a cost sharing multiple-employer defined benefit pension plan, to assist retired members of any state administered retirement system in paying the costs of health insurance. Essentially all regular employees of the District are eligible to enroll as members of the State-administered FRS. Provisions relating to the FRS are established by Chapters 121 and 122, Florida Statutes; Chapter 112, Part IV, Florida Statutes; Chapter 238, Florida Statutes; and FRS Rules, Chapter 60S, Florida Administrative Code; wherein eligibility, contributions, and benefits are defined and escribed in detail. Such provisions may be amended at any time by further action from the Florida Legislature. The FRS is single retirement system administered by the Florida Department of Management Services, Division of Retirement, and consists of the two cost-sharing, multiple-employer defined benefit plans and other nonintegrated programs. A comprehensive annual financial report of the FRS, which includes its financial statements, required supplementary information, actuarial report, and other relevant information, is available from the Florida Department of Management Services’ Web site (www.dms.myflorida.com). The District’s pension expense totaled $16,535,278 for the fiscal year ended June 30, 2015. Plan Description. The FRS Pension Plan (Plan) is a cost-sharing multiple-employer defined benefit pension plan, with a Teachers’ Retirement System, Plan E and a Deferred Retirement Option Program (DROP) for eligible employees. The general classes of membership are as follows:
Regular Class – Members of the FRS who do not qualify for membership in the other classes.
Elected County Officers Class – Members who hold specified elective offices in local government.
Senior Management Service Class (SMSC) – Members in senior management level positions.
Employees enrolled in the Plan prior to July 1, 2011, vest at six years of creditable service and employees enrolled in the Plan on or after July 1, 2011, vest at eight years of creditable service. All vested members, enrolled prior to July 1, 2011, are eligible for normal retirement benefits at age 62 or at any age after 30 years of service. DROP, subject to provisions of Section 121.091, Florida Statutes, permits employees eligible for normal
retirement under the Plan to defer receipt of monthly benefit payments while continuing employment with
an FRS employer. An employee may participate in DROP for a period not to exceed 60 months after
electing to participate, except that certain instructional personnel may participate for up to 96 months.
During the period of DROP participation, deferred monthly benefits are held in the FRS Trust Fund and
accrue interest. The net pension liability does not include amounts for DROP participants, as these
members are considered retired and are not accruing additional pension benefits.
59

ORANGE COUNTY PUBLIC SCHOOLS
NOTES TO BASIC FINANCIAL STATEMENTS June 30, 2015
Benefits Provided. Benefits under the Plan are computed on the basis of age and/or years of service,
average final compensation, and service credit. Credit for each year of service is expressed as a
percentage of the average final compensation. For members initially enrolled before July 1, 2011, the
average final compensation is the average of the five highest fiscal years’ earnings; for members initially
enrolled on or after July 1, 2011, the average final compensation is the average of the eight highest fiscal
years’ earnings. The total percentage value of the benefit received is determined by calculating the total
value of all service, which is based on the retirement class to which the member belonged when the
service credit was earned. Members are eligible for in-line-of-duty or regular disability and survivors’
benefits. The following chart shows the percentage value for each year of service credit earned:
Class, Initial Enrollment, and Retirement Age/Years of Service % Value
Regular Class members initially enrolled before July 1, 2011 Retirement up to age 62 or up to 30 years of service 1.60 Retirement at age 63 or with 31 years of service 1.63 Retirement at age 64 or with 32 years of service 1.65 Retirement at age 65 or with 33 or more years of service 1.68
Regular Class members initially enrolled on or after July 1, 2011 Retirement up to age 65 or up to 33 years of service 1.60 Retirement at age 66 or with 34 years of service 1.63 Retirement at age 67 or with 35 years of service 1.65 Retirement at age 68 or with 36 or more years of service 1.68
Elected County Officers 3.00
Senior Management Service Class 2.00
As provided in Section 121.101, Florida Statutes, if the member is initially enrolled in the FRS before July
1, 2011, and all service credit was accrued before July 1, 2011, the annual cost-of-living adjustment is 3
percent per year. If the member is initially enrolled before July 1, 2011, and has service credit on or after
July 1, 2011, there is an individually calculated cost-of-living adjustment. The annual cost-of-living
adjustment is a proportion of 3 percent determined by dividing the sum of the pre-July 2011 service credit
by the total service credit at retirement multiplied by 3 percent. Plan members initially enrolled on or after
July 1, 2011 will not have a cost-of-living adjustment after retirement.
60

ORANGE COUNTY PUBLIC SCHOOLS
NOTES TO BASIC FINANCIAL STATEMENTS June 30, 2015
Contributions. The Florida Legislature establishes contribution rates for participating employers and employees. Contribution rates during the 2014-15 fiscal year were as follows: Percent of Gross Salary Class or Plan Employee Employer (A) Florida Retirement System, Regular 3.00 7.37 Florida Retirement System, County Elected Officers 3.00 43.24 Florida Retirement System, Senior Management Service 3.00 21.14 Teachers’ Retirement System, Plan E 6.25 11.50 Deferred Retirement Option Program – Applicable to Members from All
of the Above Classes or Plans
0.00
12.28
(A) Employer rates include the post-employment health insurance supplement of 1.26% and .04% for administrative costs of the Public Employee Optional Retirement Program.
Pension Liabilities, Pension Expense, Deferred Outflows of Resources, and Deferred Inflows of Resources Related to Pensions. At June 30, 2015, the District reported a liability of $138,601,800 for its proportionate share of the net pension liability. The net pension liability was measured as of June 30, 2014, and the total pension liability used to calculate the net pension liability was determined an actuarial valuation as of that of July 1, 2014. The District’s proportion of the net pension liability was based on the District’s 2014-15 fiscal year contributions relative to the 2013-14 fiscal year contributions of all participating members. At June 30, 2014, the District’s proportion was 2.27 percent, which was an increase of 0.13 percent from its proportion measured as of June 30, 2013. For the fiscal year ended June 30, 2015, the District recognized pension expense of $16,535,278 related to the Plan. In addition, the District reported deferred outflows of resources and deferred inflows of resources related to pensions from the following sources:
Description
Differences between expected and actual experience $ $ 8,577,095 Change of assumptions 24,003,525 Net difference between projected and actual earnings on FRS pension plan investments 231,210,808 Changes in proportion and differences between District FRS contributions and proportionate share of contributions 18,215,242 District FRS contributions subsequent to the measurement date (fiscal year 2015 contributions) 57,441,353
Total $ 99,660,120 $ 239,787,903
Deferred Outflowsof Resources
Deferred Inflowsof Resources
61

ORANGE COUNTY PUBLIC SCHOOLS
NOTES TO BASIC FINANCIAL STATEMENTS June 30, 2015
The deferred outflows of resources related to pensions, totaling $57,441,353, resulting from District
contributions to the Plan subsequent to the measurement date, will be recognized as a reduction of the
net pension liability in the fiscal year ended June 30, 2016. Other amounts reported as deferred outflows
of resources and deferred inflows of resources related to pensions will be recognized in pension expense
as follows:
Fiscal Year Ending June 30
2016 (51,455,217)$ 2017 (51,455,217) 2018 (51,455,217) 2019 (51,455,217) 2020 6,347,485 Thereafter 1,904,247
(197,569,136)$
Amount
Actuarial Assumptions. The total pension liability in the July 1, 2014 actuarial valuation was determined
using the following actuarial assumptions, applied to all periods included in the measurement:
Inflation 2.60 percentSalary Increases 3.25 percent, average, including inflationInvestment rate of return 7.65 percent, net of pension plan investment expense,
including inflation
Mortality rates were based on the Generational RP-2000 with Projection Scale BB, with adjustments for mortality improvements based on Scale AA. The actuarial assumptions used in the July 1, 2014, valuation were based on the results of an actuarial
experience study for the period July 1, 2008, through June 30, 2013.
The long-term expected rate of return on pension plan investments was not based on historical returns,
but instead is based on a forward-looking capital market economic model. The allocation policy’s
description of each asset class was used to map the target allocation to the asset classes shown below.
Each asset class assumption is based on a consistent set of underlying assumptions, and includes an
adjustment for the inflation assumption. The target allocation and best estimates of arithmetic and
geometric real rates of return for each major asset class are summarized in the following table:
62

ORANGE COUNTY PUBLIC SCHOOLS
NOTES TO BASIC FINANCIAL STATEMENTS June 30, 2015
CompoundAnnual Annual
Target Arithmetic (Geometric) StandardAsset Class Allocation (1) Return Return Deviation
Cash 1.00% 3.11% 3.10% 1.65%Intermediate-Term Bonds 18.00% 4.18% 4.05% 5.15%High Yield Bonds 3.00% 6.79% 6.25% 10.95%Broad US Equities 26.50% 8.51% 6.95% 18.90%Developed Foreign Equities 21.20% 8.66% 6.85% 20.40%Emerging Market Equities 5.30% 11.58% 7.60% 31.15%Private Equity 6.00% 11.80% 8.11% 30.00%Hedge Funds / Absolute Return 7.00% 5.81% 5.35% 10.00%Real Estate (Property) 12.00% 7.11% 6.35% 13.00%
Total 100.00%
Assumed inflation - Mean 2.60% 2.00%
Note: (1) As outlined in the Plan’s investment policy
Discount Rate. The discount rate used to measure the total pension liability was 7.65 percent. The Plan’s fiduciary net position was projected to be available to make all projected future benefit payments of current active and inactive employees. Therefore, the discount rate for calculating the total pension liability is equal to the long-term expected rate of return. Sensitivity of the District’s Proportionate Share of the Net Position Liability to Changes in the Discount
Rate. The following presents the District’s proportionate share of the net pension liability calculated using
the discount rate of 7.65 percent, as well as what the District’s proportionate share of the net pension
liability would be if it were calculated using a discount rate that is 1-percentage-point lower (6.65 percent)
or 1-percentage-point higher (8.65 percent) than the current rate:
1% Current 1%Decrease Discount Rate Increase
(6.65%) (7.65%) (8.65%)
District's proportionate share of the net pension liability 592,818,308$ 138,601,800$ (239,219,666)$
Pension Plan Fiduciary Net Position. Detailed information about the Plan’s fiduciary net position is
available in the separately issued FRS Pension Plan and Other State Administered Systems
Comprehensive Annual Financial Report.
Payables to the Pension Plan. At June 30, 2015, the District reported no payables for the outstanding
amount of contributions to the Plan required for the fiscal year ended June 30, 2015.
63

ORANGE COUNTY PUBLIC SCHOOLS
NOTES TO BASIC FINANCIAL STATEMENTS June 30, 2015
HIS Pension Plan
Plan Description. The HIS Pension Plan (HIS Plan) is a cost-sharing multiple-employer defined benefit
pension plan established under section 112.363, Florida Statutes, and may be amended by the Florida
Legislature at any time. The benefit is a monthly payment to assist retirees of State-administered
retirement systems in paying their health insurance costs and is administered by the Division of
Retirement within the Florida Department of Management Services.
Benefits Provided. For the fiscal year ended June 30, 2015, eligible retirees and beneficiaries received a
monthly HIS payment of $5 for each year of creditable service completed at the time of retirement, with a
minimum HIS payment of $30 and a maximum HIS payment of $150 per month, pursuant to Section
112.363, Florida Statutes. To be eligible to receive a HIS Plan benefit, a retiree under a State-
administered retirement system must provide proof of health insurance coverage, which may include
Medicare.
Contributions. The HIS Plan is funded by required contributions from FRS participating employers as set
by the Florida Legislature. Employer contributions are a percentage of gross compensation for all active
FRS members. For the fiscal year ended June 30, 2015, the contribution rate was 1.26 percent of payroll
pursuant to section 112.363, Florida Statues. The District contributed 100 percent of its statutorily
required contributions for the current and preceding three years. HIS Plan contributions are deposited in
a separate trust fund from which payments are authorized. HIS Plan benefits are not guaranteed and are
subject to annual legislative appropriation. In the event the legislative appropriation or available funds fail
to provide full subsidy benefits to all participants, benefits may be reduced or canceled.
The District’s contributions to the HIS Plan totaled $11,892,397 for the fiscal year ended June 30, 2015.
Pension Liabilities, Pension Expense, and Deferred Outflows of Resources and Deferred Inflows of
Resources Related to Pensions. At June 30, 2015, the District reported a net pension liability of
$280,568,669 for its proportionate share of the HIS Plan’s net pension liability. The current portion of the
net pension liability is the District’s proportionate share of benefit payments expected to be paid within
one year, net of the District’s proportionate share of the pension plan’s fiduciary net position available to
pay that amount. The net pension liability was measured as of June 30, 2014, and the total pension
liability used to calculate the net pension liability was determined by an actuarial valuation as of July 1,
2014. The District’s proportionate share of the net pension liability was based on the District’s 2013-14
fiscal year contributions relative to the total 2013-14 fiscal year contributions of all participating members.
At June 30, 2014, the District’s proportionate share was 3.00 percent, which was an increase of 0.10
percent from its proportionate share measured as of June 30, 2013.
64

ORANGE COUNTY PUBLIC SCHOOLS
NOTES TO BASIC FINANCIAL STATEMENTS June 30, 2015
For the fiscal year ended June 30, 2015, the District recognized pension expense of $20,689,731 related
to the HIS Plan. In addition, the District reported deferred outflows of resources and deferred inflows of
resources related to pensions from the following sources:
Deferred OutflowsDescription of Resources
Change of assumptions 9,983,747$ Net difference between projected and actual earnings on HIS pension plan investments 134,680 Changes in proportion and differences between District HIS contributions and proportionate 7,482,277 share of HIS contributionsDistrict contributions subsequent to the measurement date 11,892,397
Total 29,493,101$
The deferred outflows of resources related to pensions, totaling $11,892,397, resulting from District
contributions to the HIS Plan subsequent to the measurement date, will be recognized as a reduction of
the net pension liability in the fiscal year ended June 30, 2016. Other amounts reported as deferred
outflows of resources and deferred inflows of resources related to pensions will be recognized in pension
expense as follows:
Fiscal Year Ending June 30
2016 2,850,771$ 2017 2,850,771 2018 2,850,771 2019 2,850,771 2020 2,817,101 Thereafter 3,380,519
17,600,704$
Amount
Actuarial Assumptions. The total pension liability in the July 1, 2014, actuarial valuation was determined
using the following actuarial assumptions, applied to all periods included in the measurement:
Inflation 2.60 percentSalary Increases 3.25 percent, average, including inflationMunicipal Bond Rate 4.29 percent
Mortality rates were based on the Generational RP-2000 with Projected Scale BB.
The actuarial assumptions used in the July 1, 2014 valuation were based on the results of an actuarial
experience study for the period July 1, 2008, through June 30, 2013.
65

ORANGE COUNTY PUBLIC SCHOOLS
NOTES TO BASIC FINANCIAL STATEMENTS June 30, 2015
discounting at the long-term expected rate of return for benefit payments prior to the projected depletion
date. Because the HIS benefit is essentially funded on a pay-as-you-go basis, the depletion date is
considered to be immediate, and the single equivalent discount rate is equal to the municipal bond rate
selected by the HIS Plan sponsor. The Bond Buyer General Obligation 20-Bond Municipal Bond Index
was adopted as the applicable municipal bond index.
Sensitivity of the District’s Proportionate Share of the Net Pension Liability to Changes in the Discount
Rate. The following presents the District’s proportionate share of the net pension liability calculated using
the discount rate of 4.29 percent, as well as what the District’s proportionate share of the net pension
liability would be if it were calculated using a discount rate that is 1-percentage-point lower (3.29 percent)
or 1-percentage-point higher (5.29 percent) than the current rate:
1% Current 1%Decrease Discount Rate Increase
(3.29%) (4.29%) (5.29%)
District's proportionate share of the net pension liability 319,124,141$ 280,568,669$ 248,385,883$
Pension Plan Fiduciary Net Position. Detailed information about the HIS Plan’s fiduciary net position is
available in the separately issued FRS Pension Plan and Other State Administered Systems
Comprehensive Annual Financial Report.
Payables to the Pension Plan. At June 30, 2015, the District reported no payables for the outstanding
amount of contributions to the HIS Plan required for the fiscal year ended June 30, 2015.
Defined Contribution Pension Plan
The District contributes to the FRS Investment Plan (Investment Plan), a defined contribution pension
plan, for its eligible employees electing to participate in the Investment Plan. The Investment Plan is
administered by the SBA, and is reported in the SBA’s annual financial statements and in the State of
Florida Comprehensive Annual Financial Report. Service retirement benefits are based upon the value of
the member’s account upon retirement.
66

ORANGE COUNTY PUBLIC SCHOOLS
NOTES TO BASIC FINANCIAL STATEMENTS June 30, 2015
As provided in Section 121.4501, Florida Statutes, eligible FRS members may elect to participate in the
Investment Plan in lieu of the FRS defined-benefit plan. District employees participating in DROP are not
eligible to participate in the Investment Plan. Employer and employee contributions, including amounts
contributed to individual member’s accounts, are defined by law, but the ultimate benefit depends in part
on the performance of investment funds. Benefit terms, including contribution requirements, for the
Investment Plan are established and may be amended by the Florida Legislature. The Investment Plan is
funded with the same employer and employee contribution rates that are based on salary and
membership class (Regular Class, Elected County Officers, etc.), as the FRS defined benefit plan.
Contributions are directed to individual member accounts, and the individual members allocate
contributions and account balances among various approved investment choices. Allocations to the
investment member’s accounts during the 2014-15 fiscal year were as follows:
Percent ofGross
Class Compensation
FRS, Regular 6.30FRS, Elected County Officers 11.34FRS, Senior Management Service 7.67
For all membership classes, employees are immediately vested in their own contributions and are vested
after one year of service for employer contributions and investment earnings. If an accumulated benefit
obligation for service credit originally earned under the FRS Pension Plan is transferred to the Investment
Plan, the member must have the years of service required for FRS Pension Plan vesting (including the
service credit represented by the transferred funds) to be vested for these funds and the earnings on the
funds. Nonvested employer contributions are placed in a suspense account for up to five years. If the
employee returns to FRS-covered employment within the five year period, the employee will regain
control over their account. If the employee does not return within the five year period, the employee will
forfeit the accumulated account balance. Costs of administering the Investment Plan, including the FRS
Financial Guidance Program, are funded through an employer contribution of 0.04 percent of payroll and
by forfeited benefits of Investment Plan members. For the fiscal year ended June 30, 2015, the
information for the amount of forfeitures was unavailable from the SBA; however, management believes
that these amounts, if any, would be immaterial to the District.
After termination and applying to receive benefits, the member may rollover vested funds to another
qualified plan, structure a periodic payment under the Investment Plan, receive a lump-sum distribution,
leave the funds invested for future distribution, or any combination of these options. Disability coverage is
provided; the member may either transfer the account balance to the FRS Pension Plan when approved
for disability retirement to receive guaranteed lifetime monthly benefits under the FRS Pension Plan, or
remain in the Investment Plan and rely upon that account balance for retirement income.
The District’s Investment Plan pension expense totaled $11,084,327 for the fiscal year ended June 30,
2015.
67

ORANGE COUNTY PUBLIC SCHOOLS
NOTES TO BASIC FINANCIAL STATEMENTS June 30, 2015
16. Other Postemployment Benefits Plan Description. The other postemployment benefits plan is a single-employer defined benefit plan administered by the District. Pursuant to the provision of the Section 112.0801, Florida Statutes, former employees who retire from the District, and eligible dependents, may continue to participate in the District’s health and hospitalization plan for medical and prescription coverages. The postemployment healthcare and life insurance plan does not issue a stand-alone report, and is not included in the report of a public employee retirement system (PERS) or another entity. Funding Policy. The District funds the postemployment benefit on a pay-as-you go basis. Contribution requirements of the plan members and the District are established and may be amended by the Board. Effective October 1, 2014, once the participant or spouse attains age 65, the District does not continue coverage. Postemployment healthcare and life insurance are optional benefits available through the District after retirement, but retirees must pay the full premium. Therefore, no liability to the District for these benefits. Annual OPEB Cost and Net OPEB Obligations. The following table shows the District’s annual OPEB cost for the year, the amount actually contributed to the plan, and changes in the District’s net OPEB obligation:
Description Amount
Normal Cost (service cost for one year) 1,420,519$ Amortization of Unfunded Actuarial Accrued Liability 1,832,617 Interest on Normal Cost and Amortization 56,821
Annual Required Contribution (ARC) 3,309,957 Interest on Net OPEB Obligation (NOO) 3,176,358 Adjustment to Annual Required Contribution (7,142,128)
Annual OPEB Cost (Expense) (655,813)
Contribution Toward the OPEB Cost 3,306,448
Decrease in Net OPEB Obligation (3,962,261)
Net OPEB Obligation, Beginning of Year 79,408,945
Net OPEB Obligation, End of Year 75,446,684$
The District’s annual OPEB Cost, the percentage of annual OPEB cost contributed to the plan, and the net OPEB obligation as of June 30, 2015, and the two preceding years, was as follows:
Fiscal AnnualYear Annual Amount OPEB Cost Net OPEB
Ending OPEB Cost Contributed Contributed Obligation
June 30, 2013 14,615,227$ 4,274,871$ 29.25% 72,153,708$ June 30, 2014 11,225,626$ 3,970,389$ 35.37% 79,408,945$ June 30, 2015 (655,813)$ 3,306,448$ (504.18%) 75,446,684$
68

ORANGE COUNTY PUBLIC SCHOOLS
NOTES TO BASIC FINANCIAL STATEMENTS June 30, 2015
The change in the plan provisions, to exclude any subsidy of retirees once they turn 65, had a major impact on the expense for this fiscal year. The effect of the change was a reduction in the liability by $240,195,212 to $47,288,616, which resulted in a significant decrease in the annual OPEB cost for this fiscal year. Funded Status and Funding Process. The funded status of the plan as of June 30, 2015, was as follows:
Actuarial Accrued Liability (a) 48,454,804$ Actuarial Value of Plan Assets (b) - Unfunded Actuarial Accrued Liability (c)=(a-b) 48,454,804$
Funded Ratio (b/a) 0.00%Covered Payroll (Active Plan Members) (d) 842,100,610$ UAAL as a Percentage of Covered Payroll (c/d) 5.75%
Actuarial valuations of an ongoing plan involve estimates of the value of reported amounts and assumptions about the probability of occurrence of events far into the future. Examples include assumptions about future employment and termination, mortality, and the healthcare cost trends. Amounts determined regarding the funded status of the plan and the annual required contributions of the employer are subject to continual revision as actual results are compared with past expectations and new estimates are made about the future. The schedule of funding progress, presented as required supplementary information following the notes to the financial statements, presents multiyear trend information. Actuarial Methods and Assumptions. Projection of benefits for financial reporting purposes are based on the substantive plan provisions, as understood by the employer and participating members, and include the type of benefits provided at the time of each valuation and the historical pattern of sharing benefit costs between the employer and participating members. The actuarial methods and assumptions used include techniques that are designed to reduce the effect of short-term volatility in actuarial accrued liabilities and the actuarial value of assets, consistent with the long-term perspective of the calculations. The entry age normal cost actuarial method was used to determine OPEB actuarial valuation. Because the OPEB liability is currently unfunded, the actuarial assumptions included a 4.0 percent discount rate. The actuarial assumptions also included an annual healthcare cost trend of 6.8 percent for the fiscal year 2014-15, then dropping to an ultimate rate of 5 percent in fiscal year 2020-21. The actuarial assumptions also included an inflation rate of 3.0 percent and 3.0 percent for salary increases. The unfunded actuarial accrued liability is being amortized as a level percentage of projected payrolls over a 30 year period on an open basis.
69

ORANGE COUNTY PUBLIC SCHOOLS
NOTES TO BASIC FINANCIAL STATEMENTS June 30, 2015
17. Construction Contract and Other Commitments Construction Contracts The following is a summary of major construction contract commitments remaining at fiscal year-end:
Contract Completed BalanceProject Amount to Date Committed
Cypress Creek High School Comprehensive 32,643,638$ 21,433,116$ 11,210,522$ Dr. Phillips High School Comprehensive 37,024,936 33,931,971 3,092,965Wedgefield K-8 19,694,506 1,480,841 18,213,665
Total 89,363,080$ 56,845,928$ 32,517,152$
Encumbrances Appropriations in governmental funds are encumbered upon issuance of purchase orders for goods and services. Even though appropriations lapse at the end of the year, unfilled purchase orders of the current year are carried forward and the next year’s appropriations are likewise encumbered. The following is a schedule of encumbrances remaining at fiscal year-end:
General 25,904,118$ Capital Projects - Other 84,938,869Nonmajor Governmental Funds 29,780,824
Total Governmental Funds 140,623,811$
18. Risk Management Programs The District is exposed to various risks of loss related to torts; theft of, damage to, and destruction of assets; errors and omissions; injuries to employees; and natural disasters. The District relies on sovereign immunity and therefore does not procure general liability or automobile insurance. Other lines of coverage are being provided on a self-insured basis subject to specified retentions. The District has contracted with claims administrators to administer these self-insurance programs, including the processing, investigating, and payment of claims. A liability was actuarially determined to cover estimated incurred but not reported insurance claims payable at June 30, 2015. Liabilities for incurred losses to be settled by fixed or reasonably determinable payments over a long period of time are reported at their present value using an investment yield rate of 2% as determined by a review of the District’s interest rates received from intergovernmental pooled investment funds and government securities. These liabilities are $13,741,506 at June 30, 2015. Settled claims resulting from the risks described above have not exceeded into the excess commercial insurance coverage in any of the past three fiscal years.
70

ORANGE COUNTY PUBLIC SCHOOLS
NOTES TO BASIC FINANCIAL STATEMENTS June 30, 2015
The District provides employee group health and life insurance. The group health plan is self-insured through the Employee Benefits Trust and life insurance is obtained through a commercial carrier. Under these plans, the Board contributes employee premiums as fringe benefits to employees. The employees pay a portion of the costs in the two premium group health plans while the District pays all of the employee costs in the two basic group health plans. Premiums for coverages provided for employee dependents and retirees and their dependents are paid in advance by the employee or retiree. These plans provide for maximum premiums based on the number of participants and individual or family coverages. The group health plan is administered by third-party administrators that are reimbursed by the District from a detail record of services provided. There is no stop loss protection on the group health plan. The District has different funding arrangements with each of the groups that reimburse the claims and healthcare expenses. The District reported an estimated unpaid claims liability of $13,100,000 in the Internal Service Funds for the group health insurance program at June 30, 2015. The following schedule represents the changes in the claims liability for the past two fiscal years for the District’s self-insurance programs:
June 30, 2014 Beginning
Fiscal Year-End
Current-Year Claims and Changes in Estimates
Claims Payments
June 30, 2015 Ending Fiscal
Year-End
2013-14 24,767,803$ 169,054,360 (168,863,398) 24,958,765$ 2014-15 24,958,765$ 176,295,476 (174,412,735) 26,841,506$
19. Litigation and Contingencies The District is a defendant in numerous lawsuits as of June 30, 2015. It is the opinion of management, after giving consideration to the District’s related insurance coverage, as well as the Florida statutory limitations on governmental liabilities on uninsured risks, that the amount of loss resulting from litigation that exceed the above mentioned limits would not be material to the financial position of the District. Amounts received or receivable from grantors are subject to audit and adjustment by grantor agencies, principally the federal government. Any disallowed claims, including amounts already collected, may constitute a liability of the applicable funds. The amount, if any, of expenditures which may be disallowed by grantors cannot be determined at this time although the District expects such amounts, if any, to be immaterial. 20. Subsequent Events Debt Refunding On May 26, 2015, the Board approved a resolution authorizing the refunding of the Series 2006B COPs by issuing Series 2016A COPs for an amount not to exceed $115,000,000.
71

ActuarialAccruedLiability UAAL as a
Actuarial (AAL) Unfunded PercentageActuarial Value of Projected AAL Funded Covered of CoveredValuation Assets Unit Credit (UAAL) Ratio Payroll Payroll
Date (a) (b) (b-a) (a/b) (c) [(b-a)/c]
July 1, 2012 -$ 318,167,715$ 318,167,715$ 0.0% 733,475,705$ 43.4%July 1, 2013 -$ 232,984,958$ 232,984,958$ 0.0% 677,026,084$ 34.4%July 1, 2014 -$ 47,497,511$ 47,497,511$ 0.0% 791,543,300$ 6.0%
ORANGE COUNTY PUBLIC SCHOOLSREQUIRED SUPPLEMENTARY INFORMATION -
SCHEDULE OF FUNDING PROGRESSOTHER POSTEMPLOYMENT BENEFITS PLAN
72

2014* 2013*
2.3% 2.1%
District's proportionate share of the net pension liability 138,601,800$ 369,393,623$
791,543,300$ 677,026,084$
17.5% 54.6%
96.09% N/A
* Represents the measurement date, period applied in the District's following fiscal year.
Note: Data was unavailable prior to 2013.
District's proportionate share of the net pension liability (asset) as a percentage of its covered-employee payroll
FRS Plan fiduciary net position as a percentage of the total pension liability
SCHEDULE OF ORANGE COUNTY PUBLIC SCHOOLS PROPORTIONATE SHARE OF NET PENSION LIABILITY FLORIDA RETIREMENT SYSTEM
LAST 10 FISCAL YEARS
District's proportion of the net pension liability
District's covered-employee payroll
73

2015 201449,757,965$ 28,846,461$
49,757,965$ 28,846,461$
-$ -$
District's covered-employee payroll 791,543,300$ 677,026,084$
6.3% 4.3%
Note: Data was unavailable prior to 2014.
Contribution deficiency (excess)
Contributions as a percentage of covered-employee payroll
SCHEDULE OF ORANGE COUNTY PUBLIC SCHOOLS CONTRIBUTIONSFLORIDA RETIREMENT SYSTEM
LAST 10 FISCAL YEARS
Contractually required contribution
Contributions in relation to the contractually required contribution
74

2014* 2013*
3.0% 2.9%
District's proportionate share of the net pension liability (asset) 280,568,669$ 252,557,472$
791,543,300$ 677,026,084$
35.4% 37.3%
0.99% N/A
* Represents the measurement date, period applied in the District's following fiscal year.
Note: Data was unavailable prior to 2013.
District's proportionate share of the net pension liability (asset) as a percentage of its covered-employee payroll
HIS Plan fiduciary net position as a percentage of the total pension liability
SCHEDULE OF ORANGE COUNTY PUBLIC SCHOOLS PROPORTIONATE SHARE OF NET PENSION LIABILITY HEALTH INSURANCE SUBSIDY PROGRAM
LAST 10 FISCAL YEARS
District's proportion of the net pension liability (asset)
District's covered-employee payroll
75

2015 201410,279,238$ 9,502,464$
10,279,238$ 9,502,464$
-$ -$
District's covered-employee payroll 791,543,300$ 677,026,084$
1.3% 1.4%
Note: Data was unavailable prior to 2014.
Contribution deficiency (excess)
Contributions as a percentage of covered-employee payroll
SCHEDULE OF ORANGE COUNTY PUBLIC SCHOOLS CONTRIBUTIONSHEALTH INSURANCE SUBSIDY PROGRAM
LAST 10 FISCAL YEARS
Contractually required contribution
Contributions in relation to the contractually required contribution
76

ORANGE COUNTY PUBLIC SCHOOLS Non-Major Governmental Funds
June 30, 2015
Special Revenue Funds Special revenue funds are used to account for specific revenues that are legally restricted to expenditures for particular purposes. Food Service Fund – To account for the activities of the District’s food services function. These activities are primarily funded through local charges and Federal awards. Other Federal Programs Fund – To account for programs funded by federal sources, requiring separate accountability because of legal or regulatory restrictions. ARRA Programs Fund – To account for programs funded by the American Recovery and Reinvestment Act (ARRA) source, requiring separate accountability because of legal or regulatory restrictions. Miscellaneous Special Revenue Fund – To account for other programs of the District requiring separate accountability because of legal or regulatory restrictions.
Debt Service Funds Debt service funds are used to account for the accumulation of resources for, and the payment of, general long-term debt principal, interest and related costs. State Board of Education (SBE) and Capital Outlay Bond Issue (COBI) Fund – To account for the payment of principal, interest and related costs on the state school bonds issued by the State Board of Education on behalf of the District. These bonds are payable from the District’s portion of the state-assessed motor vehicle license tax. Other Debt Service – To account for the payment of principal, interest and related costs for Certificates of Participation and capital leases.
Capital Projects Funds Capital project funds are used to account for the financial resources to be used for educational capital outlay needs, including new construction, renovation and remodeling projects. Public Education Capital Outlay Fund – To account for capital project activity funded through the State’s Public Education Capital Outlay program. Capital Outlay and Debt Service Fund – To account for capital project activity funded by the District’s portion of the state Capital Outlay and Debt Service program. Capital Improvement Section 1011.71(2), Florida Statutes, Local Capital Improvement Tax Fund – To account for capital project activity funded through a tax levy pursuant to the cited statute.
77

TotalNon-Major Total Food Service Other Federal ARRA Federal Miscellaneous
Governmental Non-Major Fund Programs Programs Special RevenueFunds Special Revenue Fund Fund Fund
Funds
ASSETSCash 185,814$ 185,814$ 170,814$ -$ -$ 15,000$ Investments 262,983,426 20,788,600 10,067,791 - - 10,720,809 Accounts Receivable 2,407 2,407 - - - 2,407 Interest Receivable 135,371 - - - - - Due From Other Agencies 19,118,423 13,794,681 9,451,528 3,433,662 909,491 - Inventories 1,814,297 1,814,297 1,814,297 - - -
Total Assets 284,239,738$ 36,585,799$ 21,504,430$ 3,433,662$ 909,491$ 10,738,216$
LIABILITIES AND FUND BALANCESLiabilities: Salaries and Wages Payable 2,023,012$ 2,023,012$ 508,670$ 1,433,121$ 30,883$ 50,338$
Accounts Payable 1,850,728 1,517,247 36,073 965,606 512,832 2,736 Construction Contracts Payable 391,912 - - - - - Const. Contracts - Retained Percentage 205,276 - - - - - Due to Other Funds 1,303,308 1,303,308 - 937,532 365,776 - Due to Other Agencies 97,403 97,403 - 97,403 - - Matured Bonds Payable 2,539,257 - - - - - Unearned Revenue 1,115,957 752,413 752,413 - - -
Total Liabilities 9,526,853$ 5,693,383 1,297,156 3,433,662 909,491 53,074
Fund Balances: Nonspendable: 1,814,297 1,814,297 1,814,297 - - - Spendable: Restricted 262,213,446 18,392,977 18,392,977 - - - Assigned 10,685,142 10,685,142 - - - 10,685,142
Unassigned - - - - - -
Total Fund Balances 274,712,885 30,892,416 20,207,274 - - 10,685,142
Total Liabilities and Fund Balances 284,239,738$ 36,585,799$ 21,504,430$ 3,433,662$ 909,491$ 10,738,216$
Special Revenue Funds
ORANGE COUNTY PUBLIC SCHOOLSCOMBINING BALANCE SHEET
NON-MAJOR GOVERNMENTAL FUNDSJune 30, 2015
78

Total State Board of Other DebtNon-Major Education (SBE) Service
Debt Service and Capital Outlay FundsFunds Bond Issue
(COBI) FundASSETSCash -$ -$ -$ Investments 108,727,864 321,078 108,406,786 Accounts Receivable - - - Interest Receivable 135,371 - 135,371 Due From Other Funds - - - Due From Other Agencies - - - Inventories - - -
Total Assets 108,863,235$ 321,078$ 108,542,157$
LIABILITIES AND FUND BALANCESLiabilities: Salaries and Wages Payable -$ -$ -$
Accounts Payable - - - Construction Contracts Payable - - - Const. Contracts Pay. - Retained Percent - - - Due to Other Funds - - - Matured Debt Payable 2,539,257 - 2,539,257 Deferred Revenue - - -
Total Liabilities 2,539,257 - 2,539,257
Fund Balances: Nonspendable: - - - Spendable: Restricted 106,323,978 321,078 106,002,900 Assigned - - - Unassigned - - -
Total Fund Balances 106,323,978 321,078 106,002,900
Total Liabilities and Fund Balances 108,863,235$ 321,078$ 108,542,157$
Debt Service Funds
ORANGE COUNTY PUBLIC SCHOOLSCOMBINING BALANCE SHEET
NON-MAJOR GOVERNMENTAL FUNDSJune 30, 2015
(continued)
79

Total Non-Major Public Education Capital Outlay SectionCapital Projects Capital Outlay & Debt Service 1011.71(2), F.S.
Funds Fund Fund Local CapitalImprovement
Tax FundASSETSCash -$ -$ -$ -$ Investments 133,466,962 - 2,855,513 130,611,449 Accounts Receivable - - - - Interest Receivable - - - - Due From Other Funds - - - - Due From Other Agencies 5,323,742 - 2,665,756 2,657,986 Inventories - - - -
Total Assets 138,790,704$ -$ 5,521,269$ 133,269,435$
LIABILITIES AND FUND BALANCESLiabilities: Salaries and Wages Payable -$ -$ -$ -$
Accounts Payable 333,481 - 9,964 323,517 Construction Contracts Payable 391,912 - 192,023 199,889 Construction Contracts Payable - Retained Percentage 205,276 - 95,042 110,234 Due to Other Funds - - - - Due to Other Agencies - - - - Matured Debt Payable - - - - Unearned Revenues 363,544 - 363,544 -
Total Liabilities 1,294,213 - 660,573 633,640
Fund Balances: Nonspendable: - - - - Spendable: Restricted 137,496,491 - 4,860,696 132,635,795 Assigned - - - - Unassigned - - - -
Total Fund Balances 137,496,491 - 4,860,696 132,635,795
Total Liabilities and Fund Balances 138,790,704$ -$ 5,521,269$ 133,269,435$
Capital Projects Funds
ORANGE COUNTY PUBLIC SCHOOLSCOMBINING BALANCE SHEET
NON-MAJOR GOVERNMENTAL FUNDSJune 30, 2015
(continued)
80
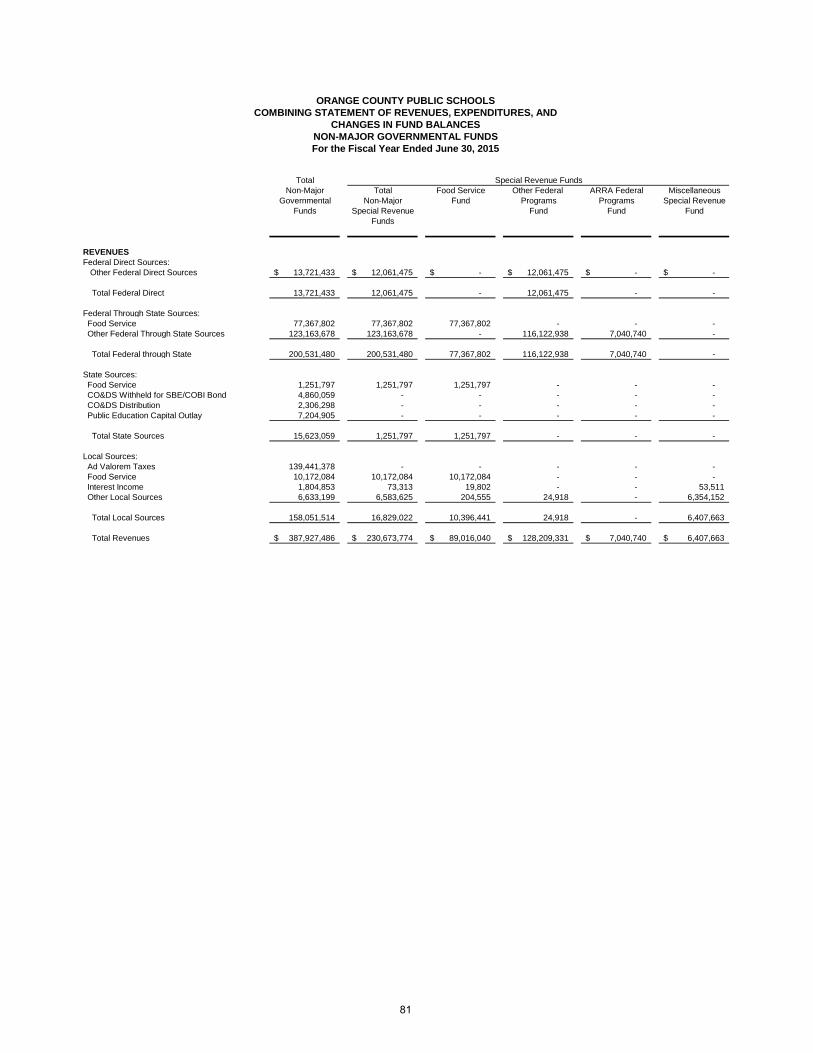
TotalNon-Major Total Food Service Other Federal ARRA Federal Miscellaneous
Governmental Non-Major Fund Programs Programs Special RevenueFunds Special Revenue Fund Fund Fund
Funds
REVENUESFederal Direct Sources: Other Federal Direct Sources 13,721,433$ 12,061,475$ -$ 12,061,475$ -$ -$
Total Federal Direct 13,721,433 12,061,475 - 12,061,475 - -
Federal Through State Sources: Food Service 77,367,802 77,367,802 77,367,802 - - - Other Federal Through State Sources 123,163,678 123,163,678 - 116,122,938 7,040,740 -
Total Federal through State 200,531,480 200,531,480 77,367,802 116,122,938 7,040,740 -
State Sources: Food Service 1,251,797 1,251,797 1,251,797 - - - CO&DS Withheld for SBE/COBI Bond 4,860,059 - - - - - CO&DS Distribution 2,306,298 - - - - - Public Education Capital Outlay 7,204,905 - - - - -
Total State Sources 15,623,059 1,251,797 1,251,797 - - -
Local Sources: Ad Valorem Taxes 139,441,378 - - - - - Food Service 10,172,084 10,172,084 10,172,084 - - - Interest Income 1,804,853 73,313 19,802 - - 53,511 Other Local Sources 6,633,199 6,583,625 204,555 24,918 - 6,354,152
Total Local Sources 158,051,514 16,829,022 10,396,441 24,918 - 6,407,663
Total Revenues 387,927,486$ 230,673,774$ 89,016,040$ 128,209,331$ 7,040,740$ 6,407,663$
Special Revenue Funds
ORANGE COUNTY PUBLIC SCHOOLSCOMBINING STATEMENT OF REVENUES, EXPENDITURES, AND
CHANGES IN FUND BALANCESNON-MAJOR GOVERNMENTAL FUNDSFor the Fiscal Year Ended June 30, 2015
81

Total State Board of OtherNon-Major Education (SBE) Debt Service
Debt Service and Capital Outlay FundFunds Bond Issue
(COBI) Fund
REVENUESFederal Direct Sources: Other Federal Direct Sources 1,659,958$ -$ 1,659,958$
Total Federal Direct 1,659,958 - 1,659,958
Federal Through State Sources: Food Service - - - Other Federal Through State Sources - - -
Total Federal through State - - -
State Sources: Food Service - - - CO&DS Withheld for SBE/COBI Bond 4,860,059 4,860,059 - CO&DS Distribution - - - Public Education Capital Outlay - - -
Total State Sources 4,860,059 4,860,059 -
Local Sources: Food Service - - - Interest Income 1,366,962 - 1,366,962 Other Local Sources - - -
Total Local Sources 1,366,962 - 1,366,962
Total Revenues 7,886,979$ 4,860,059$ 3,026,920$
Debt Service Funds
For the Fiscal Year Ended June 30, 2015(continued)
ORANGE COUNTY PUBLIC SCHOOLSCOMBINING STATEMENT OF REVENUES, EXPENDITURES, AND
CHANGES IN FUND BALANCESNON-MAJOR GOVERNMENTAL FUNDS
82

Total Non-Major Public Education Capital Outlay SectionCapital Projects Capital Outlay & Debt Service 1011.71(2), F.S.
Funds Fund Fund Local CapitalImprovement
Tax Fund
REVENUESFederal Direct Sources: Other Federal Direct Sources -$ -$ -$ -$
Total Federal Direct - - - -
Federal Through State Sources: Food Service - - - - Other Federal Through State Sources - - - -
Total Federal through State - - - -
State Sources: Food Service - - - - CO&DS Withheld for SBE/COBI Bond - - - - CO&DS Distribution 2,306,298 - 2,306,298 - Public Education Capital Outlay 7,204,905 7,204,905 - -
Total State Sources 9,511,203 7,204,905 2,306,298 -
Local Sources: Ad Valorem Taxes 139,441,378 - - 139,441,378 Food Service - - - - Interest Income 364,578 - 13,595 350,983 Other Local Sources 49,574 - - 49,574
Total Local Sources 139,855,530 - 13,595 139,841,935
Total Revenues 149,366,733$ 7,204,905$ 2,319,893$ 139,841,935$
Capital Projects Funds
ORANGE COUNTY PUBLIC SCHOOLSCOMBINING STATEMENT OF REVENUES, EXPENDITURES, AND
CHANGES IN FUND BALANCESNON-MAJOR GOVERNMENTAL FUNDSFor the Fiscal Year Ended June 30, 2015
(continued)
83

TotalNon-Major Total Food Service Other Federal ARRA Federal Miscellaneous
Governmental Non-Major Fund Programs Programs Special RevenueFunds Special Revenue Fund Fund Fund
Funds
EXPENDITURESCurrent: Instruction 41,515,852$ 41,515,852$ -$ 40,106,962$ 812,699$ 596,191$ Pupil Personnel Services 12,704,008 12,704,008 - 12,700,417 - 3,591 Instructional Media Services 327,590 327,590 - 318,693 - 8,897 Instruction and Curriculum Development 29,937,238 29,937,238 - 27,917,889 1,972,983 46,366 Instructional Staff Training Services 28,158,744 28,158,744 - 26,881,461 1,194,053 83,230 Instructional Related Technology 160,838 160,838 - 156,705 - 4,133 Board of Education - - - - - - General Administration 4,644,560 4,644,560 - 4,435,778 197,841 10,941 School Administration 921,618 921,618 - 738,104 - 183,514 Facilities Acquisition & Construction 2,436,233 5,295 - 1,830 - 3,465 Fiscal Services 173,519 173,519 - 173,519 - - Food Services 85,312,947 85,312,947 85,311,333 1,614 - - Central Services 1,599,292 1,599,292 - 375,714 1,212,800 10,778 Pupil Transportation Services 7,278,386 7,278,386 - 7,258,937 - 19,449 Operation of Plant 375,076 375,076 - 283,745 - 91,331 Maintenance of Plant 13,570 13,570 - - - 13,570 Administrative Technology Services 1,941,954 1,941,954 - 522,848 1,419,106 - Community Services 10,116,979 10,116,979 - 5,100,516 - 5,016,463 Capital Outlay: Facilities Acquisition & Construction 28,965,559 - - - - - Other Capital Outlay 3,262,918 3,262,918 1,719,852 1,234,599 231,258 77,209 Debt Service: Principal 43,207,841 - - - - - Interest and Fiscal Charges 60,306,054 - - - - -
Total Expenditures 363,360,776 228,450,384 87,031,185 128,209,331 7,040,740 6,169,128
Excess (Deficiency) of Revenues Over (Under) Expenditures 24,566,710 2,223,390 1,984,855 - - 238,535
OTHER FINANCIAL SOURCES (USES)Face Value of Refunding Bonds 8,569,000 - - - - - Premium on Refunding Bonds 760,867 - - - - - Refunding Lease-Purchase Agreements 413,255,000 - - - - - Premium on Refunding Lease-Purchase Agreements 47,230,914 - - - - - Payments to Refunding Bond Escrow Agent (477,069,241) - - - - -
Transfer In 116,664,481 - - - - - Transfer Out (123,869,386) - - - - -
Total Other Financial Sources (Uses) (14,458,365) - - - - -
Net Change in Fund Balances 10,108,345 2,223,390 1,984,855 - - 238,535
Fund Balances, Beginning 264,604,540 28,669,026 18,222,419 - - 10,446,607
Fund Balances, Ending 274,712,885$ 30,892,416$ 20,207,274$ -$ -$ 10,685,142$
Special Revenue Funds
ORANGE COUNTY PUBLIC SCHOOLSCOMBINING STATEMENT OF REVENUES, EXPENDITURES, AND
CHANGES IN FUND BALANCESNON-MAJOR GOVERNMENTAL FUNDSFor the Fiscal Year Ended June 30, 2015
(continued)
84

Total State Board of OtherNon-Major Education (SBE) Debt Service
Debt Service and Capital Outlay FundFunds Bond Issue
(COBI) FundEXPENDITURESCurrent: Instruction -$ -$ -$ Pupil Personnel Services - - - Instructional Media Services - - - Instruction and Curriculum Development - - - Instructional Staff Training Services - - - Instructional Staff Training Services - - - Board of Education - - - General Administration - - - School Administration - - - Facilities Acquisition & Construction - - - Fiscal Services - - - Food Services - - - Central Services - - - Pupil Transportation Services - - - Operation of Plant - - - Maintenance of Plant - - - Administrative Technology Services - - - Community Services - - - Capital Outlay: - Facilities Acquisition & Construction - - - Other Capital Outlay - - - Debt Service: Principal 43,207,841 4,190,000 39,017,841 Interest and Fiscal Charges 60,301,968 600,739 59,701,229
Total Expenditures 103,509,809 4,790,739 98,719,070
Excess (Deficiency) of Revenues Over (Under) Expenditures (95,622,830) 69,320 (95,692,150)
OTHER FINANCIAL SOURCES (USES)Face Value of Refunding Bonds 8,569,000 8,569,000 - Premium on Refunding Bonds 760,867 760,867 - Refunding Lease-Purchase Agreements 413,255,000 - 413,255,000 Premium on Refunding Lease-Purchase Agreements 47,230,914 - 47,230,914 Payments to Refunding Bond Escrow Agent (477,069,241) (9,506,517) (467,562,724)
Transfer In 116,664,481 - 116,664,481 Transfer Out - - -
Total Other Financial Sources (Uses) 109,411,021 (176,650) 109,587,671
Net Change in Fund Balances 13,788,191 (107,330) 13,895,521
Fund Balances, Beginning 92,535,787 428,408 92,107,379
Fund Balances, Ending 106,323,978$ 321,078$ 106,002,900$
Debt Service Funds
ORANGE COUNTY PUBLIC SCHOOLSCOMBINING STATEMENT OF REVENUES, EXPENDITURES, AND
CHANGES IN FUND BALANCESNON-MAJOR GOVERNMENTAL FUNDSFor the Fiscal Year Ended June 30, 2015
(continued)
85

Total Non-Major Public Education Capital Outlay SectionCapital Projects Capital Outlay & Debt Service 1011.71(2), F.S.
Funds Fund Fund Local CapitalImprovement
Tax FundEXPENDITURESCurrent: Instruction -$ -$ -$ -$ Pupil Personnel Services - - - - Instructional Media Services - - - - Instruction and Curriculum Development - - - - Instructional Staff Training Services - - - - Instructional Related Technology - - - - Board of Education - - - - General Administration - - - - School Administration - - - - Facilities Acquisition & Construction 2,430,938 - 321,360 2,109,578 Fiscal Services - - - - Food Services - - - - Central Services - - - - Pupil Transportation Services - - - - Operation of Plant - - - - Maintenance of Plant - - - - Administrative Technology Services - - - - Community Services - - - - Capital Outlay: Facilities Acquisition & Construction 28,965,559 - 3,013,702 25,951,857 Other Capital Outlay - - - - Debt Service: Principal - - - - Interest and Fiscal Charges 4,086 - 4,086 -
Total Expenditures 31,400,583 - 3,339,148 28,061,435
Excess (Deficiency) of Revenues Over (Under) Expenditures 117,966,150 7,204,905 (1,019,255) 111,780,500
OTHER FINANCIAL SOURCES (USES)Refunding Lease-Purchase Agreements - - - - Premium on Refunding Lease-Purchase Agreements - - - - Payments to Refunding Bond Escrow Agent - - - -
Transfer In - - - - Transfer Out (123,869,386) (7,204,905) - (116,664,481)
Total Other Financial Sources (Uses) (123,869,386) (7,204,905) - (116,664,481)
Net Change in Fund Balances (5,903,236) - (1,019,255) (4,883,981)
Fund Balances, Beginning 143,399,727 - 5,879,951 137,519,776
Fund Balances, Ending 137,496,491$ -$ 4,860,696$ 132,635,795$
(continued)
Capital Projects Funds
For the Fiscal Year Ended June 30, 2015
ORANGE COUNTY PUBLIC SCHOOLSCOMBINING STATEMENT OF REVENUES, EXPENDITURES, AND
CHANGES IN FUND BALANCESNON-MAJOR GOVERNMENTAL FUNDS
86

Variance withFinal Budget -
PositiveOriginal Final Actual Amounts (Negative)
REVENUESFederal Through State Sources: Food Service 79,113,400$ 79,113,400$ 77,367,802$ (1,745,598)$
Total Federal through State 79,113,400 79,113,400 77,367,802 (1,745,598)
State Sources: Food Service 1,259,448 1,259,448 1,251,797 (7,651)
Total State Sources 1,259,448 1,259,448 1,251,797 (7,651)
Local Sources: Food Service 12,022,613 12,022,613 10,172,084 (1,850,529) Interest Income - - 19,802 19,802 Other Local Sources - - 204,555 204,555
Total Local Sources 12,022,613 12,022,613 10,396,441 (1,626,172)
Total Revenues 92,395,461 92,395,461 89,016,040 (3,379,421)
EXPENDITURESCurrent: Food Service 90,900,924 89,181,072 85,311,333 3,869,739
Capital Outlay: Other Capital Outlay - 1,719,852 1,719,852 -
Total Expenditures 90,900,924 90,900,924 87,031,185 3,869,739
Excess (Deficiency) of Revenues Over (Under) Expenditures 1,494,537 1,494,537 1,984,855 490,318
OTHER FINANCIAL SOURCES (USES) Transfer In - - - - Transfer Out - - - -
Total Other Financial Sources (Uses) - - - -
Net Change in Fund Balance 1,494,537 1,494,537 1,984,855 490,318
Fund Balance, Beginning 18,186,688 18,186,688 18,222,419 35,731
Fund Balance, Ending 19,681,225$ 19,681,225$ 20,207,274$ 526,049$
ORANGE COUNTY PUBLIC SCHOOLSSCHEDULE OF REVENUES, EXPENDITURES AND
CHANGES IN FUND BALANCE - BUDGET TO ACTUAL
Budgeted Amounts
Food Service
FOOD SERVICE - SPECIAL REVENUE FUNDFor the Fiscal Year Ended June 30, 2015
87
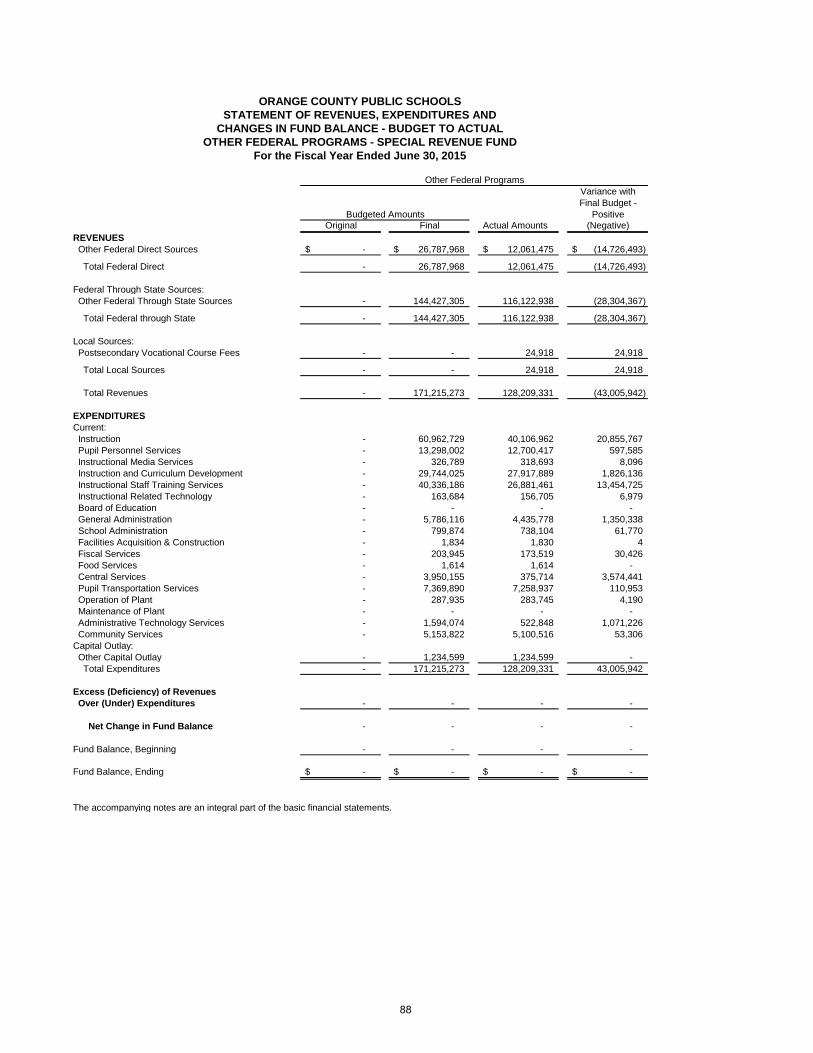
Variance withFinal Budget -
PositiveOriginal Final Actual Amounts (Negative)
REVENUES Other Federal Direct Sources -$ 26,787,968$ 12,061,475$ (14,726,493)$
Total Federal Direct - 26,787,968 12,061,475 (14,726,493)
Federal Through State Sources: Other Federal Through State Sources - 144,427,305 116,122,938 (28,304,367)
Total Federal through State - 144,427,305 116,122,938 (28,304,367)
Local Sources: Postsecondary Vocational Course Fees - - 24,918 24,918
Total Local Sources - - 24,918 24,918
Total Revenues - 171,215,273 128,209,331 (43,005,942)
EXPENDITURESCurrent: Instruction - 60,962,729 40,106,962 20,855,767 Pupil Personnel Services - 13,298,002 12,700,417 597,585 Instructional Media Services - 326,789 318,693 8,096 Instruction and Curriculum Development - 29,744,025 27,917,889 1,826,136 Instructional Staff Training Services - 40,336,186 26,881,461 13,454,725 Instructional Related Technology - 163,684 156,705 6,979 Board of Education - - - - General Administration - 5,786,116 4,435,778 1,350,338 School Administration - 799,874 738,104 61,770 Facilities Acquisition & Construction - 1,834 1,830 4 Fiscal Services - 203,945 173,519 30,426 Food Services - 1,614 1,614 - Central Services - 3,950,155 375,714 3,574,441 Pupil Transportation Services - 7,369,890 7,258,937 110,953 Operation of Plant - 287,935 283,745 4,190 Maintenance of Plant - - - - Administrative Technology Services - 1,594,074 522,848 1,071,226 Community Services - 5,153,822 5,100,516 53,306 Capital Outlay: Other Capital Outlay - 1,234,599 1,234,599 - Total Expenditures - 171,215,273 128,209,331 43,005,942
Excess (Deficiency) of Revenues Over (Under) Expenditures - - - -
Net Change in Fund Balance - - - -
Fund Balance, Beginning - - - -
Fund Balance, Ending -$ -$ -$ -$
The accompanying notes are an integral part of the basic financial statements.
Budgeted Amounts
ORANGE COUNTY PUBLIC SCHOOLSSTATEMENT OF REVENUES, EXPENDITURES AND
CHANGES IN FUND BALANCE - BUDGET TO ACTUALOTHER FEDERAL PROGRAMS - SPECIAL REVENUE FUND
For the Fiscal Year Ended June 30, 2015
Other Federal Programs
88

Variance withFinal Budget -
PositiveOriginal Final Actual Amounts (Negative)
REVENUESFederal Through State Sources: State Fiscal Stabilization Funds -$ -$ -$ -$ ARRA - Race to the Top - - - - Education Jobs Fund - - - - Individuals with Disabilities Education Act - - - - Elementary And Secondary Education Act, Title I - - - - Other Federal Through State Sources -$ 8,148,640$ 7,040,740$ (1,107,900)$
Total Federal through State - 8,148,640 7,040,740 (1,107,900)
Total Revenues - 8,148,640 7,040,740 (1,107,900)
EXPENDITURESCurrent: Instruction - 1,049,580 812,699 236,881 Pupil Personnel Services - - - - Instructional Media Services - - - - Instruction and Curriculum Development - 2,170,765 1,972,983 197,782 Instructional Staff Training Services - 1,806,677 1,194,053 612,624 Instructional Related Technology - - - - Board of Education - - - - General Administration - 212,369 197,841 14,528 School Administration - - - - Administrative Related Technology - - - - Facilities Acquisition & Construction - - - - Fiscal Services - - - - Central Services - 1,258,879 1,212,800 46,079 Pupil Transportation Services - - - - Operation of Plant - - - - Maintenance of Plant - - - - Administrative Technology Services - 1,419,112 1,419,106 6 Community Services - - - - Capital Outlay:
- Other Capital Outlay - 231,258 231,258 - Total Expenditures - 8,148,640 7,040,740 1,107,900
Excess (Deficiency) of Revenues Over (Under) Expenditures - - - -
OTHER FINANCIAL SOURCES (USES) Transfer In - - - - Transfer Out - - - -
Total Other Financial Sources (Uses) - - - -
Net Change in Fund Balance - - - -
Fund Balance, Beginning - - - -
Fund Balance, Ending -$ -$ -$ -$
Budgeted Amounts
ORANGE COUNTY PUBLIC SCHOOLSSCHEDULE OF REVENUES, EXPENDITURES AND
CHANGES IN FUND BALANCE - BUDGET TO ACTUALARRA FEDERAL PROGRAMS - SPECIAL REVENUE FUND
For the Fiscal Year Ended June 30, 2015
ARRA Federal Programs
89

Variance withFinal Budget -
PositiveOriginal Final Actual Amounts (Negative)
REVENUESLocal Sources: Interest Income -$ 53,511$ 53,511$ -$ Other Local Sources - 6,346,915 6,354,152 7,237
Total Local Sources - 6,400,426 6,407,663 7,237
Total Revenues - 6,400,426 6,407,663 7,237
EXPENDITURESCurrent: Instruction - 1,201,850 596,191 605,659 Pupil Personnel Services - 14,113 3,591 10,522 Instructional Media Services - 21,172 8,897 12,275 Instruction and Curriculum Development - 83,542 46,366 37,176 Instructional Staff Training Services - 173,371 83,230 90,141 Instructional Related Technology - 16,243 4,133 12,110 General Administration - 42,712 10,941 31,771 School Administration - 243,902 183,514 60,388 Facilities Acquisition & Construction - 4,183 3,465 718 Food Services - 149,073 - 149,073 Central Services - 13,436 10,778 2,658 Pupil Transportation Services - 47,793 19,449 28,344 Operation of Plant - 127,770 91,331 36,439 Maintenance of Plant - 18,089 13,570 4,519 Community Services - 9,754,147 5,016,463 4,737,684 Capital Outlay: Facilities Acquisition & Construction - - - - Other Capital Outlay - 77,209 77,209 -
Total Expenditures - 11,988,605 6,169,128 5,819,477
Excess (Deficiency) of Revenues Over (Under) Expenditures - (5,588,179) 238,535 5,826,714
OTHER FINANCIAL SOURCES (USES) Transfer In - - - - Transfer Out - - - -
Total Other Financial Sources (Uses) - - - -
Net Change in Fund Balance - (5,588,179) 238,535 5,826,714
Fund Balance, Beginning - 10,446,607 10,446,607 -
Fund Balance, Ending -$ 4,858,428$ 10,685,142$ 5,826,714$
ORANGE COUNTY PUBLIC SCHOOLSSCHEDULE OF REVENUES, EXPENDITURES AND
CHANGES IN FUND BALANCE - BUDGET TO ACTUAL
Budgeted Amounts
Other - Special Revenue Fund
MISCELLANEOUS - SPECIAL REVENUE FUNDFor the Fiscal Year Ended June 30, 2015
90
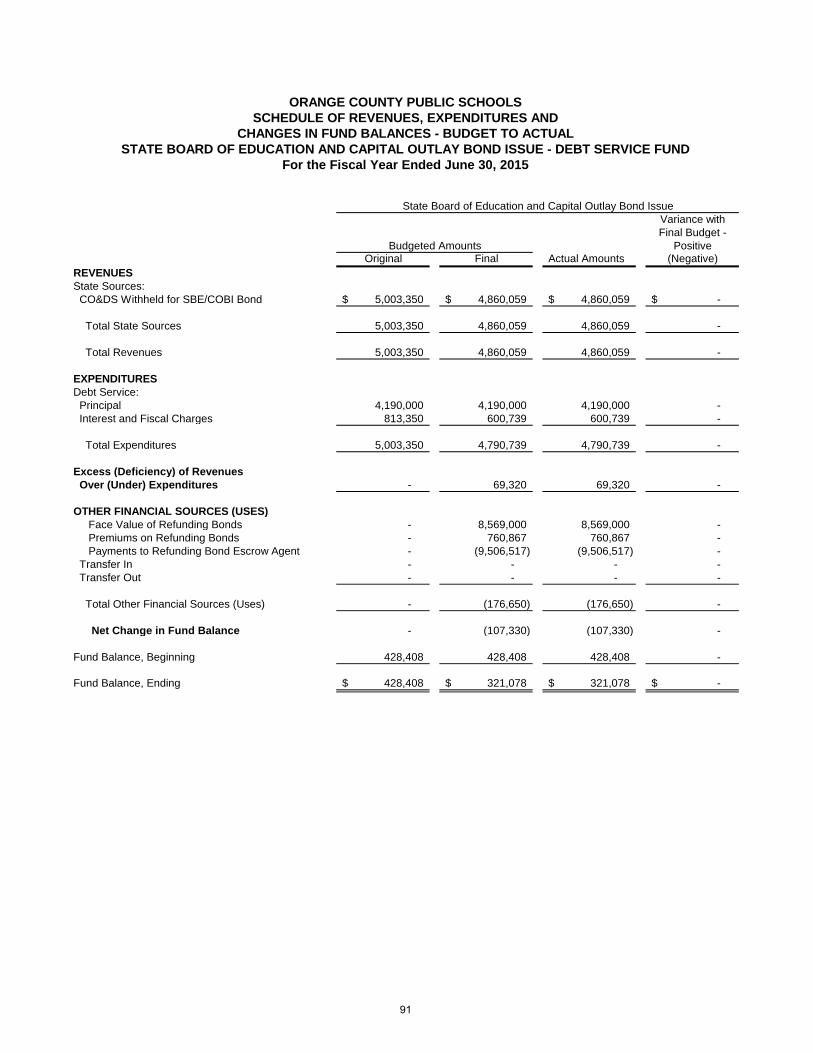
Variance withFinal Budget -
PositiveOriginal Final Actual Amounts (Negative)
REVENUESState Sources: CO&DS Withheld for SBE/COBI Bond 5,003,350$ 4,860,059$ 4,860,059$ -$
Total State Sources 5,003,350 4,860,059 4,860,059 -
Total Revenues 5,003,350 4,860,059 4,860,059 -
EXPENDITURESDebt Service: Principal 4,190,000 4,190,000 4,190,000 - Interest and Fiscal Charges 813,350 600,739 600,739 -
Total Expenditures 5,003,350 4,790,739 4,790,739 -
Excess (Deficiency) of Revenues Over (Under) Expenditures - 69,320 69,320 -
OTHER FINANCIAL SOURCES (USES) Face Value of Refunding Bonds - 8,569,000 8,569,000 - Premiums on Refunding Bonds - 760,867 760,867 - Payments to Refunding Bond Escrow Agent - (9,506,517) (9,506,517) - Transfer In - - - - Transfer Out - - - -
Total Other Financial Sources (Uses) - (176,650) (176,650) -
Net Change in Fund Balance - (107,330) (107,330) -
Fund Balance, Beginning 428,408 428,408 428,408 -
Fund Balance, Ending 428,408$ 321,078$ 321,078$ -$
ORANGE COUNTY PUBLIC SCHOOLSSCHEDULE OF REVENUES, EXPENDITURES AND
CHANGES IN FUND BALANCES - BUDGET TO ACTUAL
Budgeted Amounts
State Board of Education and Capital Outlay Bond Issue
STATE BOARD OF EDUCATION AND CAPITAL OUTLAY BOND ISSUE - DEBT SERVICE FUNDFor the Fiscal Year Ended June 30, 2015
91

Variance withFinal Budget -
PositiveOriginal Final Actual Amounts (Negative)
REVENUESFederal Direct Sources: Miscellaneous Revenue 1,789,713$ 1,789,713$ 1,659,958$ (129,755)$
Total Federal Direct Sources 1,789,713 1,789,713 1,659,958 (129,755)
Local Sources: Interest Income - - 1,366,962 1,366,962
Total Local Sources - - 1,366,962 1,366,962
Total Revenues 1,789,713 1,789,713 3,026,920 1,237,207
EXPENDITURESDebt Service Principal 41,405,841 41,405,841 39,017,841 2,388,000 Interest and Fiscal Charges 64,588,283 64,588,283 59,701,229 4,887,054
Total Expenditures 105,994,124 105,994,124 98,719,070 7,275,054
Excess (Deficiency) of Revenues Over (Under) Expenditures (104,204,411) (104,204,411) (95,692,150) 8,512,261
OTHER FINANCIAL SOURCES (USES)Refunding Lease-Purchase Agreement 413,255,000 413,255,000 413,255,000 -
Premium on Refunding Lease-Purchase Agreement 47,230,914 47,230,914 47,230,914 - Payments to Refunding Bond Escrow Agent (467,562,724) (467,562,724) (467,562,724) -
Transfer In 116,664,481 116,664,481 116,664,481 - Transfer Out - - - -
Total Other Financial Sources (Uses) 109,587,671 109,587,671 109,587,671 -
Net Change in Fund Balance 5,383,260 5,383,260 13,895,521 8,512,261
Fund Balance, Beginning 90,756,857 90,756,857 92,107,379 1,350,522
Fund Balance, Ending 96,140,117$ 96,140,117$ 106,002,900$ 9,862,783$
Budgeted Amounts
Other Debt Service - Debt Service Fund
ORANGE COUNTY PUBLIC SCHOOLSSCHEDULE OF REVENUES, EXPENDITURES AND
CHANGES IN FUND BALANCES - BUDGET TO ACTUAL
For the Fiscal Year Ended June 30, 2015OTHER DEBT SERVICE - DEBT SERVICE FUND
92

Variance withFinal Budget -
PositiveOriginal Final Actual Amounts (Negative)
REVENUESState Sources: Public Education Capital Outlay 7,714,111$ 7,714,111$ 7,204,905$ (509,206)$
Total State Sources 7,714,111 7,714,111 7,204,905 (509,206)
Local Sources: Interest Income - - - -
Total Local Sources - - - -
Total Revenues 7,714,111 7,714,111 7,204,905 (509,206)
EXPENDITURESCurrent: Facilities Acquisition & Construction Remodeling and Renovations - - - -
Total Expenditures - - - -
Excess (Deficiency) of Revenues Over (Under) Expenditures 7,714,111 7,714,111 7,204,905 (509,206)
OTHER FINANCIAL SOURCES (USES) Transfer In - - - - Transfer Out (7,714,111) (7,714,111) (7,204,905) 509,206
Total Other Financial Sources (Uses) (7,714,111) (7,714,111) (7,204,905) 509,206
Net Change in Fund Balance - - - -
Fund Balance, Beginning - - - -
Fund Balance, Ending -$ -$ -$ -$
ORANGE COUNTY PUBLIC SCHOOLSSCHEDULE OF REVENUES, EXPENDITURES AND
CHANGES IN FUND BALANCES - BUDGET TO ACTUAL
Budgeted Amounts
Public Education Capital Outlay (PECO)
PUBLIC EDUCATION CAPITAL OUTLAY - CAPITAL PROJECTS FUNDFor the Fiscal Year Ended June 30, 2015
93

Variance withFinal Budget -
PositiveOriginal Final Actual Amounts (Negative)
REVENUESState Sources: CO&DS Distribution 2,224,632$ 2,224,632$ 2,306,298$ 81,666$
Total State Sources 2,224,632 2,224,632 2,306,298 81,666
Local Sources: Interest Income - - 13,595 13,595
Total Local Sources - - 13,595 13,595
Total Revenues 2,224,632 2,224,632 2,319,893 95,261
EXPENDITURESCurrent: Facilities Acquisition & Construction - 321,360 321,360 - Capital Outlay: Facilities Acquisition & Construction 8,104,583 7,779,137 3,013,702 4,765,435 Debt Service: Interest and Fiscal Charges - 4,086 4,086 -
Total Expenditures 8,104,583 8,104,583 3,339,148 4,765,435
Excess (Deficiency) of Revenues Over (Under) Expenditures (5,879,951) (5,879,951) (1,019,255) 4,860,696
OTHER FINANCIAL SOURCES (USES) Transfer In - - - - Transfer Out - - - -
Total Other Financial Sources (Uses) - - - -
Net Change in Fund Balance (5,879,951) (5,879,951) (1,019,255) 4,860,696
Fund Balance, Beginning 5,879,951 5,879,951 5,879,951 -
Fund Balance, Ending -$ -$ 4,860,696$ 4,860,696$
ORANGE COUNTY PUBLIC SCHOOLSSCHEDULE OF REVENUES, EXPENDITURES AND
CHANGES IN FUND BALANCES - BUDGET TO ACTUAL
Budgeted Amounts
Capital Outlay & Debt Service
CAPITAL OUTLAY & DEBT SERVICE - CAPITAL PROJECTS FUNDFor the Fiscal Year Ended June 30, 2015
94

Variance withFinal Budget -
PositiveOriginal Final Actual Amounts (Negative)
REVENUESLocal Sources: Ad Valorem Taxes 138,897,295$ 138,897,295$ 139,441,378$ 544,083$ Interest Income 350,983 350,983 Other Local Sources - - 49,574 49,574
Total Local Sources 138,897,295 138,897,295 139,841,935 944,640
Total Revenues 138,897,295 138,897,295 139,841,935 944,640
EXPENDITURESCurrent: Facilities Acquisition & Construction - 2,109,578 2,109,578 - Capital Outlay: Facilities Acquisition & Construction 85,289,479 83,179,901 25,951,857 57,228,044
Total Expenditures 85,289,479 85,289,479 28,061,435 57,228,044
Excess (Deficiency) of Revenues Over (Under) Expenditures 53,607,816 53,607,816 111,780,500 58,172,684
OTHER FINANCIAL SOURCES (USES) Transfer In - - - - Transfer Out (133,414,859) (133,414,859) (116,664,481) 16,750,378
Total Other Financial Sources (Uses) (133,414,859) (133,414,859) (116,664,481) 16,750,378
Net Change in Fund Balance (79,807,043) (79,807,043) (4,883,981) 74,923,062
Fund Balance, Beginning 137,519,776 137,519,776 137,519,776 -
Fund Balance, Ending 57,712,733$ 57,712,733$ 132,635,795$ 74,923,062$
ORANGE COUNTY PUBLIC SCHOOLSSCHEDULE OF REVENUES, EXPENDITURES AND
CHANGES IN FUND BALANCES - BUDGET TO ACTUAL
Budgeted Amounts
Section 1011.71(2), Florida Statutes, Local Capital Improvement Tax Fund
CAPITAL PROJECTS FUNDFor the Fiscal Year Ended June 30, 2015
SECTION 1011.71(2), FLORIDA STATUTES, LOCAL CAPITAL IMPROVEMENT TAX
95

Variance withFinal Budget -
PositiveOriginal Final Actual Amounts (Negative)
REVENUES
Local Sources: Local Sales Taxes 193,182,027$ 193,182,027$ 209,231,028$ 16,049,001$ Impact Fees 33,854,649 33,854,649 56,532,082 22,677,433 Interest Income - - 8,277,716 8,277,716 Miscellaneous - - 2,086,258 2,086,258
Total Local Sources 227,036,676 227,036,676 276,127,084 49,090,408
Total Revenues 227,036,676 227,036,676 276,127,084 49,090,408
EXPENDITURESCurrent: Facilities Acquisition & Construction - 48,054,735 48,054,735 - Capital Outlay: Facilities Acquisition & Construction 520,931,466 522,637,816 147,926,787 374,711,029
Total Expenditures 520,931,466 570,692,551 195,981,522 374,711,029
Excess (Deficiency) of Revenues Over (Under) Expenditures (293,894,790) (343,655,875) 80,145,562 423,801,437
OTHER FINANCIAL SOURCES (USES) Transfer Out - - - -
Total Other Financial Sources (Uses) - - - -
Net Change in Fund Balance (293,894,790) (343,655,875) 80,145,562 423,801,437
Fund Balance, Beginning 930,456,733 930,456,733 930,456,733 -
Fund Balance, Ending 636,561,943$ 586,800,858$ 1,010,602,295$ 423,801,437$
ORANGE COUNTY PUBLIC SCHOOLSSCHEDULE OF REVENUES, EXPENDITURES AND
CHANGES IN FUND BALANCES - BUDGET TO ACTUAL
Budgeted Amounts
Other - Capital Projects
OTHER - CAPITAL PROJECTS FUNDFor the Fiscal Year Ended June 30, 2015
96

ORANGE COUNTY PUBLIC SCHOOLS INTERNAL SERVICE FUNDS
June 30, 2015 Internal service funds are used to account for the District’s individual self-insurance programs and for the District’s print shop. Self-Insurance Fund – To account for the financial activities of the District’s self-insured property, casualty, liability, and workers’ compensation programs. Employee Benefits Fund – To account for the financial activities of the District’s self-insured employee health and life insurance programs. Other Internal Service Fund – To account for the financial activities of the District’s other internal service programs, such as the print shop.
97

Employee Other InternalTotal Self-Insurance Benefits Service
ASSETSCurrent Assets: Cash 10,000,000$ -$ 10,000,000$ -$ Investments 136,476,467 38,361,608 97,967,068 147,791 Accounts Receivable 17,963,761 - 17,962,924 837 Interest Receivable 1,890 - 1,890 - Deposits Receivable 225,000 155,000 70,000 - Prepaid Items 50,000 - 50,000 - Inventory 17,895 - - 17,895
Total Current Assets 164,735,013 38,516,608 126,051,882 166,523
Noncurrent Assets: Furniture and Equipment 73,614 - - 73,614 Less Accumulated Depreciation (56,431) - - (56,431) Computer Software 1,100 - - 1,100 Less Accumulated Depreciation (1,100) - - (1,100)
Total Noncurrent Assets 17,183 - - 17,183
Total Assets 164,752,196 38,516,608 126,051,882 183,706
LIABILITIESCurrent Liabilities: Salaries and Wages Payable 23,561 - 5,633 17,928 Accounts Payable 1,434,805 - 1,421,330 13,475 Unearned Revenue 45,671,996 - 45,671,996 - Estimated Unpaid Claims 18,852,720 5,752,720 13,100,000 -
Total Current Liabilities 65,983,082 5,752,720 60,198,959 31,403
Long-Term Liabilities: Estimated Insurance Claims Payable 7,988,786 7,988,786 - -
Total Long-Term Liabilities 7,988,786 7,988,786 - -
Total Liabilities 73,971,868 13,741,506 60,198,959 31,403
NET POSITIONNet Investment in Capital Assets 17,183 - - 17,183 Unrestricted 90,763,145 24,775,102 65,852,923 135,120
Total Net Position 90,780,328$ 24,775,102$ 65,852,923$ 152,303$
COMBINING STATEMENT OF NET POSITIONORANGE COUNTY PUBLIC SCHOOLS
Self-InsuranceInternal Service Funds
June 30, 2015INTERNAL SERVICE FUNDS
98

Employee Other InternalTotal Self-Insurance Benefits Service
OPERATING REVENUES Charges for Services 5,385,960$ -$ -$ 5,385,960$ Premium Revenues 197,029,690 7,242,357 189,787,333 - Other Operating Revenues 685,153 342,147 343,006 - Total Operating Revenues 203,100,803 7,584,504 190,130,339 5,385,960
OPERATING EXPENSES Salaries 827,337 - 383,124 444,213 Employees Benefits 316,336 - 138,467 177,869 Purchased Services 13,526,893 15,312 8,892,810 4,618,771 Energy Services 85,000 - - 85,000 Material and Supplies 127,707 - - 127,707 Capital Outlay 830 - - 830 Claims Expense 175,008,082 7,975,304 167,032,778 - Depreciation 4,794 - - 4,794
Total Operating Expenses 189,896,979 7,990,616 176,447,179 5,459,184
Operating Income (Loss) 13,203,824 (406,112) 13,683,160 (73,224)
NONOPERATING REVENUES, NET Investment Earnings, net 626,131 186,546 437,033 2,552
Total Nonoperating Revenues, Net 626,131 186,546 437,033 2,552
Change in Net Position 13,829,955 (219,566) 14,120,193 (70,672)
Total Net Position, Beginning 76,950,373 24,994,668 51,732,730 222,975
Total Net Position, Ending 90,780,328$ 24,775,102$ 65,852,923$ 152,303$
Self-Insurance
ORANGE COUNTY PUBLIC SCHOOLS
Internal Service Funds
For the Fiscal Year Ended June 30, 2015INTERNAL SERVICE FUNDSCHANGES IN NET POSITION
COMBINING STATEMENT OF REVENUES, EXPENSES, AND
99
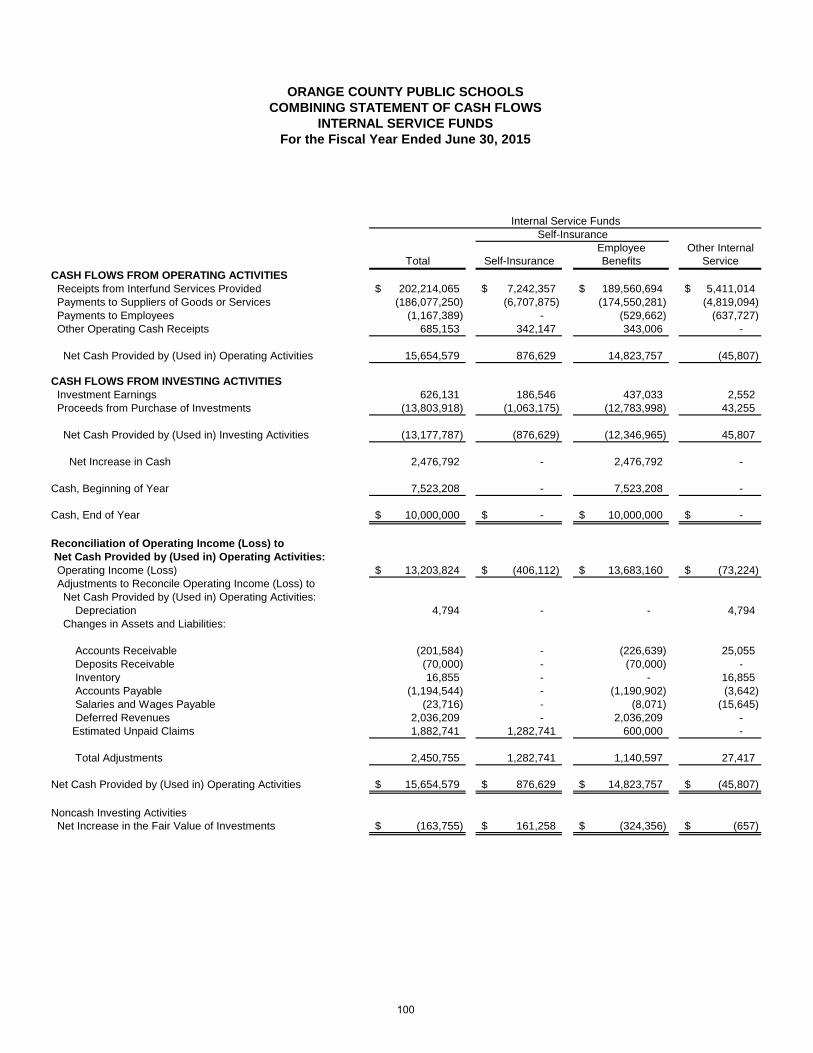
Employee Other InternalTotal Self-Insurance Benefits Service
CASH FLOWS FROM OPERATING ACTIVITIES Receipts from Interfund Services Provided 202,214,065$ 7,242,357$ 189,560,694$ 5,411,014$ Payments to Suppliers of Goods or Services (186,077,250) (6,707,875) (174,550,281) (4,819,094) Payments to Employees (1,167,389) - (529,662) (637,727) Other Operating Cash Receipts 685,153 342,147 343,006 -
Net Cash Provided by (Used in) Operating Activities 15,654,579 876,629 14,823,757 (45,807)
CASH FLOWS FROM INVESTING ACTIVITIES Investment Earnings 626,131 186,546 437,033 2,552 Proceeds from Purchase of Investments (13,803,918) (1,063,175) (12,783,998) 43,255
Net Cash Provided by (Used in) Investing Activities (13,177,787) (876,629) (12,346,965) 45,807
Net Increase in Cash 2,476,792 - 2,476,792 -
Cash, Beginning of Year 7,523,208 - 7,523,208 -
Cash, End of Year 10,000,000$ -$ 10,000,000$ -$
Reconciliation of Operating Income (Loss) to Net Cash Provided by (Used in) Operating Activities: Operating Income (Loss) 13,203,824$ (406,112)$ 13,683,160$ (73,224)$ Adjustments to Reconcile Operating Income (Loss) to Net Cash Provided by (Used in) Operating Activities: Depreciation 4,794 - - 4,794 Changes in Assets and Liabilities:
Accounts Receivable (201,584) - (226,639) 25,055 Deposits Receivable (70,000) - (70,000) - Inventory 16,855 - - 16,855 Accounts Payable (1,194,544) - (1,190,902) (3,642) Salaries and Wages Payable (23,716) - (8,071) (15,645) Deferred Revenues 2,036,209 - 2,036,209 - Estimated Unpaid Claims 1,882,741 1,282,741 600,000 -
Total Adjustments 2,450,755 1,282,741 1,140,597 27,417
Net Cash Provided by (Used in) Operating Activities 15,654,579$ 876,629$ 14,823,757$ (45,807)$
Noncash Investing Activities Net Increase in the Fair Value of Investments (163,755)$ 161,258$ (324,356)$ (657)$
Self-InsuranceInternal Service Funds
ORANGE COUNTY PUBLIC SCHOOLSCOMBINING STATEMENT OF CASH FLOWS
INTERNAL SERVICE FUNDSFor the Fiscal Year Ended June 30, 2015
100

ORANGE COUNTY PUBLIC SCHOOLS FIDUCIARY FUNDS
June 30, 2015 Agency funds are Fiduciary Funds and are used to account for resources held by the District in a trustee capacity or as an agent for individuals, private organizations. These resources include student and club activities funds that are held in trust for student, athletic, class, club activities, etc.
101

July 1, 2014 Additions Deletions June 30, 2015Assets Cash and Cash Equivalents 11,747,011$ 43,250,328$ 43,502,443$ 11,494,896$ Investments 2,914,008 282,693 - 3,196,701 Accounts Receivable, Net 159,254 41,222 159,254 41,222 Inventory 281,549 299,934 281,549 299,934
Total Assets 15,101,822$ 43,874,177$ 43,943,246$ 15,032,753$
Liabilities Accounts Payable 720,264$ 802,432$ 720,264$ 802,432$ Internal Accounts Payable 14,381,558 43,071,745 43,222,982 14,230,321
Total Liabilities 15,101,822$ 43,874,177$ 43,943,246$ 15,032,753$
Student and Club Activities Funds
ORANGE COUNTY PUBLIC SCHOOLSSTATEMENT OF CHANGES IN ASSETS AND LIABILITIES
For the Fiscal Year Ended June 30, 2015FIDUCIARY FUNDS
Agency Funds
102

ORANGE COUNTY PUBLIC SCHOOLS STATISTICAL SECTION
June 30, 2015 This part of the Orange County Public Schools’ comprehensive annual financial report presents detailed information as a context for understanding what the information in the financial statements, note disclosures, and required supplementary information says about the District’s overall financial health. Financial Trends
These schedules contain trend information to help the reader understand how the District’s financial performance and well-being have changed over time.
Revenue Capacity
These schedules contain information to help the reader assess the District’s most significant local revenues sources, the property tax.
Debt Capacity
These schedules present information to help the reader assess the affordability of the District’s current levels of outstanding debt and the government’s ability to issue additional debt in the future.
Demographic and Economic Information
These schedules offer demographic and economic indicators to help the reader understand the environment within which the District’s financial activities take place.
Operating Information
These schedules contain service data to help the reader understand how the information in the District’s financial report relates to the services the District provides and the activities it performs.
103

Jun
e 30
, 200
6Ju
ne
30, 2
007
Jun
e 30
, 200
8Ju
ne
30, 2
009
Jun
e 30
, 201
0Ju
ne
30, 2
011
Jun
e 30
, 201
2Ju
ne
30, 2
013
Jun
e 30
, 201
4 Ju
ne
30, 2
015
Go
vern
men
tal A
ctiv
itie
s: N
et In
vest
men
t in
Cap
ital A
sset
s89
7,04
6,11
0$
1,15
9,68
5,08
8$
1,32
9,20
0,41
8$
1,
480,
390,
688
$
1,58
1,22
6,96
3$
1,
750,
248,
289
$
1,81
0,55
2,81
0$
1,
839,
939,
385
$
1,91
3,43
5,17
9$
2,
077,
277,
202
$
Res
tric
ted
528,
520,
142
61
4,08
1,21
5
680,
488,
091
75
3,70
7,94
6
853,
911,
789
94
1,97
7,66
9
1,00
4,65
7,53
7
1,
075,
555,
350
1,19
9,84
3,60
9
1,
279,
210,
000
Unr
estr
icte
d85
,368
,323
90
,441
,214
11
4,54
7,24
3
128,
055,
774
13
2,23
1,91
1
140,
482,
671
20
2,80
3,45
7
294,
758,
705
30
0,16
1,07
9
(263
,197
,159
)
To
tal P
rim
ary
Go
vern
men
t N
et P
osi
tio
n1,
510,
934,
575
$ 1,
864,
207,
517
$ 2,
124,
235,
752
$
2,36
2,15
4,40
8$
2,
567,
370,
663
$
2,83
2,70
8,62
9$
3,
018,
013,
804
$
3,21
0,25
3,44
0$
3,
413,
439,
867
$
3,09
3,29
0,04
3$
Sou
rce:
Dis
tric
t Rec
ords
OR
AN
GE
CO
UN
TY
PU
BL
IC S
CH
OO
LS
NE
T P
OS
ITIO
N B
Y C
OM
PO
NE
NT
LA
ST
TE
N F
ISC
AL
YE
AR
S(A
ccru
al B
asis
of
Acc
ou
nti
ng
)
104

Jun
e 30
, 200
6Ju
ne
30, 2
007
Jun
e 30
, 200
8Ju
ne
30, 2
009
Jun
e 30
, 201
0Ju
ne
30, 2
011
Jun
e 30
, 201
2Ju
ne
30, 2
013
Jun
e 30
, 201
4 Ju
ne
30,
2015
Exp
ense
s: G
ove
rnm
enta
l Act
ivit
ies:
In
stru
ctio
n77
4,65
3,10
1$
839,
184,
133
$
87
1,00
0,47
9$
809,
437,
824
$
82
7,41
6,66
0$
851,
696,
441
$
83
5,19
3,44
5$
872,
344,
750
$
93
0,70
5,90
6$
980,
500,
950
$
Pup
il P
erso
nnel
Ser
vice
s44
,570
,348
49
,999
,463
51
,547
,524
47
,709
,555
47
,437
,365
46
,591
,067
43
,138
,545
43
,356
,959
47
,188
,554
52
,618
,608
In
stru
ctio
nal M
edia
Ser
vice
s15
,808
,065
18
,790
,907
19
,457
,552
16
,736
,740
15
,834
,869
16
,008
,134
15
,127
,197
15
,303
,137
15
,938
,431
15
,715
,124
In
stru
ctio
n an
d C
urric
ulum
Dev
elop
men
t66
,069
,289
82
,983
,991
88
,484
,654
83
,817
,286
84
,138
,792
82
,235
,453
67
,985
,800
67
,893
,336
69
,778
,905
78
,648
,709
In
stru
ctio
nal S
taff
Tra
inin
g S
ervi
ces
29,4
41,4
54
29,2
91,0
38
28,7
40,8
32
29,5
21,0
16
23,4
76,1
26
25,3
29,8
09
37,2
11,3
22
37,8
78,6
58
58,5
21,2
87
56,3
62,0
38
Inst
ruct
iona
l Rel
ated
Tec
hnol
ogy
16,9
23,2
57
12,9
34,3
39
13,8
58,0
98
13,2
01,6
91
15,6
24,3
29
13,4
85,8
75
10,6
50,1
23
11,6
08,8
54
12,9
53,8
44
11,7
90,8
95
Boa
rd o
f Edu
catio
n2,
139,
583
2,19
7,12
6
4,
575,
420
2,98
3,73
5
2,
981,
986
2,90
3,43
3
3,
209,
298
3,31
4,56
3
4,
354,
904
4,64
7,30
3
Gen
eral
Adm
inis
trat
ion
6,10
8,45
0
7,
915,
232
7,48
5,87
9
7,
722,
926
10,5
16,3
83
11,5
53,8
86
7,32
2,84
9
7,
728,
937
10,7
66,3
61
11,2
39,1
01
Sch
ool A
dmin
istr
atio
n83
,202
,219
91
,130
,653
96
,887
,952
93
,105
,835
94
,117
,648
95
,759
,709
92
,097
,454
94
,678
,038
10
1,26
3,99
4
106,
137,
125
Fac
ilitie
s S
ervi
ces
58,1
86,9
48
60,8
14,9
76
42,4
31,1
81
36,6
57,3
27
33,1
51,6
20
31,7
11,4
82
29,5
46,2
03
47,0
01,5
72
47,1
79,9
26
66,4
66,8
26
Fis
cal S
ervi
ces
5,73
7,93
8
6,
434,
143
6,61
3,62
7
5,
876,
622
5,83
4,29
1
5,
946,
074
5,78
9,06
4
5,
814,
923
6,23
6,17
7
6,
266,
407
F
ood
Ser
vice
s56
,535
,253
59
,129
,381
61
,697
,945
61
,952
,673
64
,675
,888
69
,662
,889
72
,567
,053
79
,241
,915
85
,609
,992
84
,404
,556
C
entr
al S
ervi
ces
16,5
35,8
69
20,9
08,7
65
18,1
02,9
55
15,7
07,5
64
16,9
05,8
10
18,7
33,0
96
15,4
21,0
25
16,2
24,6
84
25,2
48,5
70
14,7
50,3
56
Pup
il T
rans
port
atio
n S
ervi
ces
68,2
71,4
47
74,1
73,4
28
78,4
07,6
16
72,0
73,0
03
74,0
29,4
56
72,4
21,1
19
68,7
03,1
32
74,2
42,6
14
77,7
34,6
89
76,1
09,4
64
Ope
ratio
n of
Pla
nt80
,452
,243
91
,605
,636
10
0,07
9,19
3
96,5
14,8
89
100,
646,
104
97
,187
,143
96
,304
,524
96
,008
,891
10
2,19
8,88
4
108,
568,
604
Mai
nten
ance
of P
lant
41,2
98,1
32
42,4
17,7
18
42,6
24,3
76
33,9
90,1
65
33,2
70,8
74
32,3
38,0
81
30,2
62,6
36
31,3
46,9
74
35,5
51,3
49
35,9
09,4
09
Adm
inis
trat
ive
Tec
hnol
ogy
Ser
vice
s12
,086
,405
16
,466
,533
15
,531
,428
16
,378
,960
16
,157
,009
15
,896
,087
17
,651
,492
17
,259
,825
21
,709
,350
21
,921
,750
C
omm
unity
Ser
vice
s10
,439
,371
10
,712
,754
10
,708
,297
12
,002
,682
12
,933
,688
13
,088
,059
11
,326
,270
13
,234
,981
12
,617
,195
10
,832
,534
In
tere
st o
n Lo
ng-T
erm
Deb
t56
,327
,344
62
,278
,003
75,3
09,2
76
74,4
73,3
75
79,2
56,3
32
67,8
06,9
17
72,8
68,6
73
74,3
85,8
24
78,2
97,4
29
73,7
96,3
61
Dep
reci
atio
n -
Una
lloca
ted
47,8
31,6
85
55,0
76,5
25
59,6
76,9
62
59,1
21,1
00
62,9
80,8
01
74,6
04,6
46
107,
710,
692
77
,598
,551
79
,690
,646
83
,401
,950
Tot
al P
rimar
y G
over
nmen
t Exp
ense
s1,
492,
618,
401
1,63
4,44
4,74
4
1,
693,
221,
246
1,58
8,98
4,96
81,
621,
386,
031
1,64
4,95
9,40
01,
640,
086,
797
1,68
6,46
7,98
61,
823,
546,
393
1,90
0,08
8,07
0
Pro
gra
m R
even
ues
: G
ove
rnm
enta
l Act
ivit
ies:
C
harg
es fo
r S
ervi
ces:
Ins
truc
tion
3,37
0,37
9
3,
357,
223
3,46
0,55
0
4,
405,
426
4,73
8,58
7
4,
134,
692
5,10
5,33
5
5,
184,
149
4,78
4,99
7
3,
945,
226
Foo
d S
ervi
ces
17,5
64,7
71
18,7
65,3
75
17,7
22,7
28
18,4
41,6
37
17,0
31,4
89
16,3
49,2
73
14,8
09,4
08
12,5
92,1
61
11,5
79,1
98
10,1
72,0
84
P
upil
Tra
nspo
rtat
ion
Ser
vice
s51
0,06
6
584,
596
55
0,24
7
485,
558
48
4,20
2
573,
116
60
5,50
0
597,
560
84
0,51
2
594,
738
M
aint
enan
ce o
f Pla
nt19
1,28
4
264,
653
22
8,57
8
136,
059
26
6,98
9
-
-
-
-
-
C
omm
unity
Ser
vice
s9,
080,
076
8,99
3,19
7
8,
853,
058
8,26
3,97
8
7,
252,
788
7,18
4,79
9
6,
941,
844
7,02
5,08
5
7,
105,
320
6,96
9,10
3
Ope
ratin
g G
rant
s an
d C
ontr
ibut
ions
64,9
89,1
52
69,0
94,3
87
73,7
80,0
22
75,5
34,1
42
52,5
27,0
46
58,4
19,5
51
63,6
79,6
82
70,6
55,2
48
73,9
36,6
37
78,6
19,5
99
Cap
ital G
rant
s an
d C
ontr
ibut
ions
46,8
34,9
37
121,
148,
558
31
,098
,618
21
,489
,767
23
,894
,709
13
,889
,001
30
,156
,218
47
,365
,932
57
,022
,637
63
,809
,285
Tot
al P
rimar
y G
over
nmen
t Pro
gram
Rev
enue
s14
2,54
0,66
5$
222,
207,
989
$
13
5,69
3,80
1$
128,
756,
567
$
10
6,19
5,81
0$
100,
550,
432
$
12
1,29
7,98
7$
143,
420,
135
$
15
5,26
9,30
1$
164,
110,
035
$
Tot
al N
et (
Exp
ense
)/R
even
ue(1
,350
,077
,736
)$
(1,4
12,2
36,7
55)
$ (1
,557
,527
,445
)$
(1,4
60,2
28,4
01)
$ (1
,515
,190
,221
)$
(1,5
44,4
08,9
68)
$ (1
,518
,788
,810
)$
(1,5
43,0
47,8
51)
$ (1
,668
,277
,092
)$
(1,7
35,9
78,0
35)
$
Gen
eral
Rev
enu
es
Pro
pert
y T
axes
:
Le
vied
for
Gen
eral
Pur
pose
s45
7,23
6,47
1
504,
809,
925
58
6,02
2,10
4
614,
940,
923
60
4,09
9,35
6
548,
160,
633
58
5,88
2,33
6
580,
088,
306
59
0,73
9,23
7
648,
247,
462
Le
vied
for
Cap
ital P
roje
cts
109,
572,
157
13
3,53
6,23
5
156,
337,
901
16
3,24
5,73
9
146,
881,
582
12
8,64
0,28
8
124,
825,
912
12
4,76
4,97
0
129,
144,
730
13
9,44
1,37
8
S
ales
Tax
es16
6,34
5,31
6
156,
331,
083
16
6,19
0,26
9
154,
176,
277
15
0,84
3,95
7
163,
594,
345
17
0,82
6,44
3
181,
301,
579
19
1,77
0,16
3
209,
231,
028
Impa
ct F
ees
88,2
53,7
59
55,4
13,7
04
37,5
59,6
75
19,0
66,8
58
21,4
82,0
85
16,1
10,9
10
-
-
-
-
F
lorid
a E
duca
tiona
l Fin
ance
Pro
gram
435,
458,
428
47
3,40
6,08
4
397,
610,
759
30
5,07
6,34
9
293,
610,
582
38
4,63
3,84
6
382,
177,
641
42
9,17
1,84
9
508,
472,
169
50
6,30
5,20
2
G
rant
s an
d C
ontr
ibut
ions
Not
Res
tric
ted
to S
peci
fic P
rogr
ams
298,
147,
622
33
6,40
4,69
8
378,
879,
877
37
6,31
0,31
8
439,
570,
874
49
6,39
5,05
7
384,
353,
496
40
1,85
5,73
1
411,
250,
042
42
0,93
0,41
2
U
nres
tric
ted
Inve
stm
ent E
arni
ngs
39,2
82,3
29
64,8
81,3
79
68,6
72,0
10
26,1
64,5
03
36,8
27,3
38
46,3
97,9
43
28,1
65,7
39
2,55
1,55
3
22
,125
,795
13
,142
,839
M
isce
llane
ous
24,9
67,5
77
40
,726
,589
26
,283
,085
39
,166
,090
27
,090
,702
25
,813
,912
27
,862
,418
15
,553
,499
17
,961
,383
19
,822
,234
Tot
al G
ener
al R
even
ues
1,61
9,26
3,65
9
1,
765,
509,
697
1,81
7,55
5,68
0
1,
698,
147,
057
1,72
0,40
6,47
6
1,
809,
746,
934
1,70
4,09
3,98
5
1,
735,
287,
487
1,87
1,46
3,51
9
1,
957,
120,
555
Ch
ang
es in
Net
Po
siti
on
269,
185,
923
$
35
3,27
2,94
2$
260,
028,
235
$
23
7,91
8,65
6$
205,
216,
255
$
26
5,33
7,96
6$
185,
305,
175
$
19
2,23
9,63
6$
203,
186,
427
$
22
1,14
2,52
0$
Sou
rce:
Dis
tric
t Rec
ords
Fis
cal Y
ear
En
ded
OR
AN
GE
CO
UN
TY
PU
BL
IC S
CH
OO
LS
CH
AN
GE
S IN
NE
T P
OS
ITIO
NL
AS
T T
EN
FIS
CA
L Y
EA
RS
(Acc
rual
Bas
is o
f A
cco
un
tin
g)
105

Fiscal Sales TotalYear General Capital Tax
Ended Purposes Projects
June 30, 2015 648,247,462$ 139,441,378$ 209,231,028$ 996,919,868$ June 30, 2014 590,739,237 129,144,730 191,770,163 911,654,130 June 30, 2013 580,088,306 124,764,970 181,301,579 886,154,855 June 30, 2012 585,882,336 124,825,912 170,826,444 881,534,691 June 30, 2011 548,160,633 128,640,288 163,594,345 840,395,266 June 30, 2010 604,099,356 146,881,582 150,843,957 901,824,895 June 30, 2009 614,940,923 163,245,739 154,176,277 932,362,939 June 30, 2008 586,022,104 156,337,901 166,190,269 908,550,274 June 30, 2007 504,809,925 133,536,235 156,331,083 794,677,243June 30, 2006 457,236,471 109,572,157 166,345,316 733,153,944
Source: District Records
Property Tax
ORANGE COUNTY PUBLIC SCHOOLSGOVERNMENTAL ACTIVITIES TAX REVENUES BY SOURCE
LAST TEN FISCAL YEARS(Accrual Basis of Accounting)
106

June 30, 2006 June 30, 2007 June 30, 2008 June 30, 2009 June 30, 2010 June 30, 2011 June 30, 2012 June 30, 2013 June 30, 2014 June 30, 2015General Fund Reserved for: Encumbrances 31,490,932$ 31,459,508$ 15,246,115$ 18,437,139$ 16,160,245$ -$ -$ -$ -$ -$ State Categorical Programs 6,857,788 10,259,815 12,852,595 18,790,146 8,121,378 - - - - - Unreserved 118,512,898 135,861,670 166,033,190 184,771,996 224,773,400 - - - - -
Total General Fund 156,861,618$ 177,580,993$ 194,131,900$ 221,999,281$ 249,055,023$ -$ -$ -$ -$ -$
All Other Governmental Funds Reserved for: Retirement of Long-Term Debt 213,242,363$ 217,299,457$ 106,972,737$ 114,719,846$ 128,895,592$ -$ -$ -$ -$ -$ Encumbrances 230,075,772 215,386,174 256,029,124 195,560,463 220,927,991 - - - - - Unreserved, Reported in: Special Revenue Funds 8,747,800 8,672,393 9,020,366 13,036,712 19,127,746 - - - - - Capital Projects Funds 452,801,555 739,189,016 602,773,069 802,092,095 760,044,505 - - - - -
Total All Other Governmental Funds 904,867,490$ 1,180,547,040$ 974,795,296$ 1,125,409,116$ 1,128,995,834$ -$ -$ -$ -$ -$
General FundNonspendable: 3,494,201$ 2,881,281$ 3,015,602$ 3,032,220$ 3,293,508$ 3,351,893$ 3,318,550$ Spendable: Restricted 28,235,228 17,508,810 25,380,804 23,205,695 27,647,503 8,671,626 34,707,063 Assigned 121,978,964 203,626,945 252,609,178 321,274,323 320,827,203 300,430,697 249,568,939 Unassigned 68,290,888 25,037,986 56,956,520 32,718,113 61,799,654 96,212,173 80,311,859
Total General Fund 221,999,281$ 249,055,023$ 337,962,104$ 380,230,351$ 413,567,868$ 408,666,389$ 367,906,411$
All Other Governmental FundsNonspendable: 2,476,638$ 2,396,763$ 2,894,522$ 3,420,358$ 2,843,349$ 1,929,973$ 1,814,297$ Spendable: Restricted 1,109,895,765 1,107,471,325 1,051,057,480 1,038,295,927 1,116,077,578 1,182,684,693 1,272,815,741 Assigned - Special Revenue - Food Service 13,036,713 19,127,746 10,361,210 10,869,041 10,776,470 10,446,607 10,685,142
Total All Other Governmental Funds 1,125,409,116$ 1,128,995,834$ 1,064,313,212$ 1,052,585,326$ 1,129,697,397$ 1,195,061,273$ 1,285,315,180$
Note: GASB 54 was implemented for the fiscal year 2011. The amounts calculated for FY09 and FY10 under GASB 54 are unaudited and noted for comparison purposes only.
Source: District Records
Fiscal Year Ended
ORANGE COUNTY PUBLIC SCHOOLSFUND BALANCES OF GOVERNMENTAL FUNDS
LAST TEN FISCAL YEARS(Modified Accrual Basis of Accounting)
107

June 30, 2006 June 30, 2007 June 30, 2008 June 30, 2009 June 30, 2010 June 30, 2011 June 30, 2012 June 30, 2013 June 30, 2014 June 30, 2015Federal Direct Sources: Reserve Officers Training Corps (ROTC) 938,369$ 932,951$ 975,353$ 1,025,981$ 1,130,023$ 1,152,425$ 1,239,797$ 1,290,063$ 1,197,213$ 1,289,826$ Other Federal Direct Sources 4,714,421 5,479,739 9,139,753 13,446,836 13,426,174 15,884,409 17,250,356 16,792,675 13,967,642 13,721,433
Total Federal Direct 5,652,790 6,412,690 10,115,106 14,472,817 14,556,197 17,036,834 18,490,153 18,082,738 15,164,855 15,011,259
Federal Through State Sources: Food Service 36,300,826 39,070,041 42,536,722 45,854,192 51,345,890 57,149,777 62,575,805 69,505,688 72,700,451 77,367,802 Other Federal Through State Grants 106,842,984 107,180,706 106,594,382 102,418,357 200,526,775 245,307,551 126,748,981 125,825,964 129,588,567 128,682,164
Total Federal Through State Sources: 143,143,810 146,250,747 149,131,104 148,272,549 251,872,665 302,457,328 189,324,786 195,331,652 202,289,018 206,049,966
State Sources: Florida Education Finance Program (FEFP) 435,458,428 473,406,084 397,610,759 305,076,349 293,610,582 384,633,846 382,177,641 429,171,849 508,472,169 506,305,202 Categorical Programs 165,856,284 208,943,893 248,160,176 249,528,303 191,648,547 200,692,344 206,043,937 222,302,535 225,967,587 232,218,078 District Discretionary Lottery Funds 8,812,472 7,235,048 8,737,525 4,395,683 501,156 682,043 605,668 - - - Workforce Development 35,203,785 36,543,632 35,495,964 34,076,160 30,899,520 30,217,305 31,919,723 31,712,727 33,958,380 33,791,013 CO & DS Distribution 1,601,280 1,993,589 1,802,397 1,614,461 1,576,417 1,736,511 2,187,803 5,020,624 2,332,759 2,417,145 CO & DS Withheld for SBE/COBI Bonds 5,477,667 6,360,113 5,148,222 5,028,420 5,056,203 5,032,436 5,055,044 2,080,813 4,910,481 4,860,059 SBE Bond Interest 10,000 - - - - - - - - - Public Education Capital Outlay 14,212,239 28,186,877 24,147,999 14,846,886 18,700,768 9,613,136 2,359,076 2,294,456 4,135,107 7,204,905 Classrooms First/Class Size Reduction 25,647,383 84,709,502 - - - - - - - - Food Service 1,235,706 1,075,488 1,020,024 1,098,948 1,181,156 1,235,672 1,079,548 1,186,450 1,236,186 1,251,797 Other State Sources 6,005,892 5,325,940 4,667,645 2,367,350 14,291,363 15,294,962 12,302,737 1,161,562 2,024,089 3,612,964
Total State Sources 699,521,136 853,780,166 726,790,711 618,032,560 557,465,712 649,138,255 643,731,177 694,931,016 783,036,758 791,661,163
Local Sources: Ad Valorem Taxes 566,808,628 638,346,160 742,360,005 778,186,662 750,980,938 676,800,921 710,708,248 704,853,276 719,883,967 787,688,840 Sales Tax 166,421,563 170,597,436 166,190,269 154,176,277 150,843,957 163,594,345 170,826,444 181,301,579 191,770,163 209,231,028 Impact Fees 88,253,759 55,413,704 37,559,675 19,066,858 21,482,085 16,110,910 21,123,658 39,446,508 50,597,383 56,532,082 Food Service Sales 17,564,771 18,765,375 17,722,728 18,441,637 17,031,489 16,349,273 14,809,408 12,592,160 11,579,198 10,172,084 Interest Income and Others 36,637,908 60,783,200 65,261,894 24,668,602 25,615,842 24,149,079 26,474,019 2,879,776 20,840,103 12,516,707 Local Grants and Other Local Sources 28,060,286 47,553,019 32,268,934 40,430,947 31,356,236 29,945,449 28,041,156 27,691,005 29,972,889 31,303,839
Total Local Sources 903,746,915 991,458,894 1,061,363,505 1,034,970,983 997,310,547 926,949,977 971,982,933 968,764,304 1,024,643,703 1,107,444,580
Total Revenues 1,752,064,651$ 1,997,902,497$ 1,947,400,426$ 1,815,748,909$ 1,821,205,121$ 1,895,582,394$ 1,823,529,049$ 1,877,109,710$ 2,025,134,334$ 2,120,166,968$
Source: District Records - -
Fiscal Year Ended
ORANGE COUNTY PUBLIC SCHOOLSCHANGES IN FUND BALANCES OF GOVERNMENTAL FUNDS
LAST TEN FISCAL YEARS(Modified Accrual Basis of Accounting)
108

June 30, 2006 June 30, 2007 June 30, 2008 June 30, 2009 June 30, 2010 June 30, 2011 June 30, 2012 June 30, 2013 June 30, 2014 June 30, 2015Expenditures: Current: Instruction 770,376,732$ 834,423,084$ 867,973,005$ 799,219,532$ 808,532,530$ 841,878,367$ 833,616,664$ 869,286,691$ 935,061,296$ 1,006,160,923$ Pupil Personnel Services 44,293,707 49,674,257 51,335,304 47,056,953 46,224,837 45,960,918 43,049,241 43,175,305 47,439,841 54,253,257 Instructional Media Services 15,720,351 18,682,223 19,393,317 16,510,136 15,426,974 15,802,659 15,104,921 15,252,370 16,037,558 16,193,400 Instruction and Curriculum Development 65,551,523 82,407,177 88,120,269 82,745,126 82,131,728 81,152,028 67,819,943 67,593,777 70,080,214 80,971,743 Instructional Staff Training Services 29,284,754 29,112,309 28,610,350 29,249,866 23,184,112 25,109,993 37,120,662 37,725,534 58,594,469 57,757,519 Instructional Related Technology (a) 16,923,103 12,859,109 13,775,379 12,998,146 15,292,120 13,320,121 10,639,042 11,572,235 13,020,779 12,149,086 Board of Education 2,134,401 2,190,448 4,570,077 2,962,564 2,947,410 2,881,357 3,202,884 3,302,198 4,360,523 4,723,998 General Administration 6,087,247 7,885,933 7,466,231 7,682,135 10,441,858 11,502,737 7,311,012 7,704,398 10,771,050 11,389,257 School Administration 82,671,392 90,552,866 96,538,390 91,797,342 91,640,209 94,558,492 91,977,105 94,337,603 101,870,822 109,400,230 Facilities Acquisition & Construction 60,080,522 61,221,988 42,728,935 36,749,243 33,250,512 31,751,648 29,580,987 25,877,170 26,564,039 57,327,655 Fiscal Services 5,704,391 6,395,335 6,588,651 5,800,858 5,691,814 5,877,153 5,780,399 5,791,787 6,262,490 6,445,574 Food Services 56,495,057 59,090,850 61,698,191 61,338,061 63,430,478 69,266,409 72,728,578 79,319,992 86,230,329 85,847,403 Central Services 16,431,884 20,830,800 18,020,386 15,489,392 16,547,133 18,556,239 15,382,412 16,162,670 25,299,317 15,191,118 Pupil Transportation Services 59,057,564 63,974,256 67,780,206 59,782,558 59,905,026 61,602,681 59,710,159 64,875,630 69,475,033 69,027,857 Operation of Plant 80,310,375 91,470,677 100,058,298 95,839,368 99,284,605 96,754,759 96,459,845 96,037,463 102,737,344 110,038,737 Maintenance of Plant 40,273,303 41,584,094 41,907,484 32,861,608 32,017,425 31,553,059 29,845,991 31,060,062 35,481,980 35,774,143 Administrative Technology Services (a) 12,086,405 16,441,356 15,491,348 16,303,576 16,036,455 15,831,717 17,642,277 17,232,485 21,740,474 22,154,937 Community Services 10,408,686 10,674,462 10,680,807 11,935,116 12,823,926 13,027,454 11,316,632 13,215,847 12,637,217 10,935,839 Capital Outlay: Facilities Acquisition & Construction 326,164,793 371,897,429 376,389,860 293,253,503 228,768,711 235,722,722 199,040,096 158,923,620 199,766,360 179,182,178 Other Capital Outlay 12,743,082 10,324,831 7,378,042 5,460,574 12,635,294 7,311,007 6,876,359 7,710,191 12,090,030 16,036,348 Debt Service: Principal 31,586,888 43,094,354 35,435,504 38,429,184 42,128,973 42,676,081 45,141,661 29,392,238 33,360,130 43,207,841 Interest and Fiscal Charges 59,074,113 64,419,260 70,259,412 76,682,935 78,186,603 72,880,595 71,400,149 65,624,781 76,683,187 60,306,054
- - Total Expenditures 1,803,460,273 1,989,207,098 2,032,199,446 1,840,147,776 1,796,528,733 1,834,978,196 1,770,747,019 1,761,174,047 1,965,564,483 2,064,475,097
Excess (Deficiency) of Revenues Over (Under) Expenditures (51,395,622) 8,695,399 (84,799,020) (24,398,867) 24,676,388 60,604,198 52,782,030 115,935,663 59,569,851 55,691,871
Other Financing Sources (Uses) Refunding Bonds - - - - 2,485,000 2,590,000 - - - 8,569,000 Certificates of Participation 256,380,000 270,425,000 203,865,000 285,275,000 35,820,000 36,229,000 135,175,000 - 83,130,000 413,255,000 Capital Lease 23,996,466 13,500,000 - 13,219,029 - - - - - - Premiums on Long-Term Debt Issued 12,468,687 3,010,386 843,649 (4,863,623) - - 14,636,181 - 8,970,645 47,991,781 Payment to Refunding Bonds Escrow Agent (116,858,500) - (310,426,714) (98,210,000) (26,157,559) (70,552,429) (166,197,364) - (92,319,524) (477,069,241) Proceeds from the Sale of Capital Assets 6,642,312 301,876 989,213 7,255,023 212,999 1,891,763 767,229 1,108,153 1,010,013 963,845 Insurance Loss Recoveries 1,946,900 466,264 327,035 204,639 275,632 131,927 47,284 75,773 101,412 91,673 Transfer In 107,132,742 123,330,129 122,983,396 112,287,975 154,843,154 143,945,523 121,688,005 116,346,272 108,035,970 123,869,386 Transfer Out (107,132,742) (123,330,129) (122,983,396) (112,287,975) (161,513,154) (150,615,523) (128,358,005) (123,016,272) (108,035,970) (123,869,386)
Total Other Financing Sources (Uses) 184,575,865 287,703,526 (104,401,817) 202,880,068 5,966,072 (36,379,739) (22,241,670) (5,486,074) 892,546 (6,197,942)
Net Change in Fund Balance 133,180,243 296,398,925 (189,200,837) 178,481,201 30,642,460 24,224,459 30,540,360 110,449,589 60,462,397 49,493,929
Fund Balances, Beginning 1,796,471,716 1,061,729,108 1,358,128,033 1,168,927,196 1,347,408,397 1,378,050,857 1,402,275,316 1,432,815,676 1,543,265,265 1,603,727,662
Fund Balances, Ending 1,929,651,959$ 1,358,128,033$ 1,168,927,196$ 1,347,408,397$ 1,378,050,857$ 1,402,275,316$ 1,432,815,676$ 1,543,265,265$ 1,603,727,662$ 1,653,221,591$
Debt Service as a Percentage of Noncapital Expenditures 6.19% 6.69% 6.41% 7.47% 7.74% 7.26% 7.45% 5.96% 6.27% 5.54%
Note: (a) In fiscal year ending June 30, 2006, two new function/program expenditures classifications were established to report technology expenditures previously reported in central services.
Source: District Records
(Modified Accrual Basis of Accounting)
ORANGE COUNTY PUBLIC SCHOOLSCHANGES IN FUND BALANCES OF GOVERNMENTAL FUNDS
LAST TEN FISCAL YEARS
(continued)
109

June 30, 2006 June 30, 2007 June 30, 2008 June 30, 2009 June 30, 2010 June 30, 2011 June 30, 2012 June 30, 2013 June 30, 2014 June 30, 2015Federal Direct Sources: Reserve Officers Training Corps (ROTC) 938,369$ 932,951$ 975,353$ 1,025,981$ 1,130,023$ 1,152,425$ 1,239,797$ 1,290,063$ 1,197,213$ 1,289,826$ Other Federal Direct Sources 3,240 2,895 2,749 4,040 - 5,640 7,550 - - - Total Federal Direct 941,609 935,846 978,102 1,030,021 1,130,023 1,158,065 1,247,347 1,290,063 1,197,213 1,289,826
Federal Through State: Other Federal Through State Sources 3,066,007 4,317,857 2,923,059 2,627,850 3,951,397 2,338,718 3,770,989 4,307,201 4,888,465 5,518,486 Total Federal Through State 3,066,007 4,317,857 2,923,059 2,627,850 3,951,397 2,338,718 3,770,989 4,307,201 4,888,465 5,518,486
State Sources: Florida Education Finance Program (FEFP) 435,458,428 473,406,084 397,610,759 305,076,349 293,610,582 384,633,846 382,177,641 429,171,849 508,472,169 506,305,202 Categorical Programs 169,066,567 208,943,893 248,160,176 249,528,303 191,648,547 200,692,344 206,043,937 222,302,535 225,967,587 232,218,078 District Discretionary Lottery Funds 8,812,472 7,235,048 8,737,525 4,395,683 501,156 682,043 605,668 - - 707,831 Workforce Development 35,203,785 36,543,632 35,495,964 34,076,160 30,899,520 30,217,305 31,919,723 31,712,727 33,958,380 33,791,013 CO&DS Distribution 103,631 101,523 102,111 97,700 98,305 100,317 107,469 105,207 108,127 110,847 Other State Sources 2,795,610 5,325,940 4,667,645 2,367,350 14,291,363 15,294,962 12,302,737 1,161,562 2,024,089 2,905,133 Total State Sources 651,440,493 731,556,120 694,774,180 595,541,545 531,049,473 631,620,817 633,157,175 684,453,880 770,530,352 776,038,104
Local Sources: Ad Valorem Taxes 457,236,471 504,809,925 586,022,104 614,940,923 604,099,356 548,160,633 585,882,336 580,088,306 590,739,237 648,247,462 Interest Income 8,745,237 11,269,867 9,979,278 3,424,200 8,812,698 3,513,348 5,903,328 1,817,651 4,477,791 2,434,138 Fees and Other Local Sources 14,847,882 18,917,941 17,963,038 28,213,853 24,067,646 22,712,522 21,769,297 20,825,022 22,170,258 22,584,382 Total Local Sources 480,829,590 534,997,733 613,964,420 646,578,976 636,979,700 574,386,503 613,554,961 602,730,979 617,387,286 673,265,982
Total Revenues 1,136,277,699 1,271,807,556 1,312,639,761 1,245,778,392 1,173,110,593 1,209,504,103 1,251,730,472 1,292,782,123 1,394,003,316 1,456,112,398
Expenditures: (by object) Salaries 713,630,236 781,822,083 820,839,650 762,817,971 682,738,093 666,751,382 753,690,488 760,789,436 815,126,301 884,305,136 Employee Benefits 210,369,485 242,419,542 262,583,022 250,940,157 221,811,800 235,003,687 222,364,506 236,296,917 276,417,383 301,058,303 Purchased Services 108,402,086 136,788,067 133,534,710 108,669,473 113,659,150 126,834,808 126,959,288 139,746,786 179,941,836 190,519,614 Energy Services 38,246,869 46,908,677 49,896,782 47,106,667 51,619,227 51,124,069 52,205,783 50,598,665 52,060,547 51,838,024 Material and Supplies 44,257,027 43,966,690 41,055,809 29,301,379 43,207,329 21,778,078 38,336,203 51,502,711 46,261,636 33,863,730 Capital Outlay 30,286,906 24,498,069 17,628,955 16,107,140 20,449,318 15,433,817 13,726,115 18,900,976 26,085,590 35,970,761 Other Expenditures 19,799,896 9,421,158 11,231,985 10,764,185 10,319,479 8,633,517 7,834,000 7,611,178 8,258,034 7,577,231 Total Expenditures 1,164,992,505 1,285,824,286 1,336,770,914 1,225,706,972 1,143,804,395 1,125,559,358 1,215,116,383 1,265,446,669 1,404,151,327 1,505,132,799
Excess (Deficiency) of Revenues Over (Under) Expenditures (28,714,806) (14,016,730) (24,131,153) 20,071,420 29,306,198 83,944,745 36,614,089 27,335,454 (10,148,011) (49,020,401)
Other Financing Sources 34,044,040 34,736,105 40,682,060 7,795,961 (2,250,456) 4,962,336 5,654,158 6,002,063 5,246,532 8,260,423
Excess (Deficiency) of Revenues and Other Sources Over (Under) Expenditures and Other Uses 5,329,234 20,719,375 16,550,907 27,867,381 27,055,742 88,907,081 42,268,247 33,337,517 (4,901,479) (40,759,978)
Beginning Fund Balances 151,532,384 156,861,618 177,580,993 194,131,900 221,999,281 249,055,023 337,962,104 380,230,351 413,567,868 408,666,389 Ending Fund Balances 156,861,618$ 177,580,993$ 194,131,900$ 221,999,281$ 249,055,023$ 337,962,104$ 380,230,351$ 413,567,868$ 408,666,389$ 367,906,411$
Source: District Records
Fiscal Year Ended
ORANGE COUNTY PUBLIC SCHOOLSSUMMARY OF REVENUES, EXPENDITURES (by Major Object)
AND CHANGES IN FUND BALANCES - GENERAL FUNDLAST TEN FISCAL YEARS
(Modified Accrual Basis of Accounting)
110

June 30, 2006 June 30, 2007 June 30, 2008 June 30, 2009 June 30, 2010 June 30, 2011 June 30, 2012 June 30, 2013 June 30, 2014 June 30, 2015
Federal Direct Sources: Miscellaneous Federal Direct 4,711,181$ 5,476,844$ 9,137,004$ 13,442,796$ 13,426,174$ 15,505,912$ 15,453,093$ 15,002,962$ 12,320,212$ 12,061,475$ Total Federal Direct 4,711,181 5,476,844 9,137,004 13,442,796 13,426,174 15,505,912 15,453,093 15,002,962 12,320,212 12,061,475
Federal Through State Sources: Other Federal Through State Grants 103,776,977 102,862,849 103,671,323 99,790,507 91,529,780 108,475,438 114,827,806 113,600,747 111,285,175 116,147,856 Total Federal Through State Sources: 103,776,977 102,862,849 103,671,323 99,790,507 91,529,780 108,475,438 114,827,806 113,600,747 111,285,175 116,147,856
Total Revenues 108,488,158 108,339,693 112,808,327 113,233,303 104,955,954 123,981,350 130,280,899 128,603,709 123,605,387 128,209,331
Expenditures: (by object) Salaries 55,260,440 56,763,481 54,753,504 55,198,683 52,505,039 58,292,737 67,252,172 63,803,442 65,584,120 68,355,400 Employee Benefits 16,387,246 17,877,636 16,746,826 16,918,802 16,769,256 19,439,637 19,267,983 19,162,857 22,078,976 23,122,602 Purchased Services 13,893,370 14,674,642 18,502,158 22,152,884 15,567,382 21,067,334 22,147,413 19,546,803 17,678,714 16,719,585 Energy Services 659 62 157 - 19,279 16,819 935 16,846 15,910 21,528 Material and Supplies 11,313,495 8,849,753 12,068,217 9,269,678 6,263,141 8,180,039 6,439,017 7,250,840 3,989,405 5,885,525 Capital Outlay 6,950,400 5,364,595 5,767,913 3,404,904 5,154,703 7,765,585 7,001,977 10,044,801 5,448,089 4,548,727 Other Expenditures 4,682,548 4,809,524 4,969,550 6,288,352 8,677,155 9,219,199 8,171,402 8,778,120 8,810,173 9,555,964 Total Expenditures 108,488,158 108,339,693 112,808,327 113,233,303 104,955,954 123,981,350 130,280,899 128,603,709 123,605,387 128,209,331
Excess (Deficiency) of Revenues Over Expenditures - - - - - - - - - -
Other Financing Uses - - - - - - - - - -
Excess (Deficiency) of Revenues and Other Sources Over Expenditures and Other Uses - - - - - - - - - -
Beginning Fund Balance - - - - - - - - - - Ending Fund Balance -$ -$ -$ -$ $ - $ - $ - $ - $ - $ -
Source: District Records
ORANGE COUNTY PUBLIC SCHOOLSSUMMARY OF REVENUES, EXPENDITURES (by Major Object) AND CHANGES
IN FUND BALANCES - SPECIAL REVENUES FUND - OTHER FEDERAL PROGRAMSLAST TEN FISCAL YEARS
(Modified Accrual Basis of Accounting)
Fiscal Year Ended
111

June 30, 2010 June 30, 2011 June 30, 2012 June 30, 2013 June 30, 2014 June 30, 2015
Federal Through State Sources: State Fiscal Stabilization Funds 66,283,178$ 61,601,452$ 13,317$ -$ -$ -$ ARRA - Race to the Top - 662,003 4,401,896 5,298,351 12,365,952 6,960,001 Education Jobs Fund - 37,247,269 550,433 - - - Individuals with Disabilities Education Act 20,717,677 21,365,832 729,413 - - - Elementary And Secondary Education Act, Title I 17,612,277 12,958,008 2,430,427 2,658,517 1,105,123 - Other Federal Through State Sources 432,466 658,831 78,596 - - 80,739 Total Federal Through State Sources: 105,045,598 134,493,395 8,204,082 7,956,868 13,471,075 7,040,740
Total Revenues 105,045,598 134,493,395 8,204,082 7,956,868 13,471,075 7,040,740
Expenditures: (by object) Salaries 66,804,771 91,931,155 3,180,597 3,183,375 6,056,532 1,485,405 Employee Benefits 20,990,088 32,035,126 759,602 831,564 1,030,430 356,733 Purchased Services 8,279,489 3,123,888 1,350,365 1,550,930 2,669,241 3,079,692 Energy Services - - - - - - Material and Supplies 1,536,735 806,574 358,326 825,543 604,482 77,376 Capital Outlay 4,148,593 2,931,577 2,072,914 1,231,897 2,673,617 1,855,280 Other Expenditures 3,285,922 3,665,075 482,278 333,559 436,773 186,254 Total Expenditures 105,045,598 134,493,395 8,204,082 7,956,868 13,471,075 7,040,740
Excess (Deficiency) of Revenues Over Expenditures - - - - - -
Other Financing Uses - - - - - -
Excess (Deficiency) of Revenues and Other Sources Over Expenditures and Other Uses - - - - - -
Beginning Fund Balance - - - - - - Ending Fund Balance -$ -$ -$ -$ -$ -$
Note: The District began receiving revenue for the fiscal year ending June 30, 2010. As a result, this is the sixth year of reporting.
Source: District Records
Fiscal Year Ended
ORANGE COUNTY PUBLIC SCHOOLSSUMMARY OF REVENUES, EXPENDITURES (by Major Object) AND CHANGES
IN FUND BALANCES - ARRA FEDERAL PROGRAMS - SPECIAL REVENUE FUNDLAST SIX FISCAL YEARS
112

June 30, 2006 June 30, 2007 June 30, 2008 June 30, 2009 June 30, 2010 June 30, 2011 June 30, 2012 June 30, 2013 June 30, 2014 June 30, 2015
Federal Through State Sources: Food Service 34,227,230$ 35,562,801$ 38,559,119$ 42,022,860$ 47,772,707$ 52,465,785$ 58,569,097$ 64,615,521$ 66,770,766$ 71,118,973$ Donated Foods 2,073,596 3,507,240 3,977,603 3,831,332 3,573,183 4,683,992 4,006,708 4,890,167 5,929,685 6,248,829 Other Federal Through State Grants - - - - - - - - - - Total Federal Through State Sources: 36,300,826 39,070,041 42,536,722 45,854,192 51,345,890 57,149,777 62,575,805 69,505,688 72,700,451 77,367,802
State Sources: Food Services 1,235,706 1,075,488 1,020,024 1,098,948 1,181,156 1,235,672 1,079,548 1,186,450 1,236,186 1,251,797 Total State Sources 1,235,706 1,075,488 1,020,024 1,098,948 1,181,156 1,235,672 1,079,548 1,186,450 1,236,186 1,251,797
Local Sources: Food Service Sales 17,564,771 18,765,375 17,856,764 18,614,542 17,031,489 16,349,273 14,809,408 12,592,160 11,579,198 10,376,640 Interest Income and Others 247,766 215,485 839 39,603 120,364 45,041 139,485 (4,642) 202,384 19,801 Total Local Sources 17,812,537 18,980,860 17,857,603 18,654,145 17,151,853 16,394,314 14,948,893 12,587,518 11,781,582 10,396,441
Total Revenues 55,349,069 59,126,389 61,414,349 65,607,285 69,678,899 74,779,763 78,604,246 83,279,656 85,718,219 89,016,040
Expenditures: (by object) Salaries 15,594,831 16,982,712 17,095,903 16,921,175 18,012,876 18,428,777 19,058,163 20,066,645 22,234,187 23,249,362 Employee Benefits 7,668,887 8,693,688 8,891,807 9,029,408 9,340,521 10,220,964 9,771,804 10,898,880 13,020,872 13,705,014 Purchased Services 3,285,969 2,780,036 1,822,461 1,779,351 2,196,550 2,859,200 3,352,075 3,079,998 2,855,619 2,398,408 Energy Services 1,819,101 758,165 915,151 936,479 987,136 1,040,894 1,031,826 1,027,398 1,013,576 1,032,395 Material and Supplies 25,758,012 27,006,604 30,637,364 30,133,045 30,710,491 34,261,054 37,911,562 42,805,822 44,827,463 42,932,429 Capital Outlay 2,011,137 1,347,976 1,549,902 823,531 1,719,976 452,852 1,960,951 2,276,727 2,924,769 1,936,252 Other Expenditures 1,558,280 2,238,854 1,905,375 1,953,645 1,672,500 2,994,975 1,193,497 1,040,376 1,812,541 1,777,325 Total Expenditures 57,696,217 59,808,035 62,817,963 61,576,634 64,640,050 70,258,716 74,279,878 81,195,846 88,689,027 87,031,185
Excess (Deficiency) of Revenues Over Expenditures (2,347,148) (681,646) (1,403,614) 4,030,651 5,038,849 4,521,048 4,324,368 2,083,810 (2,970,808) 1,984,855
Other Financing Sources (Uses) 8,462 2,813 - - - - - - - -
Excess (Deficiency) of Revenues and Other Sources Over Expenditures and Other Uses (2,338,686) (678,833) (1,403,614) 4,030,651 5,038,849 4,521,048 4,324,368 2,083,810 (2,970,808) 1,984,855
Beginning Fund Balances 5,615,635 3,276,949 2,598,116 1,194,502 5,225,152 10,264,001 14,785,049 19,109,417 21,193,227 18,222,419 Ending Fund Balances 3,276,949$ 2,598,116$ 1,194,502$ 5,225,152$ 10,264,001$ 14,785,049$ 19,109,417$ 21,193,227$ 18,222,419$ 20,207,274$
Source: District Records
Fiscal Year Ended
ORANGE COUNTY PUBLIC SCHOOLSSUMMARY OF REVENUES, EXPENDITURES (by Major Object)
AND CHANGES IN FUND BALANCES - SPECIAL REVENUES FUND - FOOD SERVICELAST TEN FISCAL YEARS
(Modified Accrual Basis of Accounting)
113
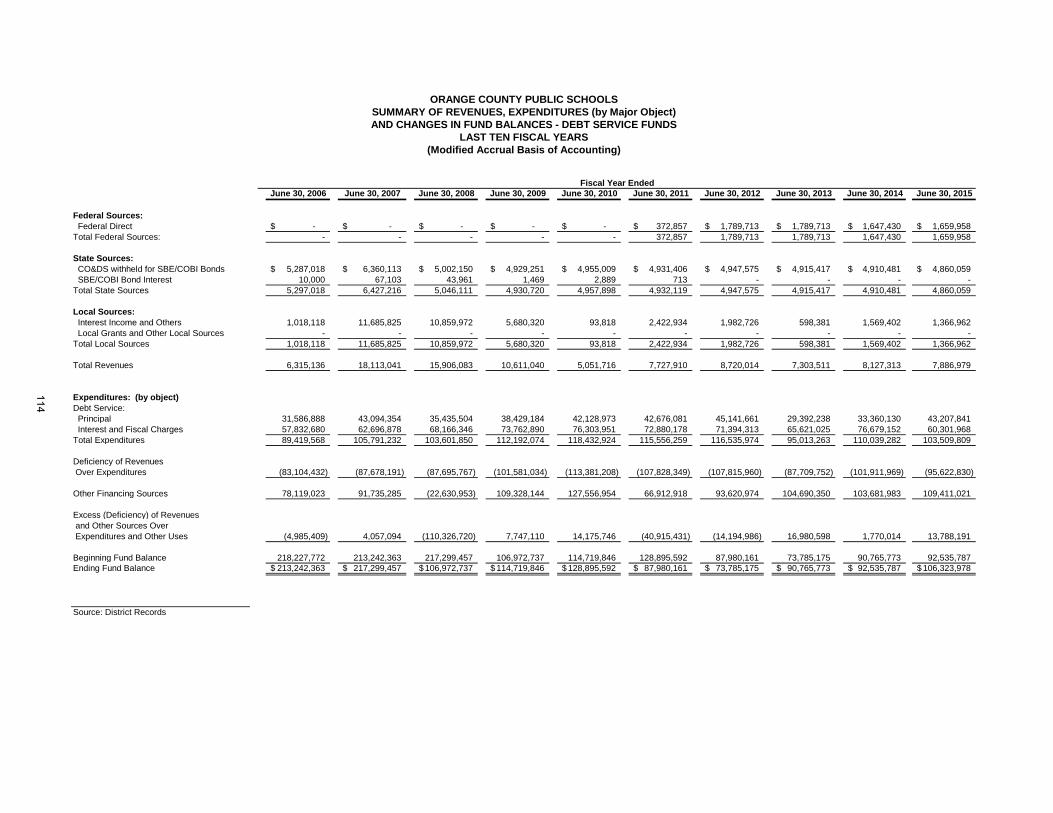
June 30, 2006 June 30, 2007 June 30, 2008 June 30, 2009 June 30, 2010 June 30, 2011 June 30, 2012 June 30, 2013 June 30, 2014 June 30, 2015
Federal Sources: Federal Direct -$ -$ -$ -$ -$ 372,857$ 1,789,713$ 1,789,713$ 1,647,430$ 1,659,958$ Total Federal Sources: - - - - - 372,857 1,789,713 1,789,713 1,647,430 1,659,958
State Sources: CO&DS withheld for SBE/COBI Bonds 5,287,018$ 6,360,113$ 5,002,150$ 4,929,251$ 4,955,009$ 4,931,406$ 4,947,575$ 4,915,417$ 4,910,481$ 4,860,059$ SBE/COBI Bond Interest 10,000 67,103 43,961 1,469 2,889 713 - - - - Total State Sources 5,297,018 6,427,216 5,046,111 4,930,720 4,957,898 4,932,119 4,947,575 4,915,417 4,910,481 4,860,059
Local Sources: Interest Income and Others 1,018,118 11,685,825 10,859,972 5,680,320 93,818 2,422,934 1,982,726 598,381 1,569,402 1,366,962 Local Grants and Other Local Sources - - - - - - - - - - Total Local Sources 1,018,118 11,685,825 10,859,972 5,680,320 93,818 2,422,934 1,982,726 598,381 1,569,402 1,366,962
Total Revenues 6,315,136 18,113,041 15,906,083 10,611,040 5,051,716 7,727,910 8,720,014 7,303,511 8,127,313 7,886,979
Expenditures: (by object)Debt Service: Principal 31,586,888 43,094,354 35,435,504 38,429,184 42,128,973 42,676,081 45,141,661 29,392,238 33,360,130 43,207,841 Interest and Fiscal Charges 57,832,680 62,696,878 68,166,346 73,762,890 76,303,951 72,880,178 71,394,313 65,621,025 76,679,152 60,301,968 Total Expenditures 89,419,568 105,791,232 103,601,850 112,192,074 118,432,924 115,556,259 116,535,974 95,013,263 110,039,282 103,509,809
Deficiency of Revenues Over Expenditures (83,104,432) (87,678,191) (87,695,767) (101,581,034) (113,381,208) (107,828,349) (107,815,960) (87,709,752) (101,911,969) (95,622,830)
Other Financing Sources 78,119,023 91,735,285 (22,630,953) 109,328,144 127,556,954 66,912,918 93,620,974 104,690,350 103,681,983 109,411,021
Excess (Deficiency) of Revenues and Other Sources Over Expenditures and Other Uses (4,985,409) 4,057,094 (110,326,720) 7,747,110 14,175,746 (40,915,431) (14,194,986) 16,980,598 1,770,014 13,788,191
Beginning Fund Balance 218,227,772 213,242,363 217,299,457 106,972,737 114,719,846 128,895,592 87,980,161 73,785,175 90,765,773 92,535,787 Ending Fund Balance 213,242,363$ 217,299,457$ 106,972,737$ 114,719,846$ 128,895,592$ 87,980,161$ 73,785,175$ 90,765,773$ 92,535,787$ 106,323,978$
Source: District Records
Fiscal Year Ended
ORANGE COUNTY PUBLIC SCHOOLSSUMMARY OF REVENUES, EXPENDITURES (by Major Object)AND CHANGES IN FUND BALANCES - DEBT SERVICE FUNDS
LAST TEN FISCAL YEARS(Modified Accrual Basis of Accounting)
114

June 30, 2006 June 30, 2007 June 30, 2008 June 30, 2009 June 30, 2010 June 30, 2011 June 30, 2012 June 30, 2013 June 30, 2014 June 30, 2015
REVENUESState Sources: CO&DS Distributed to District 1,601,279$ 1,892,066$ 1,644,163$ 1,545,348$ 1,576,417$ 1,656,095$ 2,109,983$ 2,014,654$ 2,190,088$ 2,306,298$ Interest on Undistributed CO&DS 87,018 - 158,234 69,113 - 80,416 77,820 66,158 34,544 - Public Education Capital Outlay 14,212,239 28,186,877 24,147,999 14,846,886 18,700,768 9,608,646 2,359,076 2,294,456 4,135,107 7,204,905 Classroom First/Class Size Reduction 25,647,383 84,709,502 - - - 4,490 - - - - School Infrastructure Trust - - - - - - - - - - State Grants and Other State Sources - - - - - - - - - - Total State Sources 41,547,919 114,788,445 25,950,396 16,461,347 20,277,185 11,349,647 4,546,879 4,375,268 6,359,739 9,511,203
Local Sources: Ad Valorem Taxes 109,572,157 133,536,235 156,337,901 163,245,739 146,881,582 128,640,288 124,825,912 124,764,970 129,144,730 139,441,378 Sales Tax 166,421,563 170,597,436 166,190,269 154,176,277 150,843,957 163,594,345 170,826,443 181,301,579 191,770,163 209,231,028 Impact Fees 88,253,759 55,413,704 37,559,675 19,066,858 21,482,085 16,110,910 21,123,658 39,446,508 50,597,383 56,532,082 Interest Income and Others 26,533,772 37,292,955 44,093,783 15,405,683 16,601,556 17,944,001 12,645,023 521,563 14,585,279 8,642,294 Local Grants and Other Local Sources 3,547,500 19,057,698 4,826,681 3,972,173 - 374,374 5,320,095 152,117 1,069,563 2,135,832 Total Local Sources 394,328,751 415,898,028 409,008,308 355,866,730 335,809,180 326,663,918 334,741,131 346,186,737 387,167,118 415,982,614
Total Revenues 435,876,670 530,686,473 434,958,704 372,328,077 356,086,365 338,013,565 339,288,010 350,562,005 393,526,857 425,493,817
Expenditures: (by object)Capital Outlay: Library Books 929,164 1,087,612 1,133,072 1,283,225 750,375 351,292 437,348 463,075 250,293 50,485,672 Audio Visual Materials 331,510 70,784 141,282 253,904 36,233 3,258 3,345 - - - Buildings and Fixed Equipment 175,605,661 263,876,391 219,452,956 104,488,585 87,526,832 53,766,808 66,352,271 34,345,389 36,648,821 32,409,715 Furniture, Fixtures, and Equipment 16,421,869 24,910,421 18,793,452 22,370,393 19,340,042 15,424,712 16,381,199 13,162,004 11,233,993 38,827,949 Motor Vehicles 21,696,709 - 13,308,211 13,303,986 - - 11,241,346 6,740,888 12,204,895 3,584,314 Land 15,416,920 3,075,828 8,840,928 35,897,053 19,567,809 3,036,694 1,799,755 4,280,951 2,311,467 13,952,928 Improvements Other Than Buildings 3,341,492 448,140 279,042 473,378 414,560 81,297 152,601 1,578,830 1,214,647 1,195,082 Remodeling and Renovations 138,759,920 126,422,370 144,466,154 141,030,269 124,748,966 184,854,825 123,125,764 115,666,848 154,678,423 86,922,289 Computer Software 1,356,437 326,387 680,352 457,248 730,691 1,060,352 642,679 1,539 53,819 4,155 Total Expenditures 373,859,682 420,217,933 407,095,449 319,558,041 253,115,508 258,579,238 220,136,308 176,239,524 218,596,358 227,382,104
Excess (Deficiency) of Revenues Over Expenditures 62,016,988 110,468,540 27,863,255 52,770,036 102,970,857 79,434,327 119,151,702 174,322,481 174,930,499 198,111,713
Other Financing Sources (Uses) 72,404,340 161,229,323 (122,452,924) 85,755,964 (119,340,426) (107,842,253) (121,516,802) (116,182,242) (108,035,970) (123,869,386)
Excess (Deficiency) of Revenues and Other Sources Over Expenditures and Other Uses 134,421,328 271,697,863 (94,589,669) 138,526,000 (16,369,569) (28,407,926) (2,365,100) 58,140,239 66,894,529 74,242,327
Beginning Fund Balances 545,908,765 680,330,093 952,027,956 857,438,287 995,964,287 979,594,718 951,186,792 948,821,692 1,006,961,931 1,073,856,460 Ending Fund Balances 680,330,093$ 952,027,956$ 857,438,287$ 995,964,287$ 979,594,718$ 951,186,792$ 948,821,692$ 1,006,961,931$ 1,073,856,460$ 1,148,098,787$
Source: District Records
Fiscal Year Ended
ORANGE COUNTY PUBLIC SCHOOLSSUMMARY OF REVENUES, EXPENDITURES (by Major Object)
AND CHANGES IN FUND BALANCES - CAPITAL PROJECTS FUNDSLAST TEN FISCAL YEARS
(Modified Accrual Basis of Accounting)
115

Fiscal Sales TotalYear General Capital Tax
Ended Purposes Projects
June 30, 2015 648,247,462$ 139,441,378$ 209,231,028$ 996,919,868$ June 30, 2014 590,739,237 129,144,730 191,770,163 911,654,130 June 30, 2013 580,088,306 124,764,970 181,301,579 886,154,855 June 30, 2012 585,882,336 124,825,912 170,826,444 881,534,692 June 30, 2011 548,160,633 128,640,288 163,594,345 840,395,266 June 30, 2010 604,099,356 146,881,582 150,843,957 901,824,895 June 30, 2009 614,940,923 163,245,739 154,176,277 932,362,939 June 30, 2008 586,022,104 156,337,901 166,190,269 908,550,274June 30, 2007 504,809,925 133,536,235 170,597,436 808,943,596June 30, 2006 457,236,471 109,572,157 166,421,563 733,230,191
Source: District Records
Property Tax
ORANGE COUNTY PUBLIC SCHOOLSGENERAL GOVERNMENTAL TAX REVENUES BY SOURCE
LAST TEN FISCAL YEARS(Modified Accrual Basis of Accounting)
116

FiscalYear Residential Commercial
2014-15 113,322,387$ 25,198$ 12,712,214$ 29,892,790$ 96,167,009$ 8.474 126,059,799$ 76.292013-14 102,649,168 24,962 12,329,007 25,933,571 89,069,566 8.362 115,003,137 77.452012-13 98,771,209 23,091 12,082,049 24,906,737 85,969,612 8.478 110,876,349 77.542011-12 99,031,482 24,197 11,887,068 24,904,930 86,037,817 8.545 110,942,747 77.552010-11 102,110,402 14,049 11,737,287 25,393,702 88,468,036 7.923 113,861,738 77.702009-10 118,873,313 19,436 11,623,461 29,003,505 101,512,705 7.673 130,516,210 77.782008-09 138,188,312 17,362 11,585,136 36,905,542 112,885,268 7.150 149,790,810 75.362007-08 137,455,007 5,865 11,008,493 40,573,090 107,896,275 7.121 148,469,365 72.672006-07 117,214,168 5,667 10,537,383 35,485,136 92,272,082 7.169 127,757,218 72.222005-06 91,650,055 20,228 10,081,678 26,590,090 75,161,871 7.761 101,751,961 73.87
Note: Net Taxable Assessed Values are net Taxable Values after deductingallowable statutory exemptions.Tax revenues for 2015 fiscal year are based on the 2014 net taxable values.
Source: Orange County Property Appraiser
Ratio of Net Secondary Assessed to Estimated
Actual Value
ORANGE COUNTY PUBLIC SCHOOLSASSESSED AND ESTIMATED ACTUAL VALUE OF TAXABLE PROPERTY
LAST TEN FISCAL YEARS(amounts expressed in thousands)
Real PropertyPersonal Property
Direct Tax Rate
Net Taxable Assessed Value
Total Estimated Actual ValueExemptions
117

2005-06 2006-07 2007-08 2008-09 2009-10 2010-11 2011-12 2012-13 2013-14 2014-15
District School Board: Local Required Effort 5.5010 4.9540 4.9420 4.9930 5.4250 5.4250 5.2970 5.2300 5.1140 5.2260 Discretionary Local 0.5100 0.5100 0.5100 0.4980 0.7480 0.7480 0.7480 0.7480 0.7480 0.7480 Supplemental Discretionary 0.2500 0.2050 0.1690 0.1590 0.0000 0.0000 0.0000 0.0000 0.0000 0.0000 Additonal Voted Millage 0.0000 0.0000 0.0000 0.0000 0.0000 0.0000 1.0000 1.0000 1.0000 1.0000 Local Capital Improvement 1.5000 1.5000 1.5000 1.5000 1.5000 1.7500 1.5000 1.5000 1.5000 1.5000
Total District School Board 7.7610 7.1690 7.1210 7.1500 7.6730 7.9230 8.5450 8.4780 8.3620 8.4740
Other County-Wide: Board of County Commissioners 5.1639 5.1639 4.4347 4.4347 4.4347 4.4347 4.4347 4.4347 4.4347 4.4347
Total County-Wide 12.9249 12.3329 11.5557 11.5847 12.1077 12.3577 12.9797 12.9127 12.7967 12.9087
Unincorporated Area: Fire Protection Fund 2.5862 2.5862 2.2437 2.2437 2.2437 2.2437 2.2437 2.2437 2.2437 2.2437 Special Tax Equalization District 2.1234 2.1234 1.8043 1.8043 1.8043 1.8043 1.8043 1.8043 1.8043 1.8043
Municipalities: Apopka 3.7619 3.7619 3.1738 3.5168 3.5166 3.5166 3.5164 3.5161 3.4727 3.2876 Bay Lake 1.2000 1.1316 1.0693 1.1467 1.1819 1.1819 1.1394 1.0900 1.0200 1.0779 Belle Isle 3.6655 3.6655 3.4068 3.7432 4.4018 4.4018 4.4018 4.4018 4.4018 4.4018 Eatonville 6.9040 6.9040 6.9040 6.9040 6.9040 6.9040 6.9040 7.2938 7.2938 7.2938 Edgewood 4.7000 4.7000 4.7000 3.9500 3.9500 3.9500 4.7000 4.7000 4.7000 4.7000 Lake Buena Vista 1.3000 1.0500 0.9328 1.0545 1.1688 1.1688 1.1986 1.2924 1.2821 1.2482 Maitland 4.3000 4.3000 4.1900 4.2850 4.3800 4.3800 4.3800 4.3200 4.3600 4.5400 Oakland 4.9245 4.9245 4.9245 6.8883 6.7500 6.7500 6.7500 6.7500 6.7500 6.7500 Ocoee 4.8018 4.6295 4.2919 5.4974 5.5574 5.5574 5.8460 5.8460 5.7855 5.6371 Orlando 5.6916 5.6916 4.9307 5.6500 5.6500 5.6500 5.6500 5.6500 5.6500 6.6500 Windermere 3.9500 3.9500 3.1739 3.2280 3.2280 3.2280 3.7896 3.7896 3.7896 3.7896 Winter Garden 4.3040 4.3040 3.3866 3.7500 4.2500 4.2500 4.2500 4.2500 4.2500 4.2500 Winter Park 5.0900 5.0900 4.3073 4.3980 4.4336 4.4336 4.4166 4.4183 4.4019 4.3907
Source: Orange County Property Appraiser
ORANGE COUNTY PUBLIC SCHOOLSPROPERTY TAX RATES
DIRECT AND OVERLAPPING GOVERNMENTSLAST TEN FISCAL YEARS (1)
(per $1,000 Assessed Valuation)
(1) Information is reported based on the fiscal year in which associated tax revenue is recognized - e.g., the 2014 tax roll data is reported here for the fiscal year 2015, as that is the period of collection and revenue recognition.
118

Fiscal Year2015
TaxableTaxpayer Type of Business Assessed Value (1)
Walt Disney Company Tourism 7,450,000,000$ 8.26%Universal Studios Tourism 1,490,000,000 1.65%Marriott Resorts Tourism 1,140,000,000 1.26%Hilton Resorts Tourism 822,700,000 0.91%Orange Lake CC Tourism 705,800,000 0.78%Duke Energy Electric Utility 668,300,000 0.74%Wyndham Resorts Tourism 525,700,000 0.58%Westgate Resorts Tourism 522,900,000 0.58%Vistana/SVO Vistana Village Tourism 463,300,000 0.51%Rosen Hotels & RH Resorts Tourism 433,500,000 0.48%
Total taxable assessed value of 10 largest taxpayers 14,222,200,000$ 15.78%
Total taxable assessed value of all other taxpayers 75,924,039,935$ 84.22%
Total taxable assessed value of all taxpayers 90,146,239,935$ 100.00%
Source: Orange County Property Appraiser
(1) Information is reported based on the fiscal year in which associated tax revenue is recognized - e.g., the 2014 tax roll data is reported here for fiscal year 2015, as that is the period of collection and revenue recognition.
Total TaxableAssessed Value
ORANGE COUNTY PUBLIC SCHOOLSPRINCIPAL TAXPAYERS
2015 Fiscal Year
Percentage of
119

Fiscal Year2006
TaxableTaxpayer Type of Business Assessed Value
Walt Disney World Tourism 5,746,456,681$ 6.67%Universal Studios Tourism 1,565,314,671 1.82%Marriott Tourism 1,008,805,768 1.17%Vistana Tourism 580,584,834 0.67%Progress Energy Electric Utility 431,983,773 0.50%CNL Grand Lakes Resort Electric Utility 355,186,341 0.41%Bellsouth Telecommunication Communications 351,199,650 0.41%Westgate Tourism 329,026,400 0.38%Sea World of Florida, Inc. Tourism 285,417,972 0.33%Sprint Communications 268,487,014 0.31%
Total taxable assessed value of 10 largest taxpayers 10,922,463,104$ 12.67%
Total taxable assessed value of all other taxpayers 75,253,217,865$ 87.33%
Total taxable assessed value of all taxpayers 86,175,680,969$ 100.00%
Source: Orange County Property Appraiser
Percentage ofTotal Taxable
Assessed Value
ORANGE COUNTY PUBLIC SCHOOLSPRINCIPAL TAXPAYERS
2006 Fiscal Year
120

Fiscal Total Current Tax Percent Delinquent Total PercentYear Tax Levy Collections (1) of Levy Collections (1) Collections (1) of Levy
2014-15 817,371,999$ 757,262,659$ 92.65 30,426,180$ 787,688,839$ 96.372013-14 747,793,071 688,181,248 92.03 31,702,719 719,883,967 96.272012-13 732,256,944 670,273,519 91.54 34,579,757 704,853,276 96.262011-12 737,816,903 670,910,937 90.93 39,797,311 710,708,248 96.332010-11 702,663,764 609,015,408 86.67 67,785,514 676,800,922 96.322009-10 781,846,872 657,761,630 84.13 93,219,308 750,980,938 96.052008-09 809,584,595 705,075,396 87.09 73,111,266 778,186,662 96.122007-08 767,132,997 675,265,244 88.02 67,094,761 742,360,005 96.772006-07 662,183,349 591,372,887 89.31 46,973,273 638,346,160 96.402005-06 583,331,280 519,493,992 89.06 47,314,636 566,808,628 97.17
Note: Property Taxes become due and payable on November 1st of each year. A four percent(4%) discount is allowed if taxes are paid in November, with the discounts declining byone percent (1%) each month thereafter. Accordingly, taxes collected will never be 100%of the tax levy. Taxes become delinquent on April 1st of each year and tax certificates for the full amount of any unpaid taxes and assessments must be sold not later than June1st of each year. Accordingly, the majority of taxes are collected in the fiscal year levied.
(1) Net of allowable discounts
Source: District Records
Collected to Endof Tax Year
ORANGE COUNTY PUBLIC SCHOOLSPROPERTY TAX LEVIES AND COLLECTIONS
Collected to June 30thEnd of Tax Fiscal Year
121

State Board Certificates Total PercentageFiscal of Education Of Capital Primary of Personal PerYear Bonds Participation Leases Government Income (B) Capita (B)
2014-15 11,519,000$ 1,292,614,623$ 3,722,138$ 1,307,855,761$ 4.38% 1,065 2013-14 16,325,000 1,316,597,318 9,403,375 1,342,325,693 4.46% 1,119 2012-13 20,320,000 1,338,804,434 16,389,826 1,375,514,260 4.57% 1,156 2011-12 24,115,000 1,358,421,364 24,620,460 1,407,156,824 4.35% 1,189 2010-11 29,735,000 1,403,357,117 35,180,515 1,468,272,632 4.02% 1,350 2009-10 31,500,000 1,464,782,154 45,334,991 1,541,617,145 3.83% 1,389 2008-09 35,000,000 1,481,725,524 56,422,358 1,573,147,882 4.18% 1,444 2007-08 38,155,000 1,326,317,514 53,275,910 1,417,748,424 3.64% 1,264 2006-07 41,235,000 1,455,271,255 63,574,809 1,560,081,064 4.39% 1,417 2005-06 46,010,000 1,181,524,727 67,267,557 1,294,802,284 3.67% 1,207
Note: The primary government does not have any business-type activities or general obligation outstanding debt.
Source:(A) District Records(B) Total Primary Government Debt divided by Personal Income and Population.
Governmental Activities (A)
LAST TEN FISCAL YEARSRATIOS OF OUTSTANDING DEBT BY TYPE
ORANGE COUNTY PUBLIC SCHOOLS
122
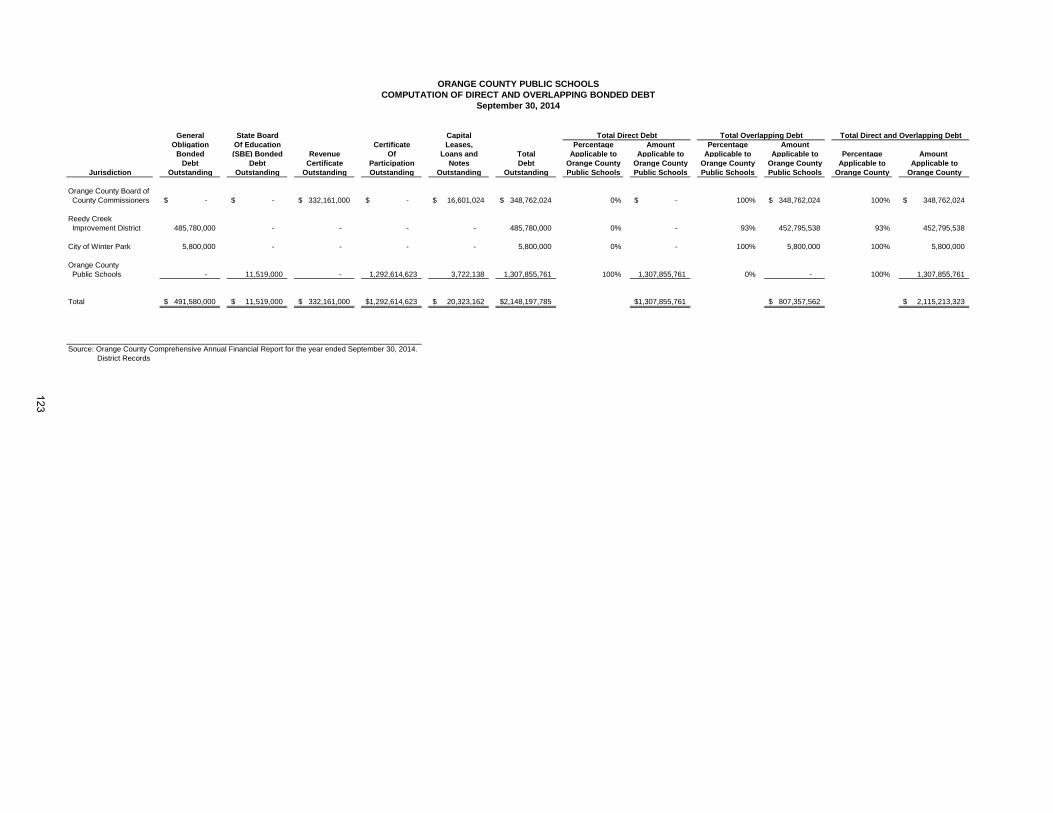
General State Board CapitalObligation Of Education Certificate Leases, Percentage Amount Percentage Amount
Bonded (SBE) Bonded Revenue Of Loans and Total Applicable to Applicable to Applicable to Applicable to Percentage Amount Debt Debt Certificate Participation Notes Debt Orange County Orange County Orange County Orange County Applicable to Applicable to
Jurisdiction Outstanding Outstanding Outstanding Outstanding Outstanding Outstanding Public Schools Public Schools Public Schools Public Schools Orange County Orange County
Orange County Board of County Commissioners -$ -$ 332,161,000$ -$ 16,601,024$ 348,762,024$ 0% -$ 100% 348,762,024$ 100% 348,762,024$
Reedy Creek Improvement District 485,780,000 - - - - 485,780,000 0% - 93% 452,795,538 93% 452,795,538
City of Winter Park 5,800,000 - - - - 5,800,000 0% - 100% 5,800,000 100% 5,800,000
Orange County Public Schools - 11,519,000 - 1,292,614,623 3,722,138 1,307,855,761 100% 1,307,855,761 0% - 100% 1,307,855,761
Total 491,580,000$ 11,519,000$ 332,161,000$ 1,292,614,623$ 20,323,162$ 2,148,197,785$ 1,307,855,761$ 807,357,562$ 2,115,213,323$
Source: Orange County Comprehensive Annual Financial Report for the year ended September 30, 2014. District Records
Total Direct and Overlapping DebtTotal Overlapping DebtTotal Direct Debt
ORANGE COUNTY PUBLIC SCHOOLSCOMPUTATION OF DIRECT AND OVERLAPPING BONDED DEBT
September 30, 2014
123

Taxable Total Amount Held NetFiscal Tax Assessed Annual Lease In Escrow For Annual LeaseYear Year Value (A) Payment Payment (C) Payment
2014-15 2014 96,167,009$ 94,968,755$ -$ 94,968,755$ 1.040 Mills2013-14 2013 89,069,566 101,419,848 - 101,419,848 1.199 Mills2012-13 2012 85,969,612 86,839,968 - 86,839,968 1.063 Mills2011-12 2011 86,037,817 107,350,668 - 107,350,668 1.313 Mills2010-11 2010 88,468,036 107,749,947 - 107,749,947 1.282 Mills2009-10 2009 112,885,268 101,179,012 9,317,645 91,861,367 0.857 Mills2008-09 2008 107,896,275 95,958,351 9,317,644 86,640,707 0.845 Mills2007-08 2007 91,924,643 99,290,149 9,317,644 89,972,505 1.030 Mills2006-07 2006 92,367,603 80,277,022 9,317,644 70,959,378 0.809 Mills2005-06 2005 75,161,871 72,368,180 8,204,703 64,163,477 0.899 Mills
(A) Assessed Value is in Thousands.
(B) Millage rate calculated using 95% of the taxable assessed valuation.
(C) The funds for these payments of the 2005A and 2005B refunding COPs are held in escrow and therefore are not funded with tax receipts.
Note: Capital lease arrangements financed by Certificates of Participation are notconsidered general obligation debt as no specific property tax levy has beenpledged.
Source: District Records
ORANGE COUNTY PUBLIC SCHOOLS
Millage Levyto Provide
1.00x Coverage (B)
LAST TEN FISCAL YEARSREQUIRED TO COVER CERTIFICATES OF PARTICIPATION PAYMENTS
ANTICIPATED CAPITAL OUTLAY MILLAGE LEVY
124

Government-widePer Capita Governmental
Fiscal Personal Personal Median Unemployment Less than School Activities Cost perYear Population (A) Income (B) Income Age (A) Rate (C) High School High School Bachelors Graduate Enrollment (E) Expenses Student
2014-15 1,227,995 29,837,823$ 24,298$ 33.00 5.0% 100,946 212,145 159,306 78,864 190,341 1,879,466,522$ 9,874$ 2013-14 1,199,801 30,076,611 25,068 34.10 5.8% 92,054 207,661 155,572 76,471 185,593 1,823,546,398 9,826 2012-13 1,189,722 30,101,156 25,301 34.00 6.9% 91,071 206,560 154,994 75,510 182,461 1,686,467,986 9,243 2011-12 1,183,903 32,359,621 27,333 33.80 8.7% 91,270 217,865 162,187 74,308 178,871 1,640,086,797 9,169 2010-11 1,087,971 36,531,413 33,578 35.90 10.4% 88,914 199,879 148,664 71,131 179,040 1,644,959,400 9,188 2009-10 1,109,559 40,225,367 36,253 36.50 11.5% 96,858 202,389 148,900 75,173 171,820 1,621,386,031 9,437 2008-09 1,089,120 37,629,092 34,550 36.50 10.9% 128,255 183,487 132,971 56,542 170,121 1,588,984,968 9,340 2007-08 1,121,940 38,917,854 34,688 39.50 6.0% 71,628 188,736 152,413 68,802 171,489 1,693,221,246 9,874 2006-07 1,101,040 35,500,000 32,242 34.70 3.5% 86,659 197,945 129,319 63,179 172,795 1,634,444,744 9,459 2005-06 1,072,790 35,321,000 32,924 34.30 3.1% 71,628 373,554 152,413 68,802 173,733 1,494,052,090 8,600
Sources:
(A) Population and Median Age was obtained from Economic Development Commission of Mid-Florida, Inc.
(B) Personal Income was obtained from Economic Development Commission of Mid-Florida, Inc. and is inthousands.
(C) Unemployment Rates was obtained from Economic Development Commission of Mid-Florida, Inc.using the source of Bureau of Labor Statistics.
(D) Education Level was obtained from Economic Development Commission of Mid-Florida, Inc.
(E) Student Enrollment was obtained from District Records.
Education Level (D)
ORANGE COUNTY PUBLIC SCHOOLSDEMOGRAPHIC AND ECONOMIC STATISTICS
LAST TEN FISCAL YEARS
125

Percentage Percentage Percentage Percentage Percentage of Total MSA of Total MSA of Total MSA of Total MSA of Total MSA
Employer Employees Rank Employment Employees Rank Employment Employees Rank Employment Employees Rank Employment Employees Rank EmploymentWalt Disney World 74,000 1 6.398% 69,000 1 6.191% 58,000 1 5.195% 58,000 1 5.195% 62,200 1 5.530%Orange County Public Schools 22,347 2 1.932% 22,000 2 1.974% 21,349 2 1.912% 21,349 2 1.912% 21,349 2 1.898%Publix Super Markets, Inc. 17,521 3 1.569% 17,521 3 1.569% 17,521 4 1.558%Adventist Health System 18,668 4 1.614% 17,600 3 1.579% 16,700 4 1.496% 16,700 4 1.496% 21,483 3 1.910%Orlando Health 14,000 6 1.210% 14,310 5 1.284% 14,000 5 1.254% 14,000 5 1.254% 14,000 5 1.245%Universal Studio - Florida 19,000 3 1.643% 17,300 4 1.552% 13,000 6 1.164% 13,000 6 1.164% 14,300 6 1.271%Walgreens 6,500 9 0.562%Lockheed Martin 13,000 7 1.164% 13,000 7 1.164% 13,000 7 1.156%University of Central Florida 11,078 7 0.958% 9,500 8 0.851% 9,500 8 0.851% 9,500 8 0.845%Orlando International Airport 18,000 5 1.556%Seminole County Public Schools 7,786 6 0.699% 7,983 9 0.715% 7,983 9 0.715% 7,983 9 0.710%Orange County Government 7,000 8 0.605% 7,553 8 0.678% 7,818 10 0.700% 7,818 10 0.700% 7,818 10 0.695%Darden Restaurants, Inc. 6,419 10 0.555% 7,600 7 0.682%Osceola County Public Schools 6,560 9 0.589%Seaworld 6,032 10 0.541%
197,012 17.646% 175,741 15.741% 178,871 16.021% 178,871 15.903% 189,154 16.914%
Percentage Percentage Percentage Percentage Percentage of Total MSA of Total MSA of Total MSA of Total MSA of Total MSA
Employer Employees Rank Employment Employees Rank Employment Employees Rank Employment Employees Rank Employment Employees Rank EmploymentWalt Disney World 62,000 1 5.544% 62,000 1 5.533% 59,500 1 5.502% 56,800 1 5.286% 53,800 1 5.808%Orange County Public Schools 24,063 2 2.152% 24,063 2 2.147% 24,063 2 2.225% 24,063 2 2.239% 22,000 2 2.375%Florida Hospital 16,000 3 1.431% 15,606 4 1.393% 15,606 4 1.443% 19,220 3 1.789% 19,270 3 2.080%Walmart 16,002 3 1.428% 16,002 3 1.480%Universal Studio - Florida 10,000 6 0.894% 10,000 6 0.892% 10,000 6 0.925% 12,500 4 1.163% 12,500 4 1.350%Orlando Regional Health Care 13,000 5 1.162% 13,000 5 1.160% 13,000 5 1.202% 11,093 5 1.032% 11,093 5 1.198%Federal Government/US Postal Service 7,200 10 0.643% 7,200 10 0.666% 9,145 6 0.987%Publix Super Markets, Inc. 15,606 4 1.395% 8,946 8 0.798% 8,946 8 0.827% 9,145 6 0.851% 8,250 7 0.891%Seminole County Public Schools 8,845 8 0.791% 9,145 7 0.816% 9,145 7 0.846% 8,946 7 0.833%University of Central Florida 8,946 7 0.800% 7,426 9 0.663% 7,426 9 0.687% 7,426 9 0.691% 7,426 9 0.802%Bush Entertainment Corporation 7,800 9 0.697%Orange County Government 7,426 10 0.664%Central Florida Investments 8,300 8 0.772%Winn Dixie Super Markets 7,500 8 0.810%McDonald Resturant, Inc. 7,361 10 0.685% 7,361 10 0.795%
173,686 15.499% 173,388 16.035% 170,888 15.903% 164,854 17.798% 158,345 17.095%
Orlando Metropolitan Statistical Area includes Lake, Orange, Osceola, and Seminole Counties.
Source: Economic Development Commission of Mid-Florida, Inc.
ORANGE COUNTY PUBLIC SCHOOLSPRINCIPAL EMPLOYERS
ORLANDO METROPOLITAN STATISTICAL AREA (MSA)LAST TEN FISCAL YEARS
Fiscal Year
Fiscal Year
2012-13 2011-12 2010-11
2007-08 2006-07 2005-062009-10 2008-09
2014-15 2013-14
126

Placed In Last Major Square 2014-15 Percent ofService (1) Renovation Footage (2) Portables Capacity (2) 2004-05 2005-06 2006-07 2007-08 2008-09 2009-10 2010-11 2011-12 2012-13 2013-14 2014-15 Capacity
Elementary SchoolsAloma ES 1968 88,002 3 888 555.20 542.67 470.78 475.47 471.33 478.76 500.59 458.46 491.64 511.81 525.72 59.20%Andover ES 2005 96,450 10 828 448.17 504.23 575.73 563.08 543.51 608.55 650.48 717.11 763.41 793.75 95.86%Apopka ES 1968 81,806 11 992 746.77 845.29 449.91 507.58 577.37 646.35 659.41 707.39 707.98 711.05 664.44 66.98%Arbor Ridge School (3) 1990 132,342 - 1,210 911.94 888.34 823.64 807.50 746.79 731.35 708.51 744.17 750.22 747.56 757.20 62.58%Audubon Park ES 1954 77,452 27 626 517.44 587.75 593.12 697.53 850.72 938.13 1,060.62 1,127.36 1,153.79 1,176.75 1,166.37 186.32%Avalon ES 2001 107,069 18 1,006 1,237.15 1,459.42 807.90 819.63 748.34 783.59 821.60 879.50 926.26 944.49 940.46 93.49%Azalea Park ES 1956 94,935 - 708 935.40 968.56 973.27 910.13 931.53 915.65 913.88 630.60 617.90 595.57 578.34 81.69%Bay Meadows ES 1991 92,340 - 848 1,094.90 1,009.62 517.35 511.60 532.74 523.40 564.74 584.87 550.00 571.66 577.72 68.13%Blankner School (3) 1956 146,439 9 1,249 949.03 926.10 864.12 909.90 946.67 988.50 986.24 993.81 984.42 967.58 1,053.28 84.33%Bonneville ES 1960 117,012 - 938 858.59 631.10 578.61 543.36 552.78 524.58 537.27 529.43 502.02 539.65 567.26 60.48%Brookshire ES 1960 86,815 - 856 564.33 576.29 536.47 512.04 486.42 495.56 491.25 521.99 514.62 610.99 626.01 73.13%Camelot ES 2001 96,137 - 790 1,217.45 1,309.01 706.10 733.85 668.73 636.05 579.09 549.00 561.15 583.33 585.17 74.07%Castle Creek ES 2006 100,850 - 828 608.51 673.31 703.60 738.53 765.12 762.36 774.05 792.98 826.06 99.77%Catalina ES 1959 53,987 - 489 595.40 618.41 679.00 694.85 605.73 570.85 551.62 591.63 642.46 629.79 625.31 127.88%Cheney ES 1959 90,681 1 754 637.62 663.40 644.46 618.35 544.27 517.25 476.95 555.27 562.24 480.14 493.79 65.49%Chickasaw ES 1960 103,770 4 942 730.07 756.86 795.84 768.49 748.42 746.12 784.05 766.24 744.07 724.34 733.85 77.90%Citrus ES 2000 101,951 8 902 862.21 881.16 933.58 885.57 832.72 803.90 762.61 772.05 707.89 674.03 645.38 71.55%Clarcona ES 1988 110,435 32 1,146 739.62 903.75 960.85 990.67 886.24 924.83 960.56 936.02 946.34 1,042.57 1,062.63 92.73%Clay Springs ES 1992 121,242 58 940 751.99 752.16 820.86 824.64 810.55 815.81 806.01 766.95 778.76 757.39 746.26 79.39%Columbia ES 1969 113,729 16 1,130 1,091.78 762.10 781.22 1,017.63 1,016.97 1,044.32 1,050.62 1,058.64 1,088.09 1,100.76 1,043.00 92.30%Conway ES 1954 86,745 6 735 602.98 594.04 545.56 564.39 541.58 563.20 594.97 619.82 601.10 568.83 591.21 80.44%Cypress Park ES 1959 52,081 14 618 381.67 386.57 386.74 418.78 416.36 382.59 381.41 277.46 280.32 240.17 248.04 40.14%Cypress Springs ES 1996 169,235 - 1,786 1,209.40 863.40 821.91 766.15 788.29 758.49 744.34 733.78 727.69 743.93 743.79 41.65%Deerwood ES 1983 86,107 19 812 669.36 652.01 656.17 624.75 576.77 544.51 514.88 506.13 499.13 486.93 445.43 54.86%Dillard Street ES 1951 109,595 16 1,038 654.37 658.72 678.09 724.59 755.91 775.61 737.37 751.62 748.86 748.95 724.67 69.81%Dommerich ES 1964 99,139 10 747 721.39 703.89 701.24 687.68 649.08 619.26 630.65 611.76 611.74 585.22 603.70 80.82%Dover Shores ES 1960 41,128 12 652 722.43 674.56 678.78 623.00 594.62 593.09 585.36 634.18 585.90 641.55 611.77 93.83%Dr. Phillips ES 1977 71,555 17 788 665.24 628.71 633.31 635.24 610.88 605.48 631.61 636.40 622.03 606.85 645.03 81.86%Dream Lake ES 1954 108,391 31 1,170 727.48 800.74 811.59 800.54 782.70 777.87 695.35 740.56 770.88 792.61 785.32 67.12%Durrance ES 1960 72,499 15 810 469.88 476.37 499.73 467.20 462.81 450.11 413.32 426.96 416.45 424.95 410.75 50.71%Eagle's Nest ES 2003 94,692 - 758 768.91 718.35 645.21 689.03 612.73 607.65 571.47 603.40 642.68 650.06 693.29 91.46%East Lake ES 2005 96,933 2 792 804.16 879.94 742.21 694.50 670.08 654.33 634.04 620.25 670.82 712.16 89.92%Eccleston ES 1956 72,028 3 820 460.19 510.91 510.54 484.32 436.05 472.84 452.29 415.14 431.46 649.55 689.28 84.06%Endeavor ES 2001 105,618 10 656 929.60 909.50 838.69 843.39 767.47 760.55 765.95 748.56 762.81 648.79 645.80 98.45%Englewood ES 1958 84,136 23 974 531.39 496.38 479.16 510.05 521.39 537.63 519.35 511.71 524.21 487.52 549.29 56.40%Fern Creek ES 1947 68,459 5 594 379.34 403.40 397.67 389.75 346.62 311.72 296.10 317.46 341.53 335.65 303.64 51.12%Forsyth Woods ES 2011 101,965 - 859 710.68 654.20 657.39 728.53 84.81%Frangus ES 1993 113,106 57 846 839.48 768.59 691.11 601.98 614.76 610.88 604.07 627.99 636.68 608.49 619.59 73.24%Grand Avenue ES 1926 56,085 14 488 348.19 372.57 199.72 201.80 206.53 213.13 194.80 214.32 235.96 256.64 242.82 49.76%Hiawassee ES 1966 97,472 9 794 644.55 699.07 695.49 722.06 707.82 717.03 724.82 720.25 733.73 763.07 773.17 97.38%Hidden Oaks ES 1992 122,675 56 936 778.79 919.97 658.29 647.38 681.15 615.79 556.74 520.29 506.87 485.51 480.33 51.32%Hillcrest ES 1964 58,680 3 460 346.86 367.91 357.88 369.52 378.00 388.40 430.87 442.51 465.50 463.39 455.10 98.93%Hungerford ES 1900 61,475 5 594 200.47 253.01 212.64 195.82 186.94 227.55 227.29 259.68 266.07 280.25 265.21 44.65%Hunters Creek ES 1994 99,444 9 808 730.63 697.59 624.52 635.17 669.72 732.82 747.93 799.54 821.53 859.57 862.32 106.72%Ivey Lane ES 1967 75,304 9 658 318.17 353.06 322.70 295.15 343.29 328.41 273.22 315.35 316.38 363.00 334.81 50.88%John Young ES 1991 122,112 54 980 1,036.59 1,035.23 997.09 969.48 861.22 812.50 764.90 730.36 710.51 694.71 704.50 71.89%Kaley ES 1946 66,710 6 470 350.75 323.20 297.50 265.19 257.97 255.97 239.41 233.17 199.70 210.60 189.10 40.23%Keenes Crossing ES 2009 101,965 11 859 585.44 666.24 724.65 799.86 979.74 1,171.71 136.40%Killarney ES 1950 75,606 12 736 568.71 575.85 509.75 445.10 444.51 432.29 454.90 428.17 446.40 453.63 434.57 59.04%Lake Como ES 1950 66,504 3 528 287.29 307.41 306.47 280.40 256.26 260.39 254.54 257.98 255.32 262.48 252.37 47.80%Lake Gem ES 1999 124,452 19 964 706.77 725.29 774.49 782.15 791.49 848.83 884.10 853.59 903.18 885.05 874.67 90.73%Lake George ES 1999 114,667 - 689 705.95 665.27 577.70 566.58 514.17 550.94 566.53 586.92 605.76 588.81 633.78 91.99%Lake Silver ES 1952 91,930 - 942 589.43 570.56 525.37 460.88 472.93 520.79 621.66 643.73 648.94 671.61 686.59 72.89%Lake Sybelia ES 1967 80,758 4 726 597.79 570.50 519.91 536.62 560.09 542.46 588.81 626.16 618.25 580.47 605.20 83.36%Lake Weston ES 1958 74,233 22 944 598.31 618.31 586.01 534.72 545.18 520.56 538.37 513.76 581.60 568.86 503.07 53.29%Lake Whitney ES 1998 111,876 14 874 1,175.32 949.78 966.65 993.92 617.51 619.76 618.43 618.69 621.51 562.50 597.00 68.31%Lakemont ES 1956 91,676 5 856 703.27 688.54 694.58 610.17 690.51 684.02 747.15 726.41 712.26 674.49 648.48 75.76%Lakeville ES 1999 126,403 21 913 988.12 971.57 921.51 901.96 879.00 878.40 874.15 865.75 881.50 868.32 879.15 96.29%Lancaster ES 1961 181,159 3 2,002 854.19 917.34 945.11 754.45 726.52 756.60 740.27 815.95 838.00 835.33 865.18 43.22%Lawton Chiles ES 2000 109,085 11 979 809.17 841.06 806.92 743.37 715.24 709.77 703.34 741.66 713.68 702.54 686.61 70.13%Little River ES 1992 215,838 52 1,677 1,047.29 1,058.83 1,070.92 1,004.40 896.67 825.04 739.72 412.29 424.15 440.15 457.71 27.29%Lockhart ES 1936 79,092 1 654 511.95 504.38 573.11 505.93 502.34 513.24 493.25 480.20 496.62 469.56 466.42 71.32%Lovell ES 1960 75,339 31 1,022 580.65 627.59 724.31 737.28 705.53 714.30 661.82 661.69 694.49 684.96 691.88 67.70%Maxey ES 1966 51,276 14 560 277.32 287.95 273.41 284.22 293.05 283.56 259.96 271.73 265.15 265.24 262.02 46.79%McCoy ES 1965 100,209 - 896 756.44 866.16 855.34 824.04 775.65 692.63 662.00 637.46 700.01 755.43 778.57 86.89%Meadow Woods ES 1990 120,787 53 918 867.13 912.11 794.40 831.17 802.50 773.42 778.73 555.07 573.38 552.39 490.11 53.39%Metrowest ES 1989 170,584 15 1,543 1,279.98 1,281.46 1,224.98 1,198.63 1,211.97 1,303.41 1,437.52 1,503.67 1,482.19 1,473.61 1,530.77 99.21%Millennia ES 2006 104,247 21 1,098 583.23 705.17 735.86 776.94 852.19 936.94 976.05 1,002.58 91.31%Mollie E. Ray ES 1960 83,205 17 972 562.64 712.61 657.23 554.11 510.89 507.76 501.52 599.86 580.30 502.32 479.36 49.32%Moss Park ES 2007 106,863 17 1,094 839.78 878.45 917.51 978.78 1,037.04 1,130.59 1,288.36 1,311.97 119.92%North Lake Park ES 2000 148,213 - 932 970.09 1,342.34 1,097.33 738.00 834.01 922.90 1,020.17 1,078.06 1,183.34 961.29 1,079.25 115.80%Oak Hill ES 1975 69,036 18 480 592.86 529.35 503.96 453.07 477.77 459.13 470.66 470.08 490.07 487.54 468.84 97.68%Oakshire ES 2000 111,022 12 968 1,394.81 1,483.44 827.22 676.55 708.62 707.21 708.36 711.95 615.69 591.96 606.27 62.63%Ocoee ES 1977 68,680 35 728 658.80 667.22 705.42 735.90 724.85 744.17 793.09 788.49 811.82 816.50 795.75 109.31%
FTE Enrollment Data
ORANGE COUNTY PUBLIC SCHOOLSSCHOOL BUILDING INFORMATION & FULL-TIME EQUIVALENT ENROLLMENT DATA
LAST 10 YEARS
127
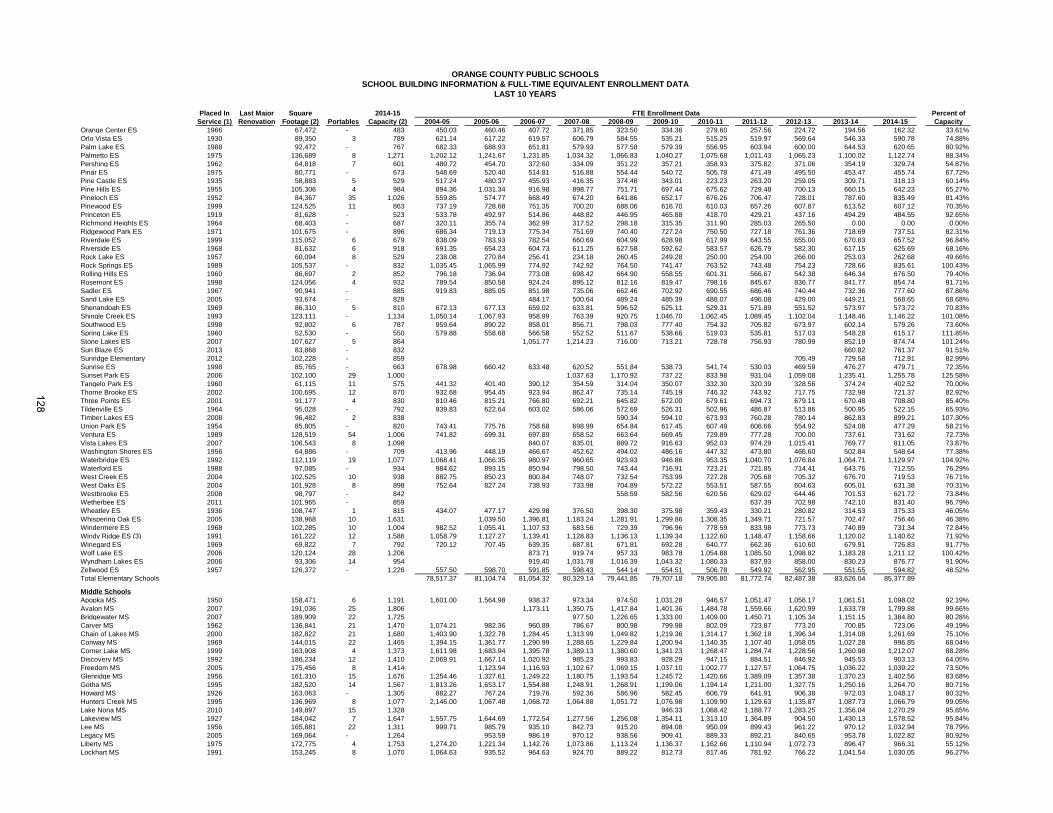
Placed In Last Major Square 2014-15 Percent ofService (1) Renovation Footage (2) Portables Capacity (2) 2004-05 2005-06 2006-07 2007-08 2008-09 2009-10 2010-11 2011-12 2012-13 2013-14 2014-15 Capacity
FTE Enrollment Data
ORANGE COUNTY PUBLIC SCHOOLSSCHOOL BUILDING INFORMATION & FULL-TIME EQUIVALENT ENROLLMENT DATA
LAST 10 YEARS
Orange Center ES 1966 67,472 - 483 450.03 460.46 407.72 371.85 323.50 334.36 279.60 257.56 224.72 194.56 162.32 33.61%Orlo Vista ES 1930 89,350 3 789 621.14 617.22 619.57 606.79 584.55 535.21 515.25 519.97 569.64 546.33 590.78 74.88%Palm Lake ES 1988 92,472 - 767 682.33 688.93 651.81 579.93 577.58 579.39 556.95 603.94 600.00 644.53 620.65 80.92%Palmetto ES 1975 136,689 8 1,271 1,202.12 1,241.67 1,231.85 1,034.32 1,066.83 1,040.27 1,075.68 1,011.43 1,065.23 1,100.02 1,122.74 88.34%Pershing ES 1962 64,818 7 601 480.72 454.70 372.60 334.09 351.22 357.21 358.93 375.82 371.06 354.19 329.74 54.87%Pinar ES 1975 80,771 - 673 548.69 520.40 514.81 516.88 554.44 540.72 505.78 471.49 495.50 453.47 455.74 67.72%Pine Castle ES 1935 58,883 5 529 517.24 480.37 455.93 416.35 374.48 343.01 223.23 263.20 259.05 309.71 318.13 60.14%Pine Hills ES 1955 105,306 4 984 894.36 1,031.34 916.98 898.77 751.71 697.44 675.62 729.48 700.13 660.15 642.23 65.27%Pineloch ES 1952 84,367 35 1,026 559.85 574.77 668.49 674.20 641.86 652.17 676.26 706.47 728.01 787.60 835.49 81.43%Pinewood ES 1999 124,525 11 863 737.19 728.68 751.35 700.20 688.06 616.70 610.03 657.26 607.87 613.52 607.12 70.35%Princeton ES 1919 81,628 - 523 533.78 492.97 514.86 448.82 446.95 465.88 418.70 429.21 437.16 494.29 484.55 92.65%Richmond Heights ES 1964 68,403 - 687 320.11 355.74 362.99 317.52 298.18 315.35 311.90 285.03 265.50 0.00 0.00 0.00%Ridgewood Park ES 1971 101,675 - 896 686.34 719.13 775.34 751.69 740.40 727.24 750.50 727.18 761.36 718.69 737.51 82.31%Riverdale ES 1999 115,052 6 679 838.09 783.93 782.54 660.69 604.99 628.98 617.99 643.55 655.00 670.83 657.52 96.84%Riverside ES 1968 81,632 6 918 691.35 654.23 604.73 611.25 627.58 592.62 583.57 626.79 582.30 617.15 625.69 68.16%Rock Lake ES 1957 60,094 8 529 238.08 270.84 256.41 234.18 260.45 249.28 250.00 254.00 266.00 253.03 262.68 49.66%Rock Springs ES 1989 105,537 - 832 1,035.45 1,065.99 774.92 742.92 764.50 741.47 763.52 743.48 754.23 728.66 835.61 100.43%Rolling Hills ES 1960 86,697 2 852 796.18 736.94 773.08 698.42 664.90 558.55 601.31 566.67 542.38 646.34 676.50 79.40%Rosemont ES 1998 124,056 4 932 789.54 850.58 924.24 895.12 812.16 819.47 798.16 845.67 836.77 841.77 854.74 91.71%Sadler ES 1967 90,941 - 885 919.83 885.05 851.98 735.06 662.46 702.92 690.55 686.46 740.44 732.36 777.60 87.86%Sand Lake ES 2005 93,674 - 828 484.17 500.64 489.24 485.39 488.07 496.08 429.00 449.21 568.65 68.68%Shenandoah ES 1969 86,310 5 810 672.13 677.13 659.02 633.81 596.52 625.11 529.31 571.89 551.52 573.97 573.72 70.83%Shingle Creek ES 1993 123,111 - 1,134 1,050.14 1,067.93 958.99 763.39 920.75 1,046.70 1,062.45 1,089.45 1,102.04 1,148.46 1,146.22 101.08%Southwood ES 1998 92,802 6 787 959.64 890.22 858.01 856.71 798.03 777.40 754.32 705.82 673.97 602.14 579.26 73.60%Spring Lake ES 1960 52,530 - 550 579.88 558.68 566.58 552.52 511.67 538.66 519.03 535.81 517.03 548.28 615.17 111.85%Stone Lakes ES 2007 107,627 5 864 1,051.77 1,214.23 716.00 713.21 728.78 756.93 780.99 852.19 874.74 101.24%Sun Blaze ES 2013 83,868 - 832 660.82 761.37 91.51%Sunridge Elementary 2012 102,228 - 859 705.49 729.58 712.91 82.99%Sunrise ES 1998 85,765 - 663 678.98 660.42 633.48 620.52 551.84 538.73 541.74 530.03 469.59 476.27 479.71 72.35%Sunset Park ES 2006 102,100 29 1,000 1,037.63 1,170.92 737.22 833.98 931.04 1,059.08 1,235.41 1,255.78 125.58%Tangelo Park ES 1960 61,115 11 575 441.32 401.40 390.12 354.59 314.04 350.07 332.30 320.39 328.56 374.24 402.52 70.00%Thorne Brooke ES 2002 100,695 12 870 932.68 954.45 923.94 862.47 735.14 745.19 746.32 743.92 717.75 732.98 721.37 82.92%Three Points ES 2001 91,177 4 830 810.46 815.21 766.80 692.21 645.82 672.00 679.61 694.73 679.11 670.48 708.80 85.40%Tildenville ES 1964 95,028 - 792 939.83 622.64 603.02 586.06 572.69 526.31 502.96 486.87 513.86 500.95 522.15 65.93%Timber Lakes ES 2008 96,482 2 838 590.34 594.10 673.93 760.28 780.14 862.83 899.21 107.30%Union Park ES 1954 85,805 - 820 743.41 775.76 758.68 698.99 654.84 617.45 607.49 606.66 554.92 524.08 477.29 58.21%Ventura ES 1989 128,519 54 1,006 741.82 699.31 697.89 658.52 663.64 669.45 729.89 777.28 700.00 737.61 731.62 72.73%Vista Lakes ES 2007 106,543 8 1,098 840.07 835.01 889.72 916.63 952.03 974.29 1,015.41 769.77 811.05 73.87%Washington Shores ES 1956 64,886 - 709 413.96 448.19 466.67 452.62 494.02 486.16 447.32 473.80 466.60 502.84 548.64 77.38%Waterbridge ES 1992 112,119 19 1,077 1,068.41 1,066.35 980.97 960.65 923.93 946.86 953.35 1,040.70 1,076.84 1,064.71 1,129.97 104.92%Waterford ES 1988 97,085 - 934 984.62 893.15 850.94 798.50 743.44 716.91 723.21 721.85 714.41 643.76 712.55 76.29%West Creek ES 2004 102,525 10 938 882.75 850.23 800.84 748.07 732.54 753.99 727.28 705.68 705.32 676.70 719.53 76.71%West Oaks ES 2004 101,928 8 898 752.64 827.24 738.93 733.98 704.89 572.22 553.51 587.55 604.63 605.01 631.38 70.31%Westbrooke ES 2008 98,797 - 842 558.59 582.56 620.56 629.02 644.46 701.53 621.72 73.84%Wetherbee ES 2011 101,965 - 859 637.39 702.98 742.10 831.40 96.79%Wheatley ES 1936 108,747 1 815 434.07 477.17 429.98 376.50 398.30 375.98 359.43 330.21 280.82 314.53 375.33 46.05%Whispering Oak ES 2005 138,968 10 1,631 1,039.50 1,396.81 1,183.24 1,281.91 1,299.86 1,308.35 1,349.71 721.57 702.47 756.46 46.38%Windermere ES 1968 102,285 10 1,004 982.52 1,055.41 1,107.53 683.56 729.39 796.96 778.59 833.98 773.73 740.89 731.34 72.84%Windy Ridge ES (3) 1991 161,222 12 1,586 1,058.79 1,127.27 1,139.41 1,128.83 1,136.13 1,139.34 1,122.60 1,148.47 1,158.66 1,120.02 1,140.62 71.92%Winegard ES 1969 69,822 7 792 720.12 707.45 639.35 687.81 671.81 692.28 640.77 662.36 610.60 679.91 726.83 91.77%Wolf Lake ES 2006 120,124 28 1,206 873.71 919.74 957.33 983.78 1,054.88 1,085.50 1,098.82 1,183.28 1,211.12 100.42%Wyndham Lakes ES 2006 93,306 14 954 919.40 1,031.78 1,016.39 1,043.32 1,080.33 837.93 858.00 830.23 876.77 91.90%Zellwood ES 1957 126,372 - 1,226 557.50 598.70 591.85 598.43 544.14 554.51 506.78 549.92 562.95 551.55 594.82 48.52%Total Elementary Schools 78,517.37 81,104.74 81,054.32 80,329.14 79,441.85 79,707.18 79,905.80 81,772.74 82,487.38 83,626.04 85,377.89
Middle Schools Apopka MS 1950 158,471 6 1,191 1,601.00 1,564.98 938.37 973.34 974.50 1,031.28 946.57 1,051.47 1,056.17 1,061.51 1,098.02 92.19%Avalon MS 2007 191,036 25 1,806 1,173.11 1,350.75 1,417.84 1,401.36 1,484.78 1,559.66 1,620.99 1,633.78 1,799.88 99.66%Bridgewater MS 2007 189,909 22 1,725 977.50 1,226.65 1,333.00 1,409.00 1,450.71 1,105.34 1,151.15 1,384.80 80.28%Carver MS 1962 136,841 21 1,470 1,074.21 982.36 960.89 786.67 800.98 799.98 802.09 723.87 773.20 700.85 723.06 49.19%Chain of Lakes MS 2000 182,822 21 1,680 1,403.90 1,322.78 1,284.45 1,313.99 1,049.82 1,219.36 1,314.17 1,362.18 1,396.34 1,314.08 1,261.69 75.10%Conway MS 1969 144,015 22 1,465 1,394.15 1,361.77 1,290.99 1,288.65 1,229.84 1,200.94 1,140.35 1,107.40 1,058.05 1,027.28 996.85 68.04%Corner Lake MS 1999 163,908 4 1,373 1,611.98 1,683.94 1,395.78 1,389.13 1,380.60 1,341.23 1,268.47 1,284.74 1,228.56 1,260.98 1,212.07 88.28%Discovery MS 1992 186,234 12 1,410 2,069.91 1,667.14 1,020.92 985.23 993.83 928.29 947.15 884.51 846.92 945.53 903.13 64.05%Freedom MS 2005 175,456 8 1,414 1,123.94 1,116.93 1,102.67 1,069.15 1,037.10 1,002.77 1,127.57 1,064.75 1,036.22 1,039.22 73.50%Glenridge MS 1956 161,310 15 1,676 1,254.46 1,327.61 1,249.22 1,180.75 1,193.54 1,245.72 1,420.66 1,389.09 1,357.38 1,370.23 1,402.56 83.68%Gotha MS 1995 182,520 14 1,567 1,813.26 1,653.17 1,554.88 1,248.91 1,268.91 1,199.06 1,194.14 1,211.00 1,327.75 1,250.16 1,264.70 80.71%Howard MS 1926 163,063 - 1,305 882.27 767.24 719.76 592.36 586.96 582.45 606.79 641.91 906.38 972.03 1,048.17 80.32%Hunters Creek MS 1995 136,969 8 1,077 2,146.00 1,067.48 1,068.72 1,064.88 1,051.72 1,076.98 1,109.90 1,129.63 1,135.87 1,087.73 1,066.79 99.05%Lake Nona MS 2010 149,897 15 1,328 946.33 1,068.42 1,188.77 1,283.25 1,356.04 1,270.29 95.65%Lakeview MS 1927 184,042 7 1,647 1,557.75 1,644.69 1,772.54 1,277.56 1,256.08 1,354.11 1,313.10 1,364.89 904.50 1,430.13 1,578.52 95.84%Lee MS 1956 165,881 22 1,311 999.71 985.79 935.10 842.73 915.20 894.08 950.09 899.43 961.22 970.12 1,032.94 78.79%Legacy MS 2005 169,064 - 1,264 953.59 986.19 970.12 938.56 909.41 889.33 892.21 840.65 953.78 1,022.82 80.92%Liberty MS 1975 172,775 4 1,753 1,274.20 1,221.34 1,142.76 1,073.86 1,113.24 1,136.37 1,162.66 1,110.94 1,072.73 896.47 966.31 55.12%Lockhart MS 1991 153,245 8 1,070 1,064.63 935.52 964.63 924.70 889.22 812.73 817.46 781.92 766.22 1,041.54 1,030.05 96.27%
128

Placed In Last Major Square 2014-15 Percent ofService (1) Renovation Footage (2) Portables Capacity (2) 2004-05 2005-06 2006-07 2007-08 2008-09 2009-10 2010-11 2011-12 2012-13 2013-14 2014-15 Capacity
FTE Enrollment Data
ORANGE COUNTY PUBLIC SCHOOLSSCHOOL BUILDING INFORMATION & FULL-TIME EQUIVALENT ENROLLMENT DATA
LAST 10 YEARS
Maitland MS 1959 141,005 8 1,267 1,126.43 1,056.63 1,005.74 930.99 890.58 929.39 971.85 1,030.92 975.96 811.11 803.34 63.40%Meadow Woods MS 1999 175,354 17 1,697 1,956.11 1,943.98 1,383.26 1,367.09 1,203.46 1,165.57 1,142.23 1,131.55 1,177.03 911.46 897.42 52.88%Meadowbrook MS 1966 177,898 9 1,581 1,000.15 1,074.00 1,191.71 1,137.03 1,135.42 1,043.85 1,019.03 1,035.89 1,056.51 1,071.79 1,040.02 65.78%Memorial MS 1962 189,507 - 1,324 759.35 732.21 748.88 690.40 780.21 789.09 695.50 658.08 760.00 1,065.44 926.50 69.98%Ocoee MS 1990 191,743 12 1,847 1,616.96 1,605.36 1,658.14 1,638.05 1,679.39 1,643.27 1,603.88 1,556.75 1,445.00 812.08 840.82 45.52%Odyssey MS 2001 180,515 5 1,371 1,534.90 1,304.56 1,449.57 1,554.84 1,656.05 860.67 874.43 906.61 957.50 1,379.18 1,369.11 99.86%Piedmont Lakes MS 1993 187,291 27 1,809 1,664.35 1,557.79 1,365.18 1,255.98 1,197.68 1,128.63 1,140.56 1,152.92 1,189.96 929.48 909.96 50.30%Robinswood MS 1963 156,719 25 1,555 1,259.73 1,202.43 1,177.06 1,085.44 1,107.74 1,099.96 1,228.54 1,235.14 1,295.94 1,211.83 1,140.16 73.32%South Creek MS 2006 154,373 - 1,250 783.20 869.70 927.32 908.30 972.68 1,042.72 1,010.00 1,284.97 1,234.66 98.77%Southwest MS 1992 185,000 6 1,476 1,373.03 1,287.70 1,224.09 1,262.82 1,290.37 1,285.70 1,298.05 1,212.72 1,209.72 961.83 950.14 64.37%Stonewall Jackson MS 1964 99,891 - 859 1,139.87 1,091.90 972.06 1,106.67 1,206.19 1,239.38 1,210.90 1,339.59 1,348.95 1,194.59 1,253.07 145.88%Sunridge Middle 2012 159,859 4 1,216 1,103.39 1,229.69 1,242.00 102.14%Union Park MS 1993 212,430 - 1,643 1,374.71 1,331.89 1,245.77 1,160.37 1,119.04 1,046.96 1,040.25 970.68 922.22 913.63 871.46 53.04%Walker MS 1966 173,391 - 1,293 1,149.74 1,139.50 1,128.48 1,061.92 1,098.73 1,033.71 917.78 916.00 958.98 989.21 1,018.72 78.79%Westridge MS 1973 294,475 22 2,585 1,236.40 1,101.58 1,045.39 933.98 1,000.86 977.47 1,036.96 1,070.92 1,174.44 1,235.45 1,260.26 48.75%Wolf Lake MS 2006 173,671 7 1,383 971.98 962.93 1,030.87 1,065.63 1,114.33 1,148.00 1,153.45 1,102.78 1,125.96 81.41%Total Middle Schools 37,339.16 36,692.87 36,925.75 36,362.01 36,680.55 36,667.36 37,114.87 37,570.39 38,445.32 38,564.13 38,985.47
High SchoolsApopka HS 1974 424,048 56 3,402 3,921.77 3,569.56 3,452.53 2,750.10 2,506.13 2,505.48 2,501.62 2,760.16 2,840.67 2,874.56 2,968.02 87.24%Boone HS 1952 325,848 14 3,469 3,277.08 3,220.17 3,132.55 3,051.50 3,011.93 2,950.79 2,741.92 2,780.90 2,775.47 2,702.93 2,591.86 74.71%Colonial HS 1958 437,359 19 3,217 3,700.13 3,627.59 3,664.13 3,691.54 3,656.28 3,269.91 3,245.36 3,205.33 3,303.39 3,193.94 3,190.54 99.18%Cypress Creek HS 1993 455,925 95 3,827 2,966.82 3,175.33 3,267.76 3,144.11 3,306.60 3,116.34 3,106.05 3,098.36 3,048.80 2,930.73 2,974.03 77.71%Dr. Phillips HS 1989 596,865 115 4,652 3,753.17 3,603.60 3,390.84 3,455.53 3,473.07 3,553.74 3,489.46 3,562.00 3,556.69 3,334.08 3,320.92 71.39%East River HS 2010 409,824 - 3,161 1,529.53 1,909.62 1,798.34 1,763.65 1,722.73 1,766.12 55.87%Edgewater HS 1950 453,566 - 2,508 3,031.72 2,663.35 2,502.31 2,189.20 1,903.93 1,765.95 1,652.18 1,657.37 1,663.59 1,580.55 1,691.04 67.43%Evans HS 1958 329,875 14 2,574 2,306.44 2,498.97 2,204.20 1,887.44 1,924.67 1,873.97 1,855.04 2,003.49 2,302.49 2,464.58 2,275.60 88.41%Freedom HS 2003 376,102 23 3,362 3,261.35 3,238.97 2,957.30 2,925.08 2,706.49 2,713.19 2,836.67 3,003.98 3,034.38 3,108.54 3,130.20 93.11%Jones HS 1952 311,975 8 1,693 1,121.59 1,084.66 986.51 1,007.33 985.23 1,040.81 955.38 863.36 791.80 708.57 959.19 56.66%Lake Nona HS 2009 394,422 - 2,955 705.09 1,229.34 1,742.23 1,829.78 1,920.28 2,133.12 72.19%Oak Ridge HS 1960 468,924 11 3,767 2,036.35 2,136.81 2,105.35 2,032.07 2,128.84 1,916.15 1,828.22 1,718.90 1,977.63 2,269.70 2,549.27 67.67%Ocoee HS 2005 334,568 2 2,924 2,895.27 3,046.73 2,690.66 2,566.46 2,387.01 2,249.17 2,294.16 2,242.34 2,231.50 1,988.32 68.00%Olympia HS 2001 418,980 - 3,546 3,238.95 3,102.63 3,123.23 3,156.20 2,979.20 2,944.64 2,896.02 2,863.60 2,769.56 2,762.11 2,729.72 76.98%Timber Creek HS 2001 414,362 32 3,671 3,309.17 3,677.20 3,969.26 4,179.55 4,227.85 3,164.02 2,900.99 2,965.71 2,975.91 2,929.00 2,994.04 81.56%University HS 1991 572,666 85 4,643 3,389.77 3,534.92 3,513.27 3,515.20 3,359.06 2,755.01 2,658.78 2,707.69 2,910.42 2,895.66 2,921.66 62.93%Wekiva HS 2007 372,356 - 2,945 1,748.59 2,293.23 2,296.10 2,355.36 2,130.95 2,080.92 2,169.54 2,252.98 76.50%West Orange HS 1974 420,535 42 3,152 3,983.87 2,226.53 2,311.06 2,493.02 2,609.11 2,858.43 3,077.01 3,201.68 3,397.32 3,593.22 3,635.73 115.35%Winter Park HS 1969 362,667 8 3,027 3,769.49 3,522.22 3,350.58 3,165.62 3,096.77 3,126.49 3,189.94 3,300.45 3,097.93 2,998.34 2,931.10 96.83%Total High Schools 47,067.67 47,777.78 46,977.61 47,082.74 46,734.85 46,472.65 46,678.13 47,658.66 48,362.74 48,390.56 49,003.46
Speciality Schools Cherokee School 1926 78,456 n/a n/a 86.00 79.57 93.74 86.50 69.41 59.82 51.96 53.23 56.12 26.13 30.34 n/aDevereux Treatment n/a n/a n/a n/a 26.00 30.73 32.78 18.55 19.50 18.91 18.96 17.00 20.50 27.54 30.86 n/aGateway School 1961 72,548 n/a n/a 186.59 109.46 87.81 52.96 54.26 56.54 64.11 69.19 62.13 76.46 68.04 n/aMagnolia Special Education 1973 106,395 n/a n/a 179.25 205.80 193.61 194.20 192.27 184.88 177.79 173.60 171.03 141.59 138.46 n/aSilver Star Center 2008 33,612 n/a n/a 129.67 71.92 70.81 61.01 64.86 55.63 57.34 47.93 53.74 42.90 31.38 n/aTotal Speciality Schools 607.51 497.48 478.75 413.22 400.30 375.78 370.16 360.95 363.52 314.62 299.08
Other ProgramsAcceleration Academy n/a n/a n/a n/a 294.99 377.69 399.51 274.66 231.11 220.62 n/aAcceleration Academy West n/a n/a n/a n/a 130.50 122.55 112.35 n/aAddictons Receiving Facility n/a n/a n/a n/a 15.33 15.00 11.50 19.00 12.06 10.00 16.50 13.50 18.84 9.19 n/aAE ASAP n/a n/a n/a n/a 20.42 15.88 19.25 19.62 22.00 19.50 22.00 10.50 n/aAE FS I n/a n/a n/a n/a 11.50 8.45 n/aAE Lakeside n/a n/a n/a n/a 14.34 15.50 21.00 n/aAE PROJCOMP n/a n/a n/a n/a 31.00 31.78 29.48 26.20 29.00 17.98 31.92 32.41 34.30 38.22 n/aAE Village n/a n/a n/a n/a 11.50 12.50 10.50 11.50 12.50 15.00 13.43 14.34 2.80 n/aAE YOP n/a n/a n/a n/a 31.50 62.50 71.93 56.44 43.06 38.47 44.00 52.38 28.98 26.02 n/aAlternative Center n/a n/a n/a n/a 523.52 136.40 128.91 109.76 74.79 38.56 46.33 38.00 36.58 40.42 56.26 n/aAlternative Center - BETA n/a n/a n/a n/a 288.10 234.98 269.45 241.10 243.14 279.21 251.45 236.15 191.70 188.81 n/aAlternative Center - UBC n/a n/a n/a n/a 78.00 72.34 71.54 80.24 69.68 94.50 83.00 77.00 58.82 39.43 n/aCommunity Ed Partners - NW n/a n/a n/a n/a 670.88 642.05 526.95 427.86 n/aCommunity Ed Partners - SW n/a n/a n/a n/a 526.57 616.70 594.58 557.74 n/aDrop Back In n/a n/a n/a n/a 174.36 412.95 582.88 892.12 833.88 506.03 n/aEast Orlando Education Ctr n/a n/a n/a n/a 12.84 24.99 21.91 15.96 8.00 n/aEsteem Academy n/a n/a n/a n/a 30.32 28.44 36.91 33.91 30.38 46.91 26.54 n/aExcel Academy 2009 n/a n/a n/a 263.69 317.24 303.29 299.38 338.49 311.43 214.14 211.69 166.52 138.92 n/aHospital/Homebound n/a n/a n/a n/a 71.22 65.81 78.52 69.87 63.44 69.43 35.25 120.67 145.56 180.66 154.47 n/aLa-Amistad n/a n/a n/a n/a 51.40 51.91 52.00 46.00 63.75 73.63 77.90 77.75 81.69 46.18 53.53 n/aMcKay Scholarship n/a n/a n/a n/a 830.80 982.50 915.40 1,282.52 1,449.37 1,537.00 1,402.79 1,743.30 1,982.63 2,103.86 2,306.42 n/aMS Professional Academy n/a n/a n/a n/a 132.98 145.51 133.61 87.74 128.48 0.00 0.00 n/aNew Choices Academy n/a n/a n/a n/a 2.50 3.00 0.84 0.42 0.98 n/aOCPS DOE Virtual School n/a n/a n/a n/a 37.27 90.98 70.16 81.70 94.99 75.17 n/aOCVS Digital Academy 40.93 26.45 n/aOpportunity Scholarship n/a n/a n/a n/a 27.50 n/aOrange County Virtual School n/a n/a n/a n/a 87.20 125.60 111.01 335.50 597.71 n/a
129

Placed In Last Major Square 2014-15 Percent ofService (1) Renovation Footage (2) Portables Capacity (2) 2004-05 2005-06 2006-07 2007-08 2008-09 2009-10 2010-11 2011-12 2012-13 2013-14 2014-15 Capacity
FTE Enrollment Data
ORANGE COUNTY PUBLIC SCHOOLSSCHOOL BUILDING INFORMATION & FULL-TIME EQUIVALENT ENROLLMENT DATA
LAST 10 YEARS
Orange County Virtual Instruction 26.21 97.97 n/aO-Tec Orlando Tech 1980 n/a n/a n/a 0.80 14.82 26.71 81.14 69.15 90.98 95.15 112.49 125.13 n/aO-Tec Westside Tech 1966 n/a n/a n/a 253.96 237.01 235.28 269.58 252.33 316.53 245.66 147.76 60.11 70.48 195.13 n/aO-Tec Winter Park Tech 1953 n/a n/a n/a 50.83 63.41 46.55 49.16 48.55 68.38 17.92 26.38 23.85 42.77 124.00 n/aO-Tech Mid-Florida Tech 1963 n/a n/a n/a 82.60 73.65 114.53 116.72 79.57 181.49 244.69 139.72 168.66 156.93 192.14 n/aProject Achieve n/a n/a n/a n/a 9.50 n/aRobert Hungerford Prep. HS 1945 n/a n/a n/a 539.44 493.01 486.23 292.52 123.62 n/aTransition Center n/a n/a n/a n/a 6.27 31.58 26.08 26.90 61.14 81.98 248.73 n/aUniversal Education Ctr n/a n/a n/a n/a 18.50 40.50 38.51 32.00 27.83 34.48 27.29 n/aWinter Park Education Ctr n/a n/a n/a n/a 12.00 3.97 n/aAdolescent Therapeutic Ctr n/a n/a n/a n/a 151.42 n/aFirst Step II n/a n/a n/a n/a 32.96 28.42 18.96 18.92 70.64 59.18 96.49 95.65 75.65 78.13 75.41 n/aHome Builders Institute n/a n/a n/a n/a 21.72 15.33 17.73 18.25 23.01 15.95 11.36 n/aOrange Halfway House n/a n/a n/a n/a 29.77 26.17 20.24 n/aOrange Juvenile Detention Ctr n/a n/a n/a n/a 278.49 184.19 230.25 164.71 149.10 95.54 145.04 196.70 120.62 122.61 157.42 n/aOrlando Marine Institute #1 n/a n/a n/a n/a 67.71 63.70 67.53 76.83 68.68 61.31 87.48 74.80 28.97 47.80 51.19 n/aPace Center for Girls n/a n/a n/a n/a 61.58 60.29 70.09 71.42 61.64 66.20 65.25 76.79 46.79 57.93 51.92 n/aTotal Other Programs 4,684.37 4,693.96 4,505.08 4,487.95 3,725.12 4,277.87 4,501.11 5,107.14 5,033.57 5,057.20 5,275.10
Charter SchoolsAccess CS n/a n/a n/a n/a 86.00 88.93 99.37 101.68 n/aAcclaim Academy Orange Charter n/a n/a n/a n/a 374.93 n/aAloma High CS n/a n/a n/a n/a 101.50 351.34 446.26 419.62 406.96 464.05 506.73 n/aAspire Academy CS n/a n/a n/a n/a 43.00 78.50 105.54 108.80 n/aCentral FL Leadership Acad n/a n/a n/a n/a 82.50 123.00 158.76 180.94 184.11 n/aChancery High CS n/a n/a n/a n/a 112.42 387.26 485.66 488.38 496.32 504.42 509.53 n/aCornerstone Academy CS n/a n/a n/a n/a 691.64 735.41 837.44 895.61 923.99 n/aCornerstone Academy HS CS n/a n/a n/a n/a 169.82 191.71 221.47 305.67 358.09 n/aDavinci High CS n/a n/a n/a n/a 14.50 n/aEinstein Montessori Academy Charter n/a n/a n/a n/a 20.00 n/aHope CS n/a n/a n/a n/a 229.00 231.50 244.51 256.37 261.52 273.46 379.05 394.94 418.50 415.14 449.56 n/aImani Elem. Academy CS n/a n/a n/a n/a 109.00 n/aInnovations Middle CS n/a n/a n/a n/a 185.68 185.55 183.93 218.62 184.07 n/aKids Community College Charter n/a n/a n/a n/a 60.50 122.18 146.94 n/aLake Eola CS n/a n/a n/a n/a 224.00 221.50 219.00 218.46 218.00 218.00 217.92 218.96 217.96 218.53 218.93 n/aLegacy CS n/a n/a n/a n/a 25.52 42.50 67.11 79.26 83.74 107.68 128.26 157.77 160.70 161.16 n/aMontessori Winter Garden CS n/a n/a n/a n/a 106.00 141.00 160.47 205.68 n/aNap Ford Community CS n/a n/a n/a n/a 120.50 118.00 112.18 115.00 110.50 142.00 124.09 128.00 115.00 141.68 126.62 n/aNorthstar High CS n/a n/a n/a n/a 171.84 164.06 164.41 165.10 173.06 178.71 178.00 n/aOakland Avenue CS n/a n/a n/a n/a 682.52 580.00 578.00 541.20 516.00 506.65 505.93 502.28 522.13 524.49 529.76 n/aOasis Preparatory Academy CS n/a n/a n/a n/a 148.63 n/aOrange County Preparatory Academy n/a n/a n/a n/a 324.65Origins Montessori CS n/a n/a n/a n/a 167.93 157.46 126.48 n/aOrlando Science Elementary Charter n/a n/a n/a n/a 232.00 260.09 479.75 n/aOrlando Science MS/HS CS n/a n/a n/a n/a 104.58 244.36 414.43 487.00 489.40 506.86 546.89 n/aPassport CS n/a n/a n/a n/a 166.43 165.48 176.30 171.01 175.08 174.34 179.00 179.50 177.35 179.81 179.65 n/aPinecrest Creek Charter n/a n/a n/a n/a 121.68 226.02 212.36 n/aPinecrest Prep CS n/a n/a n/a n/a 52.44 138.50 173.77 209.39 227.11 n/aPinecrest Prep High CS n/a n/a n/a n/a 4.00 6.00 n/aPrinceton House CS n/a n/a n/a n/a 229.50 239.00 237.23 240.69 225.46 243.82 234.61 154.00 161.50 153.88 156.09 n/aProsperitas Leadership Academy n/a n/a n/a n/a 175.57 265.43 337.81 340.59 226.59 192.42 192.37 202.81 n/aRenaissance Charter School at n/a n/a n/a n/a 605.47 874.64 954.08 n/aRenaissance Charter School at n/a n/a n/a n/a 670.33 888.34 n/aRio Grande CS n/a n/a n/a n/a 142.55 148.00 151.00 152.27 153.48 204.11 179.00 201.00 n/aSheeler High CS n/a n/a n/a n/a 112.40 348.10 480.54 473.92 484.60 468.58 488.72 n/aSummit Central CS n/a n/a n/a n/a 112.23 114.51 98.50 83.91 n/aSummit CS n/a n/a n/a n/a 246.68 246.00 208.01 247.55 135.53 139.43 42.00 n/aSummit West CS n/a n/a n/a n/a 200.70 200.00 106.50 n/aSunshine High Charter n/a n/a n/a n/a 294.36 531.94 607.46 n/aUCP East CS n/a n/a n/a n/a 41.71 111.36 141.48 175.08 221.15 259.77 265.96 n/aUCP Pine Hills CS n/a n/a n/a n/a 36.37 25.93 42.46 39.56 44.80 56.01 47.30 51.85 49.83 69.27 81.74 n/aUCP T L Academy CS n/a n/a n/a n/a 5.00 9.50 12.00 17.19 17.00 15.50 28.50 63.15 25.94 n/aUCP T L High Acad CS n/a n/a n/a n/a 19.00 21.00 31.16 36.96 n/aUnited Cerebral Palsy (UCP) n/a n/a n/a n/a 152.21 159.91 161.26 153.92 114.75 121.75 124.40 135.39 165.64 231.49 277.56 n/aWestminster Academy CS n/a n/a n/a n/a 36.26 17.00 32.87 35.98 n/aWorkforce Advantage Acad CS n/a n/a n/a n/a 104.50 151.82 147.23 164.72 188.67 185.48 194.75 208.83 224.34 225.97 243.34 n/aTotal Charter Schools 3,023.22 2,965.69 2,853.44 2,672.82 3,138.19 4,319.27 6,149.98 6,401.27 7,768.18 9,672.13 11,438.62
Total Kindergarten - 12th Grade 171,239.30 173,732.52 172,794.95 171,347.88 170,120.86 171,820.11 174,720.05 178,871.15 182,460.71 185,624.68 190,379.62
Adult ProgramsBoone ACE Center n/a n/a n/a n/a 243.95 272.57 n/aColonial ACE Center n/a n/a n/a n/a 205.60 233.63 n/aDr. Phillips ACE Center n/a n/a n/a n/a 207.88 123.62 n/aEvans ACE Center n/a n/a n/a n/a 74.68 n/aJones ACE Center n/a n/a n/a n/a 17.20 13.52 n/a
130

Placed In Last Major Square 2014-15 Percent ofService (1) Renovation Footage (2) Portables Capacity (2) 2004-05 2005-06 2006-07 2007-08 2008-09 2009-10 2010-11 2011-12 2012-13 2013-14 2014-15 Capacity
FTE Enrollment Data
ORANGE COUNTY PUBLIC SCHOOLSSCHOOL BUILDING INFORMATION & FULL-TIME EQUIVALENT ENROLLMENT DATA
LAST 10 YEARS
Mid-Florida Tech ACE Center n/a n/a n/a n/a 205.90 215.69 194.89 152.35 75.13 39.30 35.10 n/aOrlando Tech ACE Center n/a n/a n/a n/a 172.23 185.98 199.02 187.78 2.39 3.93 2.64 n/aO-Tec Orlando Tech n/a n/a n/a n/a 1,120.56 1,040.12 1,137.40 1,256.65 1,346.37 1,399.41 1,547.07 1,125.57 1,484.77 1,405.15 n/aO-Tec Westside Tech n/a n/a n/a n/a 1,208.91 1,242.58 1,169.93 1,208.79 1,461.49 1,513.36 1,864.58 1,425.70 1,438.81 n/aO-Tec Winter Park Tech n/a n/a n/a n/a 709.40 735.58 815.34 816.53 903.04 1,062.71 1,219.69 813.76 1,055.70 n/aO-Tech Mid-Florida Tech n/a n/a n/a n/a 2,908.37 3,053.50 3,551.52 3,814.11 3,608.17 3,562.13 3,753.64 3,125.21 3,826.52 3,175.38 n/aTransition ACE Center n/a n/a n/a n/a 277.85 268.53 219.31 233.43 n/aWestside Tech ACE Center n/a n/a n/a n/a 95.09 122.39 116.02 85.85 109.84 16.99 48.79 n/aWinter Park ACE Center n/a n/a n/a n/a 172.61 199.80 190.73 219.41 204.44 191.51 22.49 21.51 24.82 n/aWorkforce Ed E-Learning n/a n/a n/a n/a 12.95 46.14 45.76 77.09 n/aWymore ACE Center n/a n/a n/a n/a 261.94 285.86 n/a
Total Adult Programs 7,131.10 7,200.78 7,628.94 8,154.22 8,298.51 8,465.62 8,594.83 6,571.97 7,917.15 0.00 4,580.53
Total District 178,370.40 180,933.30 180,423.89 179,502.10 178,419.37 180,285.73 183,314.88 185,443.12 190,377.86 185,624.68 194,960.15
Source: District Records
(1) Original date that the school was placed in service. This date does not reflect additions, renovations, or remodeling.(2) The square footage and capacity are for the permanent building only and do not include the portables.(3) These elementary schools include some middle school grades also.n/a Information is not available.
ES - Elementary SchoolMS - Middle SchoolHS - High SchoolS - SpecialO - Other - Any other type of schoolO-DJJ - Other - Department of Juvenile JusticeCS - Charter SchoolA - AdultTL - Transitional Learning
131

RatioRatio Instructional
(C) Students to Personnel toFiscal (A) (B) Support Instructional SchoolYear Instructional Administrative Services Total Personnel Administrators
2014-15 14,076 658 8,168 22,902 13.52 : 1 21.39 : 12013-14 13,084 986 8,277 22,347 14.18 : 1 13.27 : 12012-13 12,827 942 8,215 21,984 14.22 : 1 13.62 : 12011-12 12,747 900 8,086 21,733 14.03 : 1 14.16 : 12010-11 12,547 859 8,366 21,772 14.26 : 1 14.60 : 12009-10 12,056 850 8,443 21,349 14.25 : 1 14.18 : 12008-09 12,400 870 8,906 22,176 13.72 : 1 14.25 : 12007-08 13,184 884 9,305 23,373 13.00 : 1 14.91 : 12006-07 13,107 836 8,546 22,489 13.18 : 1 15.68 : 12005-06 12,591 810 8,202 21,603 13.80 : 1 15.54 : 1
(A) Classroom Teachers, Guidance/Psychologists, Occupational Placement Specialists, Media Specialists, Other Professional Instructional Staff
(B) Principals, Assistant Principals, Superintendent, Assistant Superintendent, Directors, Managers, Coordinators, Occupational Therapists
(C) Paraprofessionals, Bus Drivers, Monitors, Maintenance, Clerical, Etc.
Source: District Records
ORANGE COUNTY PUBLIC SCHOOLS
LAST TEN FISCAL YEARSNUMBER OF PERSONNEL
132

Fiscal Minimum Maximum AverageYear Salary Salary Salary
2014-15 38,500$ 70,750$ 45,812$ 2013-14 37,500 66,498 44,402 2012-13 37,000 68,258 44,383 2011-12 37,000 68,258 45,046 2010-11 37,000 67,470 44,898 2009-10 37,000 67,270 44,790 2008-09 37,000 66,827 44,668 2007-08 37,000 66,827 41,515 2006-07 35,895 60,001 40,4152005-06 33,547 58,236 39,161
Source: District Records
ORANGE COUNTY PUBLIC SCHOOLS
LAST TEN FISCAL YEARSTEACHER BASE SALARIES (10 MONTH)
133

June 30, 2006 June 30, 2007 June 30, 2008 June 30, 2009 June 30, 2010 June 30, 2011 June 30, 2012 June 30, 2013 June 30, 2014 June 30, 2015
Days Meals were Served - Total 180 180 224 234 214 224 226 226 228 234 Regular School Year 180 180 180 180 180 180 180 180 Summer School 44 54 34 44 46 46 48 54
Average Number of Free and Reduced Meals Served Daily 85,758 91,371 72,711 72,392 90,047 97,645 98,917 103,147 102,851 99,929 Regular School Year Summer School
Number of Free and Reduced Meals Served - Total 15,436,385 16,446,751 16,287,193 16,939,757 19,269,988 21,872,369 22,355,295 23,311,298 23,450,136 23,383,285 Regular School Year Summer School
Average Daily Subsidy Received 208,536$ 223,031$ 194,450$ 196,959$ 239,162$ 227,257$ 251,420$ 285,695$ 290,700$ 285,455$
Total Subsidy Received 37,536,532$ 40,145,529$ 43,556,745$ 46,088,463$ 51,180,718$ 50,905,645$ 56,820,936$ 64,566,993$ 66,279,614$ 66,796,493$
Average Number of Meals Served Daily 115,751 123,855 98,326 93,178 109,877 117,261 118,024 122,005 121,539 117,419 Regular School Year Summer School
Number of Meals Served 20,835,256 22,293,967 22,024,998 21,803,629 23,513,656 26,266,383 26,673,509 27,573,235 27,710,940 27,476,012 Regular School Year Summer School
Number of Full Paid Meals Served 5,398,871 5,847,216 5,737,805 4,863,872 4,243,668 4,394,014 4,318,214 4,261,937 4,260,804 4,092,727 Regular School Year Summer School
Average Daily Revenues 307,495$ 328,496$ 274,171$ 277,024$ 319,121$ 333,838$ 347,806$ 368,494$ 375,957$ 380,410$
Total Revenues 55,349,069$ 59,129,202$ 61,414,348$ 64,823,563$ 68,291,892$ 74,779,763$ 78,604,247$ 83,279,656$ 85,718,219$ 89,016,040$
Average Daily Costs 320,535$ 332,267$ 280,437$ 260,672$ 295,791$ 313,655$ 328,672$ 359,274$ 388,987$ 371,928$
Total Costs 57,696,217$ 59,808,035$ 62,817,963$ 60,997,337$ 63,299,329$ 70,258,716$ 74,279,878$ 81,195,846$ 88,689,027$ 87,031,185$
Source: District Records
Note (1): During the 2004-05 fiscal year, OCPS started serving breakfast and lunch at some of the schools open for summer school. The average dollar amounts are therefore not comparable with the prior years since the summer activity is much smaller than the normal school year.
ORANGE COUNTY PUBLIC SCHOOLSFOOD SERVICE OPERATING DATA
LAST TEN FISCAL YEARS
Fiscal Year Ended
134
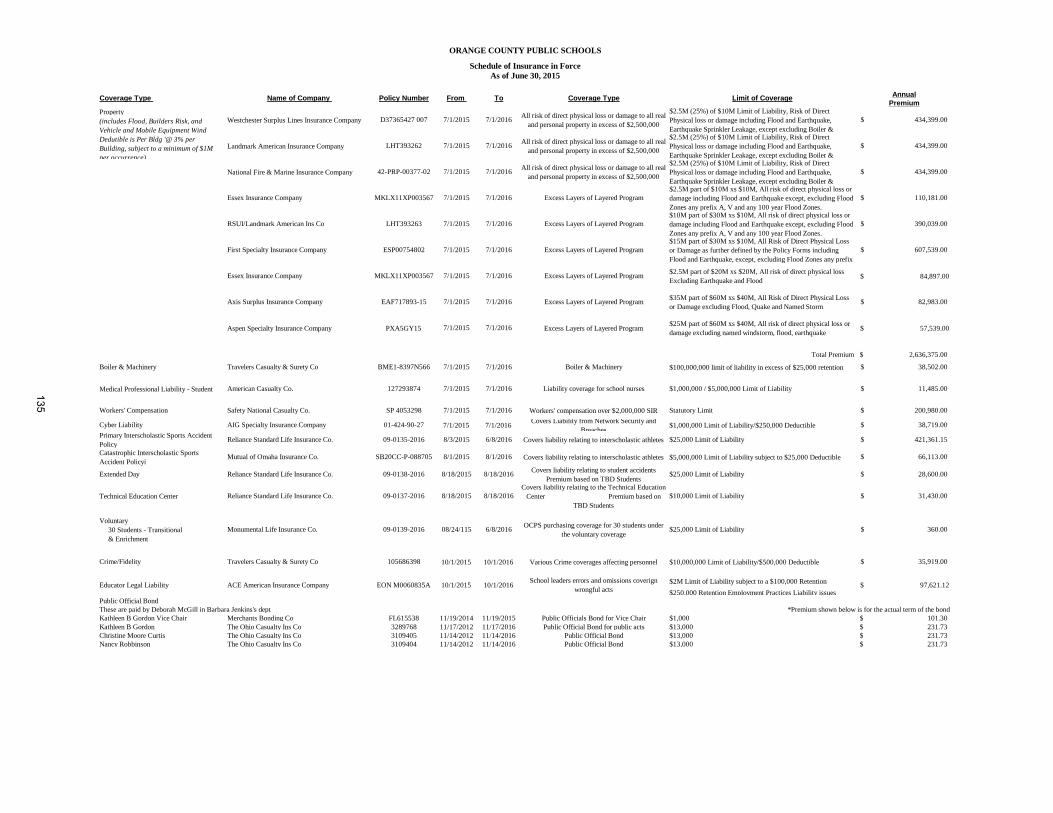
AnnualPremium
Property
Total Premium 2,636,375.00$
$2M Limit of Liability subject to a $100,000 Retention
$250,000 Retention Employment Practices Liability issuesPublic Official BondThese are paid by Deborah McGill in Barbara Jenkins's deptKathleen B Gordon Vice Chair Merchants Bonding Co FL615538 11/19/2014 11/19/2015 Public Officials Bond for Vice Chair $1,000 101.30$ Kathleen B Gordon The Ohio Casualty Ins Co 3289768 11/17/2012 11/17/2016 Public Official Bond for public acts $13,000 231.73$ Christine Moore Curtis The Ohio Casualty Ins Co 3109405 11/14/2012 11/14/2016 Public Official Bond $13,000 231.73$ Nancy Robbinson The Ohio Casualty Ins Co 3109404 11/14/2012 11/14/2016 Public Official Bond $13,000 231.73$
Educator Legal Liability ACE American Insurance Company
$10,000,000 Limit of Liability/$500,000 Deductible 35,919.00$
10/1/2016School leaders errors and omissions coverign
wrongful acts $ 97,621.12
Crime/Fidelity Travelers Casualty & Surety Co 105686398 10/1/2015 10/1/2016 Various Crime coverages affecting personnel
6/8/2016OCPS purchasing coverage for 30 students under
the voluntary coverage$25,000 Limit of Liability 360.00$
*Premium shown below is for the actual term of the bond
$25,000 Limit of Liability 28,600.00$
8/18/2016Covers liability relating to the Technical Education
Center Premium based on TBD Students
$10,000 Limit of Liability 31,430.00$
Covers liability relating to interscholastic athletes $5,000,000 Limit of Liability subject to $25,000 Deductible
Extended Day Reliance Standard Life Insurance Co. 09-0138-2016 8/18/2015 8/18/2016Covers liability relating to student accidents
Premium based on TBD Students
$1,000,000 Limit of Liability/$250,000 Deductible 38,719.00$
421,361.15$ Covers liability relating to interscholastic athletes
66,113.00$
$25,000 Limit of Liability
Cyber Liability AIG Specialty Insurance Company 01-424-90-27 7/1/2015 7/1/2016Covers Liability from Network Security and
Breaches
Workers' Compensation Safety National Casualty Co. SP 4053298 7/1/2015 7/1/2016 Workers' compensation over $2,000,000 SIR
Medical Professional Liability - Student American Casualty Co. 127293874 7/1/2015 7/1/2016 Liability coverage for school nurses
(includes Flood, Builders Risk, and Vehicle and Mobile Equipment Wind Dedutible is Per Bldg '@ 3% per Building, subject to a minimum of $1M per occurrence)
Boiler & Machinery Travelers Casualty & Surety Co BME1-8397N566 7/1/2015 7/1/2016
Axis Surplus Insurance Company EAF717893-15 7/1/2015 7/1/2016
EON M0060835A 10/1/2015
Technical Education Center Reliance Standard Life Insurance Co. 09-0137-2016 8/18/2015
Voluntary 30 Students - Transitional & Enrichment
Monumental Life Insurance Co. 09-0139-2016 08/24/115
Catastrophic Interscholastic Sports Accident Policyi
Primary Interscholastic Sports Accident Policy
Reliance Standard Life Insurance Co. 09-0135-2016 8/3/2015 6/8/2016
SB20CC-P-088705 8/1/2015 8/1/2016Mutual of Omaha Insurance Co.
$1,000,000 / $5,000,000 Limit of Liability
Statutory Limit
Boiler & Machinery $100,000,000 limit of liability in excess of $25,000 retention 38,502.00$
11,485.00$
200,980.00$
$25M part of $60M xs $40M, All risk of direct physical loss or damage excluding named windstorm, flood, earthquake
$ 57,539.00
82,983.00$
Essex Insurance Company MKLX11XP003567
Aspen Specialty Insurance Company PXA5GY15 7/1/2015 7/1/2016 Excess Layers of Layered Program
Excess Layers of Layered Program$35M part of $60M xs $40M, All Risk of Direct Physical Loss or Damage excluding Flood, Quake and Named Storm
First Specialty Insurance Company ESP00754802 7/1/2015 7/1/2016 Excess Layers of Layered Program
$ 84,897.00
$10M part of $30M xs $10M, All risk of direct physical loss or damage including Flood and Earthquake except, excluding Flood Zones any prefix A, V and any 100 year Flood Zones.
7/1/2015 7/1/2016 Excess Layers of Layered Program$2.5M part of $20M xs $20M, All risk of direct physical loss Excluding Earthquake and Flood
390,039.00$
110,181.00$
National Fire & Marine Insurance Company 42-PRP-00377-02
$15M part of $30M xs $10M, All Risk of Direct Physical Loss or Damage as further defined by the Policy Forms including Flood and Earthquake, except, excluding Flood Zones any prefix
607,539.00$
RSUI/Landmark American Ins Co LHT393263 7/1/2015 7/1/2016 Excess Layers of Layered Program
Essex Insurance Company MKLX11XP003567 7/1/2015 7/1/2016 Excess Layers of Layered Program$2.5M part of $10M xs $10M, All risk of direct physical loss or damage including Flood and Earthquake except, excluding Flood Zones any prefix A, V and any 100 year Flood Zones.
7/1/2015 7/1/2016All risk of direct physical loss or damage to all real
and personal property in excess of $2,500,000
$2.5M (25%) of $10M Limit of Liability, Risk of Direct Physical loss or damage including Flood and Earthquake, Earthquake Sprinkler Leakage, except excluding Boiler &
$2.5M (25%) of $10M Limit of Liability, Risk of Direct Physical loss or damage including Flood and Earthquake, Earthquake Sprinkler Leakage, except excluding Boiler &
434,399.00$
434,399.00$
434,399.00$
Landmark American Insurance Company LHT393262 7/1/2015 7/1/2016All risk of direct physical loss or damage to all real
and personal property in excess of $2,500,000
$2.5M (25%) of $10M Limit of Liability, Risk of Direct Physical loss or damage including Flood and Earthquake, Earthquake Sprinkler Leakage, except excluding Boiler &
Westchester Surplus Lines Insurance Company D37365427 007 7/1/2015 7/1/2016All risk of direct physical loss or damage to all real
and personal property in excess of $2,500,000
Limit of Coverage
ORANGE COUNTY PUBLIC SCHOOLS
Schedule of Insurance in ForceAs of June 30, 2015
Coverage Type Name of Company Policy Number From To Coverage Type
135

AnnualPremium
Limit of Coverage
ORANGE COUNTY PUBLIC SCHOOLS
Schedule of Insurance in ForceAs of June 30, 2015
Coverage Type Name of Company Policy Number From To Coverage Type
Pamela Gould Merchants Bonding Co FL 32646 11/20/2012 11/19/2016 Public Official Bond $13,000 217.62$ Joie W Cadle The Ohio Casualty Ins Co LSF044864 11/18/2014 11/18/2018 Public Official Bond $13,000 329.23$ Linda Kobert The Ohio Casualty Ins Co 964011306 11/18/2014 11/18/2018 Public Official Bond $13,000 329.23$ William Sublette The Ohio Casualty Ins Co LSF044866 11/18/2014 11/18/2018 Public Officials Bond for Chairman $1,000 329.23$ William Sublette The Ohio Casualty Ins Co LSF044865 11/18/2014 11/18/2018 Public Official Bond $13,000 329.23$ Daryl Flynn The Ohio Casualty Ins Co LSF044862 11/17/2014 11/18/2018 Public Official Bond $13,000 329.23$ Barbara Merkison Jenkins The Ohio Casualty Ins Co 964011279 5/15/2012 6/30/2016 Other Public Official $15,000 238.14$
Commerce & Industry Ins. Co. 003776725 5/14/2015 5/14/2016Storage Tank Liability Liability $1,000,000/$2,000,000 limit of liability 5,776.95$
House Movers Bond Hartford Fire Insurance Company 21BSBCF1910 4/6/2015 4/6/2016 Building Moving $20,000 limit of liability 140.00$
136
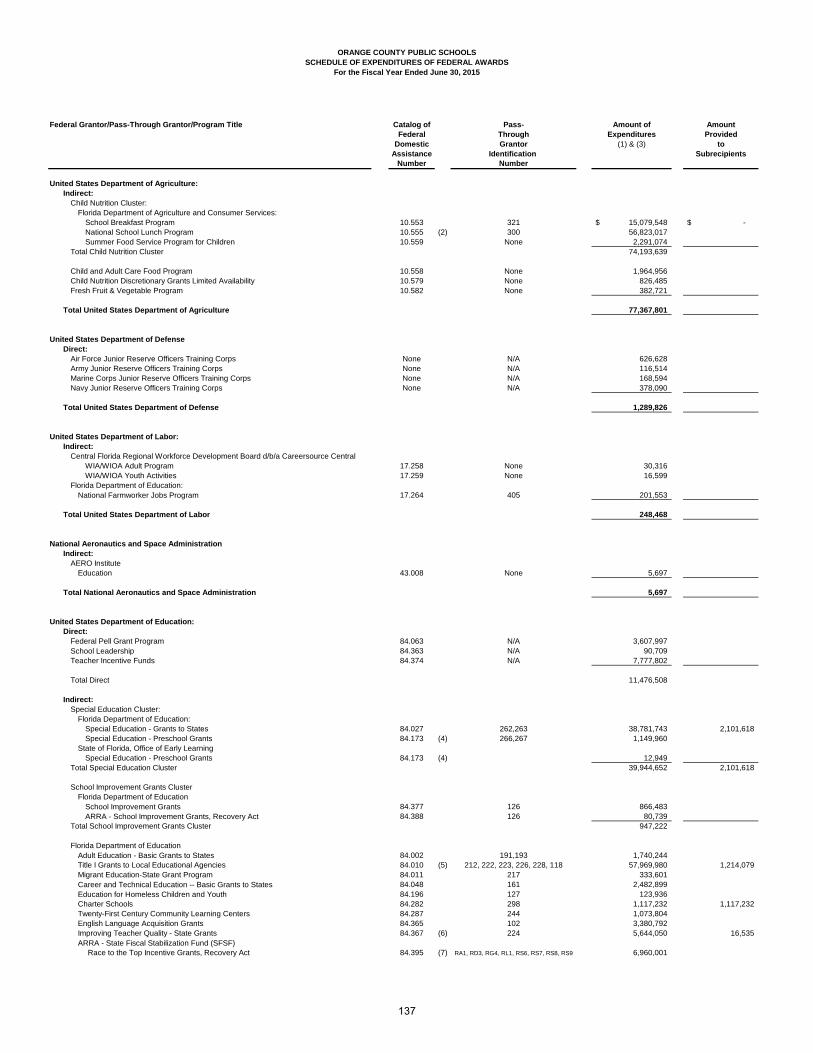
ORANGE COUNTY PUBLIC SCHOOLSSCHEDULE OF EXPENDITURES OF FEDERAL AWARDS
For the Fiscal Year Ended June 30, 2015
Federal Grantor/Pass-Through Grantor/Program Title Catalog of Pass- Amount of AmountFederal Through Expenditures Provided
Domestic Grantor (1) & (3) toAssistance Identification Subrecipients
Number Number
United States Department of Agriculture:Indirect:
Child Nutrition Cluster:Florida Department of Agriculture and Consumer Services:
School Breakfast Program 10.553 321 15,079,548$ -$ National School Lunch Program 10.555 (2) 300 56,823,017 Summer Food Service Program for Children 10.559 None 2,291,074
Total Child Nutrition Cluster 74,193,639
Child and Adult Care Food Program 10.558 None 1,964,956 Child Nutrition Discretionary Grants Limited Availability 10.579 None 826,485 Fresh Fruit & Vegetable Program 10.582 None 382,721
Total United States Department of Agriculture 77,367,801
United States Department of DefenseDirect:
Air Force Junior Reserve Officers Training Corps None N/A 626,628 Army Junior Reserve Officers Training Corps None N/A 116,514 Marine Corps Junior Reserve Officers Training Corps None N/A 168,594 Navy Junior Reserve Officers Training Corps None N/A 378,090
Total United States Department of Defense 1,289,826
United States Department of Labor:Indirect:
Central Florida Regional Workforce Development Board d/b/a Careersource CentralWIA/WIOA Adult Program 17.258 None 30,316 WIA/WIOA Youth Activities 17.259 None 16,599
Florida Department of Education: National Farmworker Jobs Program 17.264 405 201,553
Total United States Department of Labor 248,468
National Aeronautics and Space AdministrationIndirect:
AERO InstituteEducation 43.008 None 5,697
Total National Aeronautics and Space Administration 5,697
United States Department of Education:Direct:
Federal Pell Grant Program 84.063 N/A 3,607,997 School Leadership 84.363 N/A 90,709 Teacher Incentive Funds 84.374 N/A 7,777,802
Total Direct 11,476,508
Indirect:Special Education Cluster:
Florida Department of Education: Special Education - Grants to States 84.027 262,263 38,781,743 2,101,618 Special Education - Preschool Grants 84.173 (4) 266,267 1,149,960
State of Florida, Office of Early LearningSpecial Education - Preschool Grants 84.173 (4) 12,949
Total Special Education Cluster 39,944,652 2,101,618
School Improvement Grants ClusterFlorida Department of Education
School Improvement Grants 84.377 126 866,483 ARRA - School Improvement Grants, Recovery Act 84.388 126 80,739
Total School Improvement Grants Cluster 947,222
Florida Department of EducationAdult Education - Basic Grants to States 84.002 191,193 1,740,244 Title I Grants to Local Educational Agencies 84.010 (5) 212, 222, 223, 226, 228, 118 57,969,980 1,214,079 Migrant Education-State Grant Program 84.011 217 333,601 Career and Technical Education -- Basic Grants to States 84.048 161 2,482,899 Education for Homeless Children and Youth 84.196 127 123,936 Charter Schools 84.282 298 1,117,232 1,117,232 Twenty-First Century Community Learning Centers 84.287 244 1,073,804 English Language Acquisition Grants 84.365 102 3,380,792 Improving Teacher Quality - State Grants 84.367 (6) 224 5,644,050 16,535 ARRA - State Fiscal Stabilization Fund (SFSF)
Race to the Top Incentive Grants, Recovery Act 84.395 (7) RA1, RD3, RG4, RL1, RS6, RS7, RS8, RS9 6,960,001
137

ORANGE COUNTY PUBLIC SCHOOLSSCHEDULE OF EXPENDITURES OF FEDERAL AWARDS
For the Fiscal Year Ended June 30, 2015
Federal Grantor/Pass-Through Grantor/Program Title Catalog of Pass- Amount of AmountFederal Through Expenditures Provided
Domestic Grantor (1) & (3) toAssistance Identification Subrecipients
Number Number
State of Florida, Office of Early LearningTitle I Grants to Local Educational Agencies 84.010 (5) 26,578
University of Central FloridaARRA - State Fiscal Stabilization Fund (SFSF)
Race to the Top Incentive Grants, Recovery Act 84.395 (7) RG4 3,818 Mathematics and Science Partnerships 84.366 235 (254) Improving Teacher Quality - State Grants 84.367 (6) 225 23,874
Washington County School Board:ARRA - State Fiscal Stabilization Fund (SFSF)
Race to the Top Incentive Grants, Recovery Act 84.395 (7) None 17,200 Daytona State College
ARRA - State Fiscal Stabilization Fund (SFSF)
Race to the Top Incentive Grants, Recovery Act 84.395 (7) None 133,500 Old Dominion University Research Foundation
ARRA - State Fiscal Stabilization Fund (SFSF)Investing in Innovation (i3) Fund 84.411 136,799
81,168,054 2,347,846
Total Indirect 122,059,928 4,449,464
Total United States Department of Education 133,536,436 4,449,464
National Science FoundationIndirect:
Research and Development ClusterNew York University
Education and Human Resources 47.076 None 80,438
United States Department of Education:Indirect:
Research and Development ClusterFlorida State University
Education Research, Development and Dissemination 84.305 (8) None 6,165 University of Minnesota
Education Research, Development and Dissemination 84.305 (8) None 1,950
Total Research and Development Cluster 88,553
United States Department of Health and Human ServicesDirect:
Cooperative Agreements to Promote Adolescent Health through School-Based HIV/STD Prevention and School-Based Surveillance 93.079 (9) N/A 43,314
Affordable Care Act (ACA) Personal Responsibility Education Program 93.092 N/A 547,077
Total Direct 590,391
Indirect:CCDF Cluster
Early Learning Coalition of Orange CountyChild Care and Development Block Grant 93.575 912 91,999 Child Care Mandatory and Matching Funds of the Child Care and Development Fund 93.596 912 101,716
Total CCDF Cluster 193,715
University of South FloridaCooperative Agreements to Promote Adolescent Health through School-Based HIV/STD 93.079 (9) None 7,263
Prevention and School-Based SurveillanceCooperating Agreements to Support Comprehensive School Health Programs
to Prevent the Spread of HIV and Other Important Health Problems 93.938 None 90
Central Florida Regional Workforce Development Board d/b/a Workforce CentralFlorida Temporary Assistance for Needy Families 93.558 None 8,551
Catholic Charities of Central Florida, Inc,Refugee and Entrant Assistance_State Administered Programs 93.566 None 487,946
Orange County, Florida - Family ServicesHeadstart 93.600 None 68,704
Children's Home Society of FloridaHealth Care Innovation Awards (HCIA) 93.610 None 14,257
Total Indirect 780,526
Total United States Department of Health and Human Services 1,370,917
Total Expenditures of Federal Awards 213,907,698$ 4,449,464$
138
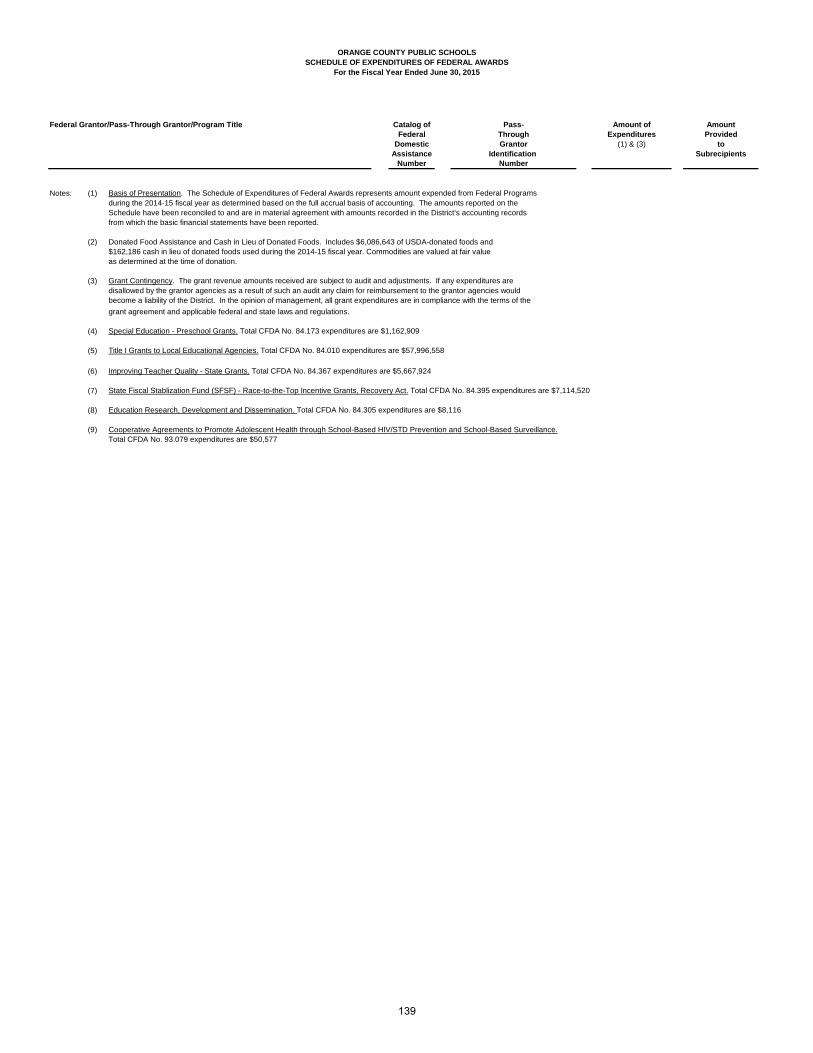
ORANGE COUNTY PUBLIC SCHOOLSSCHEDULE OF EXPENDITURES OF FEDERAL AWARDS
For the Fiscal Year Ended June 30, 2015
Federal Grantor/Pass-Through Grantor/Program Title Catalog of Pass- Amount of AmountFederal Through Expenditures Provided
Domestic Grantor (1) & (3) toAssistance Identification Subrecipients
Number Number
Notes: (1) Basis of Presentation. The Schedule of Expenditures of Federal Awards represents amount expended from Federal Programsduring the 2014-15 fiscal year as determined based on the full accrual basis of accounting. The amounts reported on theSchedule have been reconciled to and are in material agreement with amounts recorded in the District’s accounting recordsfrom which the basic financial statements have been reported.
(2) Donated Food Assistance and Cash in Lieu of Donated Foods. Includes $6,086,643 of USDA-donated foods and
as determined at the time of donation.
(3) Grant Contingency. The grant revenue amounts received are subject to audit and adjustments. If any expenditures aredisallowed by the grantor agencies as a result of such an audit any claim for reimbursement to the grantor agencies wouldbecome a liability of the District. In the opinion of management, all grant expenditures are in compliance with the terms of the
grant agreement and applicable federal and state laws and regulations.
(4) Special Education - Preschool Grants. Total CFDA No. 84.173 expenditures are $1,162,909
(5) Title I Grants to Local Educational Agencies. Total CFDA No. 84.010 expenditures are $57,996,558
(6) Improving Teacher Quality - State Grants. Total CFDA No. 84.367 expenditures are $5,667,924
(7) State Fiscal Stablization Fund (SFSF) - Race-to-the-Top Incentive Grants, Recovery Act. Total CFDA No. 84.395 expenditures are $7,114,520
(8) Education Research, Development and Dissemination. Total CFDA No. 84.305 expenditures are $8,116
(9) Cooperative Agreements to Promote Adolescent Health through School-Based HIV/STD Prevention and School-Based Surveillance.Total CFDA No. 93.079 expenditures are $50,577
$162,186 cash in lieu of donated foods used during the 2014-15 fiscal year. Commodities are valued at fair value
139

Report of Independent Auditor on Compliance for Each Major Program and on Internal Control
Over Compliance Required by OMB Circular A‐133
The Honorable Members of the School Board of Orange County Public Schools Orlando, Florida
Report on Compliance for Each Major Federal Program
We have audited Orange County Public Schools’ (the “District”) compliance with the types of compliance requirements described in the OMB Circular A-133 Compliance Supplement that could have a direct and material effect on each of the District’s major federal programs for the year ended June 30, 2015. The District’s major federal programs are identified in the summary of auditor’s results section of the accompanying schedule of findings and questioned costs.
Management’s Responsibility
Management is responsible for compliance with the requirements of laws, regulations, contracts, and grants applicable to its federal programs.
Auditor’s Responsibility
Our responsibility is to express an opinion on compliance for each of the District’s major federal programs based on our audit of the types of compliance requirements referred to above. We conducted our audit of compliance in accordance with auditing standards generally accepted in the United States of America; the standards applicable to financial audits contained in Government Auditing Standards, issued by the Comptroller General of the United States; and OMB Circular A-133, Audits of States, Local Governments, and Non-Profit Organizations. Those standards and OMB Circular A-133 require that we plan and perform the audit to obtain reasonable assurance about whether noncompliance with the types of compliance requirements referred to above that could have a direct and material effect on a major federal program occurred. An audit includes examining, on a test basis, evidence about the District’s compliance with those requirements and performing such other procedures as we considered necessary in the circumstances.
We believe that our audit provides a reasonable basis for our opinion on compliance for each major federal program. However, our audit does not provide a legal determination of the District’s compliance.
Opinion on Each Major Federal Program
In our opinion, the District, complied, in all material respects, with the types of compliance requirements referred to above that could have a direct and material effect on each of its major federal programs for the year ended June 30, 2015.
Report on Internal Control over Compliance
Management of the District is responsible for establishing and maintaining effective internal control over compliance with the types of compliance requirements referred to above. In planning and performing our audit of compliance, we considered the District’s internal control over compliance with the types of requirements that could have a direct and material effect on each major federal program to determine the auditing procedures that are appropriate in the circumstances for the purpose of expressing an opinion on compliance for each major federal program and to test and report on internal control over compliance in accordance with OMB Circular A-133, but not for the purpose of expressing an opinion on the effectiveness of internal control over compliance. Accordingly, we do not express an opinion on the effectiveness of the District’s internal control over compliance.
140

A deficiency in internal control over compliance exists when the design or operation of a control over compliance does not allow management or employees, in the normal course of performing their assigned functions, to prevent, or detect and correct, noncompliance with a type of compliance requirement of a federal program on a timely basis. A material weakness in internal control over compliance is a deficiency, or combination of deficiencies, in internal control over compliance, such that there is a reasonable possibility that material noncompliance with a type of compliance requirement of a federal program will not be prevented, or detected and corrected, on a timely basis. A significant deficiency in internal control over compliance is a deficiency, or a combination of deficiencies, in internal control over compliance with a type of compliance requirement of a federal program that is less severe than a material weakness in internal control over compliance, yet important enough to merit attention by those charged with governance.
Our consideration of internal control over compliance was for the limited purpose described in the first paragraph of this section and was not designed to identify all deficiencies in internal control over compliance that might be material weaknesses or significant deficiencies. We did not identify any deficiencies in internal control over compliance that we consider to be material weaknesses. However, material weaknesses may exist that have not been identified.
The purpose of this report on internal control over compliance is solely to describe the scope of our testing of internal control over compliance and the results of that testing based on the requirements of OMB Circular A-133. Accordingly, this report is not suitable for any other purpose.
Orlando. Florida December 7, 2015
141

ORANGE COUNTY PUBLIC SCHOOLS, FLORIDASCHEDULE OF FINDINGS AND QUESTIONED COSTSFEDERAL AWARDS PROGRAMS
YEAR ENDED JUNE 30, 2015
Type of auditor report issued:
Internal control over financial reporting:
Material weakness(es) identified? yes x no
Significant deficiency(ies) identified? yes x none reported
Noncompliance material to financial statements noted? yes x no
Internal control over major programs:
Material weakness(es) identified? yes x no
Significant deficiency(ies) identified? yes x none reported
Type of auditor report on compliance for
major federal programs:
Any audit findings disclosed that are
required to be reported in accordance with
Circular A-133 yes x no
Identification of major federal programs:
Name of Program or Cluster
Child Nutrition Cluster
Special Education Cluster (IDEA)
English Language Acquisition Grants
Improving Teacher Quality
Dollar threshold used to determine Type A programs:
Federal
Auditee qualified as low-risk auditee for federal purposes? x yes no
Federal Awards Section
$ 3,000,000
84.367
10.553-CL
84.365
84.027-CL
Part I ‐ Summary of Auditor Results
Unmodified
Unmodified
CFDA Numbers
Financial Statement Section
142

ORANGE COUNTY PUBLIC SCHOOLS, FLORIDASCHEDULE OF FINDINGS AND QUESTIONED COSTSFEDERAL AWARDS PROGRAMS
YEAR ENDED JUNE 30, 2015
Part II ‐ Schedule of Financial Statement Findings
Part III ‐ Federal Award Findings and Questioned Costs
This section identifies the significant deficiencies, material weaknesses, fraud, illegal acts, violations ofprovisions of contracts and grant agreements, and abuse related to the financial statements that are required tobe reported in accordance with Government Auditing Standards.
There were no financial statement findings required to be reported in accordance with Government AuditingStandards.
This section identifies the significant deficiencies, material weaknesses, and material instances ofnoncompliance, including questioned costs, as well as any material abuse findings, related to the audit of majorfederal programs, as required to be reported by Section 510(a) of OMB Circular A-133.
There were no findings required to be reported by Section 510(a) of OMB Circular A-133.
143

ORANGE COUNTY PUBLIC SCHOOLS, FLORIDASUMMARY SCHEDULE OF PRIOR AUDIT FINDINGS
YEAR ENDED JUNE 30, 2015
Prior Year Audit Findings:
U.S Department of Agriculture - CFDA 10.553, 10.555, 10.559 - Child Nutrition Cluster
Corrective Action: The District took corrective action to resolve the above finding during fiscal year 2015.
Statement of Condition 2014-001: Under 7 CFR 245.6a - Verification requirements, the District mustverify the current free and reduced price eligibility of households selected from a sample of applicationsthat it has approved for free and reduced price meals in accordance with the above requirements. TheDistrict utilized the Standard Sample Size, which is the lesser of 3 percent or 3,000 of the approvedapplications on file as of October 1, selected from error-prone applications.
144

Report of Independent Auditor on Internal Control over Financial Reporting and on Compliance and Other Matters Based on an Audit of Financial Statements Performed in Accordance with Government Auditing Standards
The Honorable Members of the School Board of Orange County Public Schools Orlando, Florida We have audited, in accordance with the auditing standards generally accepted in the United States of America and the standards applicable to financial audits contained in Government Auditing Standards issued by the Comptroller General of the United States, the financial statements of the governmental activities, the discretely presented component unit, each major fund, and the aggregate remaining fund information of Orange County Public Schools, Florida (the “District”) as of and for the year ended June 30, 2015, and the related notes to the financial statements, which collectively comprise the District’s basic financial statements, and have issued our report thereon dated December 7, 2015. Our report includes reference to other auditors who have audited the financial statements of the discretely presented component unit and the fiduciary funds, as described in our report on the District’s financial statements. This report does not include the results of the other auditors’ testing of internal control over financial reporting or compliance and other matters that are reported on separately by those auditors.
Internal Control Over Financial Reporting
In planning and performing our audit of the financial statements, we considered the District’s internal control over financial reporting (internal control) to determine the audit procedures that are appropriate in the circumstances for the purpose of expressing our opinions on the financial statements, but not for the purpose of expressing an opinion on the effectiveness of the District’s internal control. Accordingly, we do not express an opinion on the effectiveness of the District’s internal control.
A deficiency in internal control exists when the design or operation of a control does not allow management or employees, in the normal course of performing their assigned functions, to prevent, or detect and correct, misstatements on a timely basis. A material weakness is a deficiency, or a combination of deficiencies, in internal control, such that there is a reasonable possibility that a material misstatement of the entity’s financial statements will not be prevented, or detected and corrected on a timely basis. A significant deficiency is a deficiency, or a combination of deficiencies, in internal control that is less severe than a material weakness, yet important enough to merit attention by those charged with governance.
Our consideration of internal control was for the limited purpose described in the first paragraph of this section and was not designed to identify all deficiencies in internal control that might be material weaknesses or, significant deficiencies. Given these limitations, during our audit we did not identify any deficiencies in internal control that we consider to be material weaknesses. However, material weaknesses may exist that have not been identified.
Compliance and Other Matters
As part of obtaining reasonable assurance about whether the District’s financial statements are free from material misstatement, we performed tests of its compliance with certain provisions of laws, regulations, contracts, and grant agreements, noncompliance with which could have a direct and material effect on the determination of financial statement amounts. However, providing an opinion on compliance with those provisions was not an objective of our audit, and accordingly, we do not express such an opinion. The results of our tests disclosed no instances of noncompliance or other matters that are required to be reported under Government Auditing Standards.
145

Purpose of this Report
The purpose of this report is solely to describe the scope of our testing of internal control and compliance and the results of that testing, and not to provide an opinion on the effectiveness of the District’s internal control or on compliance. This report is an integral part of an audit performed in accordance with Government Auditing Standards in considering the District’s internal control and compliance. Accordingly, this communication is not suitable for any other purpose.
Orlando, Florida December 7, 2015
146