opus research report 14-529d91.00 wind tunnel study of …
TRANSCRIPT
Opus Research Report 14-529D91.00
Wind Tunnel Study of the Proposed Site 10 Development, Wellington
Opus Research Report 14-529D91.00
Wind Tunnel Study of
the Proposed Site 10
Development,
Wellington
© Opus International Consultants Ltd 2014
Prepared By Opus International Consultants Ltd
Neil Jamieson Opus Research
Research Leader – Aerodynamics 33 The Esplanade, Petone
PO Box 30 845, Lower Hutt 5040
New Zealand
Reviewed By Telephone:
Facsimile:
+64 4 587 0600
+64 4 587 0604
Paul Carpenter
Wind Engineering Consultant Date:
Reference:
Status:
10 February 2014
529D91.00
Final
Opus Research Report 14-529D91.00 i
529D91.00 | 10 February 2014 Opus International Consultants Ltd
Contents
1 Introduction ........................................................................................................1
1.1 District Plan Change 48 ......................................................................................................... 1
2 Description of the Site, Area and Development .................................................. 3
3 Wind Tunnel Test Procedures ............................................................................ 6
4 Flow Visualisation Tests ..................................................................................... 7
4.1 Bran Tests – Northerly Winds.............................................................................................. 7
4.2 Bran Tests – Southerly Winds .............................................................................................. 7
5 Wind Speed Measurements ............................................................................... 12
6 Frequency of Occurrence ..................................................................................14
7 Discussion of Results ........................................................................................16
7.1 Existing Local Wind Environment ......................................................................................16
7.2 Hot-Film Wind Speed Measurements ................................................................................16
7.3 Frequency of Occurrence Data ............................................................................................ 17
7.4 Overall Assessment of Building Design ............................................................................. 20
7.5 Investigation of Different Design Configurations ............................................................. 20
8 Conclusions ...................................................................................................... 22
Appendix A: Wind Effects On People ........................................................................ 24
Appendix B: Wellington City District Plan ................................................................ 27
Appendix C: Wellington City Wind Climate .............................................................. 28
Appendix D: Wind Tunnel and Boundary Layer ....................................................... 32
Appendix E: Bran Flake Flow Visualisation .............................................................. 33
Appendix F: Complete Listing of Calculated Gust Wind Speeds ................................ 36
Appendix G: Complete Listing of Frequency of Occurrence ...................................... 37
References ............................................................................................................... 39
Opus Research Report 14- 529D91.00 1
529D91.00 | 10 February 2014 Opus International Consultants Ltd
CLIENT Site 10 Redevelopment Limited Partnership
c/- Willis Bond and Co
P.O Box 24 137
Wellington
CONTACT Rosalind Luxford
ARCHITECTS Athfield Architects
P.O Box 3364
Wellington
CONTACT Andre Bishop
1 Introduction
This report describes the methodology and results of an environmental wind tunnel study of
pedestrian level wind conditions around a development proposed for Site 10 on the waterfront in
central Wellington. The proposal is for a 6-storey building around 24m high on a site that is
currently vacant.
The aim of this study is to establish the extent and magnitude of the effects of the proposed
development on wind conditions experienced by pedestrians in its vicinity. This investigation is
intended for the purpose of obtaining resource consent and to satisfy the reporting requirements of
the Wellington City District Plan provisions concerning wind effects. This wind tunnel study has
been conducted under the wind rules contained in District Plan Change 48 (DPC 48) to the
Wellington City District Plan.
Wind tunnel testing was carried out using the existing Opus Research 1:264 scale model of
Wellington, updated to reflect buildings that currently exist or are under construction. A scale
model of the development was built from plans provided by Athfield Architects. The level of detail
on this model was consistent with design features expected to have a potential impact on wind
conditions.
Flow visualisation tests, using bran flakes, were performed for the four wind directions 170°, 210°,
320°, and 360°, these being representative of the prevailing northerly and southerly wind
directions in Wellington. These tests give a qualitative comparison of the degree of windiness in
pedestrian areas between the existing situation and the proposed development. The wind flow
patterns identified were used as an aid in selecting locations for wind speed measurements that
were made with a hot-film anemometer. These wind speed measurements were made for the same
four wind directions listed above and for four additional directions of 150°, 190°, 340°, and 020° to
allow finer resolution of the effect of direction. Initial test configurations included the existing
situation and the proposed development.
1.1 District Plan Change 48
District Plan Change 48 included changes to the wind rules. These changes did not require
significant changes to the wind tunnel testing methodology and procedures. Rather they
represented significant changes to the way that the measured wind speed data is processed and
Opus Research Report 14- 529D91.00 2
529D91.00 | 10 February 2014 Opus International Consultants Ltd
presented. The intention of the changes was not to make it more difficult to meet the criteria
contained in the District Plan, but to present the information in a format that is more readily
understandable to Wellington City Council planners and other lay people involved in the resource
consent process. The aim was that an assessment of the wind effects under DPC 48 would form the
same conclusions as an assessment under the wind rules that have been in place largely unchanged
for over 20 years.
The changes to the wind rules in DPC 48 involved the retention of a gust wind speed criteria as a
means to describe and specify a safety criteria. They also incorporated a “frequency of occurrence”
approach to define acceptable levels of comfort and also to define acceptable changes in wind
conditions that can occur with a proposed new building or redevelopment of an existing building.
Opus Research Report 14- 529D91.00 3
529D91.00 | 10 February 2014 Opus International Consultants Ltd
2 Description of the Site, Area and Development
Site 10, as it is referred to, is an approximately rectangular site located immediately to the east of
Waterloo Quay, on the section of the Wellington waterfront between Bunny and Whitmore Streets.
Wellington Harbour is a very short distance to the east. Site 10 vacant and is currently used for
parking.
There are relatively few buildings in this area of the Wellington waterfront, and these are a mix of
older historic buildings and newer developments, such as the Meridian Building to the immediate
south of Sites 8 and 9, and the BNZ building further along Waterloo Quay to the north. Much of the
area remains open space, some of which is used for parking, some encompasses the wharves and
jetties, and some comprises flat open paved areas that are open to the public. Across Waterloo
Quay to the west is the central Wellington business district, which is made up of a generally
compact grouping of medium-rise and high rise buildings. However, there are two significant
largely open areas across Waterloo Quay from the site, these being the space in front of Wellington
Railway Station, and the space associated with the Z service station.
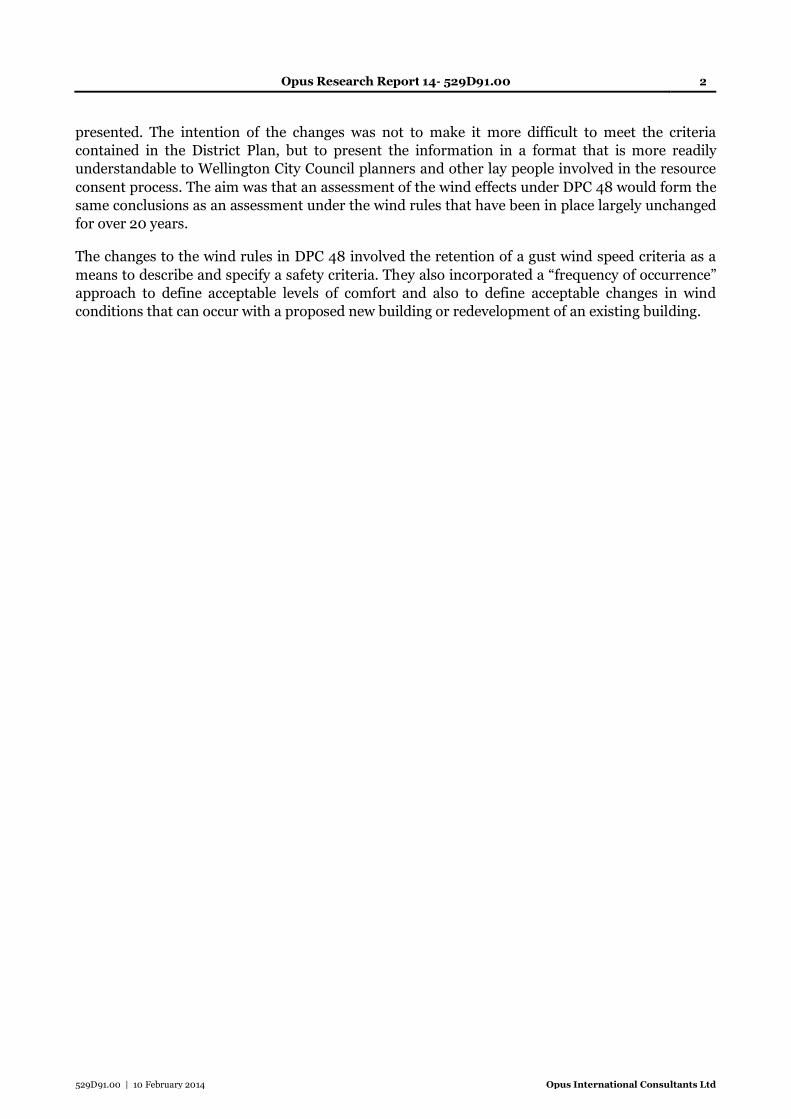
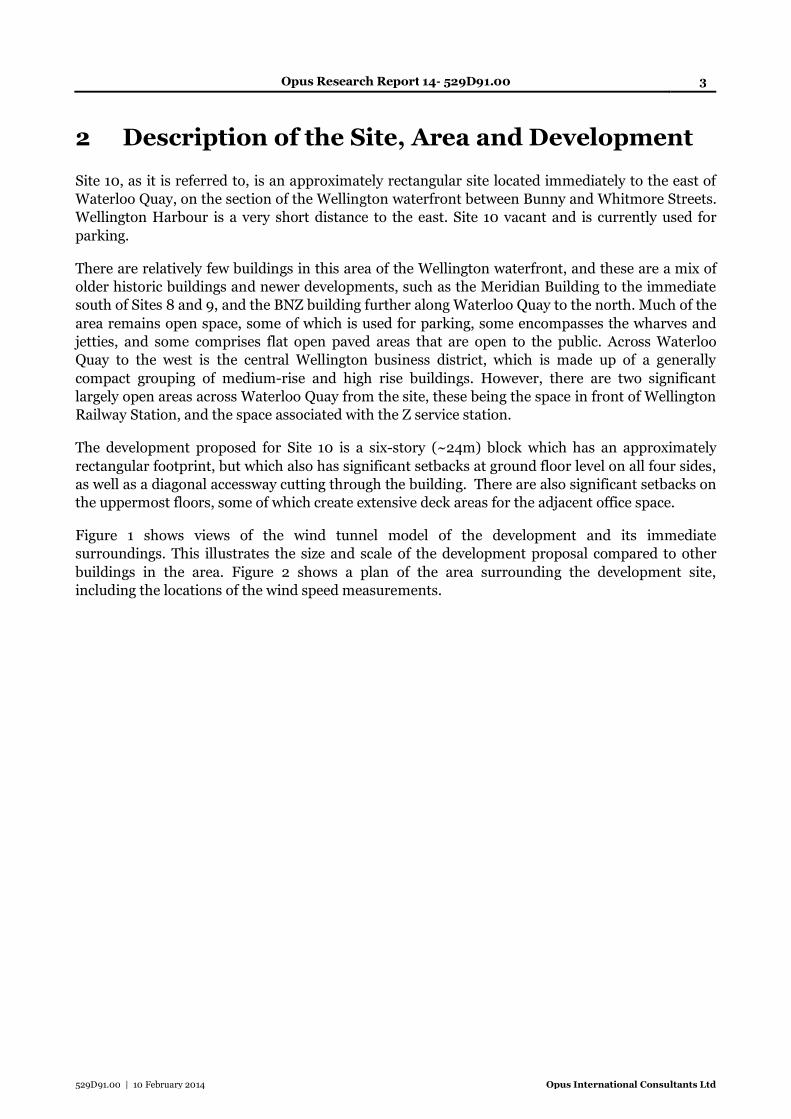
The development proposed for Site 10 is a six-story (~24m) block which has an approximately
rectangular footprint, but which also has significant setbacks at ground floor level on all four sides,
as well as a diagonal accessway cutting through the building. There are also significant setbacks on
the uppermost floors, some of which create extensive deck areas for the adjacent office space.
Figure 1 shows views of the wind tunnel model of the development and its immediate
surroundings. This illustrates the size and scale of the development proposal compared to other
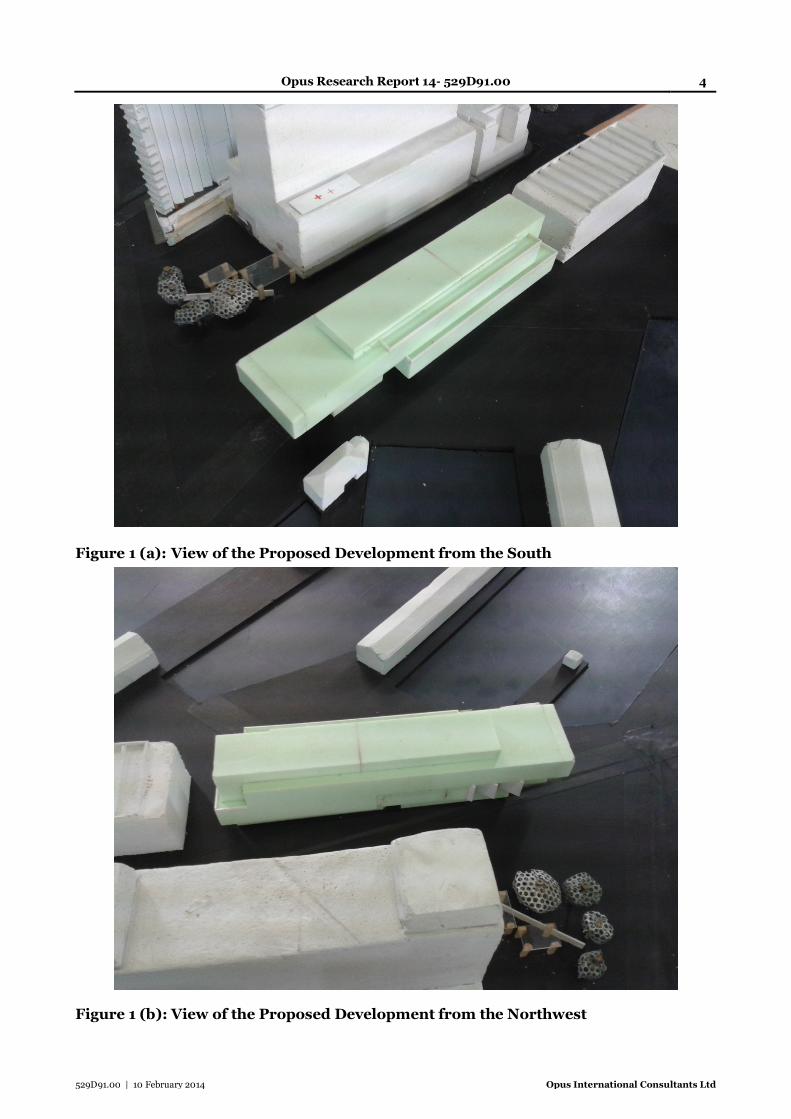
buildings in the area. Figure 2 shows a plan of the area surrounding the development site,
including the locations of the wind speed measurements.
Opus Research Report 14- 529D91.00 4
529D91.00 | 10 February 2014 Opus International Consultants Ltd
Figure 1 (a): View of the Proposed Development from the South
Figure 1 (b): View of the Proposed Development from the Northwest
Opus Research Report 14- 529D91.00 5
529D91.00 | 10 February 2014 Opus International Consultants Ltd
Figure 2: The development site and the surrounding area (includes the locations
of the wind speed measurements, (aerial image © Google, 2014)
Note: The footprint of the building is shown in red, and the ground floor outline is shown in
yellow.
Opus Research Report 14- 529D91.00 6
529D91.00 | 10 February 2014 Opus International Consultants Ltd
3 Wind Tunnel Test Procedures
Wind tunnel tests were performed in the Opus Research wind tunnel, using a 1:264 scale model of
the proposed development and the surrounding area of Wellington. The model of the proposed
development was positioned at the centre of the wind tunnel turntable, with the surrounding area
modelled to a full-scale radius of approximately 300-400m. The wind tunnel boundary layer was
set up to reproduce conditions for terrain category 3, as defined in Appendix D, for all the wind
directions. Two methods of testing were employed:
(1) flow visualisation using bran flakes; and
(2) wind speed measurements using a hot film anemometer.
The flow visualisation method provides a means of quickly identifying the areas of highest relative
wind speed on the surface of the model. This involves sprinkling a thin layer of small bran flakes
on the model surface and then running the wind tunnel at increasing speeds. A camera mounted
directly above the model is used to record the erosion patterns as the test proceeds. The areas
cleared first are assumed to be the windiest. Details of the test method are given in Appendix E.
Flow visualisation tests were carried out for the four wind directions, 170°, 210°, 320° and 360°,
which are representative of the prevailing wind directions for Wellington City (refer Appendix C).
These were carried out for the existing situation and the proposed development.
Wind speed measurements made with a hot-film anemometer involve measuring the ratio of the
wind speeds at a point on the model (at a scale height of 2 metres) to a reference wind speed (at a
scale height of 150 metres). Using these measurements and relating them to full-scale
meteorological wind data, it is possible to estimate the wind conditions that will be experienced at a
particular point and thus classify the wind performance of the area (refer Appendix A). The wind
speed measurements were made using a hot-film anemometer for the eight wind directions 150°,
170°, 190°, 210°, 320°, 340°, 360° and 020°. These measurements were carried out for the existing
situation and the proposed development.
The measured wind speed data is processed in two different ways:
(1) The mean wind speed and the corresponding standard deviation in the wind speed are
combined to provide a “calculated gust speed”. This is a measure of the overall windiness of a
location, including the influence of the mean wind speed, turbulence and gusts. The
calculated gust speed is therefore not simply a measure of the speed of a single wind gust.
The calculated gust speed, Vc, is defined as: Vc = Vmean + 3.7Vrms
where Vmean is the maximum annual hourly mean wind speed, and Vrms is the standard
deviation corresponding to this mean speed. The calculated gust speed measurements are
compatible with the Safety Criteria for wind speeds specified in the Wellington City District
Plan (refer Appendix B).
(2) The mean wind speeds for each location for each wind direction are divided by the directional
mean reference wind speed to provide a mean velocity ratio. These are then combined with
the Wellington City wind climate data listed in Appendix C to calculate the hours of
occurrence for which mean wind speeds of 2.5m/s (moderate winds) and 3.5m/s (strong
winds) are equalled or exceeded in a year.
Opus Research Report 14- 529D91.00 7
529D91.00 | 10 February 2014 Opus International Consultants Ltd
4 Flow Visualisation Tests
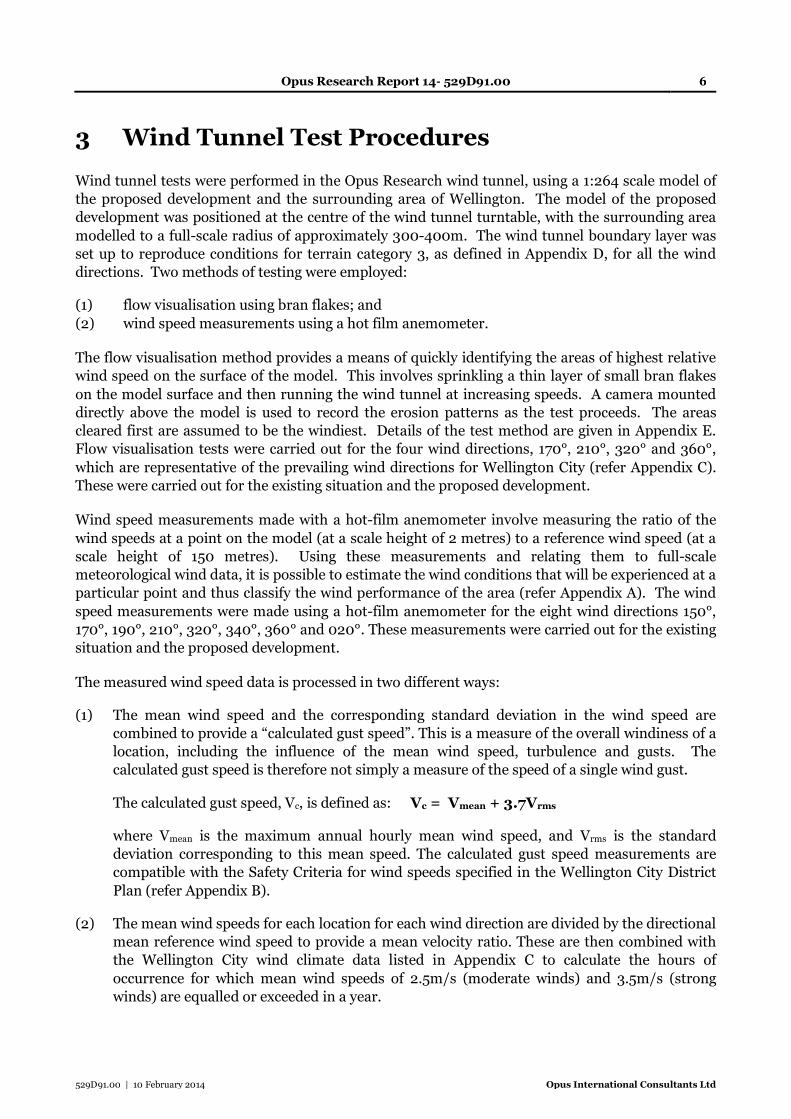
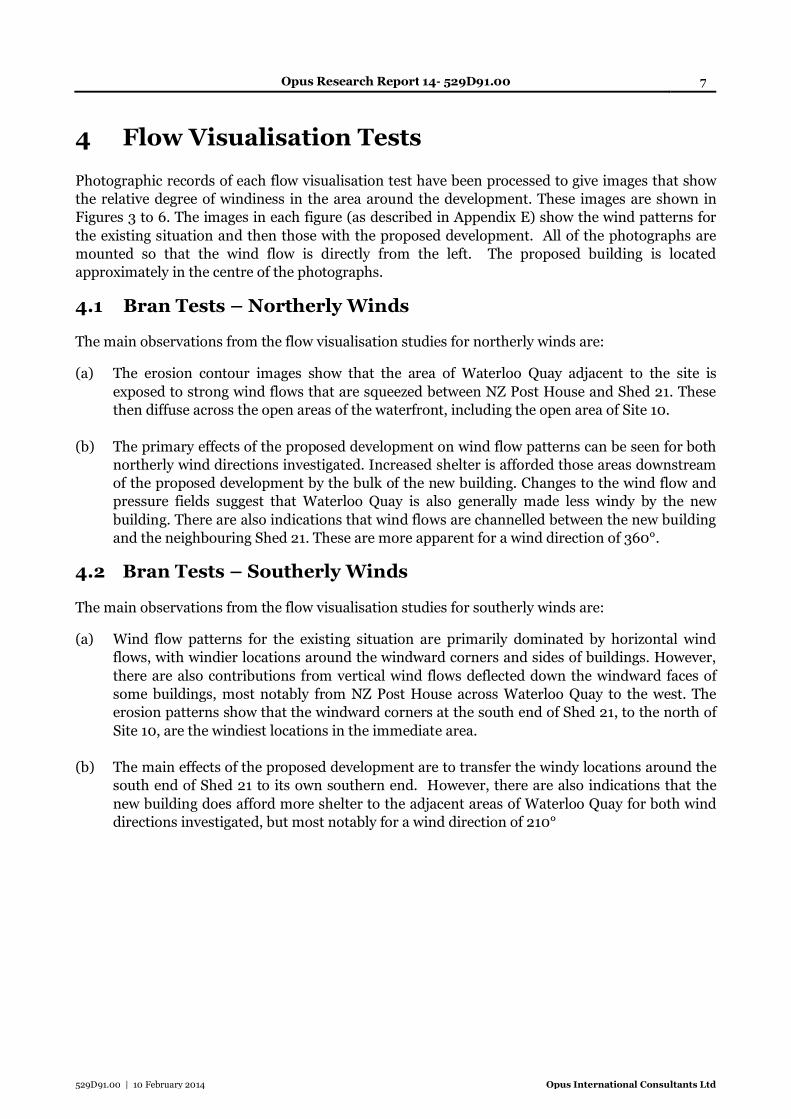
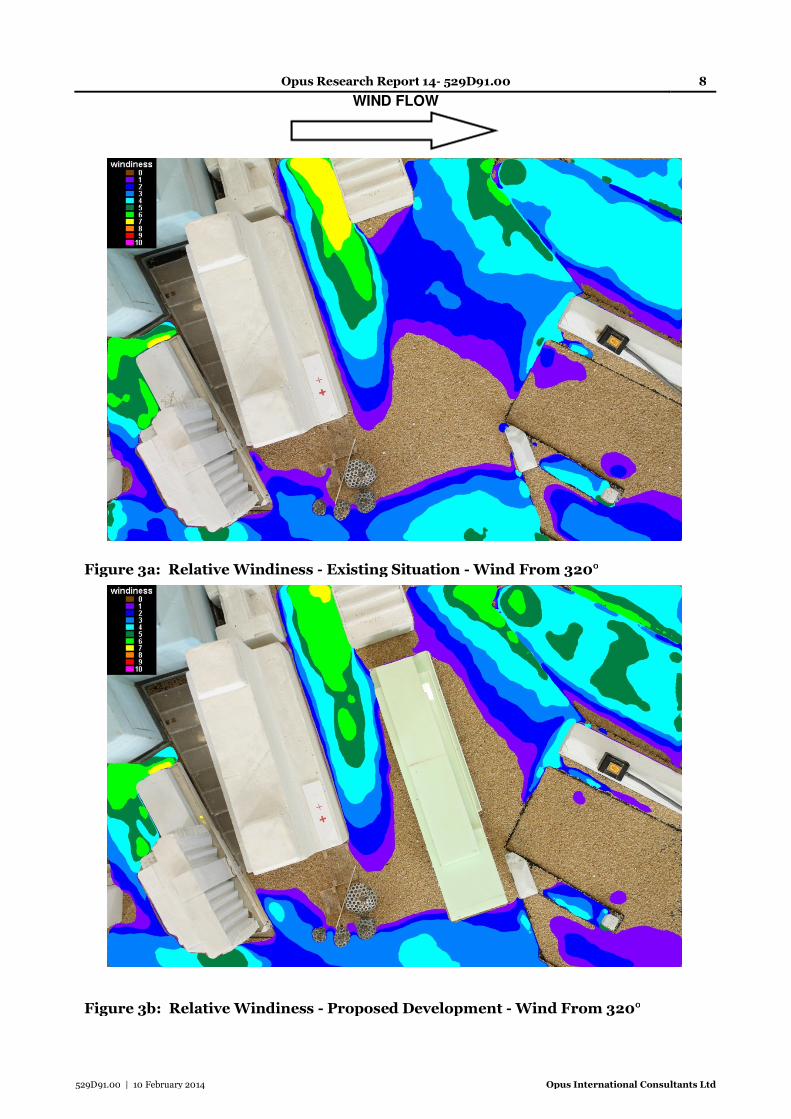
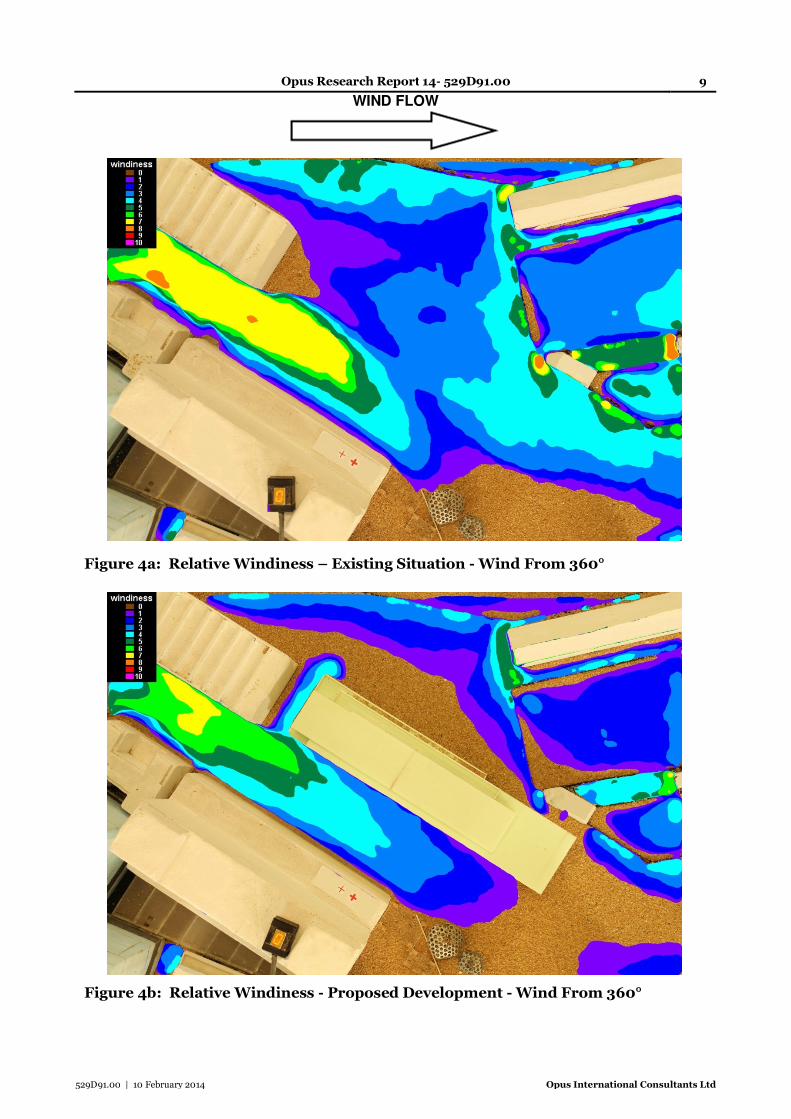
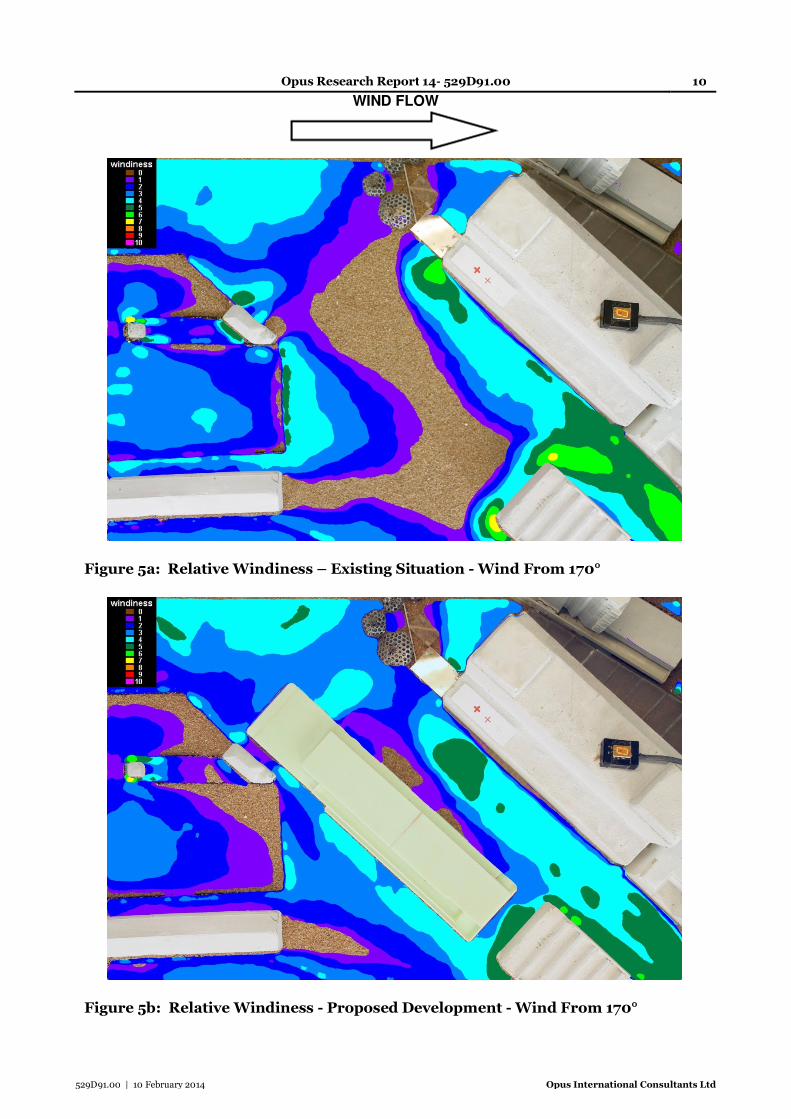
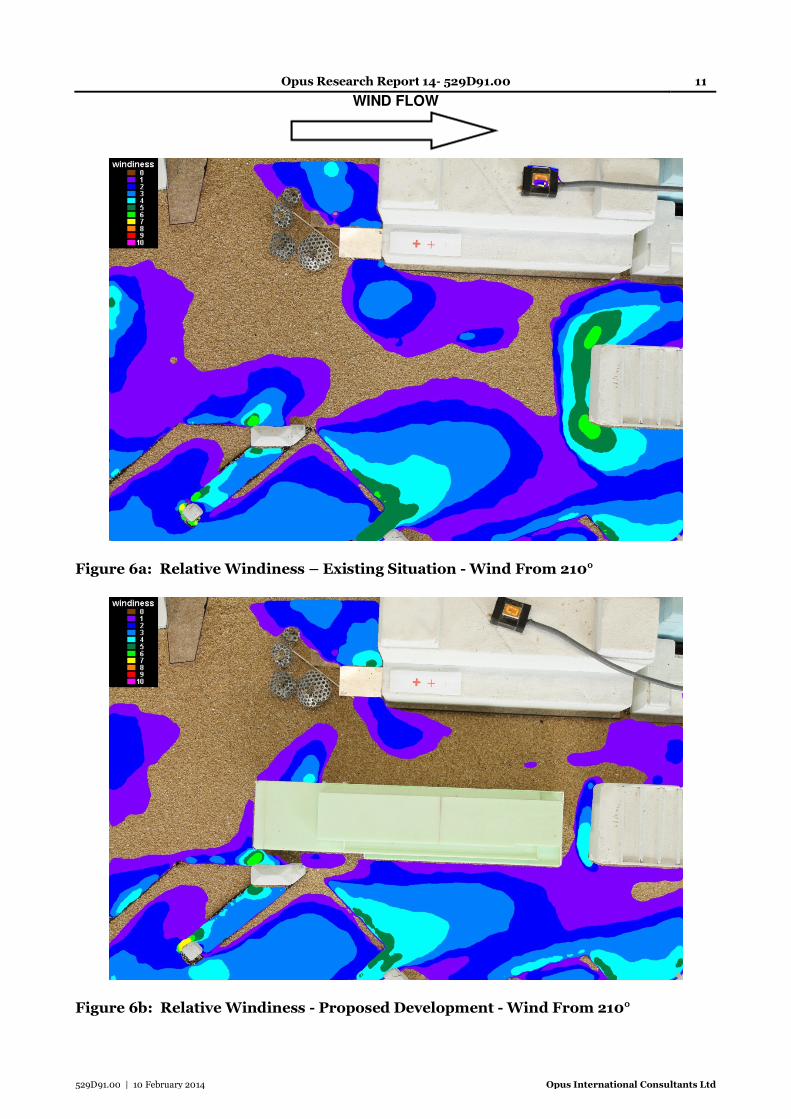
Photographic records of each flow visualisation test have been processed to give images that show
the relative degree of windiness in the area around the development. These images are shown in
Figures 3 to 6. The images in each figure (as described in Appendix E) show the wind patterns for
the existing situation and then those with the proposed development. All of the photographs are
mounted so that the wind flow is directly from the left. The proposed building is located
approximately in the centre of the photographs.
4.1 Bran Tests – Northerly Winds
The main observations from the flow visualisation studies for northerly winds are:
(a) The erosion contour images show that the area of Waterloo Quay adjacent to the site is
exposed to strong wind flows that are squeezed between NZ Post House and Shed 21. These
then diffuse across the open areas of the waterfront, including the open area of Site 10.
(b) The primary effects of the proposed development on wind flow patterns can be seen for both
northerly wind directions investigated. Increased shelter is afforded those areas downstream
of the proposed development by the bulk of the new building. Changes to the wind flow and
pressure fields suggest that Waterloo Quay is also generally made less windy by the new
building. There are also indications that wind flows are channelled between the new building
and the neighbouring Shed 21. These are more apparent for a wind direction of 360°.
4.2 Bran Tests – Southerly Winds
The main observations from the flow visualisation studies for southerly winds are:
(a) Wind flow patterns for the existing situation are primarily dominated by horizontal wind
flows, with windier locations around the windward corners and sides of buildings. However,
there are also contributions from vertical wind flows deflected down the windward faces of
some buildings, most notably from NZ Post House across Waterloo Quay to the west. The
erosion patterns show that the windward corners at the south end of Shed 21, to the north of
Site 10, are the windiest locations in the immediate area.
(b) The main effects of the proposed development are to transfer the windy locations around the
south end of Shed 21 to its own southern end. However, there are also indications that the
new building does afford more shelter to the adjacent areas of Waterloo Quay for both wind
directions investigated, but most notably for a wind direction of 210°
Opus Research Report 14- 529D91.00 8
WIND FLOW
529D91.00 | 10 February 2014 Opus International Consultants Ltd
Figure 3a: Relative Windiness - Existing Situation - Wind From 320°
Figure 3b: Relative Windiness - Proposed Development - Wind From 320°
Opus Research Report 14- 529D91.00 9
WIND FLOW
529D91.00 | 10 February 2014 Opus International Consultants Ltd
Figure 4a: Relative Windiness – Existing Situation - Wind From 360°
Figure 4b: Relative Windiness - Proposed Development - Wind From 360°
Opus Research Report 14- 529D91.00 10
WIND FLOW
529D91.00 | 10 February 2014 Opus International Consultants Ltd
Figure 5a: Relative Windiness – Existing Situation - Wind From 170°
Figure 5b: Relative Windiness - Proposed Development - Wind From 170°
Opus Research Report 14- 529D91.00 11
WIND FLOW
529D91.00 | 10 February 2014 Opus International Consultants Ltd
Figure 6a: Relative Windiness – Existing Situation - Wind From 210°
Figure 6b: Relative Windiness - Proposed Development - Wind From 210°
Opus Research Report 14- 529D91.00 12
529D91.00 | 10 February 2014 Opus International Consultants Ltd
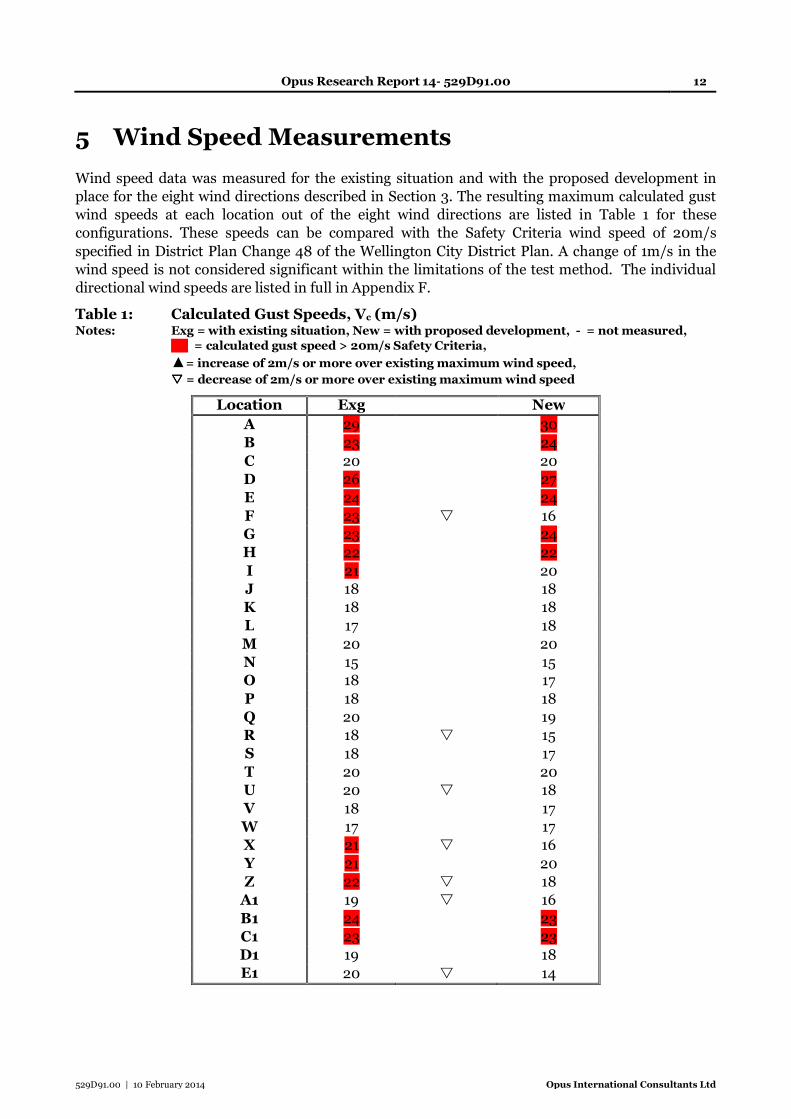
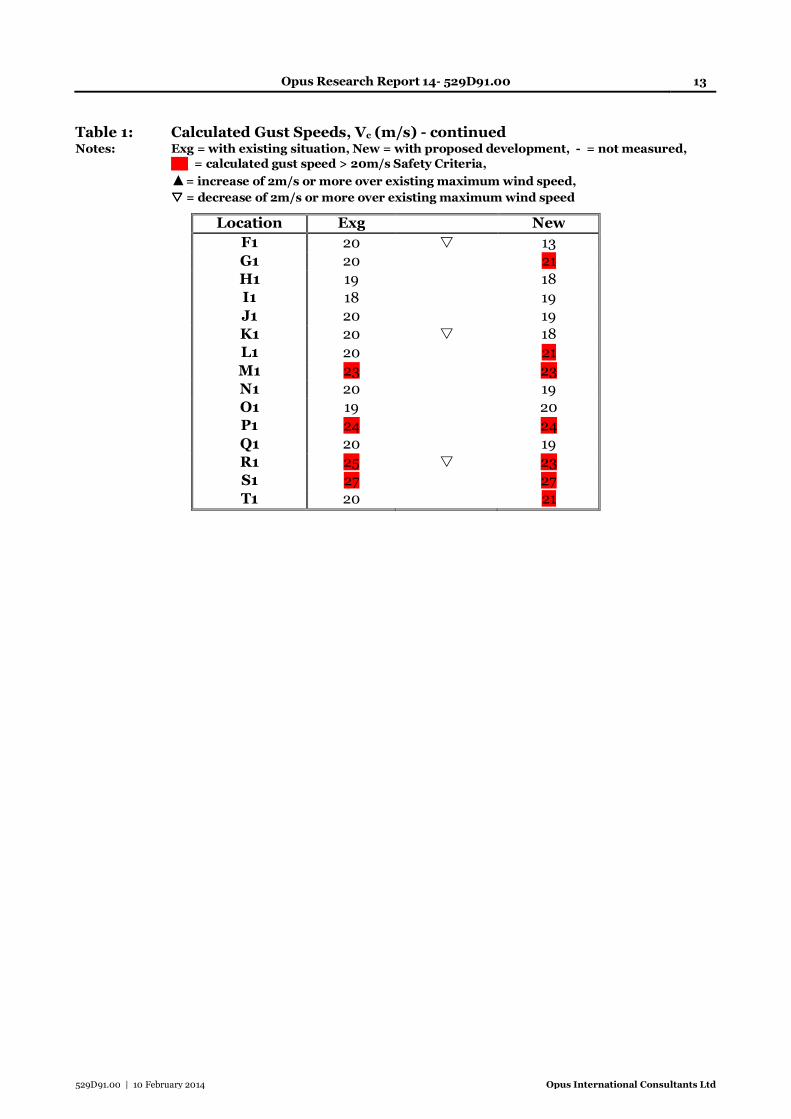
5 Wind Speed Measurements
Wind speed data was measured for the existing situation and with the proposed development in
place for the eight wind directions described in Section 3. The resulting maximum calculated gust
wind speeds at each location out of the eight wind directions are listed in Table 1 for these
configurations. These speeds can be compared with the Safety Criteria wind speed of 20m/s
specified in District Plan Change 48 of the Wellington City District Plan. A change of 1m/s in the
wind speed is not considered significant within the limitations of the test method. The individual
directional wind speeds are listed in full in Appendix F.
Table 1: Calculated Gust Speeds, Vc (m/s) Notes: Exg = with existing situation, New = with proposed development, - = not measured,
__ = calculated gust speed > 20m/s Safety Criteria,
▲= increase of 2m/s or more over existing maximum wind speed,
���� = decrease of 2m/s or more over existing maximum wind speed
Location Exg New
A 29 30
B 23 24
C 20 20
D 26 27
E 24 24
F 23 � 16
G 23 24
H 22 22
I 21 20
J 18 18
K 18 18
L 17 18
M 20 20
N 15 15
O 18 17
P 18 18
Q 20 19
R 18 � 15
S 18 17
T 20 20
U 20 � 18
V 18 17
W 17 17
X 21 � 16
Y 21 20
Z 22 � 18
A1 19 � 16
B1 24 23
C1 23 23
D1 19 18
E1 20 � 14
Opus Research Report 14- 529D91.00 13
529D91.00 | 10 February 2014 Opus International Consultants Ltd
Table 1: Calculated Gust Speeds, Vc (m/s) - continued Notes: Exg = with existing situation, New = with proposed development, - = not measured,
__ = calculated gust speed > 20m/s Safety Criteria,
▲= increase of 2m/s or more over existing maximum wind speed,
���� = decrease of 2m/s or more over existing maximum wind speed
Location Exg New
F1 20 � 13
G1 20 21
H1 19 18
I1 18 19
J1 20 19
K1 20 � 18
L1 20 21
M1 23 23
N1 20 19
O1 19 20
P1 24 24
Q1 20 19
R1 25 � 23
S1 27 27
T1 20 21
Opus Research Report 14- 529D91.00 14
529D91.00 | 10 February 2014 Opus International Consultants Ltd
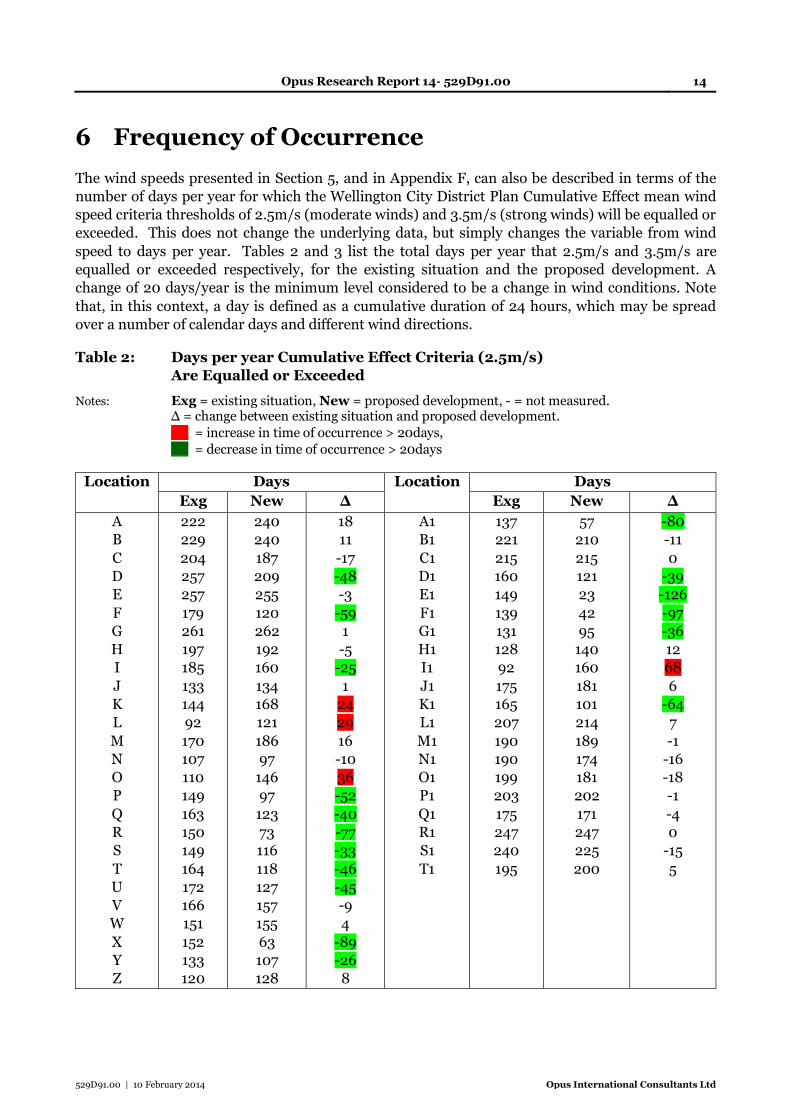
6 Frequency of Occurrence
The wind speeds presented in Section 5, and in Appendix F, can also be described in terms of the
number of days per year for which the Wellington City District Plan Cumulative Effect mean wind
speed criteria thresholds of 2.5m/s (moderate winds) and 3.5m/s (strong winds) will be equalled or
exceeded. This does not change the underlying data, but simply changes the variable from wind
speed to days per year. Tables 2 and 3 list the total days per year that 2.5m/s and 3.5m/s are
equalled or exceeded respectively, for the existing situation and the proposed development. A
change of 20 days/year is the minimum level considered to be a change in wind conditions. Note
that, in this context, a day is defined as a cumulative duration of 24 hours, which may be spread
over a number of calendar days and different wind directions.
Table 2: Days per year Cumulative Effect Criteria (2.5m/s)
Are Equalled or Exceeded
Notes: Exg = existing situation, New = proposed development, - = not measured. ∆ = change between existing situation and proposed development.
__ = increase in time of occurrence > 20days,
__ = decrease in time of occurrence > 20days
Location Days Location Days
Exg New ∆ Exg New ∆
A
B
C
D
E
F
G
H
I
J
K
L
M
N
O
P
Q
R
S
T
U
V
W
X
Y
Z
222
229
204
257
257
179
261
197
185
133
144
92
170
107
110
149
163
150
149
164
172
166
151
152
133
120
240
240
187
209
255
120
262
192
160
134
168
121
186
97
146
97
123
73
116
118
127
157
155
63
107
128
18
11
-17
-48
-3
-59
1
-5
-25
1
24
29
16
-10
36
-52
-40
-77
-33
-46
-45
-9
4
-89
-26
8
A1
B1
C1
D1
E1
F1
G1
H1
I1
J1
K1
L1
M1
N1
O1
P1
Q1
R1
S1
T1
137
221
215
160
149
139
131
128
92
175
165
207
190
190
199
203
175
247
240
195
57
210
215
121
23
42
95
140
160
181
101
214
189
174
181
202
171
247
225
200
-80
-11
0
-39
-126
-97
-36
12
68
6
-64
7
-1
-16
-18
-1
-4
0
-15
5
Opus Research Report 14- 529D91.00 15
529D91.00 | 10 February 2014 Opus International Consultants Ltd
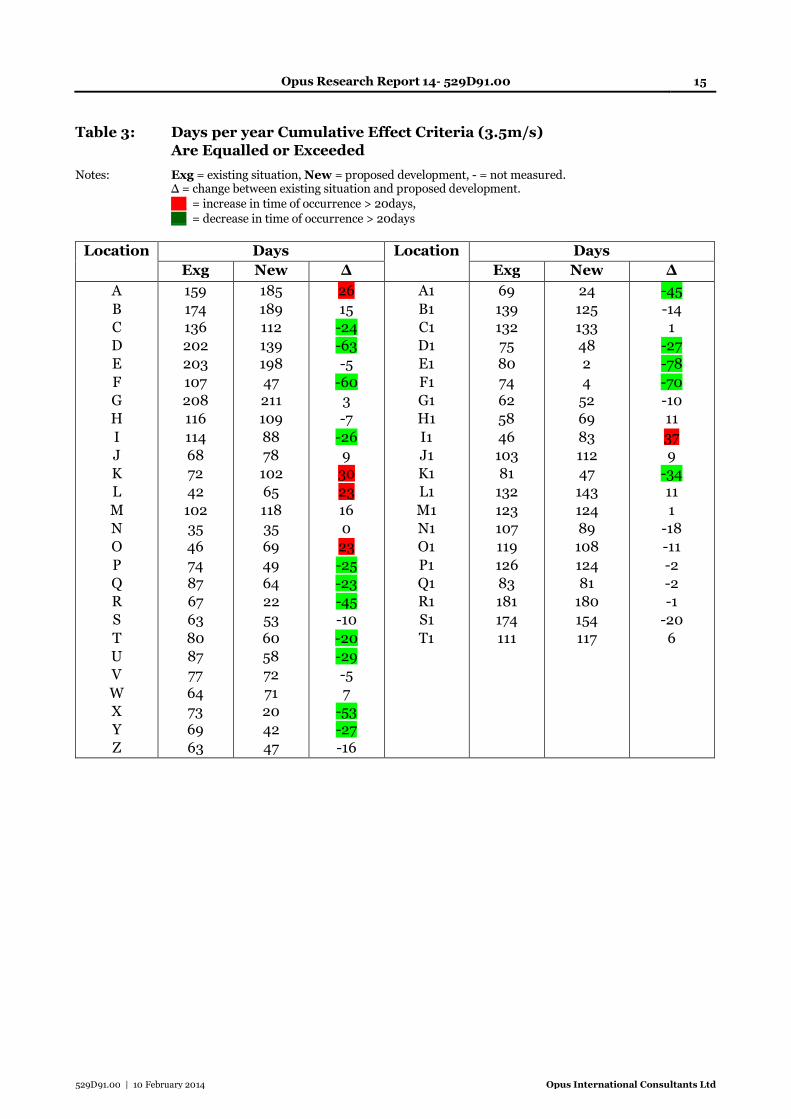
Table 3: Days per year Cumulative Effect Criteria (3.5m/s)
Are Equalled or Exceeded
Notes: Exg = existing situation, New = proposed development, - = not measured. ∆ = change between existing situation and proposed development.
__ = increase in time of occurrence > 20days,
__ = decrease in time of occurrence > 20days
Location Days Location Days
Exg New ∆ Exg New ∆
A
B
C
D
E
F
G
H
I
J
K
L
M
N
O
P
Q
R
S
T
U
V
W
X
Y
Z
159
174
136
202
203
107
208
116
114
68
72
42
102
35
46
74
87
67
63
80
87
77
64
73
69
63
185
189
112
139
198
47
211
109
88
78
102
65
118
35
69
49
64
22
53
60
58
72
71
20
42
47
26
15
-24
-63
-5
-60
3
-7
-26
9
30
23
16
0
23
-25
-23
-45
-10
-20
-29
-5
7
-53
-27
-16
A1
B1
C1
D1
E1
F1
G1
H1
I1
J1
K1
L1
M1
N1
O1
P1
Q1
R1
S1
T1
69
139
132
75
80
74
62
58
46
103
81
132
123
107
119
126
83
181
174
111
24
125
133
48
2
4
52
69
83
112
47
143
124
89
108
124
81
180
154
117
-45
-14
1
-27
-78
-70
-10
11
37
9
-34
11
1
-18
-11
-2
-2
-1
-20
6
Opus Research Report 14- 529D91.00 16
529D91.00 | 10 February 2014 Opus International Consultants Ltd
7 Discussion of Results
7.1 Existing Local Wind Environment
This area of the waterfront around the development site is a windy one in the context of the
Wellington central city area. Existing gust wind speeds are well over 20m/s at many locations in
both northerly and southerly winds. This is primarily due to the degree of exposure that the area
has to the prevailing winds, and the resulting strong horizontal wind flows, with only scattered low-
rise and medium-rise buildings to provide direct shelter. Consequently, existing wind speeds range
from extremely high to very low depending on the degree of shelter that is afforded to different
locations. The more sheltered areas are mostly localised areas downwind of buildings. Windier
regions mostly occur around the windward corners and sides of the more exposed buildings, at the
intersections of streets and in large open areas.
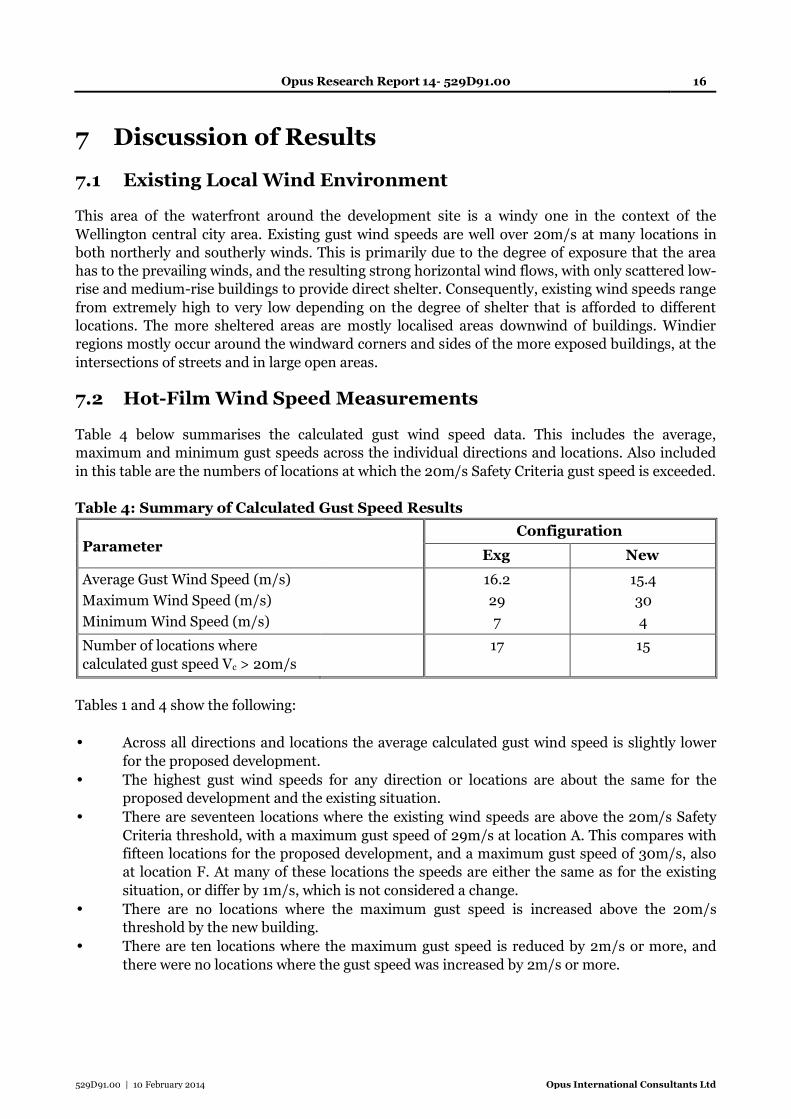
7.2 Hot-Film Wind Speed Measurements
Table 4 below summarises the calculated gust wind speed data. This includes the average,
maximum and minimum gust speeds across the individual directions and locations. Also included
in this table are the numbers of locations at which the 20m/s Safety Criteria gust speed is exceeded.
Table 4: Summary of Calculated Gust Speed Results
Parameter
Configuration
Exg New
Average Gust Wind Speed (m/s)
Maximum Wind Speed (m/s)
Minimum Wind Speed (m/s)
16.2
29
7
15.4
30
4
Number of locations where
calculated gust speed Vc > 20m/s
17 15
Tables 1 and 4 show the following:
• Across all directions and locations the average calculated gust wind speed is slightly lower
for the proposed development.
• The highest gust wind speeds for any direction or locations are about the same for the
proposed development and the existing situation.
• There are seventeen locations where the existing wind speeds are above the 20m/s Safety
Criteria threshold, with a maximum gust speed of 29m/s at location A. This compares with
fifteen locations for the proposed development, and a maximum gust speed of 30m/s, also
at location F. At many of these locations the speeds are either the same as for the existing
situation, or differ by 1m/s, which is not considered a change.
• There are no locations where the maximum gust speed is increased above the 20m/s
threshold by the new building.
• There are ten locations where the maximum gust speed is reduced by 2m/s or more, and
there were no locations where the gust speed was increased by 2m/s or more.
Opus Research Report 14- 529D91.00 17
529D91.00 | 10 February 2014 Opus International Consultants Ltd
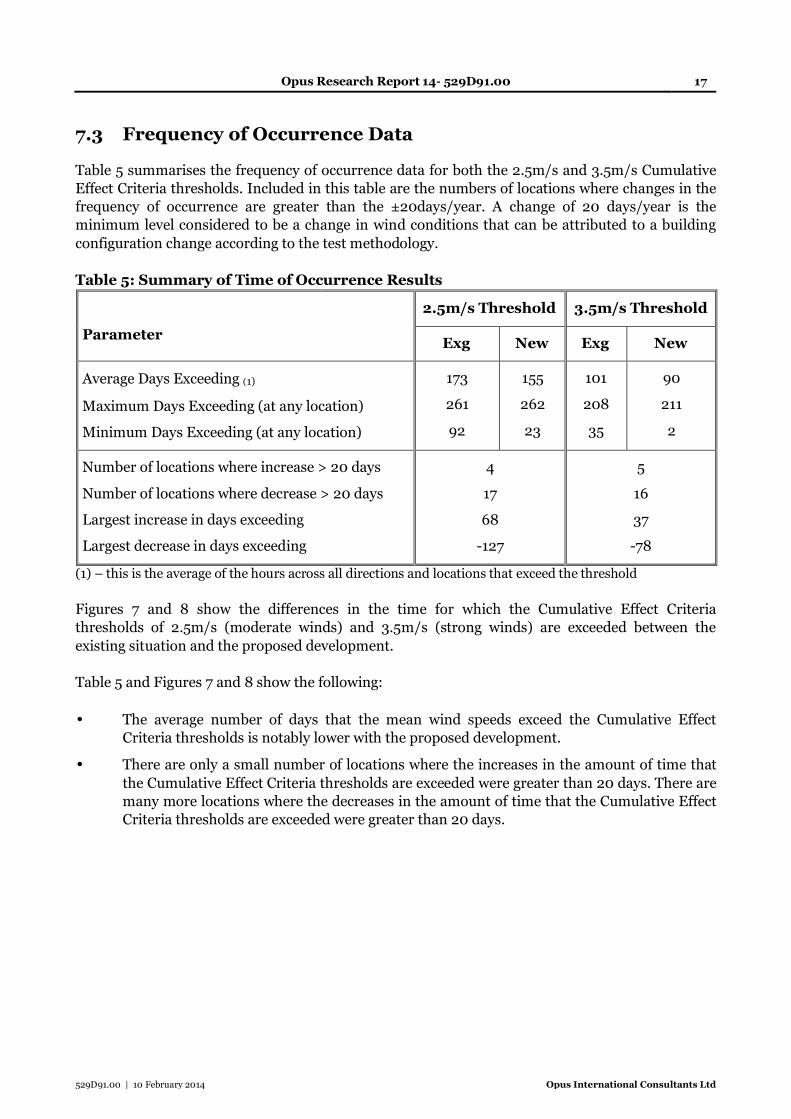
7.3 Frequency of Occurrence Data
Table 5 summarises the frequency of occurrence data for both the 2.5m/s and 3.5m/s Cumulative
Effect Criteria thresholds. Included in this table are the numbers of locations where changes in the
frequency of occurrence are greater than the ±20days/year. A change of 20 days/year is the
minimum level considered to be a change in wind conditions that can be attributed to a building
configuration change according to the test methodology.
Table 5: Summary of Time of Occurrence Results
Parameter
2.5m/s Threshold 3.5m/s Threshold
Exg New Exg New
Average Days Exceeding (1)
Maximum Days Exceeding (at any location)
Minimum Days Exceeding (at any location)
173
261
92
155
262
23
101
208
35
90
211
2
Number of locations where increase > 20 days
Number of locations where decrease > 20 days
Largest increase in days exceeding
Largest decrease in days exceeding
4
17
68
-127
5
16
37
-78
(1) – this is the average of the hours across all directions and locations that exceed the threshold
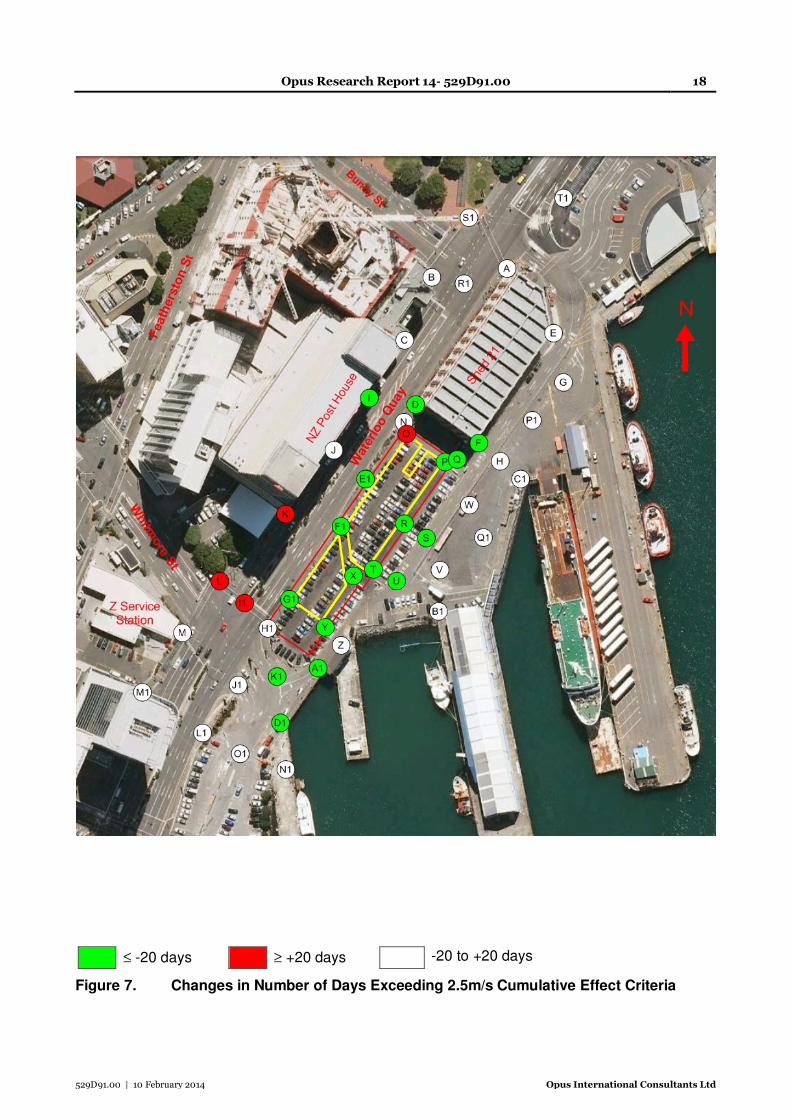
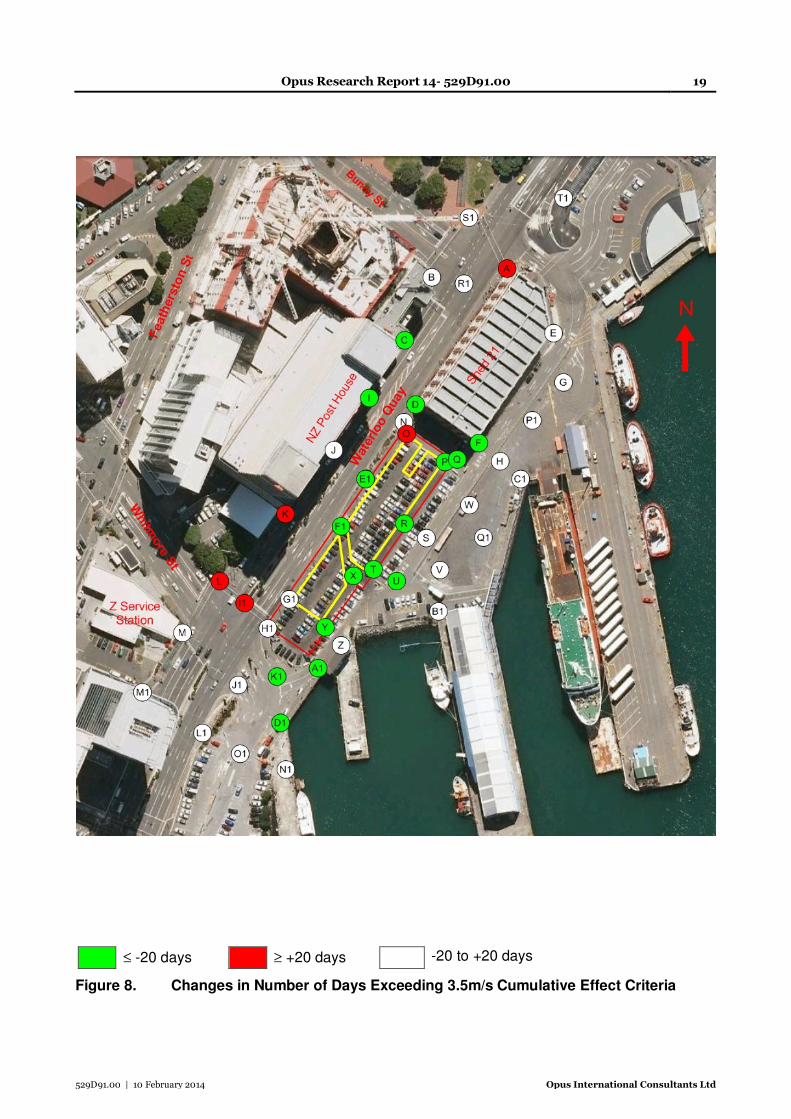
Figures 7 and 8 show the differences in the time for which the Cumulative Effect Criteria
thresholds of 2.5m/s (moderate winds) and 3.5m/s (strong winds) are exceeded between the
existing situation and the proposed development.
Table 5 and Figures 7 and 8 show the following:
• The average number of days that the mean wind speeds exceed the Cumulative Effect
Criteria thresholds is notably lower with the proposed development.
• There are only a small number of locations where the increases in the amount of time that
the Cumulative Effect Criteria thresholds are exceeded were greater than 20 days. There are
many more locations where the decreases in the amount of time that the Cumulative Effect
Criteria thresholds are exceeded were greater than 20 days.
Opus Research Report 14- 529D91.00 18
529D91.00 | 10 February 2014 Opus International Consultants Ltd
≤ -20 days ≥ +20 days -20 to +20 days Figure 7. Changes in Number of Days Exceeding 2.5m/s Cumulative Effect Criteria
Opus Research Report 14- 529D91.00 19
529D91.00 | 10 February 2014 Opus International Consultants Ltd
≤ -20 days ≥ +20 days -20 to +20 days Figure 8. Changes in Number of Days Exceeding 3.5m/s Cumulative Effect Criteria

Opus Research Report 14- 529D91.00 20
529D91.00 | 10 February 2014 Opus International Consultants Ltd
7.4 Overall Assessment of Building Design
The gust speed measurements show that there are no locations where the speed has been increased
over the Safety Criteria threshold speed of 20m/s by the proposed building, and that there were ten
locations were an existing speed greater than 20m/s was reduced by the new building. However,
there were a total of fifteen locations where the gust speed with the new building exceeded the
20m/s threshold.
The frequency of occurrence data does show that, taken overall, there is a notable improvement in
the local wind environment with the new building. When considered over the full range of locations
and wind directions the overall effect is quite beneficial, but for a number of locations and for
certain wind directions the changes were considered to warrant investigation of the cause of the
effects and potential mitigation.
7.5 Investigation of Different Design Configurations
Given the identified effects of the new building, a limited range of additional wind speed
measurements was carried out to (1) identify the effects for an 18.6m block (this being the trigger
height for a wind report), and (2) investigate the potential to improve wind conditions compared to
the original design. The following configurations, with screen locations as shown in Figure 9, were
investigated:
(1) An 18.6m slab-side block with the same footprint as the new building, with no overhangs;
(2) Vertical screens, 2.5m high, and with porosity of around 35%, at the four corners of the
building, directly under the overhangs
(3) A vertical 2.5m high, 35% porous, screen across between the new building and Shed 21
along the line of the existing wharf gate pillars
Figure 9 Locations of vertical screen options investigated
Measurements were made for selected wind directions showing either the largest changes
compared to the existing situation, or the highest gust wind speeds. It is expected that the different
Opus Research Report 14- 529D91.00 21
529D91.00 | 10 February 2014 Opus International Consultants Ltd
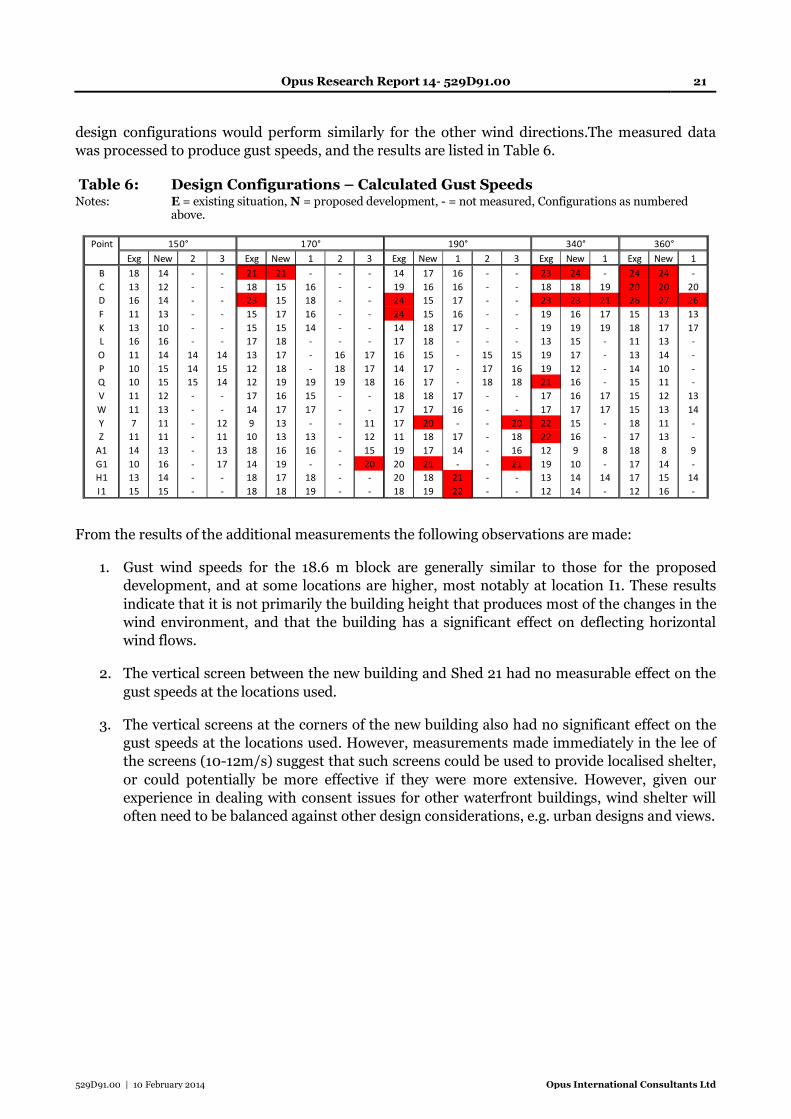
design configurations would perform similarly for the other wind directions.The measured data
was processed to produce gust speeds, and the results are listed in Table 6.
Table 6: Design Configurations – Calculated Gust Speeds Notes: E = existing situation, N = proposed development, - = not measured, Configurations as numbered
above.
From the results of the additional measurements the following observations are made:
1. Gust wind speeds for the 18.6 m block are generally similar to those for the proposed
development, and at some locations are higher, most notably at location I1. These results
indicate that it is not primarily the building height that produces most of the changes in the
wind environment, and that the building has a significant effect on deflecting horizontal
wind flows.
2. The vertical screen between the new building and Shed 21 had no measurable effect on the
gust speeds at the locations used.
3. The vertical screens at the corners of the new building also had no significant effect on the
gust speeds at the locations used. However, measurements made immediately in the lee of
the screens (10-12m/s) suggest that such screens could be used to provide localised shelter,
or could potentially be more effective if they were more extensive. However, given our
experience in dealing with consent issues for other waterfront buildings, wind shelter will
often need to be balanced against other design considerations, e.g. urban designs and views.
Point
Exg New 2 3 Exg New 1 2 3 Exg New 1 2 3 Exg New 1 Exg New 1
B 18 14 - - 21 21 - - - 14 17 16 - - 23 24 - 24 24 -
C 13 12 - - 18 15 16 - - 19 16 16 - - 18 18 19 20 20 20
D 16 14 - - 23 15 18 - - 24 15 17 - - 23 23 21 26 27 26
F 11 13 - - 15 17 16 - - 24 15 16 - - 19 16 17 15 13 13
K 13 10 - - 15 15 14 - - 14 18 17 - - 19 19 19 18 17 17
L 16 16 - - 17 18 - - - 17 18 - - - 13 15 - 11 13 -
O 11 14 14 14 13 17 - 16 17 16 15 - 15 15 19 17 - 13 14 -
P 10 15 14 15 12 18 - 18 17 14 17 - 17 16 19 12 - 14 10 -
Q 10 15 15 14 12 19 19 19 18 16 17 - 18 18 21 16 - 15 11 -
V 11 12 - - 17 16 15 - - 18 18 17 - - 17 16 17 15 12 13
W 11 13 - - 14 17 17 - - 17 17 16 - - 17 17 17 15 13 14
Y 7 11 - 12 9 13 - - 11 17 20 - - 20 22 15 - 18 11 -
Z 11 11 - 11 10 13 13 - 12 11 18 17 - 18 22 16 - 17 13 -
A1 14 13 - 13 18 16 16 - 15 19 17 14 - 16 12 9 8 18 8 9
G1 10 16 - 17 14 19 - - 20 20 21 - - 21 19 10 - 17 14 -
H1 13 14 - - 18 17 18 - - 20 18 21 - - 13 14 14 17 15 14
I1 15 15 - - 18 18 19 - - 18 19 22 - - 12 14 - 12 16 -
190° 340° 360°150° 170°
Opus Research Report 14- 529D91.00 22
529D91.00 | 10 February 2014 Opus International Consultants Ltd
8 Conclusions
(1) Wind conditions around the proposed development site currently range from very low to
extremely high. The open nature of the area, with few buildings to provide significant shelter,
means that there is considerable exposure to strong wind flows for some or all of either the
prevailing northerly or southerly wind directions. What wind shelter that is available depends
significantly on the wind direction, occurring mostly at locations downwind of buildings for
particular wind directions.
(2) The development site is currently vacant. Any building on the site will change the local wind
flow patterns because the wind that currently blows across the open site will be forced to take
other paths. Accordingly, some changes to the existing wind environment, both increases and
reductions, were expected.
Gust Speeds – Safety Criteria
(3) Existing gust wind speeds varied from a low value of 7m/s to a very high 29m/s, compared
with a range of 4m/s to 30m/s for the proposed building. This shows that the windiest
conditions with the proposed development are no worse than they are currently. Taken over
all directions and locations the average gust speed is slightly lower for the proposed
development.
(4) There were seventeen locations for the existing situation where the gust speeds exceeded the
20m/s Safety Criteria in the Wellington District Plan. This compares with fifteen locations for
the new building.
(5) There were no locations where the gust speed was increased significantly, such that they
exceeded the 20m/s Safety Threshold. There were ten locations where existing wind speeds
over the 20m/s threshold were significantly reduced.
Frequency of Occurrence – Cumulative Effect Criteria
(6) The average number of days per year over all locations and wind directions that the gust
speeds exceed the Cumulative Effect Criteria thresholds was notably lower with the new
building.
(7) There were only a small number of locations where the increases in the amount of time that
the Cumulative Effect Criteria thresholds were exceeded were greater than 20 days. There
were many more locations where the decreases in the amount of time that the Cumulative
Effect Criteria thresholds are exceeded were greater than 20 days.
Overall Assessment of Building Design
(8) Overall, the proposed development caused a notable improvement in the local wind
environment over quite sizeable areas around the building, primarily due to the
redistribution of existing horizontal wind flow patterns.
Opus Research Report 14- 529D91.00 23
529D91.00 | 10 February 2014 Opus International Consultants Ltd
Design Configuration Changes
(9) Additional testing showed that any building of substantial size on this site will typically cause
significant redistribution of wind flow patterns and wind speeds, and that the new building’s
setbacks help it to perform better than a lower slab-sided building at some locations.
(10) The additional testing also showed that vertical screens could potentially be used to provide
localised screening at specific locations if considered appropriate, although it is realised that
the desire for wind shelter would need to be balanced against other design considerations.
Authored by: Reviewed by:
Neil Jamieson Paul Carpenter
Research Leader Wind Engineering Consultant
Aerodynamics
Opus Research Report 14- 529D91.00 24
529D91.00 | 10 February 2014 Opus International Consultants Ltd
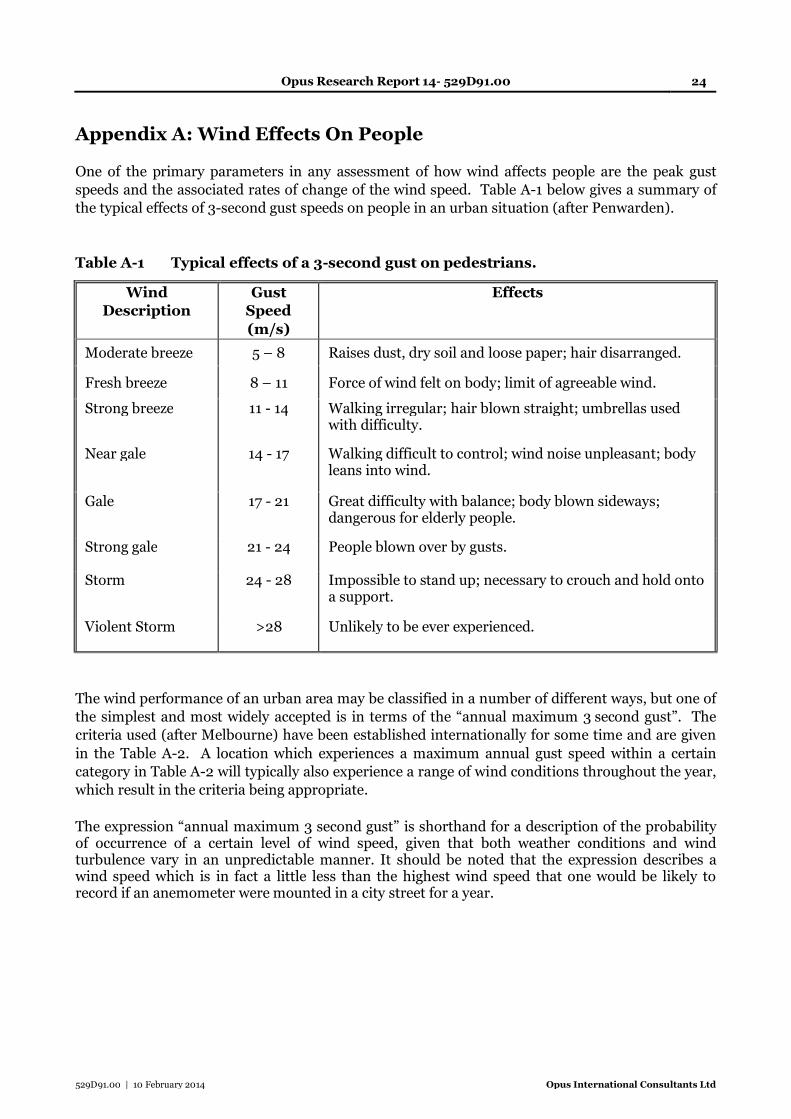
Appendix A: Wind Effects On People
One of the primary parameters in any assessment of how wind affects people are the peak gust
speeds and the associated rates of change of the wind speed. Table A-1 below gives a summary of
the typical effects of 3-second gust speeds on people in an urban situation (after Penwarden).
Table A-1 Typical effects of a 3-second gust on pedestrians.
Wind
Description
Gust
Speed
(m/s)
Effects
Moderate breeze 5 – 8 Raises dust, dry soil and loose paper; hair disarranged.
Fresh breeze 8 – 11 Force of wind felt on body; limit of agreeable wind.
Strong breeze 11 - 14 Walking irregular; hair blown straight; umbrellas used with difficulty.
Near gale 14 - 17 Walking difficult to control; wind noise unpleasant; body leans into wind.
Gale 17 - 21 Great difficulty with balance; body blown sideways; dangerous for elderly people.
Strong gale 21 - 24 People blown over by gusts.
Storm 24 - 28 Impossible to stand up; necessary to crouch and hold onto a support.
Violent Storm >28 Unlikely to be ever experienced.
The wind performance of an urban area may be classified in a number of different ways, but one of
the simplest and most widely accepted is in terms of the “annual maximum 3 second gust”. The
criteria used (after Melbourne) have been established internationally for some time and are given
in the Table A-2. A location which experiences a maximum annual gust speed within a certain
category in Table A-2 will typically also experience a range of wind conditions throughout the year,
which result in the criteria being appropriate.
The expression “annual maximum 3 second gust” is shorthand for a description of the probability of occurrence of a certain level of wind speed, given that both weather conditions and wind turbulence vary in an unpredictable manner. It should be noted that the expression describes a wind speed which is in fact a little less than the highest wind speed that one would be likely to record if an anemometer were mounted in a city street for a year.
Opus Research Report 14- 529D91.00 25
529D91.00 | 10 February 2014 Opus International Consultants Ltd
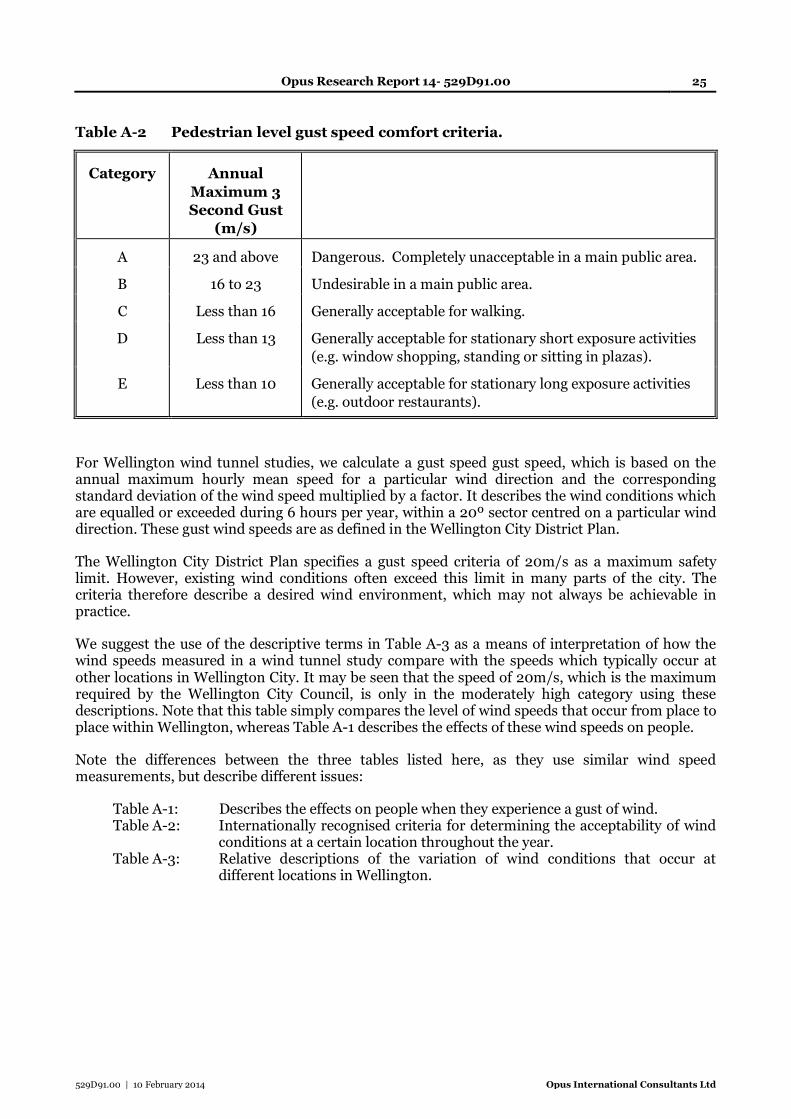
Table A-2 Pedestrian level gust speed comfort criteria.
Category
Annual
Maximum 3
Second Gust
(m/s)
A
23 and above
Dangerous. Completely unacceptable in a main public area.
B
16 to 23
Undesirable in a main public area.
C
Less than 16
Generally acceptable for walking.
D
Less than 13
Generally acceptable for stationary short exposure activities
(e.g. window shopping, standing or sitting in plazas).
E
Less than 10 Generally acceptable for stationary long exposure activities
(e.g. outdoor restaurants).
For Wellington wind tunnel studies, we calculate a gust speed gust speed, which is based on the annual maximum hourly mean speed for a particular wind direction and the corresponding standard deviation of the wind speed multiplied by a factor. It describes the wind conditions which are equalled or exceeded during 6 hours per year, within a 20º sector centred on a particular wind direction. These gust wind speeds are as defined in the Wellington City District Plan.
The Wellington City District Plan specifies a gust speed criteria of 20m/s as a maximum safety limit. However, existing wind conditions often exceed this limit in many parts of the city. The criteria therefore describe a desired wind environment, which may not always be achievable in practice.
We suggest the use of the descriptive terms in Table A-3 as a means of interpretation of how the wind speeds measured in a wind tunnel study compare with the speeds which typically occur at other locations in Wellington City. It may be seen that the speed of 20m/s, which is the maximum required by the Wellington City Council, is only in the moderately high category using these descriptions. Note that this table simply compares the level of wind speeds that occur from place to place within Wellington, whereas Table A-1 describes the effects of these wind speeds on people.
Note the differences between the three tables listed here, as they use similar wind speed measurements, but describe different issues:
Table A-1: Describes the effects on people when they experience a gust of wind. Table A-2: Internationally recognised criteria for determining the acceptability of wind
conditions at a certain location throughout the year. Table A-3: Relative descriptions of the variation of wind conditions that occur at
different locations in Wellington.

Opus Research Report 14- 529D91.00 26
529D91.00 | 10 February 2014 Opus International Consultants Ltd
Table A-3 Suggested descriptive terms for the range of gust wind speeds which typically occur at different locations within Wellington City. Annual maximum gust speed (m/s) 11 and below very low
12 – 14 low
15 – 17 moderate
18 – 20 moderately high
21 – 23 high
24 – 26 very high
27 and above extremely high
Opus Research Report 14- 529D91.00 27
529D91.00 | 10 February 2014 Opus International Consultants Ltd
Appendix B: Wellington City District Plan
The sections of the Wellington City District Plan, which make specific reference to wind are
currently being amended. The most recent publically available versions can be obtained from the
Wellington City Council website.
Opus Research Report 14- 529D91.00 28
529D91.00 | 10 February 2014 Opus International Consultants Ltd
Appendix C: Wellington City Wind Climate
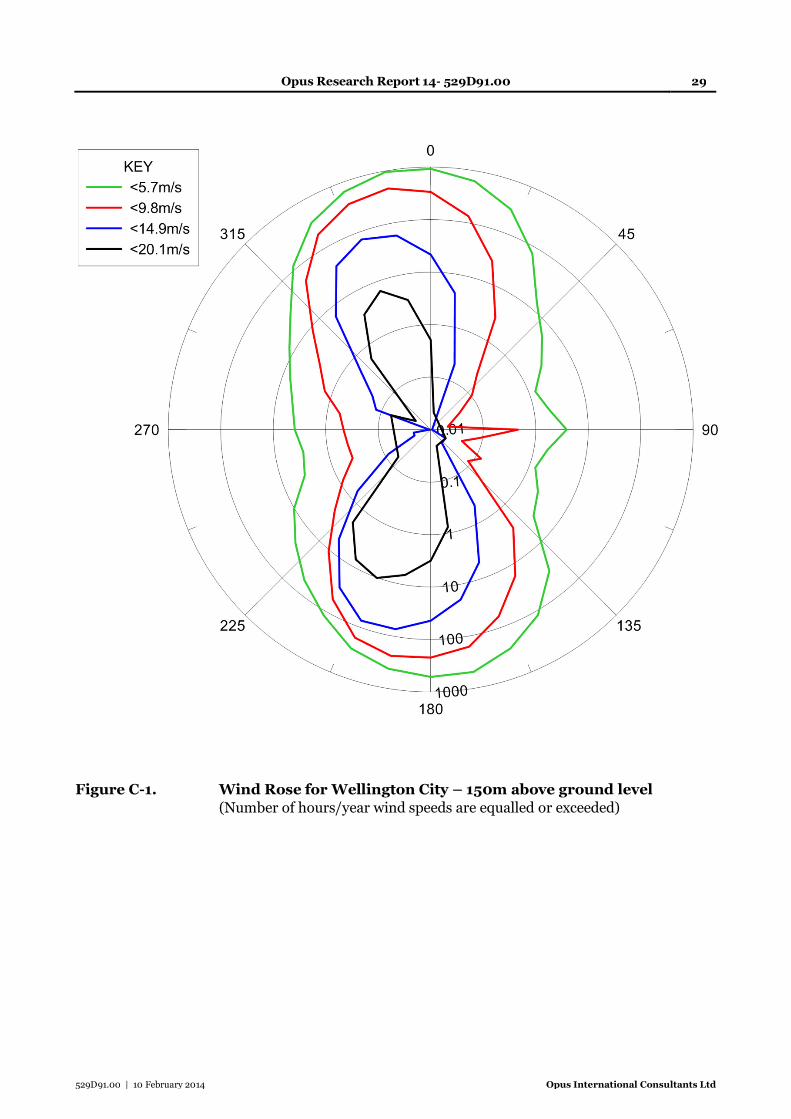
The wind over Wellington City is predominantly either northerly or southerly. This is
demonstrated by a sample wind rose, plotted in Figure C-1, for the wind at a height of 150 m. The
rose is obtained from the wind data listed in Figure C-2.
The wind data is derived from that recorded over a 47 year period at Wellington Airport. The mean
wind speed at 150 m over the city is calculated to be the same as that at the airport reference
anemometer at a height of 10 m, but with the northerly winds rotated 10 degrees to the west. This
relationship is based on work carried out by Jackson (1976). It is also consistent with the Deaves
and Harris (1978) wind model.
From this data, the following values have been estimated for the mean hourly wind speeds that
occur during 6 hours per year for a 20° sector, centred on the listed wind direction.
Reference Wind Speeds for Wellington City
Direction (degrees)
Speed (m/s)
150
15
170
20
190
22
210
22
320
19
340
22
360
20
020
15
The measured wind speeds around a building, as quoted in this report, are calculated gust speeds
based on the maximum annual hourly mean wind speed and the corresponding standard deviation
in the wind speed.
Opus Research Report 14- 529D91.00 29
529D91.00 | 10 February 2014 Opus International Consultants Ltd
Figure C-1. Wind Rose for Wellington City – 150m above ground level
(Number of hours/year wind speeds are equalled or exceeded)
Opus Research Report 14- 529D91.00 30
529D91.00 | 10 February 2014 Opus International Consultants Ltd
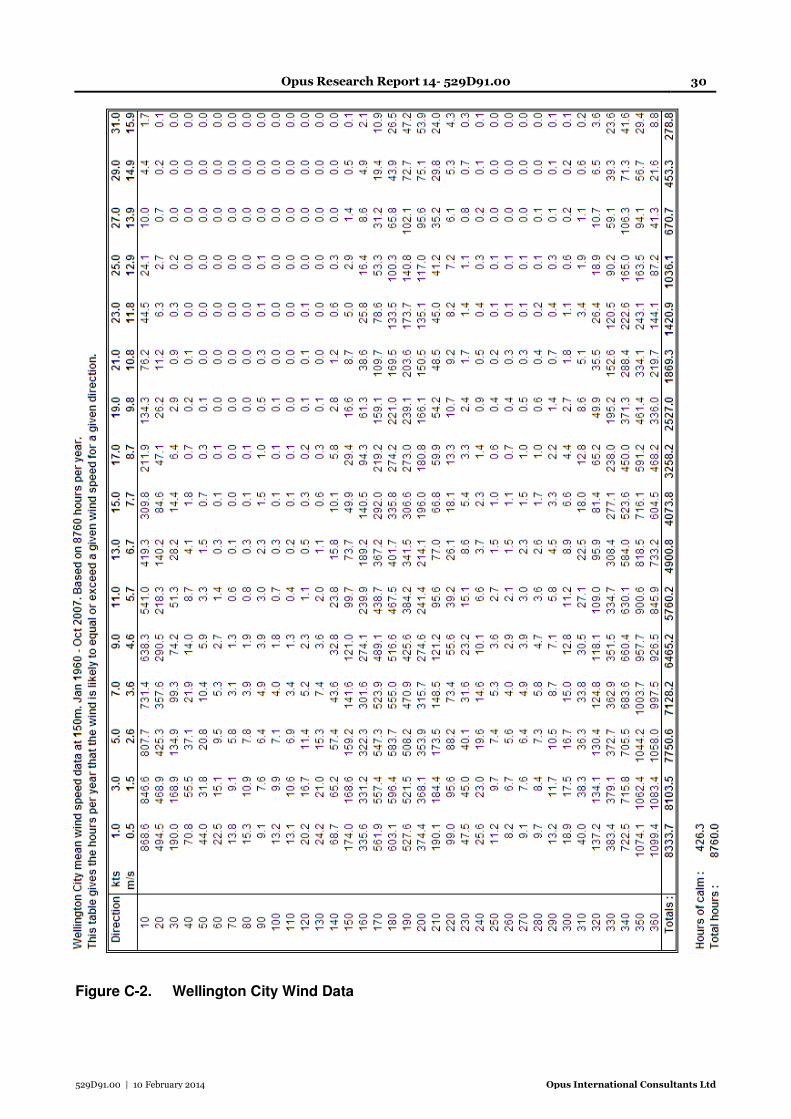
Figure C-2. Wellington City Wind Data
Opus Research Report 14- 529D91.00 31
529D91.00 | 10 February 2014 Opus International Consultants Ltd
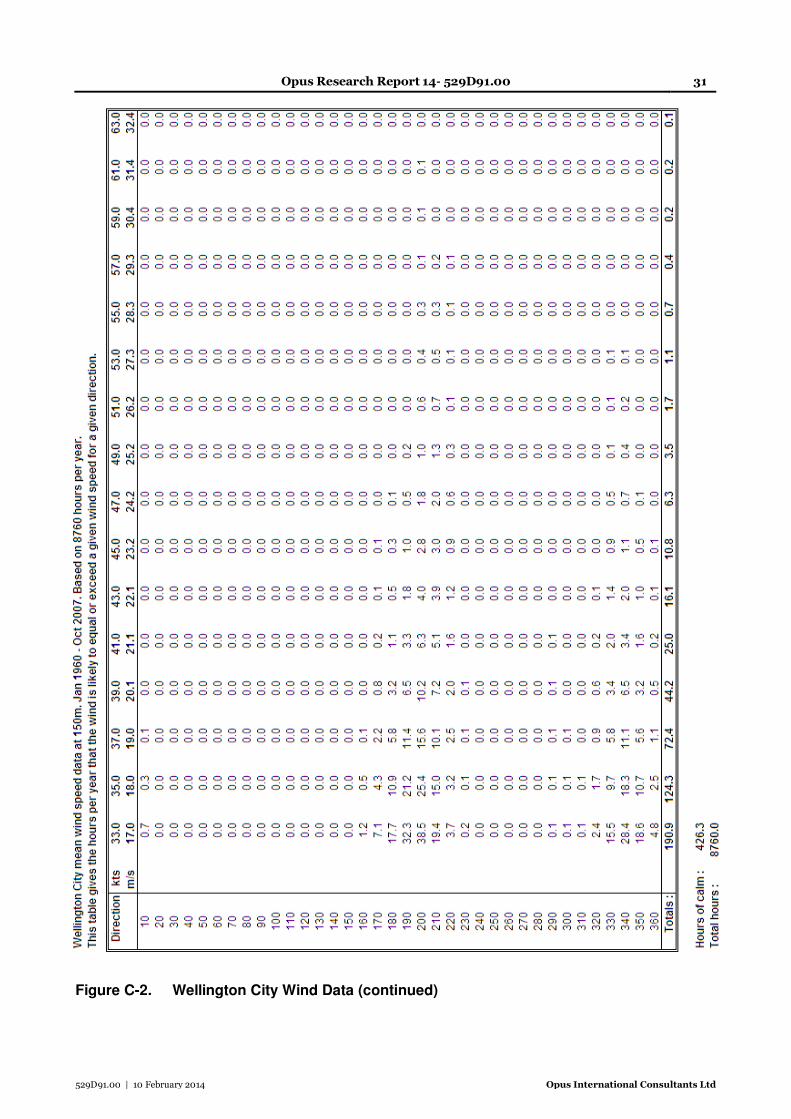
Figure C-2. Wellington City Wind Data (continued)
Opus Research Report 14- 529D91.00 32
529D91.00 | 10 February 2014 Opus International Consultants Ltd
Appendix D: Wind Tunnel and Boundary Layer
The Opus Research wind tunnel is an open return type, with an overall length of 68 m. The
working section measures 2.74 m wide x 1.22 m high (9 ft x 4 ft). The airflow is generated by a six
blade, 1.52 m diameter, 34 kW axial flow Woods fan downwind of the working section. The
maximum air speed in the working section is about 12 m/s. A variable speed motor controller
controls the air speed.
The long upwind section of the wind tunnel allows the development of a deep turbulent boundary
layer to simulate the natural atmospheric boundary layer at an appropriate scale. The correct
velocity and turbulence profiles are generated by an adjustable fence and an array of wooden
blocks on the floor of the tunnel.
The Deaves and Harris (1978) mathematical model of the structure of strong winds is recognised as
the recommended model for engineering design purposes. It is used in the code of practice for
wind loading on buildings, AS1170.2. The four terrain categories defined in AS1170.2 are as follows.
Terrain Categories
1 Flat, treeless plains, sea coasts
2 Open terrain, well scattered obstructions (air fields)
3 Suburban, industrial and well wooded areas
4 City centre condition
Opus Research Report 14- 529D91.00 33
529D91.00 | 10 February 2014 Opus International Consultants Ltd
Appendix E: Bran Flake Flow Visualisation
Flow visualisation using bran flakes provides a means of quickly identifying the relative wind
speeds over the surface of a model.
The bran flakes are sieved to provide flakes between 1.0 mm and 1.4 mm in size. With the wind
tunnel switched off, the model is sprinkled with a thin uniform layer of the bran. The layer is
approximately two bran flakes deep, but it completely obscures the surface of the model. The wind
tunnel speed is then steadily increased over a period of 20 minutes and the bran is progressively
blown away. The areas where the bran first blows away indicate where the highest gust speeds are
likely to occur. In other areas the bran accumulates slowly and these are generally where the
lowest gust speeds occur. The changing patterns in the bran are photographed as the test proceeds.
The photographs from each test are processed to give the contour images shown in the wind report.
Areas of the photographs that change from one photograph to the next in the test sequence are
coloured, to give contours of increasing erosion. These contours correspond loosely to gust wind
speeds on the surface of the model, although no accurate gust speed can be determined for a
particular location from the contours. It is possible to compare the results from two separate tests,
but the comparison must be made with caution because each test is inevitably slightly different.
Ideally, the bran tests should only be used as a rough visual indication of where the highest wind
speeds occur and as a guide to where hot wire speed measurements should be concentrated.
While the test is in progress, the movement of the bran is also useful for visualisation of the flow
around the model. Usually this only indicates the direction of the flow at ground level, but in
certain flow conditions (e.g. in vortices or in high turbulence) the bran flakes also become airborne
and the three dimensional flow is then apparent. Unfortunately this movement is not detectable in
the still photographs.
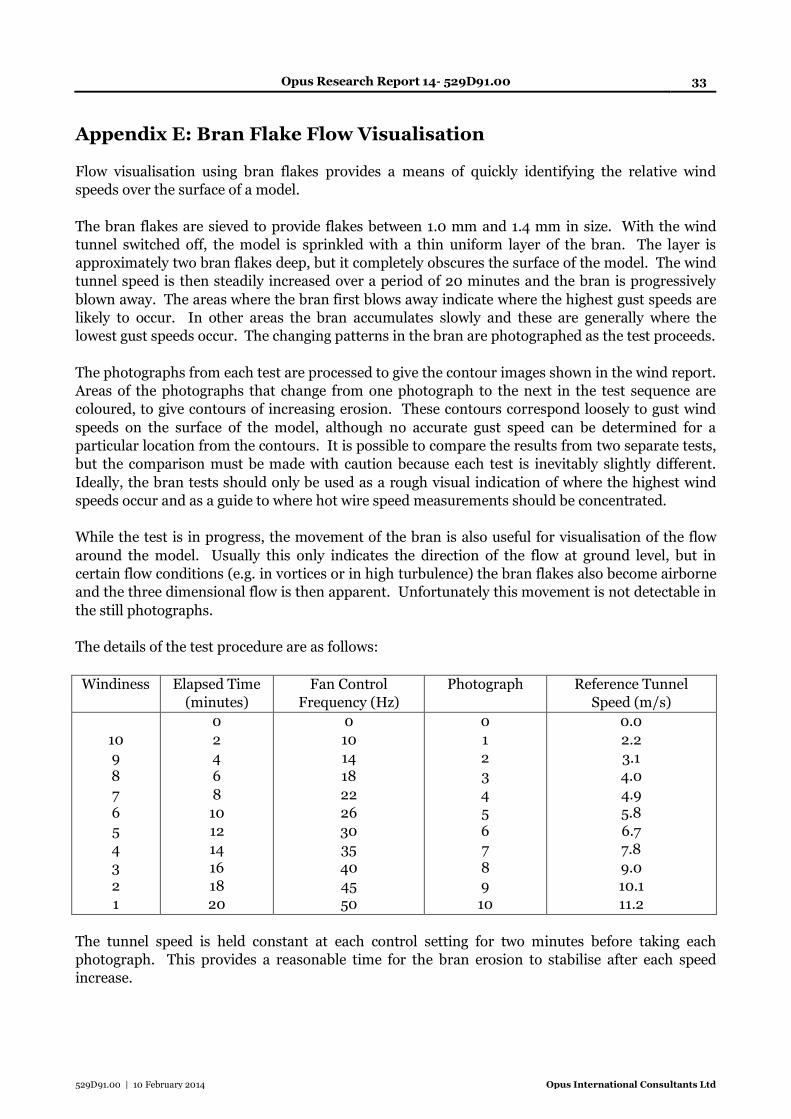
The details of the test procedure are as follows:
Windiness Elapsed Time
(minutes)
Fan Control
Frequency (Hz)
Photograph Reference Tunnel
Speed (m/s)
10
9
8
7
6
5
4
3
2
1
0
2
4
6
8
10
12
14
16
18
20
0
10
14
18
22
26
30
35
40
45
50
0
1
2
3
4
5
6
7
8
9
10
0.0
2.2
3.1
4.0
4.9
5.8
6.7
7.8
9.0
10.1
11.2
The tunnel speed is held constant at each control setting for two minutes before taking each
photograph. This provides a reasonable time for the bran erosion to stabilise after each speed
increase.
Opus Research Report 14- 529D91.00 34
529D91.00 | 10 February 2014 Opus International Consultants Ltd
Although the local gust speed is the greatest single factor in producing movement of the bran
flakes, there are numerous other factors that make it difficult to produce an accurate correlation.
These include:
The model surface: The bran can accumulate on rough or sticky surfaces and in cracks and
hollows.
Loose bran flakes: The bran moves more easily when it is loose, e.g. at the edge of a cleared area,
than when it is closely packed. Therefore a clearing may expand rapidly once
it has been initiated.
Discontinuities: The bran tends to be disturbed around corners and small obstructions in the
airflow. It is not easily disturbed in regions of flat, uniform flow.
Vertical wind flow: The bran is more easily disturbed where there is a downward component in
the air velocity than where the flow is horizontal.
Turbulence: The bran tends to be disturbed by turbulence and fluctuating flow direction.
Tunnel gusts: Occasional random low frequency fluctuations in the tunnel speed produce
rapid changes in the bran erosion patterns. These tunnel gusts occur about
once or twice per minute.
Vortices: Bran flakes can accumulate in the core of a steady local vortex. This then
appears to be a comparatively calm area in the photographs because the vortex
is not visible.
Bran mounds: The bran can accumulate in mounds as each test proceeds, and the mounds
subsequently modify the flow conditions in their vicinity.
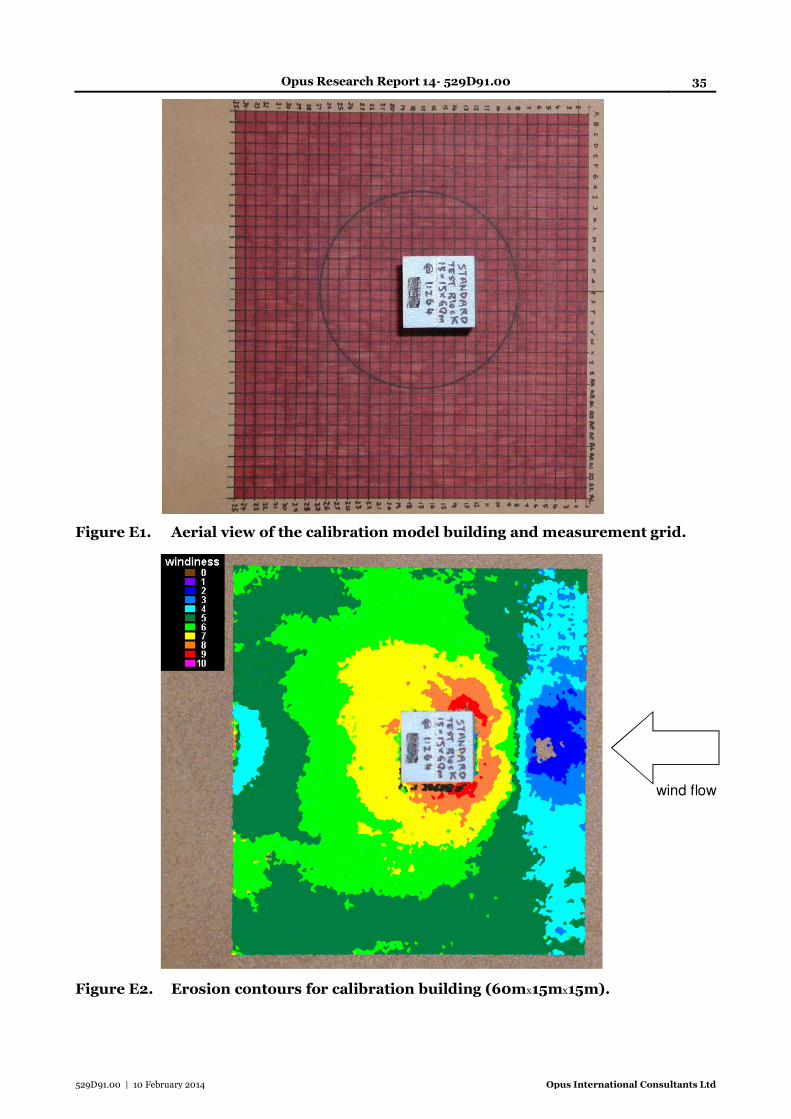
Calibration of the Bran Flake Erosion
Figure E2 shows a bran erosion contour image for the calibration building specified in Appendix 7
of the Wellington City District Plan. The calibration building is an isolated rectangular block,
measuring 60m high, and 15m square in plan, at full-scale. This building was built at a scale of
1:264, which is the scale of the Opus Research wind tunnel model of Wellington City. The building
was tested in the standard terrain category 3 atmospheric boundary layer simulation, which is used
for environmental building studies in Wellington City. Figure E1 shows the grid on the wind tunnel
floor that was used to determine the extent of the erosion. The circle marked in Figure E1 indicates
an area 50m in diameter (at full-scale) which is centred on the back face of the model, as specified
in the Wellington City District Plan. Contour number 7 (i.e. windiness=”7”) corresponds to
approximately 80% of this circle being cleared of bran.
Opus Research Report 14- 529D91.00 35
529D91.00 | 10 February 2014 Opus International Consultants Ltd
Figure E1. Aerial view of the calibration model building and measurement grid.
wind flow
Figure E2. Erosion contours for calibration building (60mx15mx15m).
Opus Research Report 14- 529D91.00 36
529D91.00 | 10 February 2014 Opus International Consultants Ltd
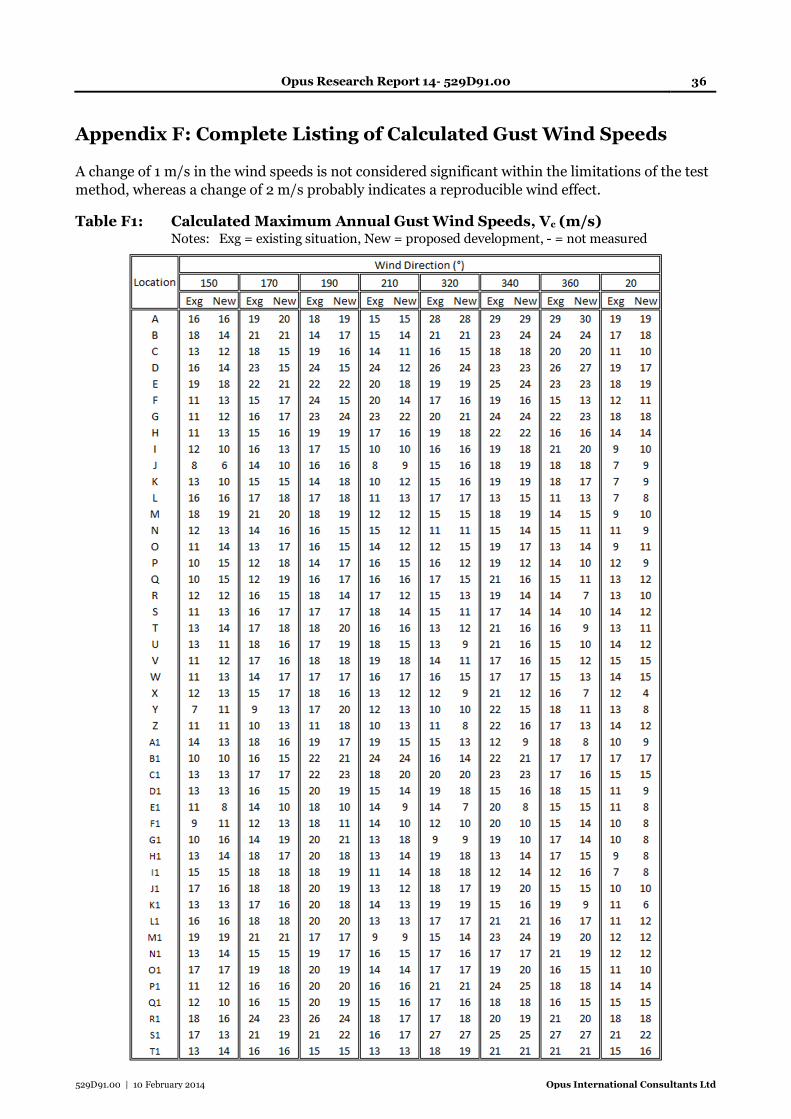
Appendix F: Complete Listing of Calculated Gust Wind Speeds
A change of 1 m/s in the wind speeds is not considered significant within the limitations of the test
method, whereas a change of 2 m/s probably indicates a reproducible wind effect.
Table F1: Calculated Maximum Annual Gust Wind Speeds, Vc (m/s) Notes: Exg = existing situation, New = proposed development, - = not measured
Opus Research Report 14- 529D91.00 37
529D91.00 | 10 February 2014 Opus International Consultants Ltd
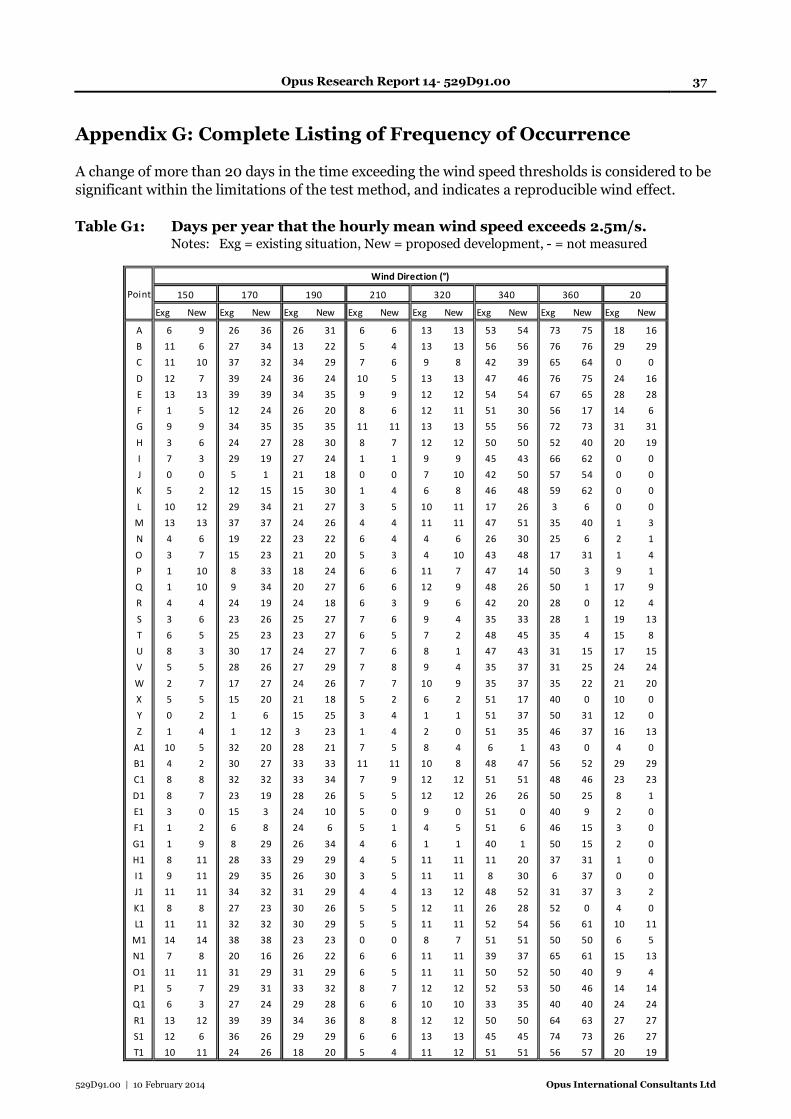
Appendix G: Complete Listing of Frequency of Occurrence
A change of more than 20 days in the time exceeding the wind speed thresholds is considered to be
significant within the limitations of the test method, and indicates a reproducible wind effect.
Table G1: Days per year that the hourly mean wind speed exceeds 2.5m/s. Notes: Exg = existing situation, New = proposed development, - = not measured
Exg New Exg New Exg New Exg New Exg New Exg New Exg New Exg New
A 6 9 26 36 26 31 6 6 13 13 53 54 73 75 18 16
B 11 6 27 34 13 22 5 4 13 13 56 56 76 76 29 29
C 11 10 37 32 34 29 7 6 9 8 42 39 65 64 0 0
D 12 7 39 24 36 24 10 5 13 13 47 46 76 75 24 16
E 13 13 39 39 34 35 9 9 12 12 54 54 67 65 28 28
F 1 5 12 24 26 20 8 6 12 11 51 30 56 17 14 6
G 9 9 34 35 35 35 11 11 13 13 55 56 72 73 31 31
H 3 6 24 27 28 30 8 7 12 12 50 50 52 40 20 19
I 7 3 29 19 27 24 1 1 9 9 45 43 66 62 0 0
J 0 0 5 1 21 18 0 0 7 10 42 50 57 54 0 0
K 5 2 12 15 15 30 1 4 6 8 46 48 59 62 0 0
L 10 12 29 34 21 27 3 5 10 11 17 26 3 6 0 0
M 13 13 37 37 24 26 4 4 11 11 47 51 35 40 1 3
N 4 6 19 22 23 22 6 4 4 6 26 30 25 6 2 1
O 3 7 15 23 21 20 5 3 4 10 43 48 17 31 1 4
P 1 10 8 33 18 24 6 6 11 7 47 14 50 3 9 1
Q 1 10 9 34 20 27 6 6 12 9 48 26 50 1 17 9
R 4 4 24 19 24 18 6 3 9 6 42 20 28 0 12 4
S 3 6 23 26 25 27 7 6 9 4 35 33 28 1 19 13
T 6 5 25 23 23 27 6 5 7 2 48 45 35 4 15 8
U 8 3 30 17 24 27 7 6 8 1 47 43 31 15 17 15
V 5 5 28 26 27 29 7 8 9 4 35 37 31 25 24 24
W 2 7 17 27 24 26 7 7 10 9 35 37 35 22 21 20
X 5 5 15 20 21 18 5 2 6 2 51 17 40 0 10 0
Y 0 2 1 6 15 25 3 4 1 1 51 37 50 31 12 0
Z 1 4 1 12 3 23 1 4 2 0 51 35 46 37 16 13
A1 10 5 32 20 28 21 7 5 8 4 6 1 43 0 4 0
B1 4 2 30 27 33 33 11 11 10 8 48 47 56 52 29 29
C1 8 8 32 32 33 34 7 9 12 12 51 51 48 46 23 23
D1 8 7 23 19 28 26 5 5 12 12 26 26 50 25 8 1
E1 3 0 15 3 24 10 5 0 9 0 51 0 40 9 2 0
F1 1 2 6 8 24 6 5 1 4 5 51 6 46 15 3 0
G1 1 9 8 29 26 34 4 6 1 1 40 1 50 15 2 0
H1 8 11 28 33 29 29 4 5 11 11 11 20 37 31 1 0
I1 9 11 29 35 26 30 3 5 11 11 8 30 6 37 0 0
J1 11 11 34 32 31 29 4 4 13 12 48 52 31 37 3 2
K1 8 8 27 23 30 26 5 5 12 11 26 28 52 0 4 0
L1 11 11 32 32 30 29 5 5 11 11 52 54 56 61 10 11
M1 14 14 38 38 23 23 0 0 8 7 51 51 50 50 6 5
N1 7 8 20 16 26 22 6 6 11 11 39 37 65 61 15 13
O1 11 11 31 29 31 29 6 5 11 11 50 52 50 40 9 4
P1 5 7 29 31 33 32 8 7 12 12 52 53 50 46 14 14
Q1 6 3 27 24 29 28 6 6 10 10 33 35 40 40 24 24
R1 13 12 39 39 34 36 8 8 12 12 50 50 64 63 27 27
S1 12 6 36 26 29 29 6 6 13 13 45 45 74 73 26 27
T1 10 11 24 26 18 20 5 4 11 12 51 51 56 57 20 19
Wind Direction (°)
Point 360 20150 170 190 210 320 340
Opus Research Report 14- 529D91.00 38
529D91.00 | 10 February 2014 Opus International Consultants Ltd
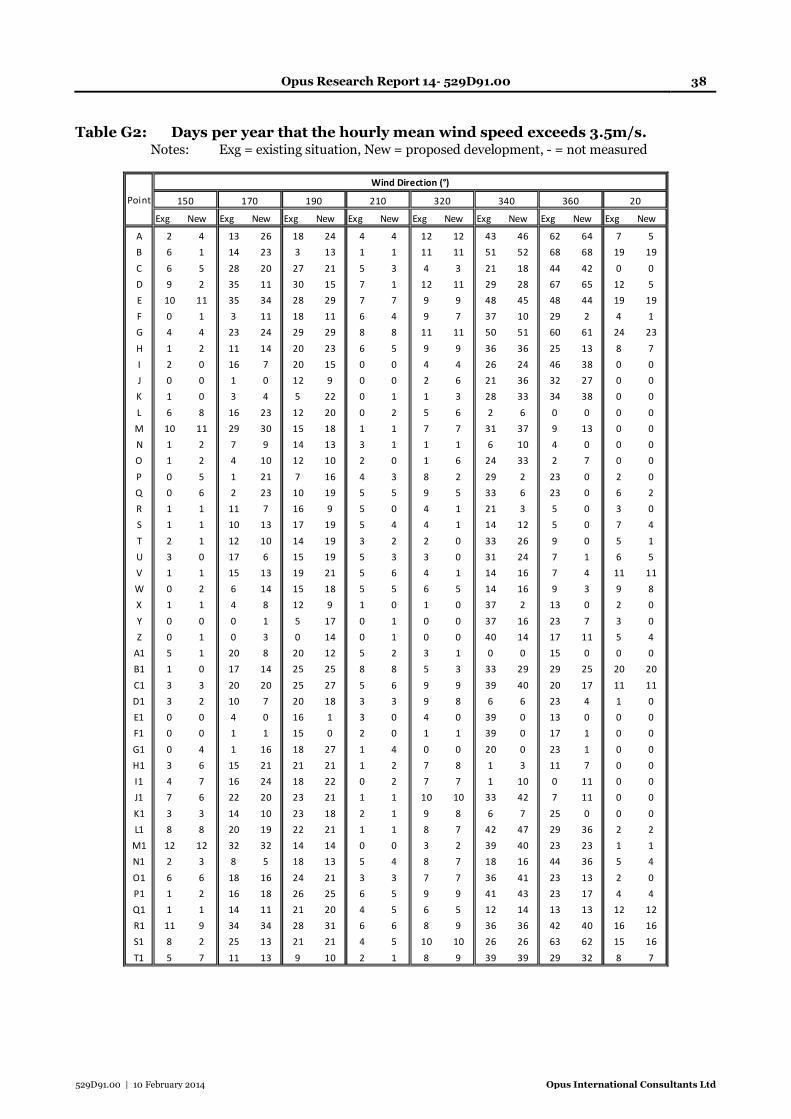
Table G2: Days per year that the hourly mean wind speed exceeds 3.5m/s. Notes: Exg = existing situation, New = proposed development, - = not measured
Exg New Exg New Exg New Exg New Exg New Exg New Exg New Exg New
A 2 4 13 26 18 24 4 4 12 12 43 46 62 64 7 5
B 6 1 14 23 3 13 1 1 11 11 51 52 68 68 19 19
C 6 5 28 20 27 21 5 3 4 3 21 18 44 42 0 0
D 9 2 35 11 30 15 7 1 12 11 29 28 67 65 12 5
E 10 11 35 34 28 29 7 7 9 9 48 45 48 44 19 19
F 0 1 3 11 18 11 6 4 9 7 37 10 29 2 4 1
G 4 4 23 24 29 29 8 8 11 11 50 51 60 61 24 23
H 1 2 11 14 20 23 6 5 9 9 36 36 25 13 8 7
I 2 0 16 7 20 15 0 0 4 4 26 24 46 38 0 0
J 0 0 1 0 12 9 0 0 2 6 21 36 32 27 0 0
K 1 0 3 4 5 22 0 1 1 3 28 33 34 38 0 0
L 6 8 16 23 12 20 0 2 5 6 2 6 0 0 0 0
M 10 11 29 30 15 18 1 1 7 7 31 37 9 13 0 0
N 1 2 7 9 14 13 3 1 1 1 6 10 4 0 0 0
O 1 2 4 10 12 10 2 0 1 6 24 33 2 7 0 0
P 0 5 1 21 7 16 4 3 8 2 29 2 23 0 2 0
Q 0 6 2 23 10 19 5 5 9 5 33 6 23 0 6 2
R 1 1 11 7 16 9 5 0 4 1 21 3 5 0 3 0
S 1 1 10 13 17 19 5 4 4 1 14 12 5 0 7 4
T 2 1 12 10 14 19 3 2 2 0 33 26 9 0 5 1
U 3 0 17 6 15 19 5 3 3 0 31 24 7 1 6 5
V 1 1 15 13 19 21 5 6 4 1 14 16 7 4 11 11
W 0 2 6 14 15 18 5 5 6 5 14 16 9 3 9 8
X 1 1 4 8 12 9 1 0 1 0 37 2 13 0 2 0
Y 0 0 0 1 5 17 0 1 0 0 37 16 23 7 3 0
Z 0 1 0 3 0 14 0 1 0 0 40 14 17 11 5 4
A1 5 1 20 8 20 12 5 2 3 1 0 0 15 0 0 0
B1 1 0 17 14 25 25 8 8 5 3 33 29 29 25 20 20
C1 3 3 20 20 25 27 5 6 9 9 39 40 20 17 11 11
D1 3 2 10 7 20 18 3 3 9 8 6 6 23 4 1 0
E1 0 0 4 0 16 1 3 0 4 0 39 0 13 0 0 0
F1 0 0 1 1 15 0 2 0 1 1 39 0 17 1 0 0
G1 0 4 1 16 18 27 1 4 0 0 20 0 23 1 0 0
H1 3 6 15 21 21 21 1 2 7 8 1 3 11 7 0 0
I1 4 7 16 24 18 22 0 2 7 7 1 10 0 11 0 0
J1 7 6 22 20 23 21 1 1 10 10 33 42 7 11 0 0
K1 3 3 14 10 23 18 2 1 9 8 6 7 25 0 0 0
L1 8 8 20 19 22 21 1 1 8 7 42 47 29 36 2 2
M1 12 12 32 32 14 14 0 0 3 2 39 40 23 23 1 1
N1 2 3 8 5 18 13 5 4 8 7 18 16 44 36 5 4
O1 6 6 18 16 24 21 3 3 7 7 36 41 23 13 2 0
P1 1 2 16 18 26 25 6 5 9 9 41 43 23 17 4 4
Q1 1 1 14 11 21 20 4 5 6 5 12 14 13 13 12 12
R1 11 9 34 34 28 31 6 6 8 9 36 36 42 40 16 16
S1 8 2 25 13 21 21 4 5 10 10 26 26 63 62 15 16
T1 5 7 11 13 9 10 2 1 8 9 39 39 29 32 8 7
360 20Point
Wind Direction (°)
150 170 190 210 320 340
Opus Research Report 14- 529D91.00 39
529D91.00 | 10 February 2014 Opus International Consultants Ltd
References
Australasian Wind Engineering Society, (2001): Quality Assurance Manual, Wind Engineering
Studies of Buildings, AWES QAM-1-2001.
Deaves, C.M. and Harris, R.I. (1978): "A Mathematical Model of the Structure of Strong Winds",
CIRIA Seminar.
Jackson, P.S. (1976): "Thorndon Wind Tower", Central Laboratories Report 3-76/4.
Melbourne, W.H. (1978): "Criteria for Environmental Wind Conditions", Journal of Industrial
Aerodynamics, Vol. 3, Nos. 2 and 3.
Penwarden, A.D. (1973): "Acceptable Wind Speeds in Towns", Building Science, Vol. 8.
Standards New Zealand (2011): “Code of practice for general structural design and design loadings
for buildings” AS 1170.2.
Wellington City Council: Wellington City District Plan

Opus International Consultants Ltd 138 Hutt Park Road, Gracefield PO Box 30 845, Lower Hutt 5040 New Zealand t: +64 4 587 0600 f: +64 4 587 0604 w: www.opus.co.nz