optimizing order fulfillment using design for six … order fulfillment using design for six ......
TRANSCRIPT
ISSN 1750-9653, England, UKInternational Journal of Management Science
and Engineering ManagementVol. 3 (2008) No. 2, pp. 83-99
Optimizing order fulfillment using design for six sigma and fuzzy logic∗
Yousef Amer1†, Lee Luong1, Sang-Heon Lee1, M. Azeem Ashraf2
1 School of Advanced Manufacturing and Mechanical Engineering2 School of Electrical and Information Engineering
(Received December 12 2007, Accepted January 22 2008)
Abstract. Supply chain management aims to add value across the supply chain and customer service is nowa major strategic issue. Supply chains are complex and subject to variables of forecast, supply, process, andtransportation which can lead to problems such as the bull whip effect, product lateness, damaged goodsand stock outs. A key issue facing companies today is how to monitor and control performance across thechain. This paper presents Design for Six Sigma (DFSS), which focuses on customer requirements fromthe onset, as an effective methodology for monitoring and controlling supply chain variables, optimizingsupply chain processes and meeting customer’s requirements. By applying DFSS methodology to the keysupply chain process of order fulfillment, a customized representation of detailed activities of order fulfillmentprocesses is demonstrated providing key performance indicators. A theoretical transfer function for predictingthe performance of the perfect order incorporating fuzzy set theory provides a way of monitoring supply chainperformance.
Keywords: Supply chain management (SCM), supply chain strategy, performance measurement, customerservice management, design for six sigma (DFSS), order fulfillment, perfect order and fuzzy set theory
1 Introduction
Supply chain strategy focuses on developing competitive advantage through supply chain related capa-bilities and linking them to the overall business strategy. Through appropriate supply chain management thisallows decisions to be made between competing demands on the supply chain that support the overall businessobjectives.
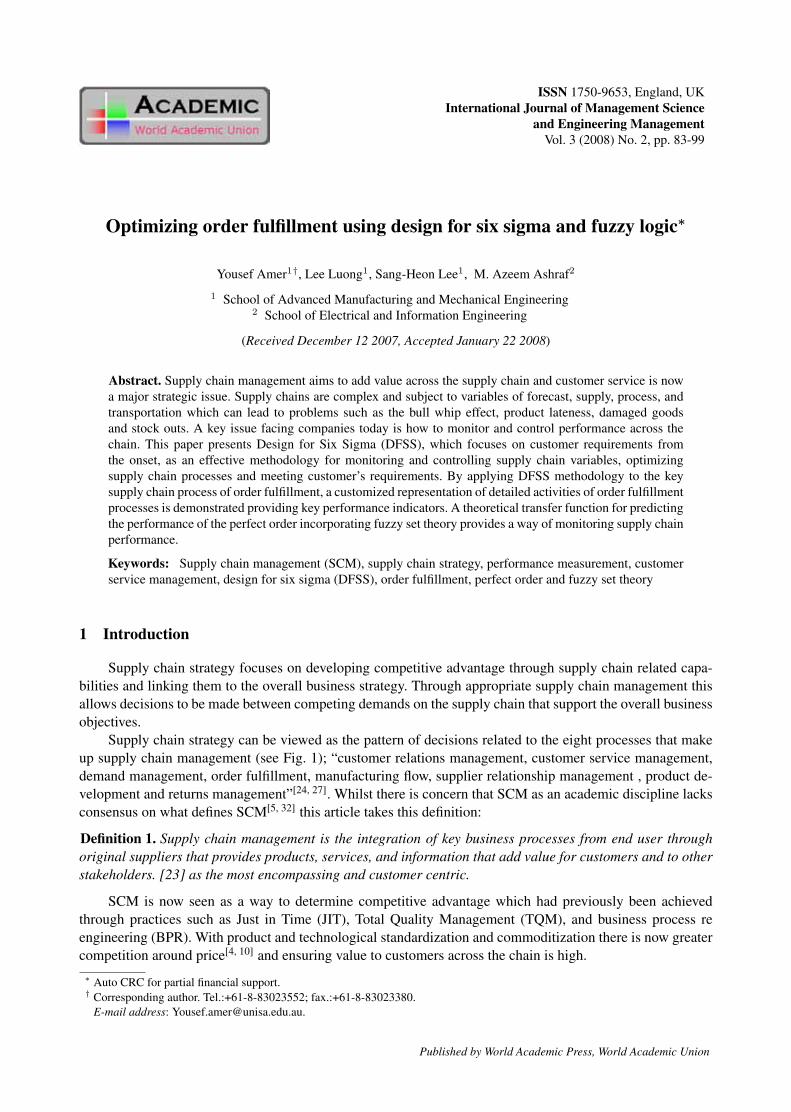
Supply chain strategy can be viewed as the pattern of decisions related to the eight processes that makeup supply chain management (see Fig. 1); “customer relations management, customer service management,demand management, order fulfillment, manufacturing flow, supplier relationship management , product de-velopment and returns management”[24, 27]. Whilst there is concern that SCM as an academic discipline lacksconsensus on what defines SCM[5, 32] this article takes this definition:
Definition 1. Supply chain management is the integration of key business processes from end user throughoriginal suppliers that provides products, services, and information that add value for customers and to otherstakeholders. [23] as the most encompassing and customer centric.
SCM is now seen as a way to determine competitive advantage which had previously been achievedthrough practices such as Just in Time (JIT), Total Quality Management (TQM), and business process reengineering (BPR). With product and technological standardization and commoditization there is now greatercompetition around price[4, 10] and ensuring value to customers across the chain is high.∗ Auto CRC for partial financial support.† Corresponding author. Tel.:+61-8-83023552; fax.:+61-8-83023380.
E-mail address: [email protected].
Published by World Academic Press, World Academic Union

84 Y. Amer & L. Lee & et al: Optimizing order fulfillment
While there is acknowledgment of the potential benefits to be gained there is minimal uptake of strategicand integrated supply chain management across industries and a dearth of research available of companies whohave successfully applied strategy and integration to their supply chain to competitive advantage[9, 10, 20, 21, 26].The companies that are cited for successful integrated SCM are limited, Proctor and Gamble, Wal Mart,Hewlett Packard, Dell Computer, Sun Micro Systems, and Seven Eleven Japan[18]. The few empirical studiesthat have been undertaken describe the fact that end to end transparency of the supply chain is not a realityand that in most cases integration only spans to one tier up and downstream from a firm[29]. Partial integrationrather than holistic integration is advocated by some[2]. Generally the literature describes a theoretical idealwhich is not backed by empirical evidence[13] with calls for more understanding of the diversity of supplychain management and managerial approaches and mechanisms for dealing with integration. Taking incre-mental steps towards integration can lead to competitive gains and focusing on key supply chain processescan be a starting point for improved performance and collaboration between chain members. DFSS whichconsiders the requirements and constraints from all stakeholders as voice of the customer (VOC) at the designonset, and applies a systems engineering approach to functionally decompose the design as per requirementis a promising methodology to employ for supply chain design. One of the difficulties in managing a supplychain is their complexity, having to deal with multiple market segments[28] with each segment a system initself, but having to closely interconnect with dependant sub systems and integrate with the noise and con-ditions imposed by market dynamics. The potential problem associated with the design and the developmentof such systems is the organization and management of system complexity without compromising the cus-tomer requirements. Where other supply chain designs are generic in nature, DFSS allows the flexibility forindividual circumstances. Where general supply chain metrics are being put forward [15] DFSS methodologyprovides a means of creating specific targeted metrics and a way of isolating where quality improvement ef-forts should be focused. The process of order fulfillment has been highlighted as a key metric for supply chainintegration[8]. The customer’s order triggers the supply chain processes into action involving the activity of allthe other supply chain processes through the various functions within a firm. It is often the only interface withcustomers making it a core supply chain process for meeting customer requirements.
This paper is organized as follows; the steps for DFSS for service design are described with the orderfulfillment process identified as critical to customer requirement (CCR). The order fulfillment sub processesand key performance indicator’s (KPI’s) are identified and the order fulfillment variables as key process inputvariables (KPIV’s) and key process output variable (KPOV) is identified, showing ‘perfect order’ as one ofthe CCRs. A transfer function is then developed for the perfect order and a membership function assignedto measure the gap between the current performance and the perfect order. The presented transfer functionof “perfect order” is formulized and refined using fuzzy logic. Finally conclusion and limitations will bediscussed and further recommendations will be made.
2 Design for six sigma
There are two major improvement methodologies under the six sigma umbrella. DMAIC (Define,Measure, Analyse, Improve and Control) is used for continuous improvement of already existing prod-ucts/processes and DFSS is used for designing new product/processes. DFSS is often used when the existingprocesses do not satisfy the customers or are not able to achieve strategic business objectives [12]. DMAIChas been presented as an adjunct to SCOR which lacks quality improvement initiatives and metrics beyondlevel one[3] and has been applied at Samsung where it was modified for supply chain process improvement[33].DFSS has successfully been implemented for product design in a number of leading manufacturing firms suchas Motorola, GE, Allied Signals, Honeywell, and Seagate, while a lack of examples is found of designingservices within a supply chain[17]. Six sigma is a highly disciplined, data-oriented, top-down approach whichexplicitly links the tactical and the strategic. Statistical techniques are used in a systematic way to reducevariation and improve processes, with a strong focus on results [22].
Today the design of services within the supply chain in many industries exhibit deficiencies like modestlevels of quality, ignorance of customer wants, and too much complexity. Such shortcomings add a consider-able amount of non-value added activities to SCM and can mainly be attributed to the lack of a systems design
MSEM email for contribution: [email protected]
International Journal of Management Science and Engineering Management, Vol. 3 (2008) No. 2, pp. 83-99 85
Fig. 1. Supply chain business processes[? ]
methodology. Additionally there are several sources of variation in the service delivery processes which needto be considered while conceptualising a solution. Implementation of DFSS has successfully delivered qualityproducts to customer satisfaction for many industries[17] and the potential exists for it to deliver the sameresults for supply chain design. DFFS activities are classified into four major phases, namely; Identify, Define& Design, Optimize and Validate (IDDOV/IDOV). Going through these phases each CCR is presented as afunction (transfer function) of a number of KPIVs, which can be used to predict the performance level of theCCR.
The following sections present a brief introduction to the sequence of major activities covered underIDOV phases of DFSS in designing a supply chain as shown in Fig. 2.
2.1 Identify
The foundation of a product or service begins with setting the expectations or specifications. DFSSfocuses on determining what customers require, and then translating it into product/service specifications inthe “identify phase”. The major activity in this phase, as illustrated in Fig. 2, is the collection and translationof often vague and abstract customer requirements also known as VOC. Using tools like Quality FunctionDeployment (QFD), VOC is translated into design specifications termed as CCRs, comprehendible to thesupply chain development/design team[6]. While QFD is the major tool in Identify phase, there are other toolsthat may be used, such as kano model, pareto analysis, affinity diagram, brainstorming and benchmarking[30].
2.2 Design
After having translated the VOC into engineering terms as CCRs, the supply chain development/designteam has the task of proposing and evaluating conceptual solutions to address the above CCRs. Using of the
MSEM email for subscription: [email protected]

86 Y. Amer & L. Lee & et al: Optimizing order fulfillment
Fig. 2. Activities for supply chain design through dfss
‘functional design’ approach of systems engineering and, multiple functional system models (or conceptualsolutions) are proposed in this phase. Each solution is presented as a hierarchy of functional subsystemswithout going into engineering design details. The functional concept designs are evaluated to narrow downsolution options. Measurement metrics and methods to inspect the design are to be verified prior to detaildesigning.
Having narrowed down the number of conceptual solutions, requirements are followed down from topto lowest hierarchical level of the functional system models. As a result of this exercise, the team is ableto translate the high level system CCRs to lower level KPIVs. Using engineering practice and methods likedesign of experiments, mathematical and statistical simulations, and regression analysis predictive transferfunctions are developed to relate the CCRs to KPIVs[30].
2.3 Optimize
Performance of real world products/services is always shadowed with variation. DFSS therefore, stressespredicting and optimizing the probability of the design to meet the required targets (CCRs) given environmen-tal variation, manufacturing variation, and usage variation. Statistical analysis and optimization of the designis necessary to achieve a robust product/service design.
2.4 Validate
At the final stage validations are performed to check that the process is complete, valid and will meetrequirements in practice. It involves verification of the design to ensure that it meets the set requirements;
MSEM email for contribution: [email protected]

International Journal of Management Science and Engineering Management, Vol. 3 (2008) No. 2, pp. 83-99 87
assessment of performance, reliability, capability, etc. At this stage prototyping/ simulation may be used totest the product/service operation. If this stage suggests that the design of the product/service does not or maynot meet the required capability, then it is necessary to retract back through the earlier stages of design oroptimize. If the validation results are satisfactory, development of a process control plan for the mean andvariance of CCRs[30] are initiated.
3 Implementation of dfss steps to supply chain design.
As depicted in Fig. 3, the aforementioned DFSS methodology is used to tabulate activities leading todetail the design of a supply chain core process. The overall supply chain is represented by 8 core processes[24].Each core process presents a complex system in itself. Since each core process requires a dedicated designeffort, in this study the key core process ‘order fulfillment’ (OF) is selected.
Fig. 3. ‘order fulfillment’ design activity flow.
3.1 VOC
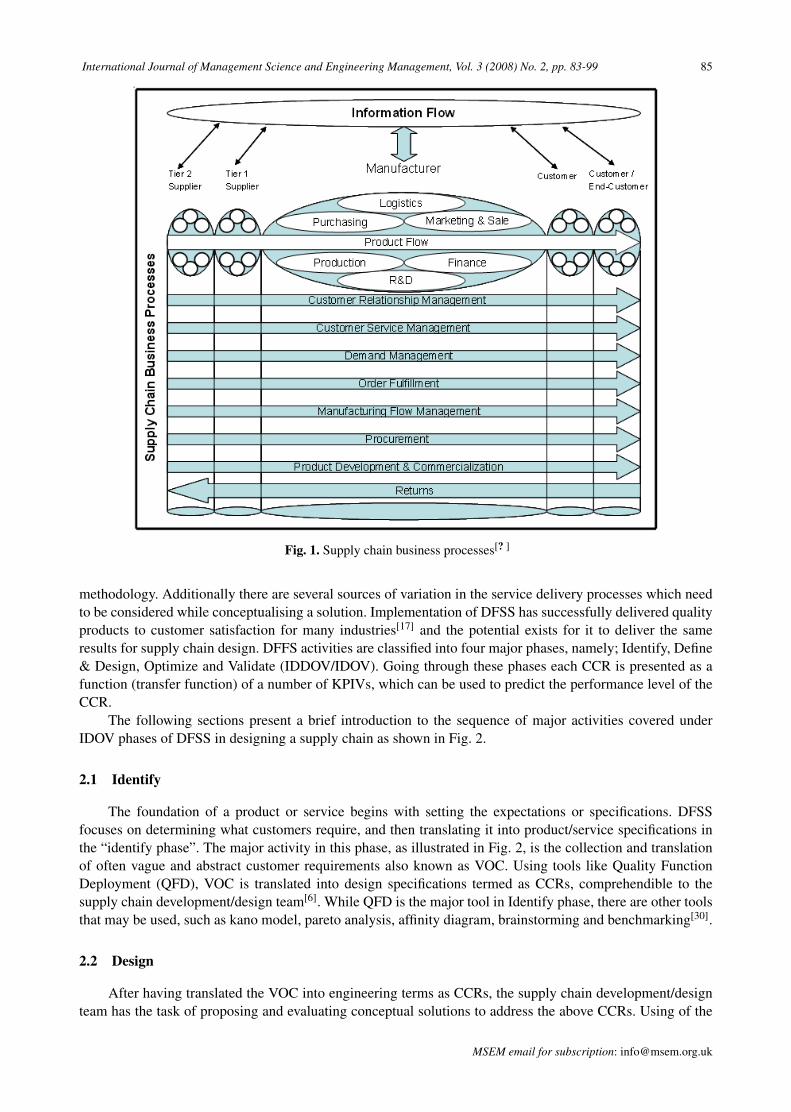
VOC can be initiated from both the internal and external customers of the supply chain. The supply chaindevelopment/design team identifies the customers potential needs, enlists and prioritizes their expectationsthrough data collected from customer interviews, focus groups, surveys, complaint data and enhancementrequest or through market research. Using tools like QFD, cause & effect (fishbone), system and serviceprocess structure, VOC are used to iteratively derive design specifications. Fig. 4 contains a first level QFDwhich identifies order fulfillment as a CCR with Fig. 5 showing a fishbone analysis of order fulfillment.
MSEM email for subscription: [email protected]
88 Y. Amer & L. Lee & et al: Optimizing order fulfillment
Fig. 4. A first level qfd for scm
Fig. 5. A fishbone analysis of order fulfillment
3.2 Voc translation
From a first level QFD, as depicted in Fig. 4, the major variables (how’s) to be controlled are on timedelivery, quality (undamaged deliveries), and quantity (meet demand quantity). A further analysis of the sup-ply chain structure is carried out below to link the above variables to supply chain system hierarchy. Fig. 6represents a structure of supply chain showing order fulfillment amongst other core processes.
Unlike product design, services within a supply chain are best represented by the flow of activities ad-dressing each core process. Arranging ‘order fulfillment’ as a sequence of activities and using the outcomessurfacing from the above steps, the design can list KPIV’s and KPOV’s at each ‘order fulfillment step’. Fig. 7presents a process flow for ‘order fulfillment’ with major KPIV’s and KPOV’s listed for each step.
MSEM email for contribution: [email protected]

International Journal of Management Science and Engineering Management, Vol. 3 (2008) No. 2, pp. 83-99 89
Fig. 6. A customised representation of detailed activities of ccr order fulfillment
Fig. 7. Order fulfillment process flow with kpiv’s/kpov
3.3 CCR-order fulfillment
As depicted in Fig. 7, the Order fulfillment process can be described by a sequence of sub-processes, suchas Order entry, order processing, Start manufacture, Fill order, delivery, Customer receipt, and Post deliveryactivities. DFSS can be used to develop performance targets related to CCR’s of these sub-processes. Throughbrainstorming, the supply chain development/design team lists the KPIV’s shown under each process step.KPOV’s for each sub-process are also determined and listed on top of the process flow.
The overall KPOV for the order fulfillment process is best described as the “perfect order”. Its elementson-time delivery, quantity of delivered order and quality of delivered order, as identified in the KPIV’s, makethe “perfect order” the key metric for monitoring the order fulfillment variables of forecast, supply, processand transportation.
The Perfect order is represented as the Equation
PerfectOrder = f [Delivery T ime (DT ), Quantity Delivered Qty), Quality (Qual)] (1)
MSEM email for subscription: [email protected]

90 Y. Amer & L. Lee & et al: Optimizing order fulfillment
A marginally short or over order or a slight decline in the delivered quantity, or slight delayed/earlydelivery may raise alarm if the factors are measured in specific metrics. In real world metrics to measurethe performance or customer’s level of satisfaction from the “perfect order”, DT, Qty, and Qual is a subjec-tive matter. Therefore the above equation (transfer function relating Perfect Order to DT, Qty and Qual) isoptimized with use of fuzzy logic.
4 Application of fuzzy logic to transfer function
A transfer function is a mathematical representation of the relationship between the input and output ofa system or a process. It facilitates the DFSS optimization of process output by defining the true relation-ship between input variables and the output. Optimization in this context means minimizing the requirementvariability and shifting its mean to some desired target value specified by the customer. The transfer func-tion presented in Equation 1 of “perfect order” is formulized and refined with the use of fuzzy logic. Usuallytransfer functions resulting from DFSS implementation are expected to have a mathematical representation.However, in this research the refined transfer function is presented as sets (sequences) of fuzzy logic rulesevaluated using the fuzzy logic toolbox in MATLAB.
4.1 Fuzzy logic - a brief introduction
Fuzzy logic[34] describes subsets where the transition between full membership and non membershipis gradual rather than abrupt. Most groups of objects in the real world have a fuzzy nature not having pre-cise criteria for membership, e.g. functions can assume values between 0 and 1 depending on the degree ofmembership of the element in the set which gives the advantage of being able to formalize judgment withoutresorting to an artificial process of making precise judgment. In other words, partial membership means anelement can fully belong to a set, partially belong, or not belong at all. Fuzziness seeps into most humanperception and fuzzy logic copes with these uncertainties and incomplete understanding, helping to deal withparameters that are difficult to express in a quantitative or numerical measure[11].
Qualitative measures often need to be translated into quantitative measures. For example, the qualita-tive measure of customer responsiveness can be translated into the quantitative measures of fill rate, productlateness, and lead time[7]. Essentially vague and subjective information often found in the fuzzy supply chainenvironment of variability, complexity and constraints make it a difficult environment to control and improve.Therefore modeling with fuzzy set theory is a useful performance monitoring tool to incorporate.
A literature review of papers related to SCM and fuzzy logic show fuzzy logic has been applied foranalysing and monitoring performance of suppliers[25], developing models for strategy related performanceoutcomes[14], the use of fuzzy set and weighted averages for SCM, intangible and tangible performancemeasurement[14], screening suppliers[31], combined with QFD to improve logistics processes and customersatisfaction[4], and in a multicriteria decision making procedure for assessment of supplier performance[16].
Fuzzy inference is the process of formulating the mapping from a given input to an output using fuzzylogic (major stages being fuzzification, rule evaluation and aggregation, and defuzzification). The mapping ofdefuzzified results onto the problem situation then provides a basis from which decisions can be made. Thereare two types of fuzzy inference systems that can be implemented in the Fuzzy Logic Toolbox: Mamdani-typeand Sugeno-type[1].
The two types differ in the way output is determined. In the Mamdani-type, after the aggregation processthe output membership function of the output variable (Fig. 12) is a fuzzy set, while a Sugeno-type usesa constant value (singleton) as the output membership function. The first two parts of the fuzzy inferenceprocess, fuzzifying the inputs and rule evaluation and aggregation are exactly the same. The main differencebetween Mamdani and Sugeno is that the Sugeno output membership functions are either linear or constant[19].
Since performance or satisfaction level of a perfect order cannot be judged in terms of discrete values,a Mamdani-type inference system is selected for evaluating and aggregating the fuzzy rules in this case. Thesteps for assessing the “perfect order” using the fuzzy inference system are fuzzification, rule evaluation anddefuzzification.
MSEM email for contribution: [email protected]

International Journal of Management Science and Engineering Management, Vol. 3 (2008) No. 2, pp. 83-99 91
4.2 Fuzzification
The fuzzification process is performed during run time and consists of assigning membership degreesbetween 0 and 1 to the crisp inputs of delivery time, quantity and quality.
4.3 Rule evaluation
The rule evaluation process consists of using the fuzzy value obtained during fuzzification and evaluatingthem via the rule base in order to obtain a fuzzy value for the output. The rule evaluation follows the formof if (condition x) and (condition y) then (result z) rules are applied. Basically the use of linguistic variablesand fuzzy IF-THEN- rules utilize the tolerance for imprecision and uncertainty mimicking the ability of thehuman mind to summarize data and focus on decision-relevant information and are generated from expertknowledge.
4.4 Defuzzification
The fuzzy inference system using Mamdani’s fuzzy implication rule determines the appropriate fuzzymembership value. The defuzzification process consists of combining the fuzzy values obtained from the ruleevaluation step and calculating the reciprocal in order to get one and only one crisp value that the outputshould be equal to. The output ‘order’ is evaluated in relation to the crisp value and translated into linguisticterms (see Tab. 4).
4.5 Fuzzification of perfect order transfer function
Fig. 8 depicts the empirical transfer function from equation (1) as a fuzzy logic system with inputs andoutput being fuzzified using appropriate membership functions. The following sections narrate each compo-nent of the system.
Fig. 8. Graphic layout of transfer function in fuzzy format.
4.5.1 Delivery time
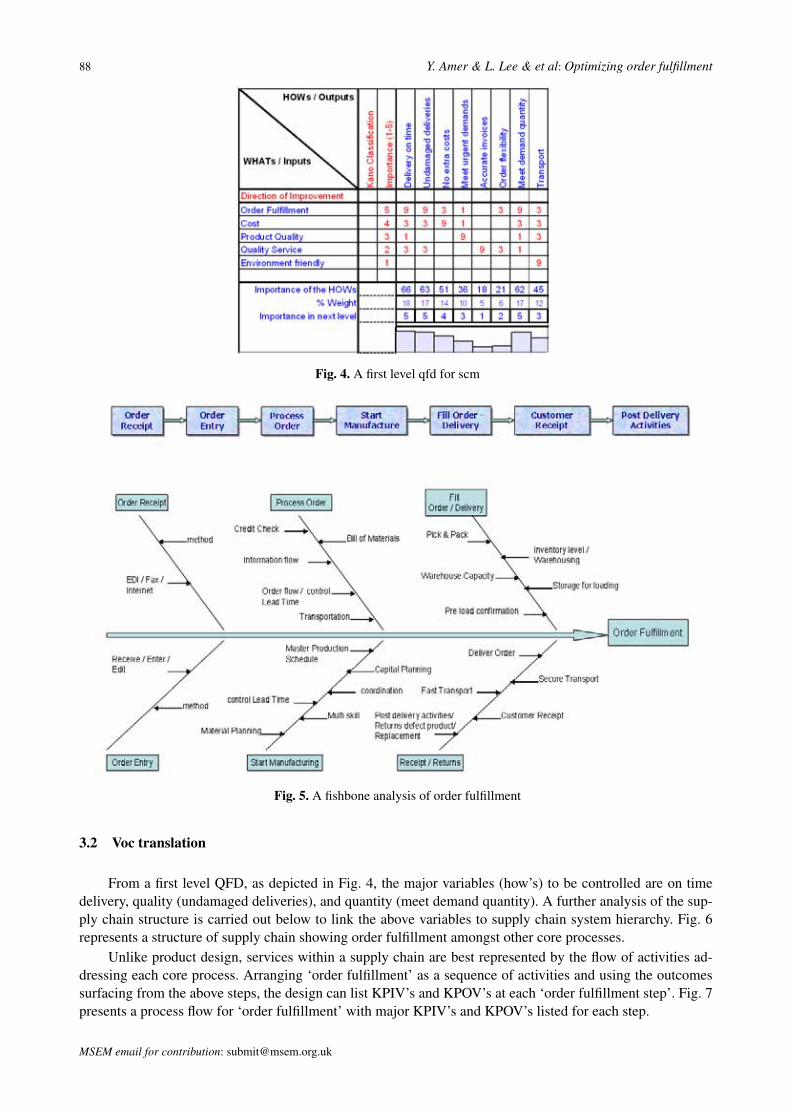
Order delivery time is measured and evaluated based on a range from the number of days earlier or laterthan the promised/expected delivery date. The categories in the measure are: ‘fail’, ‘very early’, ‘acceptableearly’, ‘optimum’, ‘acceptable late’, ‘late’ and ‘very late’ performance, see Tab. 1. Any delivery earlier or laterthan four days fails and is rejected. ‘Very early delivery’ is considered to be unacceptable due to inventoryrequirements of space and labour and associated inventory costs. ‘Very Late’ delivery can lead to delays in
MSEM email for subscription: [email protected]
92 Y. Amer & L. Lee & et al: Optimizing order fulfillment
production which affects downstream members of the chain and leads to longer production/process cycles,customer dissatisfaction and loss of future sales. This impacts on business and financial outcomes and isunacceptable. Both indicate urgent action is required to improve performance.
‘Acceptable early’ and ‘acceptable late’ indicate that the supplier is not able to deliver on the expectedtime but within an acceptable time frame and requires performance improvement in the near future. ‘Optimum’standard indicates that the supplier is performing well. Furthermore, Fig. 9 shows the fuzzy sets delivery timethat represents the standard in degree of membership. For the fail standard, the degree of membership is 0,while the optimum standard has a degree of membership of 1. The rest of the standards are represented withinthe range 0 to 1 degree of membership with the boundaries between the standards graded. This provides thefuzzy set sensitivity to the membership function by providing degrees of closeness to the required value of theperfect order.
Fig. 9. Input variable “delivery time”
Table 1. Delivery time measurement
Fuzzy Linguistic Term Range (Days)1 Fail More than −42 Very Early From −4 to −23 Early From −3 to −14 Acceptable Early From −2 to 05 Optimum From −1 to 16 Acceptable Late From 0 to 27 Late From 1 to 38 Very Late Form 2 to 49 Fail More than 4
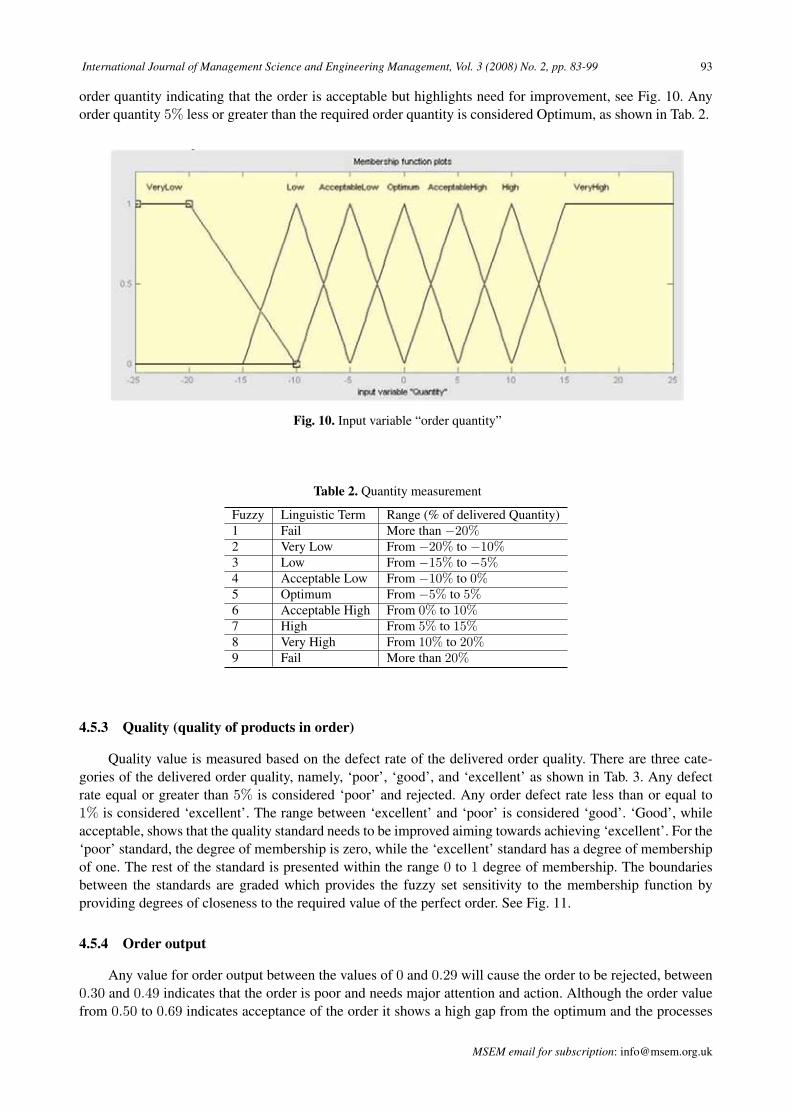
4.5.2 Quantity
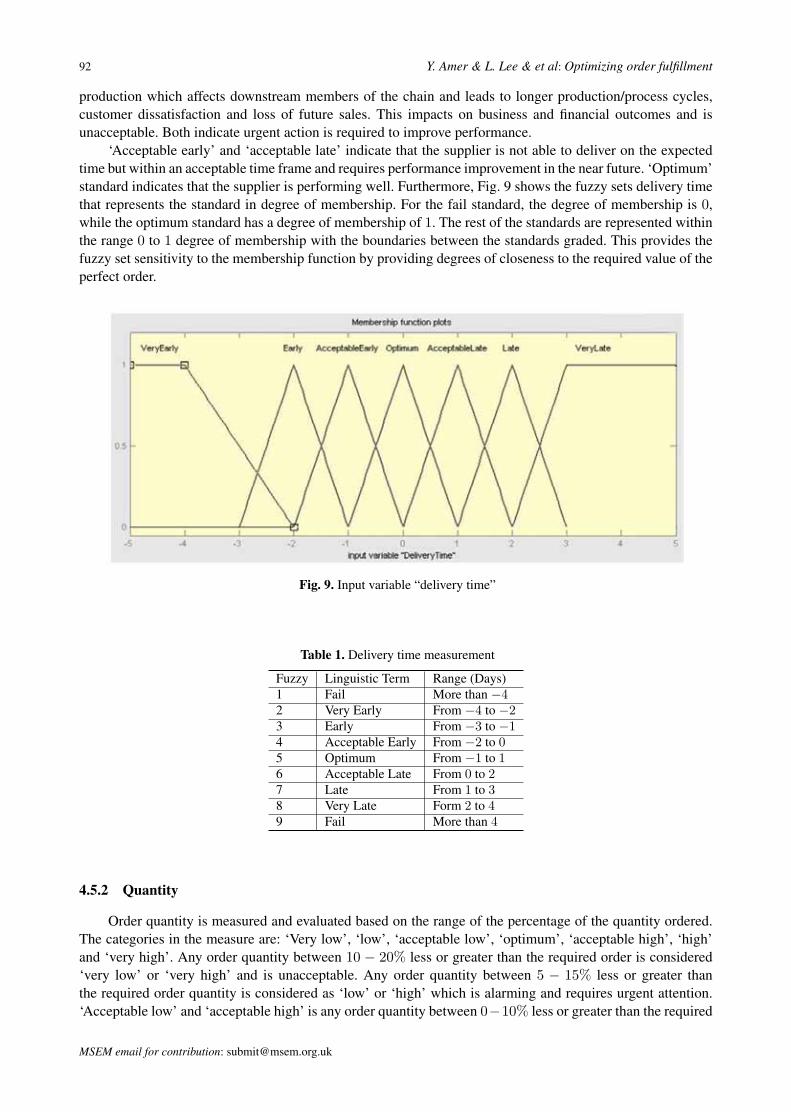
Order quantity is measured and evaluated based on the range of the percentage of the quantity ordered.The categories in the measure are: ‘Very low’, ‘low’, ‘acceptable low’, ‘optimum’, ‘acceptable high’, ‘high’and ‘very high’. Any order quantity between 10 − 20% less or greater than the required order is considered‘very low’ or ‘very high’ and is unacceptable. Any order quantity between 5 − 15% less or greater thanthe required order quantity is considered as ‘low’ or ‘high’ which is alarming and requires urgent attention.‘Acceptable low’ and ‘acceptable high’ is any order quantity between 0−10% less or greater than the required
MSEM email for contribution: [email protected]
International Journal of Management Science and Engineering Management, Vol. 3 (2008) No. 2, pp. 83-99 93
order quantity indicating that the order is acceptable but highlights need for improvement, see Fig. 10. Anyorder quantity 5% less or greater than the required order quantity is considered Optimum, as shown in Tab. 2.
Fig. 10. Input variable “order quantity”
Table 2. Quantity measurement
Fuzzy Linguistic Term Range (% of delivered Quantity)1 Fail More than −20%2 Very Low From −20% to −10%3 Low From −15% to −5%4 Acceptable Low From −10% to 0%5 Optimum From −5% to 5%6 Acceptable High From 0% to 10%7 High From 5% to 15%8 Very High From 10% to 20%9 Fail More than 20%
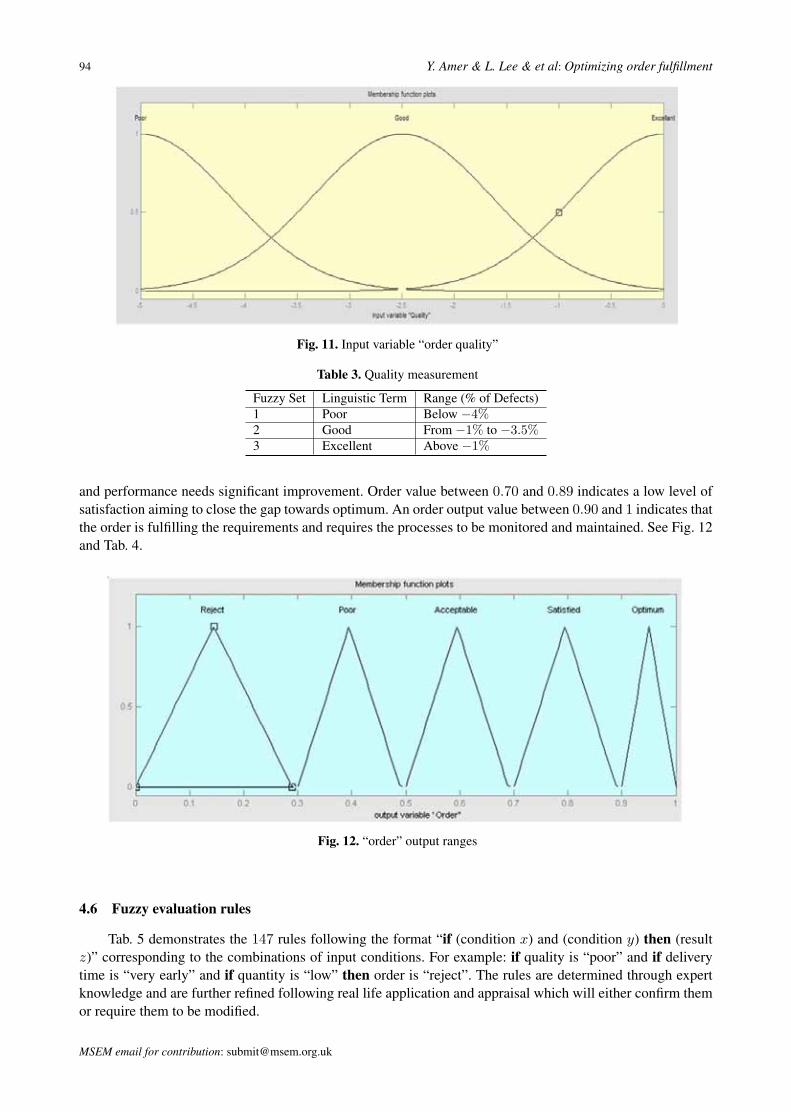
4.5.3 Quality (quality of products in order)
Quality value is measured based on the defect rate of the delivered order quality. There are three cate-gories of the delivered order quality, namely, ‘poor’, ‘good’, and ‘excellent’ as shown in Tab. 3. Any defectrate equal or greater than 5% is considered ‘poor’ and rejected. Any order defect rate less than or equal to1% is considered ‘excellent’. The range between ‘excellent’ and ‘poor’ is considered ‘good’. ‘Good’, whileacceptable, shows that the quality standard needs to be improved aiming towards achieving ‘excellent’. For the‘poor’ standard, the degree of membership is zero, while the ‘excellent’ standard has a degree of membershipof one. The rest of the standard is presented within the range 0 to 1 degree of membership. The boundariesbetween the standards are graded which provides the fuzzy set sensitivity to the membership function byproviding degrees of closeness to the required value of the perfect order. See Fig. 11.
4.5.4 Order output
Any value for order output between the values of 0 and 0.29 will cause the order to be rejected, between0.30 and 0.49 indicates that the order is poor and needs major attention and action. Although the order valuefrom 0.50 to 0.69 indicates acceptance of the order it shows a high gap from the optimum and the processes
MSEM email for subscription: [email protected]
94 Y. Amer & L. Lee & et al: Optimizing order fulfillment
Fig. 11. Input variable “order quality”
Table 3. Quality measurement
Fuzzy Set Linguistic Term Range (% of Defects)1 Poor Below −4%2 Good From −1% to −3.5%3 Excellent Above −1%
and performance needs significant improvement. Order value between 0.70 and 0.89 indicates a low level ofsatisfaction aiming to close the gap towards optimum. An order output value between 0.90 and 1 indicates thatthe order is fulfilling the requirements and requires the processes to be monitored and maintained. See Fig. 12and Tab. 4.
Fig. 12. “order” output ranges
4.6 Fuzzy evaluation rules
Tab. 5 demonstrates the 147 rules following the format “if (condition x) and (condition y) then (resultz)” corresponding to the combinations of input conditions. For example: if quality is “poor” and if deliverytime is “very early” and if quantity is “low” then order is “reject”. The rules are determined through expertknowledge and are further refined following real life application and appraisal which will either confirm themor require them to be modified.
MSEM email for contribution: [email protected]

International Journal of Management Science and Engineering Management, Vol. 3 (2008) No. 2, pp. 83-99 95
Table 4. Ranges for “order” output and linguistic value
Linguistic Value ScoresOptimum 0.90 1.00Satisfied 0.70 0.89Acceptable 0.50 0.69Poor 0.30 0.49Reject 0.00 0.29
Table 5. Fuzzy rules for quality “poor”, “good” and “excellent”
Quality “Poor”````````````Quality
Delivery timeVery Early Early
AcceptableEarly Optimum
AcceptableLate Late Very Late
Very Low Reject Reject Reject Reject Reject Reject RejectLow Reject Reject Reject Reject Reject Reject Reject
Acceptable Low Poor Poor Poor Poor Poor Poor PoorOptimum Poor Poor Poor Poor Poor Poor Poor
Acceptable High Poor Poor Poor Poor Poor Poor PoorHigh Poor Poor Poor Poor Poor Poor Poor
Very High Reject Reject Reject Reject Reject Reject RejectQuality “Good”
````````````QualityDelivery time
Very Early EarlyAcceptableEarly Optimum
AcceptableLate Late Very Late
Very Low Poor Poor Poor Poor Poor Poor RejectLow Poor Acceptable Acceptable Acceptable Acceptable Poor Reject
Acceptable Low Poor Acceptable Acceptable Acceptable Acceptable Poor RejectOptimum Acceptable Acceptable Acceptable Satisfied Acceptable Poor Reject
Acceptable High Poor Acceptable Acceptable Acceptable Acceptable Poor RejectHigh Poor Poor Acceptable Satisfied Acceptable Poor Reject
Very High Poor Poor Poor Acceptable Poor Poor RejectQuality “Excellent”
````````````QualityDelivery time
Very Early EarlyAcceptableEarly Optimum
AcceptableLate Late Very Late
Very Low Reject Poor Poor Acceptable Acceptable Poor RejectLow Poor Poor Acceptable Acceptable Acceptable Poor Reject
Acceptable Low Poor Acceptable Acceptable Satisfied Acceptable Poor RejectOptimum Acceptable Acceptable Satisfied Optimum Satisfied Poor Reject
Acceptable High Poor Acceptable Acceptable Satisfied Acceptable Poor RejectHigh Reject Poor Acceptable Acceptable Poor Poor Reject
Very High Reject Poor Poor Poor Poor Reject Reject
4.7 Fuzzy solution results
A continuum of fuzzy solutions for equation (1) is presented in Fig. 13 using the fuzzy tool box ofMatlab. The three inputs can be set within the upper and lower specification limits and the output responseis calculated as a score that can be translated into linguistic terms. In this instance the order output of 0.714indicates “satisfied” linguistically from Tab. 4.
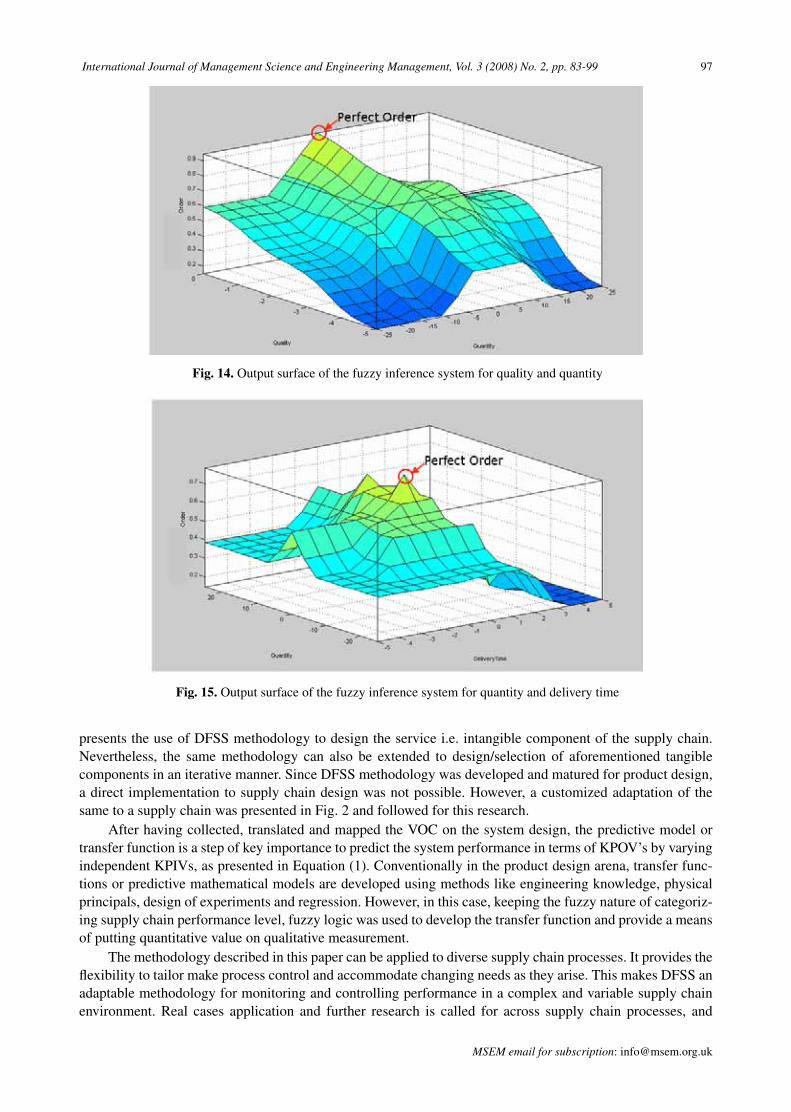
A further graphical representation as a response surface for the order is presented in Fig. 14, 15, 16However, given the limitation of Cartesian axes only two of the three input variables can be selected to mapthe resulting variations in the output (order). In Fig. 14 the perfect order achieves a maximum score at peak ofquality and when the order is delivered to the targeted quantity. As the quality drops, the order score graduallydrops too. As long as the quality is towards the higher end, any drift from the order quantity has relatively lesseffect on the order score.
Fig. 15 depicts the order behavior in relation to variations in quantity and delivery time. Unlike Fig. 14(quantity-quality-order), order scores protrude as a plateau above the remaining surface. A delayed delivery
MSEM email for subscription: [email protected]

96 Y. Amer & L. Lee & et al: Optimizing order fulfillment
Fig. 13. Shows the rule viewer of the fuzzy inference system for the linguistic description and the corresponding mem-bership values for an order output = 0.714 indicating “satisfied” from tab. ??.
reduces the order score drastically as contrast to early delivery. Again as before quantity effects are relativelyless marked. The maximum score for the order occurs when both the quantity and delivery time are at target,which is indicated as a spike.
Fig. 16 presents the order response surface with quality and delivery time as input variables. The relativelysmooth surface depicts the order score to be diminished significantly with delays in delivery time. An earlyorder with poor quality still has the chance of being revised. A delayed order no matter how exact in quantityand best in quality may be of no use to the customer; therefore delays show maximum effect in contrast toearly ones, even though other factors are poor.
5 Discussion and concluding remarks
Unlike product design where the final deliverable is a tangible product, the supply chain can be presentedas an intangible component of service design (i.e. covering a work plan to meet supply targets, managementof information flow, decision making, etc) with the tangible component being the practical implementation ofthe service design (actual hardware like logistics, transportation, information infrastructure, etc). This research
MSEM email for contribution: [email protected]
International Journal of Management Science and Engineering Management, Vol. 3 (2008) No. 2, pp. 83-99 97
Fig. 14. Output surface of the fuzzy inference system for quality and quantity
Fig. 15. Output surface of the fuzzy inference system for quantity and delivery time
presents the use of DFSS methodology to design the service i.e. intangible component of the supply chain.Nevertheless, the same methodology can also be extended to design/selection of aforementioned tangiblecomponents in an iterative manner. Since DFSS methodology was developed and matured for product design,a direct implementation to supply chain design was not possible. However, a customized adaptation of thesame to a supply chain was presented in Fig. 2 and followed for this research.
After having collected, translated and mapped the VOC on the system design, the predictive model ortransfer function is a step of key importance to predict the system performance in terms of KPOV’s by varyingindependent KPIVs, as presented in Equation (1). Conventionally in the product design arena, transfer func-tions or predictive mathematical models are developed using methods like engineering knowledge, physicalprincipals, design of experiments and regression. However, in this case, keeping the fuzzy nature of categoriz-ing supply chain performance level, fuzzy logic was used to develop the transfer function and provide a meansof putting quantitative value on qualitative measurement.
The methodology described in this paper can be applied to diverse supply chain processes. It provides theflexibility to tailor make process control and accommodate changing needs as they arise. This makes DFSS anadaptable methodology for monitoring and controlling performance in a complex and variable supply chainenvironment. Real cases application and further research is called for across supply chain processes, and
MSEM email for subscription: [email protected]

98 Y. Amer & L. Lee & et al: Optimizing order fulfillment
Fig. 16. Output surface of the fuzzy inference system for quality and delivery time
from different positions within the chain. The process of order fulfillment was the focus of this paper as it isconsidered as a core supply chain process involving the activity of all the other supply chain processes throughthe various functions within a firm and has been highlighted as key metric for supply chain integration. Furtherresearch should address the strategic outcomes of improved collaborative performance that the methodologycould potentially deliver.
References
[1] Fuzzy logic toolbox user’s guide (for use with matlab). 2005.[2] A. Bask, J. Juga. Semi-integrated supply chains: Towards the new era of supply chain management. International
Journal of Logistics: Research and Applications, 2001, 4(2): 137–152.[3] P. Bolstroff. Putting it all together. in: Chief Logistics Officer, vol. 10, 2003.[4] E. Bottani, A. Rizzi. Strategic management of logistics service: A fuzzy qfd approach. International Journal of
Production Economics, 2006, 103(2): 585–599.[5] K. Burgess, P. Singh, R. Koroglu. Supply chain management; a structured literature review and implications for
future research. International Journal of Operations & Production Managements, 2006, 36(7): 703–729.[6] P. Buss, N. Ivey. Dow chemical design for six sigma rail delivery project. in: Proceedings of the 2001 Winter
Simulation Conference, 2001.[7] D. Chan, K. Yung, A. Ip. An application of fuzzy sets to process performance evaluation. Integrated Manufacturing
Systems, 2002, 13(4): 237–246.[8] K. Croxton. The order fulfillment process. The International Journal of Logistics Management, 2003, 14(1):
19–32.[9] C. Defee, T. Stank. Applying the strategy-structure-performance paradigm to the supply chain environment. The
International Journal of Logistics Management, 2005, 16(1): 28–50.[10] D.Power. Supply chain management integration and implementation: a literature review. Supply Chain Manage-
ment: An International Journal, 2005, 10(4): 252–263.[11] D. Dubois, H. Prade. Fuzzy Sets and Systems: Theory and Applications. Academic Press, New York, NY, 1980.[12] G. Eckes. The Six Sigma Revolution. John Wiley & Sons, Chichester, 2001.[13] S. Fawcett, G. Magnan. Supply chain integration: rhetoric or reality? International Journal of Logistics Manage-
ment, 2002, 32(1): 339–61.[14] C. Felix, H. Qi, etc. A conceptual model of performance measurement for supply chains. Management Decisions,
2003, 41(7): 635–642.[15] A. Gunasekaran, C. Patel, R. McGaughey. A framework for supply chain performance measurement. International
Journal of Production Economics, 2004, 87: 333–347.[16] N. Gunasekaran, S. Rathesh, etc. Optimizing supply chain management using fuzzy approach. Journal of Manu-
facturing Technology Management, 2006, 17(6): 737–749.
MSEM email for contribution: [email protected]

International Journal of Management Science and Engineering Management, Vol. 3 (2008) No. 2, pp. 83-99 99
[17] B. Haik, D. Roy. Service Design For Six Sigma. John Wiley & Sons, New York, 2005.[18] L. Hau. Creating value through supply chain. Integration Supply Chain Management Review, 2000, 30–36.[19] J. Jang, C. Sun, E. Mizutani. Neuro-Fuzzy and Soft Computing: A Computational Approach to Learning and
Machine Intelligence. Upper Saddle River: Prentice Hall, 1997.[20] C. Joseph. Supply chain logistics initiatives research implications. International Journal of Physical Distribution
& Logistics Management, 2005, 35(3): 148–151.[21] J. Kim, K. Rogers. An object orientated approach to building a flexible supply chain model. International Journal
of Physical Distribution & Logistics Management, 2005, 35(7): 481–502.[22] B. Klefsjo, H. Wiklund, R. Edgeman. Six sigma seen as a methodology for total quality management. Measuring
Business Excellence, 2001, 5(1): 31.[23] D. Lambert, M. C. J. Pagh. Supply chain management: implementation issues and research opportunities. The
International Journal of Logistics Management, 1998, 9(2): 1–19.[24] D. Lambert, T. Pohlen. Supply chain metrics. The International Journal of Logistics Management, 2001, 12(1):
1–19.[25] H. Lau, W. Pang, C. Wong. Methodology for monitoring the supply chain performance: a fuzzy logic approach
logistics. Information Management, 2002, 15(4): 271–280.[26] B. Leavy. Supply chain effectiveness: strategy and integration. Handbook of Business Strategy, 2005, 7(1): 331–
336.[27] R. Lummus, R.Vokurka. Defining supply chain management: a historical perspective and practical guidelines.
Industrial Management and Data Systems, 1999, 99(1): 11–17.[28] D. McKay. How a systems engineering education benefits supply chain managers. Logistics Spectrum, 2003.[29] J. Mouritsen, T. Skjott-Larsen, H. Kotab. Exploring the contours of supply chain management. Integrated Manu-
facturing Systems, 2003, 14(8): 686–695.[30] Rath, Strong. Design for Six Sigma. Rath and Strong Publishers, Massachusetts, 2002.[31] B. Shore, A. Venkatachalam. Evaluating the information sharing capabilities of supply chain partners: A fuzzy
logic model. International Journal of Physical Distribution & Logistics Management, 2003, 33(9): 804–824.[32] J. Storey, C. Emberson, etc. Supply chain management; theory, practices and future challenges. International
Journal of Operations & Production Management, 2006, 26(7): 754–774.[33] H. Yang, B. Choi, etc. Supply chain management six sigma; a management innovation methodology at the samsung
group. Supply Chain Management; An International Journal, 2007, 12(2): 88–95.[34] L. Zadeh. A fuzzy set. Information and Control, 1965, 8: 338–53.
MSEM email for subscription: [email protected]