optimization of weld bead geometry in shielded metal arc ... metal arc welding (smaw), commonly...
TRANSCRIPT
International Journal of Mechanical & Mechatronics Engineering IJMME-IJENS Vol:14 No:04 86
144304-6969-IJMME-IJENS © August 2014 IJENS I J E N S
Optimization of weld bead geometry in Shielded
Metal Arc Welding using Taguchi Based Grey
Relational Analysis S.M.Ravikumar
1*, Dr.P.Vijian
2
1Department of Mechanical Engineering, M.A.M. College of Engineering, Siruganur, Tiruchirappalli, 621 105, India
[email protected] 2 Department of Mechanical Engineering, Government College of Technology,
Coimbatore, 641 013, India, [email protected]
Abstract--- In this paper, the optimization of the Shielded
Metal Arc Welding (SMAW) process parameters in wind
velocity with multi-response criteria using Taguchi
orthogonal array with grey relational analysis is studied.
Based on Taguchi L9 orthogonal array nine experimental
conditions were performed. The input process parameters
such as Welding current, Welding speed and Wind
velocity are selected using L9 orthogonal array to obtain
the desired output i.e., bead width, reinforcement and
depth of penetration. The quality of the weld is evaluated
by studying the features of weld bead geometry. Grey
relational analysis is applied to optimize the input
parameters simultaneously considering output variables.
In addition the analysis of variance (ANOVA) is also
applied to identify the most significant factor. Optimal
result has been verified through additional experiment.
This indicates application feasibility of the Grey-based
Taguchi technique can be improved effectively through
this approach.
Index Term-- Wind velocity, Taguchi Method, Multi-response
optimization, Grey relational analysis.
I. INTRODUCTION
Shielded Metal Arc Welding (SMAW), commonly called
stick, or covered electrode, welding, is a manual welding
process whereby an arc is generated between a flux-covered
consumable electrode and the workpiece. The process uses the
decomposition of the flux covering to generate a shielding gas
and to provide fluxing elements to protect the molten weld-
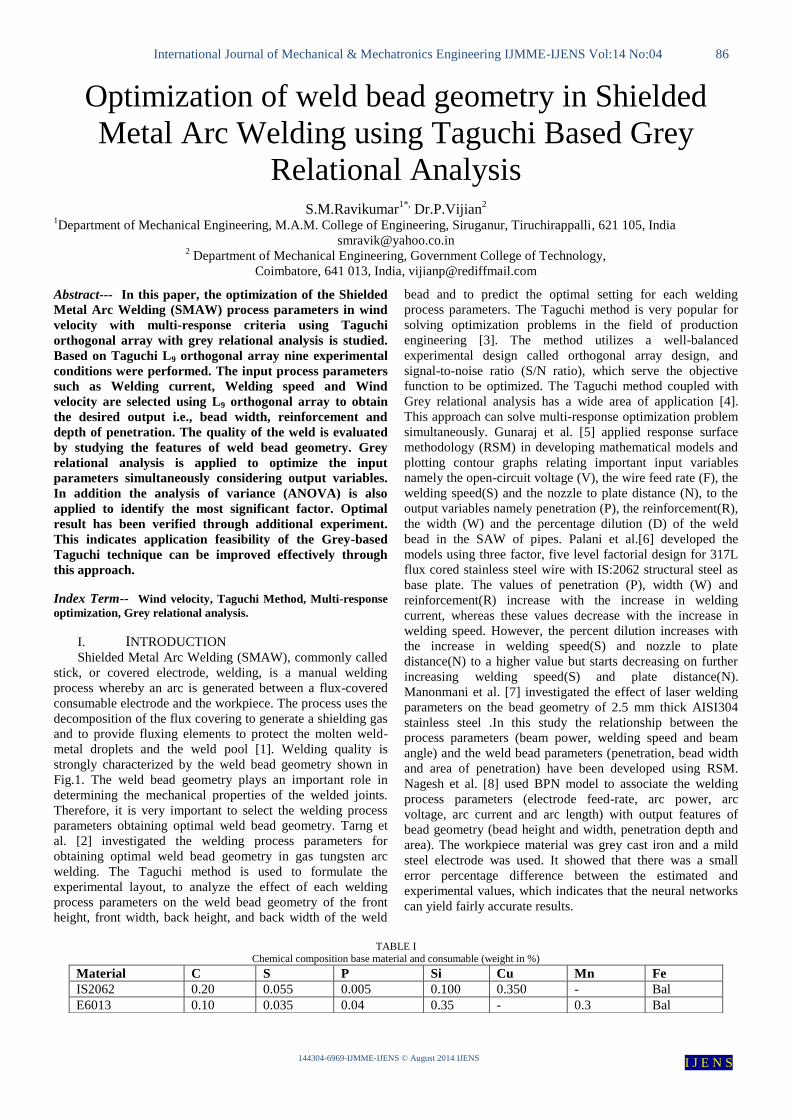
metal droplets and the weld pool [1]. Welding quality is
strongly characterized by the weld bead geometry shown in
Fig.1. The weld bead geometry plays an important role in
determining the mechanical properties of the welded joints.
Therefore, it is very important to select the welding process
parameters obtaining optimal weld bead geometry. Tarng et
al. [2] investigated the welding process parameters for
obtaining optimal weld bead geometry in gas tungsten arc
welding. The Taguchi method is used to formulate the
experimental layout, to analyze the effect of each welding
process parameters on the weld bead geometry of the front
height, front width, back height, and back width of the weld
bead and to predict the optimal setting for each welding
process parameters. The Taguchi method is very popular for
solving optimization problems in the field of production
engineering [3]. The method utilizes a well-balanced
experimental design called orthogonal array design, and
signal-to-noise ratio (S/N ratio), which serve the objective
function to be optimized. The Taguchi method coupled with
Grey relational analysis has a wide area of application [4].
This approach can solve multi-response optimization problem
simultaneously. Gunaraj et al. [5] applied response surface
methodology (RSM) in developing mathematical models and
plotting contour graphs relating important input variables
namely the open-circuit voltage (V), the wire feed rate (F), the
welding speed(S) and the nozzle to plate distance (N), to the
output variables namely penetration (P), the reinforcement(R),
the width (W) and the percentage dilution (D) of the weld
bead in the SAW of pipes. Palani et al.[6] developed the
models using three factor, five level factorial design for 317L
flux cored stainless steel wire with IS:2062 structural steel as
base plate. The values of penetration (P), width (W) and
reinforcement(R) increase with the increase in welding
current, whereas these values decrease with the increase in
welding speed. However, the percent dilution increases with
the increase in welding speed(S) and nozzle to plate
distance(N) to a higher value but starts decreasing on further
increasing welding speed(S) and plate distance(N).
Manonmani et al. [7] investigated the effect of laser welding
parameters on the bead geometry of 2.5 mm thick AISI304
stainless steel .In this study the relationship between the
process parameters (beam power, welding speed and beam
angle) and the weld bead parameters (penetration, bead width
and area of penetration) have been developed using RSM.
Nagesh et al. [8] used BPN model to associate the welding
process parameters (electrode feed-rate, arc power, arc
voltage, arc current and arc length) with output features of
bead geometry (bead height and width, penetration depth and
area). The workpiece material was grey cast iron and a mild
steel electrode was used. It showed that there was a small
error percentage difference between the estimated and
experimental values, which indicates that the neural networks
can yield fairly accurate results.
TABLE I
Chemical composition base material and consumable (weight in %)
Material C S P Si Cu Mn Fe
IS2062 0.20 0.055 0.005 0.100 0.350 - Bal
E6013 0.10 0.035 0.04 0.35 - 0.3 Bal
International Journal of Mechanical & Mechatronics Engineering IJMME-IJENS Vol:14 No:04 87
144304-6969-IJMME-IJENS © August 2014 IJENS I J E N S
Sathiya et al. [9] reported optimization of laser bead on
plate welding parameters for 3.5 kW cooled slab laser using
Taguchi technique. The welding input parameters (beam
power, travel speed and focal position) with output features of
bead geometry (bead width and depth of penetration).The
optimized parameters are evaluated through the
microstructural characterization and hardness measurements
across the weld zone.
Katheresan et al.[10] reported bead-on-plate welds were
carried out on AISI 316L (N) austenitic stainless steel (ASS)
using flux cored arc welding (FCAW) process. The bead on
plates weld was conducted as per L25orthogonal array. In this
paper, the weld bead geometry such as depth of penetration
(DOP), bead width (BW) and weld reinforcement (R) of
AISI 316L (N) ASS are investigated.
Many researchers have applied various optimization
techniques to define the desired output variables through the
developing mathematical models, linear regression models,
ANN models through the relationship between the input and
output variables. Most of the researchers focused the welding
parameters like welding current, travel speed, arc voltage,
wire feed rate, nozzle to plate distance, arc length, electrode
position and open circuit voltage but wind velocity is not net
reported.
In the present study, it is intended to determine the
optimal process condition in SMAW process to yield desired
weld quality in terms of bead geometry and to evaluate the
effect of various parameters on overall feature of bead
geometry. Grey relational analysis is performed to combine the
multiple responses in to one numerical value, rank these
scores, and determine the optimal welding parameter settings.
Also confirmation tests are performed by using experiments.
ANOVA is performed to investigate the more influencing
parameters on the multiple performance characteristics.
II. EXPERIMENTAL PROCEDURE
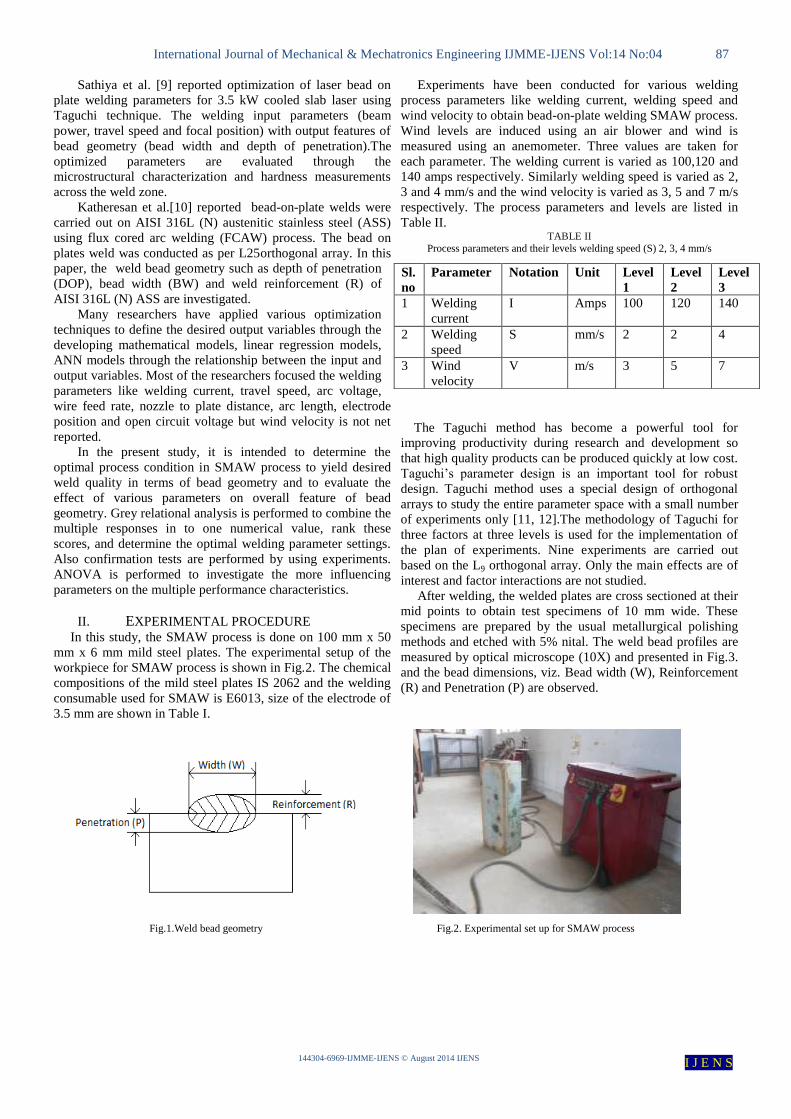
In this study, the SMAW process is done on 100 mm x 50
mm x 6 mm mild steel plates. The experimental setup of the
workpiece for SMAW process is shown in Fig.2. The chemical
compositions of the mild steel plates IS 2062 and the welding
consumable used for SMAW is E6013, size of the electrode of
3.5 mm are shown in Table I.
Experiments have been conducted for various welding
process parameters like welding current, welding speed and
wind velocity to obtain bead-on-plate welding SMAW process.
Wind levels are induced using an air blower and wind is
measured using an anemometer. Three values are taken for
each parameter. The welding current is varied as 100,120 and
140 amps respectively. Similarly welding speed is varied as 2,
3 and 4 mm/s and the wind velocity is varied as 3, 5 and 7 m/s
respectively. The process parameters and levels are listed in
Table II. TABLE II
Process parameters and their levels welding speed (S) 2, 3, 4 mm/s
The Taguchi method has become a powerful tool for
improving productivity during research and development so
that high quality products can be produced quickly at low cost.
Taguchi’s parameter design is an important tool for robust
design. Taguchi method uses a special design of orthogonal
arrays to study the entire parameter space with a small number
of experiments only [11, 12].The methodology of Taguchi for
three factors at three levels is used for the implementation of
the plan of experiments. Nine experiments are carried out
based on the L9 orthogonal array. Only the main effects are of
interest and factor interactions are not studied.
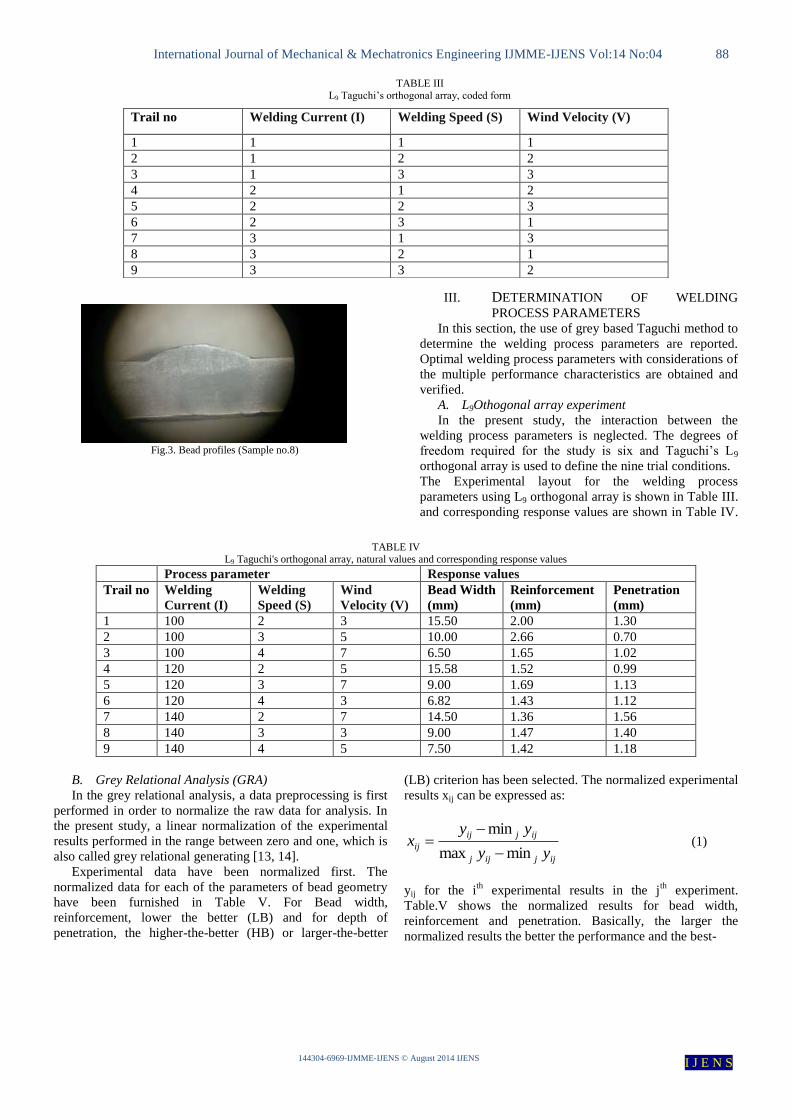
After welding, the welded plates are cross sectioned at their
mid points to obtain test specimens of 10 mm wide. These
specimens are prepared by the usual metallurgical polishing
methods and etched with 5% nital. The weld bead profiles are
measured by optical microscope (10X) and presented in Fig.3.
and the bead dimensions, viz. Bead width (W), Reinforcement
(R) and Penetration (P) are observed.
Fig.1.Weld bead geometry Fig.2. Experimental set up for SMAW process
Sl.
no
Parameter Notation Unit Level
1
Level
2
Level
3
1 Welding
current
I Amps 100 120 140
2 Welding
speed
S mm/s 2 2 4
3 Wind
velocity
V m/s 3 5 7
International Journal of Mechanical & Mechatronics Engineering IJMME-IJENS Vol:14 No:04 88
144304-6969-IJMME-IJENS © August 2014 IJENS I J E N S
TABLE III L9 Taguchi’s orthogonal array, coded form
Fig.3. Bead profiles (Sample no.8)
III. DETERMINATION OF WELDING
PROCESS PARAMETERS
In this section, the use of grey based Taguchi method to
determine the welding process parameters are reported.
Optimal welding process parameters with considerations of
the multiple performance characteristics are obtained and
verified.
A. L9Othogonal array experiment
In the present study, the interaction between the
welding process parameters is neglected. The degrees of
freedom required for the study is six and Taguchi’s L9
orthogonal array is used to define the nine trial conditions.
The Experimental layout for the welding process
parameters using L9 orthogonal array is shown in Table III.
and corresponding response values are shown in Table IV.
TABLE IV L9 Taguchi's orthogonal array, natural values and corresponding response values
Process parameter Response values
Trail no Welding
Current (I)
Welding
Speed (S)
Wind
Velocity (V)
Bead Width
(mm)
Reinforcement
(mm)
Penetration
(mm)
1 100 2 3 15.50 2.00 1.30
2 100 3 5 10.00 2.66 0.70
3 100 4 7 6.50 1.65 1.02
4 120 2 5 15.58 1.52 0.99
5 120 3 7 9.00 1.69 1.13
6 120 4 3 6.82 1.43 1.12
7 140 2 7 14.50 1.36 1.56
8 140 3 3 9.00 1.47 1.40
9 140 4 5 7.50 1.42 1.18
B. Grey Relational Analysis (GRA)
In the grey relational analysis, a data preprocessing is first
performed in order to normalize the raw data for analysis. In
the present study, a linear normalization of the experimental
results performed in the range between zero and one, which is
also called grey relational generating [13, 14].
Experimental data have been normalized first. The
normalized data for each of the parameters of bead geometry
have been furnished in Table V. For Bead width,
reinforcement, lower the better (LB) and for depth of
penetration, the higher-the-better (HB) or larger-the-better
(LB) criterion has been selected. The normalized experimental
results xij can be expressed as:
ijjijj
ijjij
ijyy
yyx
minmax
min
(1)
yij for the ith
experimental results in the jth
experiment.
Table.V shows the normalized results for bead width,
reinforcement and penetration. Basically, the larger the
normalized results the better the performance and the best-
Trail no Welding Current (I) Welding Speed (S) Wind Velocity (V)
1 1 1 1
2 1 2 2
3 1 3 3
4 2 1 2
5 2 2 3
6 2 3 1
7 3 1 3
8 3 2 1
9 3 3 2

International Journal of Mechanical & Mechatronics Engineering IJMME-IJENS Vol:14 No:04 89
144304-6969-IJMME-IJENS © August 2014 IJENS I J E N S
normalized results should be equal to one.
TABLE V Data preprocessing of each performance characteristics (Grey relational generation)
Trail Bead width Reinforcement Penetration
no mm mm mm
1 0.0088 0.5077 0.6977
2 0.6145 0.0000 0.0000
3 1.0000 0.7769 0.3721
4 0.0000 0.8769 0.3372
5 0.7247 0.7462 0.5000
6 0.9648 0.9462 0.4884
7 0.1189 1.3000 1.0000
8 0.7247 0.9154 0.8140
9 0.8899 0.9538 0.5581
Next, the grey relational coefficient is calculated to express
the relationship between the ideal (best) and the actual
normalized experimental results. The grey relational
coefficient ξij for the ith
performance characteristic in the
jth
experiment can be expressed as:
ijijiiji
ijijiijiji
ijxxxx
xxxx
00
00
maxmax
maxmaxminmin
(2)
Where xi
0is the ideal normalized results for i
th performance
characteristics and ζ is the distinguishing coefficient which is
defined in the range 0≤ ζ≤1. In the present study the value of ζ
is assumed as 0.5.
Then, the grey relational grade is computed by averaging
the grey relational coefficient corresponding to each
performance characteristics. The overall evaluation of the
multiple performance characteristics is based on the grey
relational grade, i.e.
m
i
ijjm 1
1 (3)
Where j the grey relational grade for the jth
experiment and
m is the number of performance characteristics.
TABLE VI
Evaluated Grey relational coefficient and Grade values
Trail no Bead width
(mm)
Reinforcement
(mm)
Penetration
(mm)
Grey relational
grade
Rank
1 0.3353 0.5039 0.6232 0.4875 8
2 0.5647 0.3333 0.3333 0.4104 9
3 1.0000 0.6915 0.4433 0.7116 5
4 0.3333 0.8025 0.4300 0.5219 7
5 0.6449 0.6633 0.5000 0.6027 6
6 0.9342 0.9028 0.4943 0.7771 2
7 0.3620 1.0000 1.0000 0.7873 1
8 0.6449 0.8553 0.7288 0.7430 4
9 0.8195 0.9155 0.5309 0.7553 3
Table.VI shows the grey relational grade for each
experiment using L9 orthogonal array. A higher grey
relational grade indicates better product quality. It has been
shown that experiment 7 has the best multiple performance
characteristics among the 9 experiments because it has the
highest grey relational grade as shown in Table.VI. In other
words, optimization of the complicated multiple
performance characteristics can be converted in to the
optimization of a single grey relational grade.
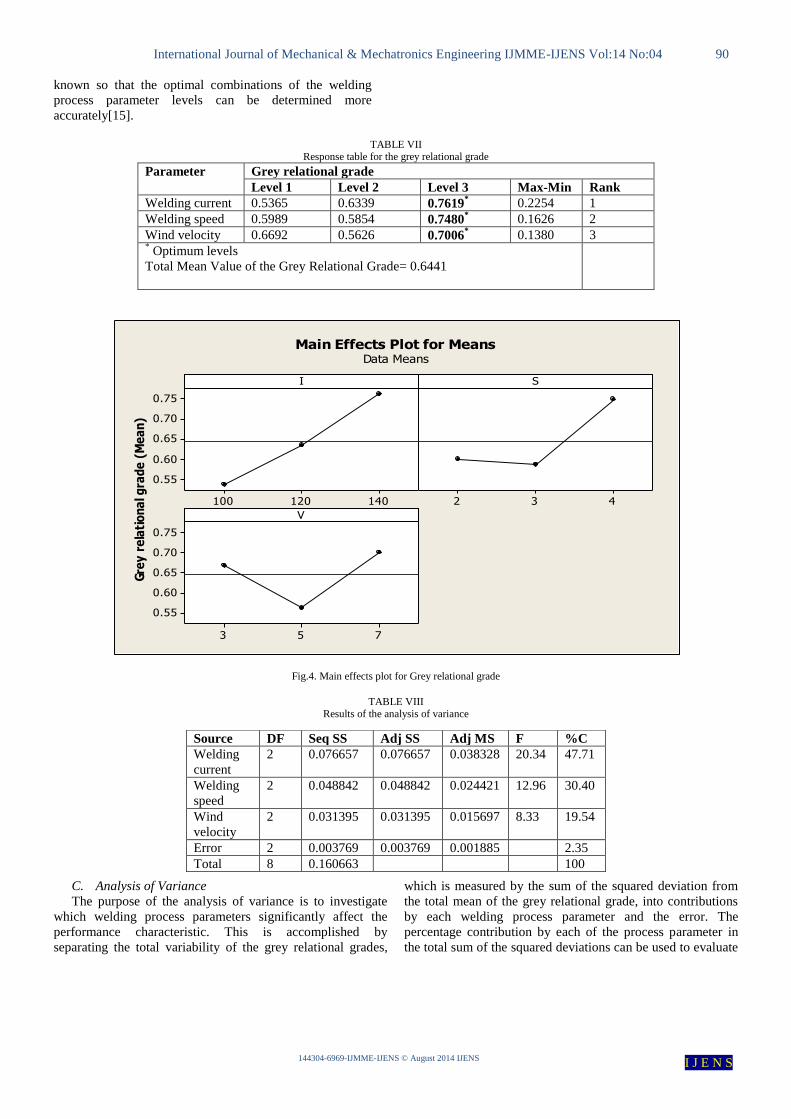
The effect of each welding process parameter on the
grey relational grade at different levels can be separated out
because the experimental design is L9 orthogonal. The
mean of the grey relational grade for each level of the
welding process parameters is summarized and shown in
Table VII. In addition, the total mean of the grey relational
grade for the nine experiments is also calculated and listed
in Table VII. Fig.4 shows the grey relational grade graph
for the levels of welding process parameters. Basically, the
larger the grey relational grade, the better is the multiple
performance characteristics. However, the relative
importance among the welding process parameters for the
multiple performance characteristics will still need to be
International Journal of Mechanical & Mechatronics Engineering IJMME-IJENS Vol:14 No:04 90
144304-6969-IJMME-IJENS © August 2014 IJENS I J E N S
known so that the optimal combinations of the welding
process parameter levels can be determined more
accurately[15].
TABLE VII
Response table for the grey relational grade
Parameter Grey relational grade
Level 1 Level 2 Level 3 Max-Min Rank
Welding current 0.5365 0.6339 0.7619* 0.2254 1
Welding speed 0.5989 0.5854 0.7480* 0.1626 2
Wind velocity 0.6692 0.5626 0.7006* 0.1380 3
* Optimum levels
Total Mean Value of the Grey Relational Grade= 0.6441
Fig.4. Main effects plot for Grey relational grade
TABLE VIII Results of the analysis of variance
C. Analysis of Variance
The purpose of the analysis of variance is to investigate
which welding process parameters significantly affect the
performance characteristic. This is accomplished by
separating the total variability of the grey relational grades,
which is measured by the sum of the squared deviation from
the total mean of the grey relational grade, into contributions
by each welding process parameter and the error. The
percentage contribution by each of the process parameter in
the total sum of the squared deviations can be used to evaluate
140120100
0.75
0.70
0.65
0.60
0.55
432
753
0.75
0.70
0.65
0.60
0.55
I
Gre
y r
ela
tio
na
l gra
de
(M
ea
n)
S
V
Main Effects Plot for MeansData Means
Source DF Seq SS Adj SS Adj MS F %C
Welding
current
2 0.076657 0.076657 0.038328 20.34 47.71
Welding
speed
2 0.048842 0.048842 0.024421 12.96 30.40
Wind
velocity
2 0.031395 0.031395 0.015697 8.33 19.54
Error 2 0.003769 0.003769 0.001885 2.35
Total 8 0.160663 100
International Journal of Mechanical & Mechatronics Engineering IJMME-IJENS Vol:14 No:04 91
144304-6969-IJMME-IJENS © August 2014 IJENS I J E N S
the importance of the process parameter change on the
performance characteristic. In addition, the F-test named after
Fisher can also be used to determine which welding process
parameters have a significant effect on the performance
characteristic. Usually, the change of the welding process
parameter has a significant effect on the performance
characteristic when the F value is large. Table VIII shows the
results of ANOVA analysis.
Results of analysis of variance indicate that welding
current is the most significant welding process parameter
followed by welding speed and wind velocity.
D. Confirmation Experiment
Once the optimal level of welding process parameters is
selected the final step is to predict and verify the improvement
of the performance characteristics using the optimum level of
the welding process parameters. The estimated grey relational
grade
using the optimum level of the welding parameters
can be calculated as
)(1
m
q
i
m
(4)
Where m the total mean of the grey relational grade, is the
mean of the grey relational grade at the optimum level and q is
the number of welding parameters that significantly affects the
multiple performance characteristics. Based on equation (4)
the estimated grey relational grade using the optimal welding
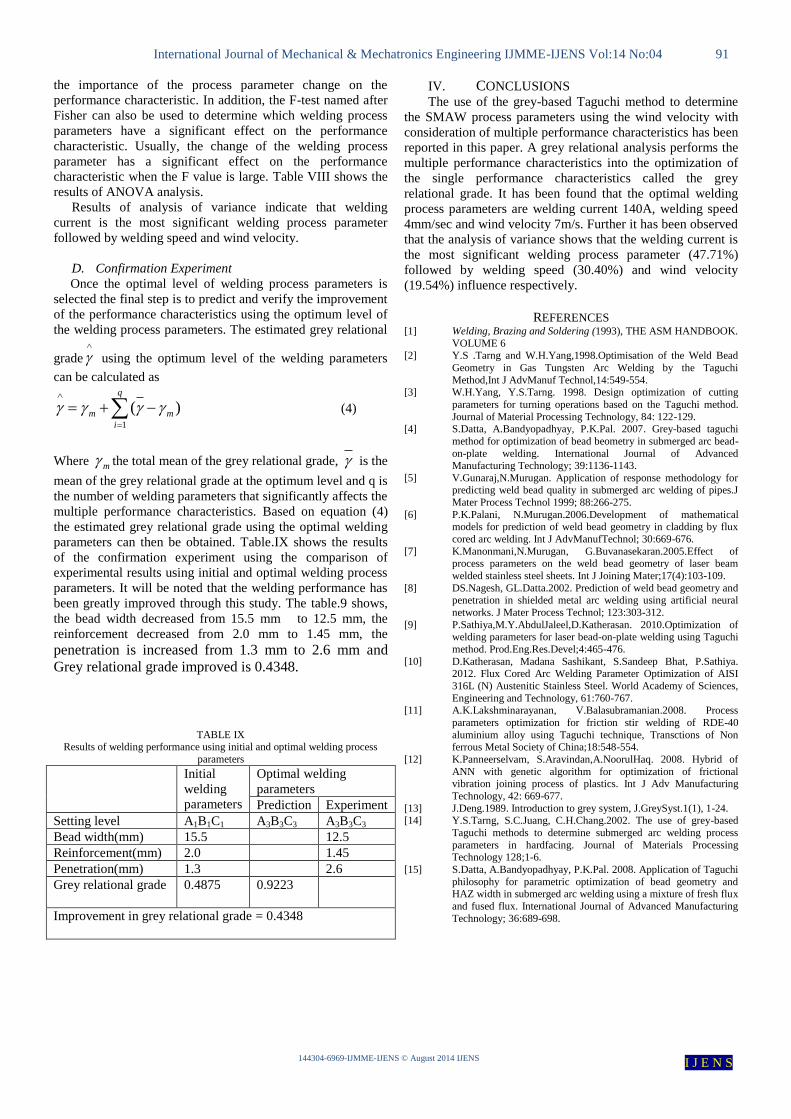
parameters can then be obtained. Table.IX shows the results
of the confirmation experiment using the comparison of
experimental results using initial and optimal welding process
parameters. It will be noted that the welding performance has
been greatly improved through this study. The table.9 shows,
the bead width decreased from 15.5 mm to 12.5 mm, the
reinforcement decreased from 2.0 mm to 1.45 mm, the penetration is increased from 1.3 mm to 2.6 mm and
Grey relational grade improved is 0.4348.
TABLE IX Results of welding performance using initial and optimal welding process
parameters
Initial
welding
parameters
Optimal welding
parameters
Prediction Experiment
Setting level A1B1C1 A3B3C3 A3B3C3
Bead width(mm) 15.5 12.5
Reinforcement(mm) 2.0 1.45
Penetration(mm) 1.3 2.6
Grey relational grade 0.4875
0.9223
Improvement in grey relational grade = 0.4348
IV. CONCLUSIONS
The use of the grey-based Taguchi method to determine
the SMAW process parameters using the wind velocity with
consideration of multiple performance characteristics has been
reported in this paper. A grey relational analysis performs the
multiple performance characteristics into the optimization of
the single performance characteristics called the grey
relational grade. It has been found that the optimal welding
process parameters are welding current 140A, welding speed
4mm/sec and wind velocity 7m/s. Further it has been observed
that the analysis of variance shows that the welding current is
the most significant welding process parameter (47.71%)
followed by welding speed (30.40%) and wind velocity
(19.54%) influence respectively.
REFERENCES
[1] Welding, Brazing and Soldering (1993), THE ASM HANDBOOK.
VOLUME 6 [2] Y.S .Tarng and W.H.Yang,1998.Optimisation of the Weld Bead
Geometry in Gas Tungsten Arc Welding by the Taguchi
Method,Int J AdvManuf Technol,14:549-554. [3] W.H.Yang, Y.S.Tarng. 1998. Design optimization of cutting
parameters for turning operations based on the Taguchi method.
Journal of Material Processing Technology, 84: 122-129. [4] S.Datta, A.Bandyopadhyay, P.K.Pal. 2007. Grey-based taguchi
method for optimization of bead beometry in submerged arc bead-
on-plate welding. International Journal of Advanced Manufacturing Technology; 39:1136-1143.
[5] V.Gunaraj,N.Murugan. Application of response methodology for predicting weld bead quality in submerged arc welding of pipes.J
Mater Process Technol 1999; 88:266-275.
[6] P.K.Palani, N.Murugan.2006.Development of mathematical models for prediction of weld bead geometry in cladding by flux
cored arc welding. Int J AdvManufTechnol; 30:669-676.
[7] K.Manonmani,N.Murugan, G.Buvanasekaran.2005.Effect of process parameters on the weld bead geometry of laser beam
welded stainless steel sheets. Int J Joining Mater;17(4):103-109.
[8] DS.Nagesh, GL.Datta.2002. Prediction of weld bead geometry and penetration in shielded metal arc welding using artificial neural
networks. J Mater Process Technol; 123:303-312.
[9] P.Sathiya,M.Y.AbdulJaleel,D.Katherasan. 2010.Optimization of welding parameters for laser bead-on-plate welding using Taguchi
method. Prod.Eng.Res.Devel;4:465-476.
[10] D.Katherasan, Madana Sashikant, S.Sandeep Bhat, P.Sathiya. 2012. Flux Cored Arc Welding Parameter Optimization of AISI
316L (N) Austenitic Stainless Steel. World Academy of Sciences,
Engineering and Technology, 61:760-767. [11] A.K.Lakshminarayanan, V.Balasubramanian.2008. Process
parameters optimization for friction stir welding of RDE-40
aluminium alloy using Taguchi technique, Transctions of Non ferrous Metal Society of China;18:548-554.
[12] K.Panneerselvam, S.Aravindan,A.NoorulHaq. 2008. Hybrid of
ANN with genetic algorithm for optimization of frictional vibration joining process of plastics. Int J Adv Manufacturing
Technology, 42: 669-677.
[13] J.Deng.1989. Introduction to grey system, J.GreySyst.1(1), 1-24. [14] Y.S.Tarng, S.C.Juang, C.H.Chang.2002. The use of grey-based
Taguchi methods to determine submerged arc welding process
parameters in hardfacing. Journal of Materials Processing Technology 128;1-6.
[15] S.Datta, A.Bandyopadhyay, P.K.Pal. 2008. Application of Taguchi
philosophy for parametric optimization of bead geometry and HAZ width in submerged arc welding using a mixture of fresh flux
and fused flux. International Journal of Advanced Manufacturing
Technology; 36:689-698.