operational performance january’13
DESCRIPTION
OPERATIONAL PERFORMANCE JANUARY’13. Tonnage - MT. COMMODITY-WISE LOADING – FOR THE MONTH OF JAN’13. Tonnage in Lakhs. COMMODITY-WISE REVENUE – FOR THE MONTH OF JANUARY’13. ` - Crores. Commodity wise Net Revenue Including OH. ` - Crores. - PowerPoint PPT PresentationTRANSCRIPT
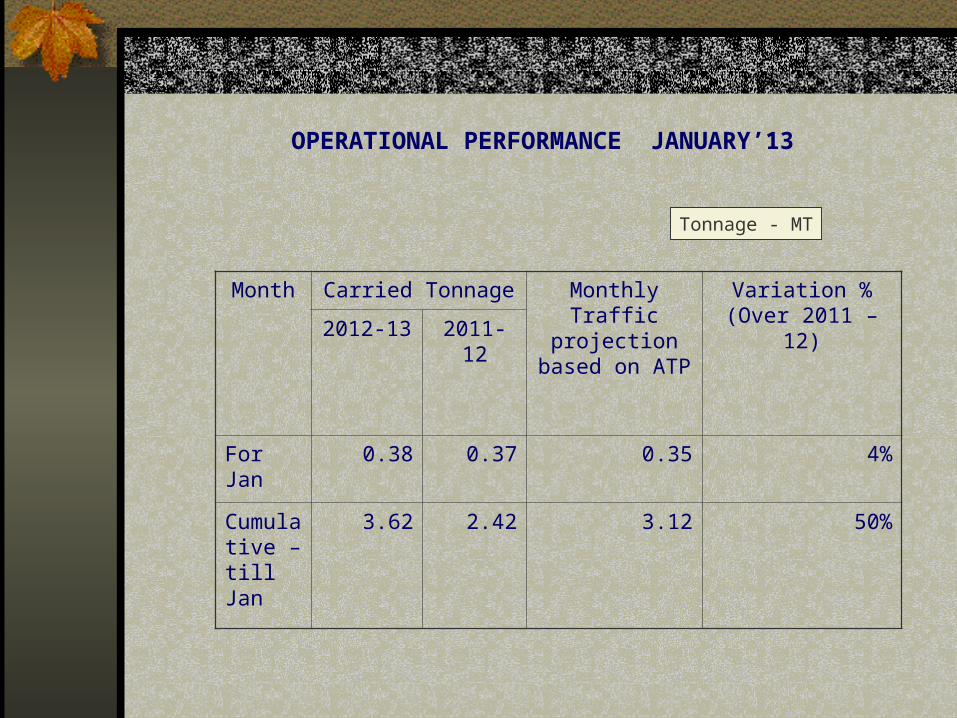
OPERATIONAL PERFORMANCE JANUARY’13
Month Carried Tonnage Monthly Traffic projection based
on ATP
Variation % (Over 2011 – 12)2012-13 2011-12
For Jan 0.38 0.37 0.35 4%
Cumulative – till Jan
3.62 2.42 3.12 50%
Tonnage - MT

COMMODITY-WISE LOADING – FOR THE MONTH OF JAN’13
Particulars Carried Tonnage 2012-13
Carried Tonnage 2011-12
Variation Over
Commodity Jan’13 Apr’12-Jan’13
Jan’12 Apr’11- Jan’12
Last Yr Jan’12
Last Yr
Apr’11-Jan’12
Iron Ore/ Export
Domestic
Total
0.00
0.00
0.00
0.00
0.00
0.00
0.00
0.00
0.00
0.00
4.30
4.30
0%
0%
0%
0%
-100%
-100%
Cement 0.94 8.17 1.00 5.46 -6% 50%
Fertilizer 0.48 5.20 0.80 6.58 -40% -21%
Food Grains 0.05 1.62 0.32 1.62 -84% 0%
LPG/POL 0.22 2.66 0.28 2.95 -19% -10%
Coal 1.97 17.29 1.27 2.67 55% 559%
Gypsum 0.15 0.93 0.00 0.54 0% 73%
Iron Sheet/Wood 0.00 0.00 0.00 0.065 0% -100%
Auto/Cont 0.00 0.0371 0.00432 0.01828 -100% 103%
Total 3.81 36.21 3.67 24.21 4% 50%
Tonnage in Lakhs
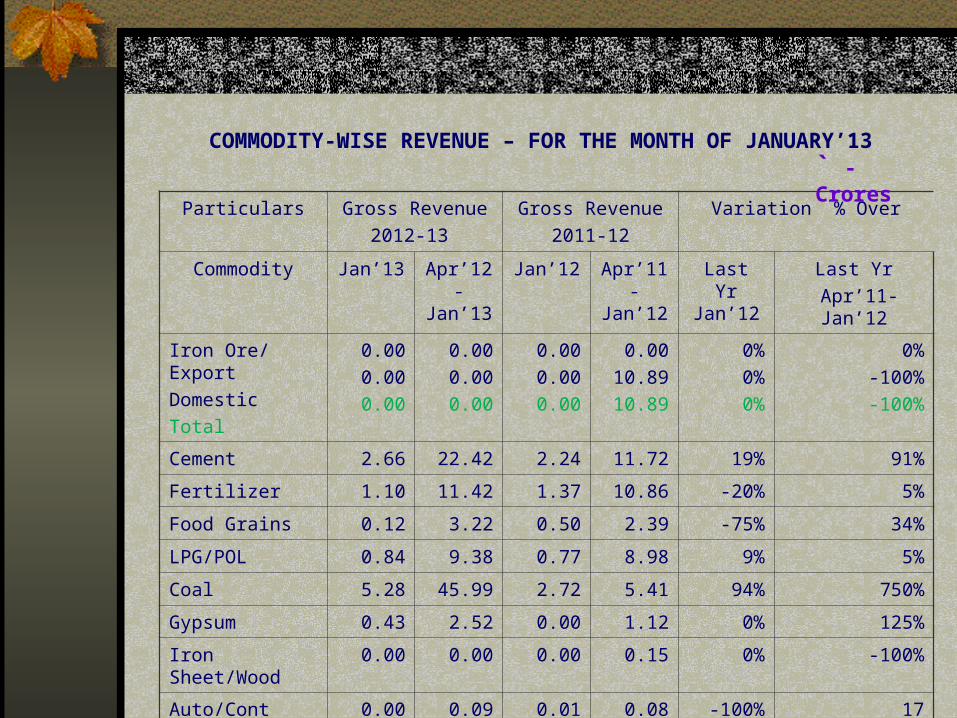
COMMODITY-WISE REVENUE – FOR THE MONTH OF JANUARY’13
Particulars Gross Revenue
2012-13
Gross Revenue
2011-12
Variation % Over
Commodity Jan’13 Apr’12-Jan’13
Jan’12 Apr’11- Jan’12
Last Yr Jan’12
Last Yr
Apr’11-Jan’12
Iron Ore/ Export
Domestic
Total
0.00
0.00
0.00
0.00
0.00
0.00
0.00
0.00
0.00
0.00
10.89
10.89
0%
0%
0%
0%
-100%
-100%
Cement 2.66 22.42 2.24 11.72 19% 91%
Fertilizer 1.10 11.42 1.37 10.86 -20% 5%
Food Grains 0.12 3.22 0.50 2.39 -75% 34%
LPG/POL 0.84 9.38 0.77 8.98 9% 5%
Coal 5.28 45.99 2.72 5.41 94% 750%
Gypsum 0.43 2.52 0.00 1.12 0% 125%
Iron Sheet/Wood 0.00 0.00 0.00 0.15 0% -100%
Auto/Cont 0.00 0.09 0.01 0.08 -100% 17
TOTAL 10.43 95.05 7.61 51.60 37% 84%
` - Crores

Commodity wise Net Revenue Including OH
Particular January 2013 January 2012 Net Rev
Commodity Gross Reve
O&M Cost `. 155/T
* Net Reve
Gross Reve
O&M Cost `.146/T
Net Reve
Variation %
Iron Ore/ Export
Domestic0.00
0.00
0.00
0.00
0.00
0.00
0.00
0.00
0.00
0.00
0.00
0.00
0%
0%
Cement 2.66 1.45 1.21 2.24 1.46 0.78 54%
Fertilizer 1.10 0.74 0.36 1.37 1.17 0.19 -91%
Food Grains
0.12 0.08 0.04 0.50 0.47 0.03 -66%
LPG/POL 0.84 0.35 0.49 0.77 0.40 0.37 33%
Coal 5.28 3.06 2.22 2.72 1.86 0.86 158%
Gypsum 0.43 0.24 0.19 0.00 0.00 0.00 0%
Iron Sheet/ Wood
0.00 0.00 0.00 0.00 0.00 0.00 0%
Auto/Cont 0.00 0.00 0.01 0.01 0.01 0.00 0%
TOTAL 10.43 5.92 4.51 7.61 5.37 2.23 165%
` - Crores
•Jan’13 - Net Revenue Includes Def OH of ` 96 Lakhs , O&M Cost Inclusive of Def OH- ` 180/T•Jan’12 – Net Revenue Includes Def OH of ` 93 Lakhs, O&M Cost Inclusive of Def OH- ` 172/T

Commodity wise Gross & Net Revenue Including OH (Per Tonne)
Particular January 2013 January 2012 Net Rev
Commodity Gross Rev
O&M Cost /T
Net Rev
Gross Rev
O&M Cost /T
Net Rev Variation %
Iron Ore
Export
Domestic
0
0
0
0
0
0
0
0
0
0
0
0
0%
0%
Cement 284 155 129 225 146 79 63%
Fertilizer 230 155 75 170 146 24 -209%
Food Grains 232 155 77 153 146 7 -1090%
LPG/POL 375 155 220 278 146 132 66%
Coal 268 155 113 215 146 69 64%
Gypsum 279 155 124 0 0 0 0%
Iron Sheet /Wood
0 0 0 0 0 0 0%
Auto/Cont 0 0 0 327 146 181 -100%
Amt - `
•Jan’13 - Net Revenue Includes Def OH of ` 25/T , O&M Cost Inclusive of Def OH - ` 180/T•-Jan’12 – Net Revenue Includes Def OH of ` 25/T, O&M Cost Inclusive of Def OH - `172/T

Operating Ratio for the month of January 2013For Jan
2013To End of Jan 2013
Gross Revenue 10.43 95.05
Total Income 10.43 95.05
Operating Expenses
O&M Costs (Inc of Def. OH) 7.49 72.55
Administrative Expenses 0.94 1.65
Depreciation 2.83 28.3
Total Expenses (i) 11.26 102.50
Operating Ratio (%) 108% 108%
Cost of Maintenance works (ii) 1.07 1.93
Total Expenses (I) + (II) 12.33 104.43
Operating Ratio (Cumulative) 118% 110%
Surplus/Deficit -1.90 -9.38
Surplus % -18% -10%
` - Crores
NOTE : In O&M costs, cost of fuel is calculated as per service & direction wise
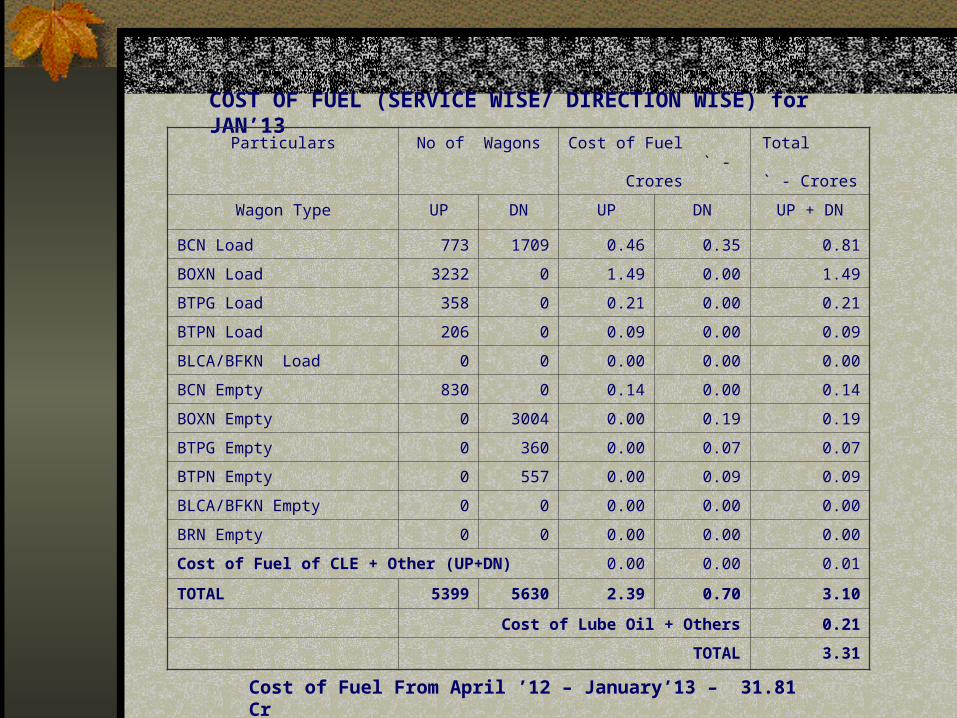
COST OF FUEL (SERVICE WISE/ DIRECTION WISE) for JAN’13
Cost of Fuel From April ’12 – January’13 – 31.81 Cr
Particulars No of Wagons Cost of Fuel ` - Crores
Total ` - Crores
Wagon Type UP DN UP DN UP + DN
BCN Load 773 1709 0.46 0.35 0.81
BOXN Load 3232 0 1.49 0.00 1.49
BTPG Load 358 0 0.21 0.00 0.21
BTPN Load 206 0 0.09 0.00 0.09
BLCA/BFKN Load 0 0 0.00 0.00 0.00
BCN Empty 830 0 0.14 0.00 0.14
BOXN Empty 0 3004 0.00 0.19 0.19
BTPG Empty 0 360 0.00 0.07 0.07
BTPN Empty 0 557 0.00 0.09 0.09
BLCA/BFKN Empty 0 0 0.00 0.00 0.00
BRN Empty 0 0 0.00 0.00 0.00
Cost of Fuel of CLE + Other (UP+DN) 0.00 0.00 0.01
TOTAL 5399 5630 2.39 0.70 3.10
Cost of Lube Oil + Others 0.21
TOTAL 3.31

Line Capacity Utilization for the month of January’13 :
Direction Loaded Empties Total No of Trains
*CLE *Others Total
UP Trains 90 20 110 51
(63)
5
(9)
283
Down Trains 44 73 117
134 93 227 51 5 283
Permissible Capacity : 298
Utilized : 283
Percentage of Utilization : 95%
Percentage of Utilization Loaded : 45%
Engine Hour Cost : 59.99 Lakhs
NOTE:
* Moved between SKLR-SBHR-SKLR

WAGON DAYS – JANUARY 2013
No of Days
TotalUP Down
Actual 3695 2457 6151
Abnormal Detention
742 73 816
Rate per Day in terms of 8 wheeler : ` 967.75
Wagon Hire Charges (Actual) : ` 59.53 Lakhs
Wagon Hire Charges for Abnormal : ` 7.90 Lakhs
Detention (Avoidable)
*Abnormal Detention : Time taken for completing the journey > 15 Hrs

Details of Payments Received from Mysore Division after adjusting O&M Costs
Months Due Date Actual date of Receipt
Amount Rs - Cr
Prov. Pay Final Pay (Prov Pay)
April ’12 05.05.12 31.05.12 02.06.12 4.22
May ’12 05.06.12 30.06.12 01.08.12 4.19
June’12 05.07.12 30.07.12 01.08.12 3.64
July’12 05.08.12 30.08.12 01.09.12 1.73
Aug’12 05.09.12 30.09.12 12.10.12 1.38
Sept’12 05.10.12 31.10.12 31.10.12 2.70
Oct’12 05.11.12 30.11.12 30.11.12 4.55
Nov’12 05.12.12 31.12.12 01.01.13 5.77
Dec’12 05.01.13 31.01.13 02.02.13 5.04
Jan’13 05.02.13 28.02.13

Details of Payments made by HMRDC to SWR
Particulars For the month of Jan’13
To the End
(Crores)
Contractual payment for maintenance works (Provisional bill from --)
1.07 1.93