operating parameters and costs assessments of a...
TRANSCRIPT

Accepted Manuscript
Title: Operating parameters and costs assessments of a realdyehouse wastewater effluent treated by a continuouselectrocoagulation process
Author: M. Kobya E. Gengec E. Demirbas
PII: S0255-2701(15)30147-1DOI: http://dx.doi.org/doi:10.1016/j.cep.2015.11.012Reference: CEP 6717
To appear in: Chemical Engineering and Processing
Received date: 24-10-2015Revised date: 17-11-2015Accepted date: 19-11-2015
Please cite this article as: M.Kobya, E.Gengec, E.Demirbas, Operating parametersand costs assessments of a real dyehouse wastewater effluent treated by acontinuous electrocoagulation process, Chemical Engineering and Processinghttp://dx.doi.org/10.1016/j.cep.2015.11.012
This is a PDF file of an unedited manuscript that has been accepted for publication.As a service to our customers we are providing this early version of the manuscript.The manuscript will undergo copyediting, typesetting, and review of the resulting proofbefore it is published in its final form. Please note that during the production processerrors may be discovered which could affect the content, and all legal disclaimers thatapply to the journal pertain.

1
Operating parameters and costs assessments of a real dyehouse
wastewater effluent treated by a continuous electrocoagulation
process
M. Kobya1*, E. Gengec2, E. Demirbas3
1Department of Environmental Engineering, Gebze Technical University, 41400, Gebze, Turkey
2University of Kocaeli, Department of Environmental Protection, 41275, Izmit, Kocaeli, Turkey
3Department of Chemistry, Gebze Technical University, 41400, Gebze, Turkey
*Corresponding author. Tel.: +90-262-6053169, Fax: +90 262 6053145.
(E-mail address: [email protected])

2
Research highlights
Treatment of a real dyehouse wastewater was studied with continuous flow EC
Removal efficiencies of COD were 85% and 77% for Fe and Al electrodes at optimum
conditions
Operating costs at the optimum conditions were 1.562 $/m3for Fe and 1.851 $/m3for Al
electrodes

3
Abstract
Treatment of a real dyehouse wastewater was studied with continuous flow
electrocoagulation (CEC) process. Removal efficiencies of COD, TOC and turbidity were
obtained as 85%, 76% and 95% for Fe electrode and 77%, 72% and 95% for Al electrode at
current density of 65 A/m2, inlet flow rate of 0.010 L/min, operating time of 80 min
(hydraulic retention time of 350 min), and current density of 65 A/m2 (the optimum operating
conditions). The decrease in the inlet flow rate (0.20-0.010L/min) led to an increase in
removal efficiencies of COD (58-85% for Fe, 55-77% for Al), TOC (51-76% for Fe and 46-
72% for Al) and turbidity (70-95% for Fe and 72-95% for Al). Operating costs for Fe and Al
electrodes at the optimum operating conditions were calculated as 1.562 $/m3 or 7.282 $/kg
COD for Fe electrode and 1.851 $/m3 or 14.257 $/kg COD for Al electrode. The results
presented in this study revealed that the CEC process can be effectively used for the removals
of color, COD, TOC and turbidity from textile wastewater.
Keywords: Continuous electrocoagulation; real textile wastewater; operating cost; Fe and Al
electrodes
4
1. Introduction
The textile industry utilizes about 10.000 dyes and pigments, and a high amount of these
dyes can exist in effluents of dyeing processes [1]. Reactive dyes are very important class of
textile dyes, whose losses through processing are particularly significant and difficult to treat.
Under typical reactive dyeing conditions (pH: >10, temperature: >65 oC and salt: 60-100 g/L)
as much as 20-50 percent of the initial mass of the reactive dye remains in the spent reactive
dye bath in the hydrolyzed form which has no affinity for the fiber [2]. The dyeing and
finishing are the two important processes generally applied in most of the textile
manufacturing industries. In textile industries, substantial amounts of unfixed dyes are
released into wastewater because of the low efficiency of dye fixing on textile fibers (60-
90%) [3,4]. The direct discharge of textile wastewater into the water resources pollutes the
water and affects the aquatic life (aquatic plants, microorganisms, fish and mammals). The
direct discharge of this industrial effluent into sewage networks produces also disturbance in
biological treatment processes. Textile wastewater is characterized by strong colors, high
chemical oxygen demand (COD) and total organic carbon (TOC), low biodegradability and
high-salt content [5, 6]. There are many processes such as biodegradation, adsorption,
precipitation, membrane filtration, chemical degradation, photodegradation and chemical
coagulation to remove dyes from colored effluents [7-9]. However, these processes are quite
expensive and involve several operational problems. For these reasons, there has been an
increasing interest in the use of electrochemical methods [10]. Electrochemical methods have
advantages due to no requirement of chemicals before and after treatment, producing of less
sludge, requirement of small area and low investment cost. [11]. Moreover, the high
electrolyte (e.g. NaCl, Na2CO3, Na2SO4 inorganic salts) concentration used in the textile
dying process offers an inherent advantage for treating dying dyebath effluent with
electrocoagulation (EC) [12].
In recent years, EC has been applied successfully to treat textile dyes containing solutions
or wastewater samples [10-23]. However, most of these studies have involved with treatment
of aqueous synthetic dye solutions. EC treatments of these samples have been conducted on a
laboratory scale in batch and continuous EC reactors showing almost removal efficiencies of
85-100% for color and 40-80% for COD at various operating conditions. These processes are
found to be very efficient in color removal with low-energy consumption. Treatment of textile
wastewater by continuous EC process (CEC) has been less investigated for especially textile
dyebath effluents [24-29]. Despite few scientific studies on treatment of actual textile
5
wastewater by the CEC process using iron (Fe) and aluminium (Al) anodes, there haven’t
been publications reported yet about technical and economical evaluation for treatment of
actual exhausted textile dyebath effluents in the CEC process.
EC is an electrolytic process consisting of dissolution of sacrificial anodes (Fe or Al)
upon application of a current between two electrodes for treatment of liquid wastewater
containing inorganic or organic pollutants [29-39]. In the EC, the anodic reaction involves the
dissolution of Al or Fe electrodes (Eqs. 1-3), and the cathodic reaction (Eqs. 2 and 5) involves
the formation of hydrogen gas and hydroxide ions, then hydroxide ions formed at the cathode
increase pH of the wastewater thereby inducing precipitation of metal ions as corresponding
hydroxides and co-precipitation with iron hydroxides. The main anode and cathode reactions
occurring at Al and Fe electrodes in EC process are as follows:
Anode and cathodes reactions for Al electrodes:
Anode: -3 3eAlAl (1)
Cathode: 3OH3/2H3eO3H
2(g)-
2 (2)
Anode and cathodes reactions for Fe electrodes:
Anode: -2 2eFeFe (3)
-32 eFeFe (4)
Cathode: 2OHH2eO2H
2(g)-
2 (5)
In the case of Fe electrodes, dissolved iron (i.e., Fe2+ or Fe3+) hydrolyses by increasing pH to
form precipitates as Fe(OH)n(s). The rate of the oxidation of Fe2+ depends on the availability of
dissolved oxygen [28].
4OH4FeO2H4FeO 32
22(g)
(6)
In the case of used aluminium electrodes in EC process, Al3+/Fe3+ and OH ions generated
by anode and cathode reactions (1) and (2) to form various monomeric species depending on
the pH of the aqueous medium. Consequently, the removal mechanism of pollutants from
wastewater with both electrodes was related to forming of Fe(OH)3(s), Al(OH)3(s), monomeric
and polymeric iron and aluminium species due to coagulation, precipitation, co-precipitation,
and electrooxidation [11, 28].
The objective of the present study was to investigate the influence of different operating
parameters (current density of 20-85 A/m2, operating time of 0-80 min, inlet flow rate of 0.01-
0.20 L/min and COD or TOC concentration) on COD, TOC and turbidity removal efficiencies

6
in the real dyehouse wastewater by the CEC process using sacrificial Fe and Al electrodes.
Operating costs were also calculated in terms of energy and electrode consumptions.
2. Material and methods
2.1. Characterization of textile dyehouse wastewater
The dyehouse wastewater used in this study was obtained from a textile factory
producing approximately 1000 m3 of wastewater per day in Istanbul, Turkey. The textile
wastewater contained real dyehouse effluents from both dyeing and rinsing baths of cotton,
rayon, silk, wool and nylon. Reactive, dispersive and acidic dyes are the major types of dye
used in this textile factory. The wastewater was collected from balancing (equalization) tank
immediately after the dyeing and rinsing processes, and then directly stored at below 4 oC in a
dark condition to avoid any change in physico-chemical characteristics before use. The
relatively large suspended particles in the colloidal ranges were removed from the wastewater
before conducting the experiments. Characterizations of the textile dyehouse wastewater from
the balancing tank are shown in Table 1.
Table 1. Characterizations of the textile dyehouse wastewater.
2.2. Continuous EC reactor and experimental procedure
The EC experiments were carried out in a continuous flow reactor made from Plexiglas
with dimensions of 250 mm 190 mm 80 mm. A schematic of the experimental setup for
the CEC reactor is shown in Fig. 1. Two anodes and two cathodes (Fe or Al) of rectangle
electrodes with dimensions of 220 mm×50 mm×4 mm were placed in the reactor with
monopolar parallel connection mode. The space between each electrode was 20 mm and their
position within the reactor was in perpendicular order according to the wastewater flow. The
total effective electrode area was 660 cm2. The electrodes were connected to a digital dc
power supply (Agilent 6675A model) operated at galvanostatic mode. The current was
adjusted on the dc power supply. The initial pH of wastewater was adjusted to 5.5, and then
the wastewater was fed into the reactor from the bottom using a peristaltic pump (Cole-
Parmer 7553-75 model). Volume of the dyehouse wastewater in the CEC reactor was 3.5 L.
The CEC experiments for Al or Fe electrodes were run up to 80 min depending on variations
of the operating time and other operating parameters. Flow rate of the textile wastewater was
varied at 0.010, 0.050, 0.10 and 0.20 L/min. Effluent samples from the reactor were taken at
different times during the experiment and the experiment was continued until steady-state

7
concentrations were achieved. Effluent from the reactor was passed through a filter column
with diameter of 30 mm filled with 10 mm glass beads to remove suspended solids/turbidity.
Conductivity, pH, and turbidity of the effluent in the reactor were monitored during the course
of each experiment. The effluent samples from the reactor were collected and then filtered by
Millipore membrane filter with the pore diameter of 0.45 μm at the end of the run, and then
all samples were analyzed for COD, TOC and turbidity measurements.
Fig. 1. Experimental setup of the CEC process.
2.3. Analytical techniques
The operating parameters namely, pH, conductivity, COD, TOC and turbidity before and
after the treatment by the CEC process were analysed with the standard methods [40]. A Hach
COD reactor was used for digestion of the sample in COD vials. Values of COD were
measured spectrophotometrically by a UV-vis spectrophotometer (PerkinElmer Lambda 35).
The TOC levels were determined through combustion of the samples at 680 ◦C using a non-
dispersive IR source (Tekmar Dohrmann Apollo 9000). Turbidity (Nephelometric Turbidity
Unit, NTU) was determined with a turbidimeter (Mettler Toledo 8300 model). Residual total
metal (Fe and Al) concentrations of both raw textile wastewater and EC-treated samples after
the filtration were measured with inductive coupled plasma spectrophotometer (PerkinElmer
ICP-OES Optima 7000 DV). Removal efficiencies (Re) of COD, TOC, and turbidity are
expressed as a percentage and defined as:
100
)i
(
e
iC
fCC
R (7)
In Eq. (7), Ci and Cf are the COD or TOC or turbidity concentrations in the inlet and the exit
streams of the CEC reactor, respectively. pH was determined using a pH-meter (Mettler
Toledo 2050e model). A conductivity meter (Mettler Toledo 7100e model) was used to
determine the ionic conductivity of the wastewater. The wastewater samples were filtered
through a standard GF/F glass fibre filter to determine total suspended solids (TSS). The
residual retained on the filter was dried in an oven at 105 oC to a constant weight. The
increase in weight of the filter represents the TSS (APHA Method 2540 D). All the inorganic
chemicals used were of analytical grade and all reagents were prepared in Millipore milli-Q
deionized water.

8
2.4. Calculation of operating cost
Operating cost (OC) of the EC process includes material, mainly electrodes and electrical
energy costs, as well as labour, maintenance, sludge dewatering and disposal, and fixed costs.
The latter cost items are largely independent of the type of the electrode material [41, 42]. In
this study, energy and electrode material costs for calculation of the OC ($/m3 or $/kg
removed COD) were taken into account as major cost items:
CC cELC bENC aOC (8)
where ENC is energy consumption (kWh/m3) and ELC is electrode consumption (kg/m3).
Prices for a, b and c (chemical consumption cost (CC) (kg/m3 or kg/kg COD) in the Turkish
market in September 2015 were 0.1064 $/kWh for electrical energy, 1.848 $/kg for Al and
0.952 $/kg for Fe electrodes, and 1.01 $/kg for NaOH, 0.40 $/kg for H2SO4 for adjustment of
a desired pH. On the other hand, ENC and ELC were calculated from Eqs. 9-10 and Eqs.11-
12, respectively [19, 25].
v
tiUENC EC3)(kWh/m
(9)
)(COD) (kWh/kg
,CODi,
EC
CODeRCv
tiUENC
(10)
where U is cell voltage (V), i is current (A), tEC is operating time (hour), v is volume (m3) of
the wastewater, Ci,COD (kg/m3) is COD concentration of wastewater in the inlet stream, and
Re,COD is COD removal efficiency.
vFz
MtiELC
wEC3)(kg/m (11)
)(COD) /kg(kg
CODe,CODi,
Feor AlwEC
RCvFz
MtiELC
(12)
where Mw is molecular mass of electrode (Mw,Al = 0.02698 kg/mol, Mw,Fe = 0.05585 kg/mol),
tEC is operating time (s), z is number of electron transferred (zAl = 3, zFe = 2), and F is
Faraday’s constant (96.487 C/mol). In addition, the faradic yield ( Feor Alφ = expΔm / thΔm ) of
electrode (Al or Fe) dissolution was calculated as the ratio of the weight loss of the electrodes

9
during the experiments ( expΔm ) and the amount of electrode consumed theoretically ( thΔm ) at
the anode [25]. In this study, faradic yield or current efficiency was calculated as 102-120%
for Al electrodes and 100-113% for Fe electrodes at 20-85 A/m2.
4. Results and Discussion
In the earlier study, optimization using response surface methodology for treatment of the
textile dyehouse effluents in a batch EC reactor was studied with considering the effects of
initial pH, current density and operating time. [43, 44]. The optimum conditions using Al and
Fe electrodes for the above study were pHi 5.5, current density of 45 A/m2 and operating time
of 33 min. Treatment efficiencies of COD, TOC, turbidity and operating cost were determined
to be 60%, 57%, 72% and 0.85 $/m3 for Al electrode and 71%, 65%, 95% and 2.128 $/m3 for
Fe electrode, respectively. In the present study, the textile dyehouse wastewater was treated
with the CEC process by considering three main operating parameters namely, current
density, flow rate and operating time.
4.1. Effect of current density
In all electrochemical processes, current density is the most important parameter for
controlling the reaction rate within the electrochemical reactor [11]. The current density was
determined by dividing each current by the corresponding electrode area (j = i/Aelectrode, A/m2).
It is well known that current density determines the production rate of coagulant, adjusts also
bubble production, and hence affects the growth of flocs [27]. A continuous
electrocoagulation process using Fe and Al electrodes was carried out at pHi 5.5 and an inlet
flow rate of 0.01 L/min or react = hydraulic residence time of 350 min in the CEC reactor to
investigate the effect of current density (j = 20-85 A/m2) on the removal efficiencies of COD,
TOC and turbidity. COD removal efficiencies for Al and Fe plate electrodes versus operating
time and current density are shown in Fig. 2(a-c). Maximum COD removal efficiencies of
50%, 71%, 77% and 81% for Al electrode and 47%, 75%, 85% and 88% for Fe electrode
were obtained at current densities of 20, 45, 65, and 85 A/m2. As shown in Fig. 2(a), increase
in the current density from 20 to 85 A/m2 led to decrease in the operating time required to
achieve steady-state concentration, i.e. values on the plateau region and then became constant
nearly at about 30-50 min for both electrodes, and increase in percentage of COD removal
efficiencies for both electrodes. The reason may be related to increasing of current density led
to both increasing of the coagulant production rate and the amount of iron or aluminium

10
hydroxide available in solution to form complexes and precipitate ions. The increase in the
current density yielded an increase in the removal efficiencies of COD from 47 to 88% for Fe
electrode and from 50 to 81% for Al electrode. At the same time, the highest TOC removal
efficiencies were obtained as 45%, 65%, 76% and 83% for Fe electrode and 42%, 62%, 72%
and 79% for Al electrodes at 20, 45, 65 and 85 A/m2, respectively (Fig 2(b)). Turbidity
removal efficiencies at current densities of 20, 45, 65 and 85 A/m2 and operating time of 80
min were determined to be 75%, 92%, 95% and 97% for Fe electrode and 68%, 91%, 95%
and 96% for Al electrode (Fig. 2(c)). These results were ascribed to the fact that the extent of
anodic dissolution of Al and Fe anodes increased at high current densities, resulting in a
greater amount of Fe(OH)3(s) or Al(OH)3(s) particles for the removal of pollutants. As the
current intensity increased, the anodic dissolution was favoured so that the metallic sludge
residues increased and organic pollutants (dissolved dye molecules and other species in the
textile wastewater) were effectively removed from the solution (by co-precipitation or
adsorption on metallic sludge). The structure of aluminium sludge was in a white gelatine-
type precipitate and was less stable while ferrous sludge formed a stable green colloidal
precipitate in aqueous solution. Therefore, the ferrous sludge was more reactive and effective
in removing organic pollutants by precipitation/adsorption [45]. Moreover, the bubble
generation rate increased and the bubble size decreased with increasing the current densities.
These effects were both beneficial for high pollutant removal by H2(g) flotation [27]. Removal
efficiencies at 65 and 85 A/m2 for Fe electrodes were determined to be 85% and 88% for
COD, 76% and 83% for TOC, and 95% and 97% for turbidity at 80 min. On the other hand,
removal efficiencies at 65 and 85 A/m2 for Al electrodes were 77% and 81% for COD, 72%
and 79% for TOC, and 95% and 96% for turbidity. The results indicated that Fe electrode
required slightly lower current density than that of Al electrode for the same operating
conditions. This probably resulted from the differences in the removal mechanisms of COD
and TOC. The COD and TOC from the textile wastewater using Fe electrode were mainly
removed by the EC process, while the COD and TOC removals by Al plate electrodes were
due to the synergic effect of EC and electrooxidation [1, 22]. Although, the higher current
density gave slightly better results but, 65 A/m2 was selected for both electrodes as the
optimum current efficiency value for this study due to lowering the operating cost.
Consequently, the CEC process involving Fe electrode gave rise to removal efficiencies of
85% for COD, 76% for TOC and 95% for turbidity at the optimum current density value.

11
Fig. 2(a). Effects of current density on COD removal efficiencies (pHi = 5.5, Q = 0.01
L/min).
Fig. 2(b). Effects of current density on TOC removal efficiencies (pHi = 5.5, Q = 0.01 L/min).
Fig. 2(c). Effects of current density on turbidity removal efficiencies (pHi = 5.5, Q = 0.01
L/min).
The energy (ENC) and electrode (ELC) consumptions calculated on the basis of kWh/m3 and
kWh/kg COD removed using Eqs. 9 and 12 for both electrodes are depicted in Fig. 3. Values
of the energy consumptions at 20-85 A/m2 were 1.22-18.57 kWh/m3 (15.57-126.61 kWh//kg
COD) for Fe electrode, and 1.28-18.8 kWh/m3 (11.46-139.26 kWh/kg COD) for Al electrode,
respectively. Values of the electrode consumptions at 20-85 A/m2 for Fe and Al electrodes
were 0.103-0.388 kg/m3 (1.31-2.65 kg/kg COD) and 0.120-0.385 kg/m3 (1.07-2.85 kg/kg
COD) (Fig.3). In addition, the amount of sludge occurred during the CEC process at 20-85
A/m2 were varied from 0.68 to 2.20 kg/m3 (4.68-8.05 kg/kg COD) for Fe electrode, and from
1.10 to 1.45 kg/m3 (9.85-10.74 kg/kg COD) for Al electrode since the current density and
operating time affected the amount of sludge generated. Therefore, the sludge production in
the CEC process was proportional to characteristics of wastewater, settable solids and matter
destabilized by coagulation and flocculent concentration. According to the above results, the
sludge production in the CEC process for both electrodes increased with increasing of current
density since amounts of dissolved Fe and Al anodes at the constant operating time (80 min)
were increased (Faraday’s law).
Fig. 3. The amount of sludge generated, electrode and energy consumptions for Fe and Al
electrodes at different current densities in the CEC process.
Changes of the operating costs as a function of the current density for both electrodes are
illustrated in Fig. 4. The variations in the operating costs for both electrodes were calculated
on the basis of $/m3 and $/kg COD removed. The operating costs at 20-85 A/m2 were 0.253-
2.370 $/m3 or 2.929-16.019 $/kg COD removed for Fe electrode and 0.383-2.737 $/m3 or
3.222-20.109 $/kg COD removed for Al electrode (Fig. 4). On the other hand, the operating
cost increased rapidly with increasing current density from 20 to 85 A/m2. Fe electrode
lowered the operating cost per m3 or removed kg COD of the wastewater as compared to Al
electrode did. From the operating cost and removal efficiencies of COD, TOC and turbidity

12
points of view, Fe electrode in the wastewater was clearly preferable since it lowered the
operating cost significantly in the CEC process.
Fig. 4. Effects of current density for Al and Fe electrodes on the operating cost.
Residual metal (Al and Fe) concentrations are an important consideration for any
wastewater treatment by EC process using sacrificial anodes such as Al and Fe. The residual
metal concentrations may decrease carrying capacity of the sewer system because of
precipitation of aluminium and iron hydroxides and cause toxic effects on organisms and
increase turbidity in receiving water environments such as river and lake. There are also
concerns that residual aluminium in drinking water may cause Alzheimer’s disease. Residual
aluminium or iron concentrations in the treated samples by the CEC process at current
densities of 20, 45, 65, and 85 A/m2 and operating time of 80 min, were obtained as 0.0392,
0.0241, 0.0192, and 0.0131 mg/L for Al electrodes and 0.0414, 0.0326, 0.0213, and 0.0203
mg/L for Fe electrodes. The residual Al and Fe concentrations in the treated effluents at
different current densities were lower than the permissible limit for aluminium and iron in
drinking waters (0.3 mg/L) set by Turkish Water Pollution Control Regulation. On the other
hand, the permissible limits for sewer system discharging of textile wastewater after the
treatment were 3 mg/L for Al and 5 mg/L for Fe.
4.2. Effect of inlet flow rate
The time evolution of treatment of wastewater by electrocoagulation is often presented in
the literature by a plotted parameter to follow the treatment efficiency (COD, TOC, turbidity)
vs. operating time. It is much more appropriate to normalize the time by the mean residence
time to analyze properly the effect of the flow rate [24, 29, 46]. As the flow rate is decreased
in the CEC process, the hydraulic retention time in the CEC reactor is increased, so it can
cause the restabilization of aluminium or iron hydroxides flocs. In other words, as the inlet
flow rate increases for rapid mixing in the CEC reactor, the retention time decreases. The
rapid mixing is required in the initial condition of the EC process to grow larger flocs and to
precipitate these enough in the solutions for the removal. Thus, it would be of practical
interest to test how much an increase or decrease in the effluent inlet flow rate affects the
COD, TOC, and turbidity removal efficiencies for the dyehouse effluent in the CEC process.
13
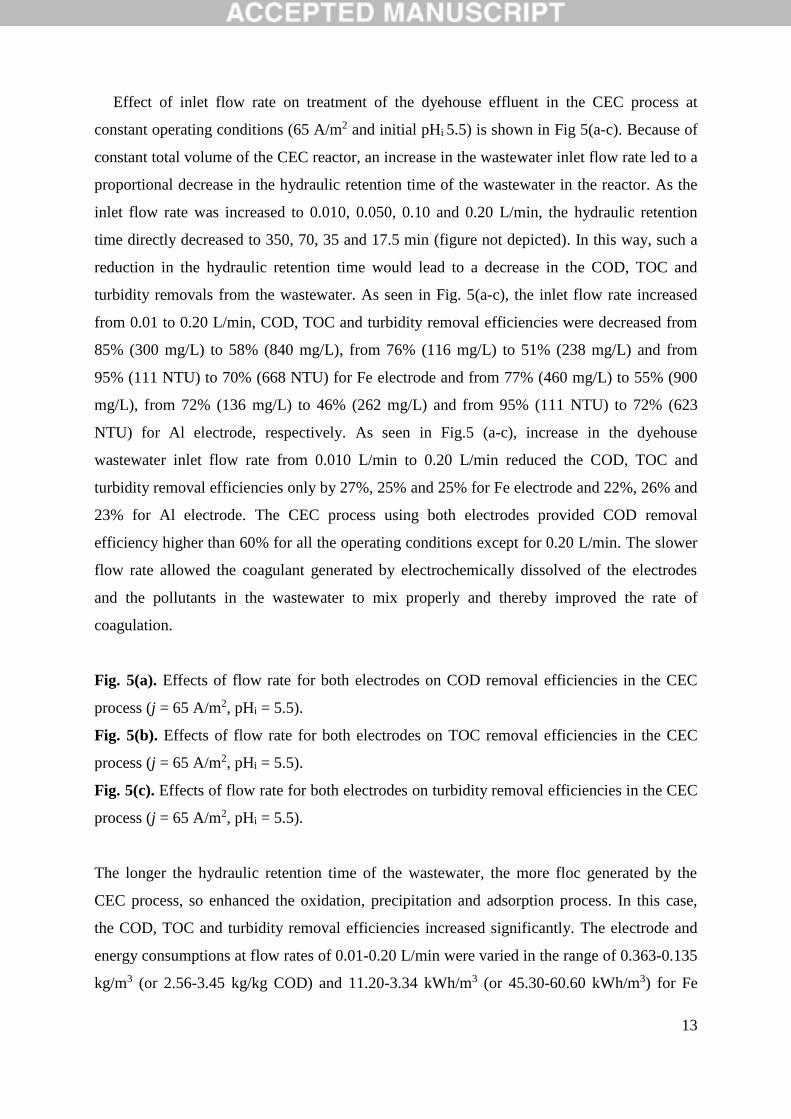
Effect of inlet flow rate on treatment of the dyehouse effluent in the CEC process at
constant operating conditions (65 A/m2 and initial pHi 5.5) is shown in Fig 5(a-c). Because of
constant total volume of the CEC reactor, an increase in the wastewater inlet flow rate led to a
proportional decrease in the hydraulic retention time of the wastewater in the reactor. As the
inlet flow rate was increased to 0.010, 0.050, 0.10 and 0.20 L/min, the hydraulic retention
time directly decreased to 350, 70, 35 and 17.5 min (figure not depicted). In this way, such a
reduction in the hydraulic retention time would lead to a decrease in the COD, TOC and
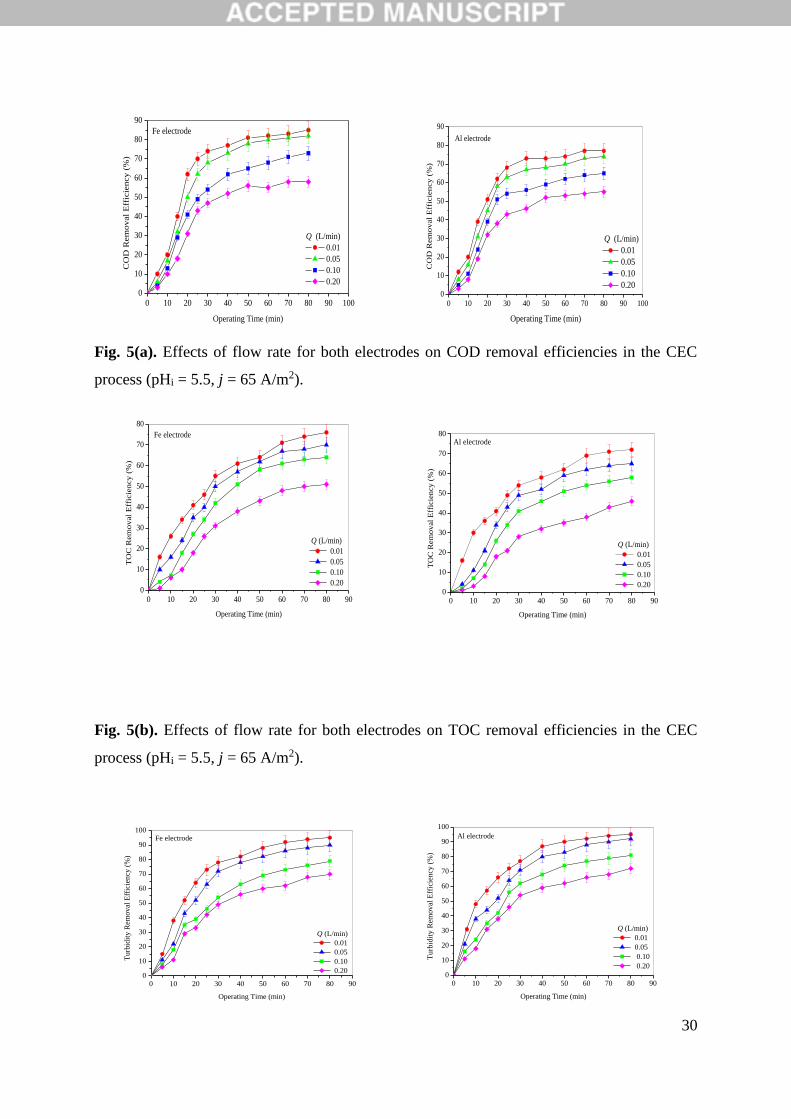
turbidity removals from the wastewater. As seen in Fig. 5(a-c), the inlet flow rate increased
from 0.01 to 0.20 L/min, COD, TOC and turbidity removal efficiencies were decreased from
85% (300 mg/L) to 58% (840 mg/L), from 76% (116 mg/L) to 51% (238 mg/L) and from
95% (111 NTU) to 70% (668 NTU) for Fe electrode and from 77% (460 mg/L) to 55% (900
mg/L), from 72% (136 mg/L) to 46% (262 mg/L) and from 95% (111 NTU) to 72% (623
NTU) for Al electrode, respectively. As seen in Fig.5 (a-c), increase in the dyehouse
wastewater inlet flow rate from 0.010 L/min to 0.20 L/min reduced the COD, TOC and
turbidity removal efficiencies only by 27%, 25% and 25% for Fe electrode and 22%, 26% and
23% for Al electrode. The CEC process using both electrodes provided COD removal
efficiency higher than 60% for all the operating conditions except for 0.20 L/min. The slower
flow rate allowed the coagulant generated by electrochemically dissolved of the electrodes
and the pollutants in the wastewater to mix properly and thereby improved the rate of
coagulation.
Fig. 5(a). Effects of flow rate for both electrodes on COD removal efficiencies in the CEC
process (j = 65 A/m2, pHi = 5.5).
Fig. 5(b). Effects of flow rate for both electrodes on TOC removal efficiencies in the CEC
process (j = 65 A/m2, pHi = 5.5).
Fig. 5(c). Effects of flow rate for both electrodes on turbidity removal efficiencies in the CEC
process (j = 65 A/m2, pHi = 5.5).
The longer the hydraulic retention time of the wastewater, the more floc generated by the
CEC process, so enhanced the oxidation, precipitation and adsorption process. In this case,
the COD, TOC and turbidity removal efficiencies increased significantly. The electrode and
energy consumptions at flow rates of 0.01-0.20 L/min were varied in the range of 0.363-0.135
kg/m3 (or 2.56-3.45 kg/kg COD) and 11.20-3.34 kWh/m3 (or 45.30-60.60 kWh/m3) for Fe

14
electrode and 0.345-0.147 kg/m3 (or 2.69-2.91 kg/kg COD) and 11.17-3.10 kWh/m3 (or
87.04-98.06 kWh/kg COD) for Al electrode (Fig.6). These results indicated that sludge
production, energy and electrode consumptions per m3 treated wastewater for both electrodes
decreased with increasing of the inlet flow rate. On the other hand, the amount of sludge in
the CEC process varied in the range of 1.86-0.63 kg/m3 (or 6.92-10.05 kg/kg COD) for Fe
electrode and 1.33-1.05 kg/m3 (or 10.36-15.96 kg/kg COD) for Al electrode at inlet flow rates
of 0.010-0.20 L/min (Fig. 6). Operating costs were calculated as 1.562-0.599 $/m3 (or 7.069-
9.757 $/kg COD) for Fe electrode and 1.851-0.626 $/m3 (or 14.257-15.894 $/kg COD) at inlet
flow rates of 0.010-0.20 L/min (Fig. 7). The operating cost for both electrodes increased with
increased flow rate per m3 treated wastewater but the cost decreased with per removed kg
COD. The residual aluminium and iron concentrations in treated samples for inlet flow rates
of 0.010, 0.050, 0.10 and 0.20 L/min at operating time of 80 min were obtained as 0.0192,
0.0245, 0.0312 and 0.0436 mg/L for Al electrodes and 0.0213, 0.0452, 0.0519 and 0.0603
mg/L for Fe electrodes.
Fig. 6. Values of the operating cost at different flow rates in the CEC process.
Fig. 7. Effects of flow rate on the operating cost for Al and Fe electrodes.
4.3. Effect of COD concentration
Textile dyeing processes include pretreatment, dyeing, finishing and other technologies.
Pre-treatment includes desizing, scouring, washing, and other processes [47, 48]. Dyeing
mainly aims at dissolving the dye in water, which will be transferred to the fabric to produce
colored fabric under certain conditions. The primary source of wastewater in dyeing
operations is spent dye bath and wash water. Pre-treatment wastewater accounts for about
45% of the total, and dyeing/printing process wastewater accounts for about 50%~55%, while
finishing process produces little. About 50% of the textile mills are using approximately 200-
250 liters of water per kg of fabric produced while about 20% of the mills is using below 200
liters of water per kg of fabric depending on the process sequence and water utilization
practices adopted in the mill [49]. Water pollution by the textile mills is mainly attributable to
various waste liquors coming out of the unit operations in wet processing such as desizing,
scouring, bleaching, mercerizing, dyeing, printing and finishing. This process can be divided
into continuous and batch type [5, 7, 47, 48]. Taking the batch type as an example, the
concentration of COD is up to 20.000-60.000 mg/L. The wastewater from the reduction

15
process may account for only 5% of the volume of wastewater, while COD accounts for 60%
or more in the conventional dyeing and finishing.
The COD concentration is the most important parameter required for the sewage discharge
standards. The source of pollution in the textile wastewater arises mainly from dye rinse
wastewater which contains high rate of pollution. Treatments of concentrated textile dyeing
bath wastewater are more difficult than rinse bath wastewaters. These wastewaters are also
mixed with the other wastewaters apart from the dying bath process which increases the
amount of wastewater and hence, amount of COD in the wastewater changes.
Characterizations of the wastewater obtained from the balancing tank of the textile dyehouse
plant are shown in Table 1. However, the effluent wastewater from the dyeing bath of this
dyehouse plant contained average values of 22000 mg/L of COD, 6500 mg/L of TOC, 20500
NTU of turbidity at pHi 6.8. The removal efficiency would be very low if only the dying bath
wastewater is treated by the CEC process due to high concentrations of COD and TOC in the
wastewater. Therefore, the dyeing bath wastewater containing intensive pollution was added
to the balancing tank wastewater to obtain different initial concentrations of COD. Then, the
removal efficiencies of COD having different initial concentrations were studied and the
results for Fe and Al electrodes are depicted in Figures 8 and 9.
Fig. 8. Effects of COD concentration on the treatment of the wastewater in the CEC process
(pHi = 5.5, Q = 0.01 L/min, j = 65 A/m2).
Fig. 9. Effects of COD concentration on the operating costs for Al and Fe electrodes.
According to these figures, the removal efficiencies using Al electrodes in the CEC reactor
were achieved to 80% and 78% for COD concentrations of 1000 and 2000 mg/L in the
wastewater, 74% and 68% for TOC and 96% and 93% for turbidity. The removal efficiencies
at high concentrations of COD present in the wastewater (4000, 6000 and 8000 mg/L) were
also obtained as 48%, 26% and 20% for COD, 44%, 21% and 16% for TOC and 76%, 65%
and 36% for turbidity, respectively. Effluent pH values at different concentrations of COD in
the wastewater varied in the range of 8.9-8.1 after the CEC process (figures not depicted).
Moreover, the removal efficiencies in the CEC reactor using Fe electrodes were 90% and 88%
for COD concentrations of 1000 and 2000 mg/L in the wastewater, 83% and 78% for TOC
and 93% and 91% for turbidity. The removal efficiencies at high concentrations of COD
present in the wastewater using Fe electrode (4000, 6000 and 8000 mg/L) were 54%, 29%

16
and 21% for COD, 48%, 22% and 18% for TOC and 72%, 52% and 30% for turbidity,
respectively. Effluent pH values at different concentrations of COD in the wastewater varied
in the range of 9.2-8.2 after the CEC process (figures not depicted). According to these results,
the removal efficiency of COD was decreased significantly in the wastewater containing COD
concentration of >2000 mg/L since there weren’t enough Al3+ and Fe3+ hydroxyl species from
the electrodes, i.e., intensive pollutants concentrations in the wastewater demand larger
electrogenerated coagulant mass. On the other hand, dye molecules and polymeric species
like surfactants adsorbing the electrode surfaces (deposited) caused passivization of the
electrodes as well. This situation can be attributed to the inhibition of the electrodes surfaces
by the dye molecules and polymeric species in the wastewater deactivating the active sites of
the electrode surfaces. Similar results were reported in the literature [50] and could be seen in
Fig. 8. The removal efficiency wasn’t increased much with increasing the operating time. This
caused to decrease in the reaction rates. The dissolution of the anodes wasn’t enough due to
passivization, and efficiencies from dissolution through electrochemical (the faradic
efficiency) were under 100% (45%-80% for Al and 35%-75% for Fe electrodes). Therefore,
the temperature in the CEC reactor increased from 20 to 28 oC at 80 min due to the increasing
of mobility and ion collisions with the hydroxyl polymers. However, higher temperatures
decreased the removal efficiency due to the formation of unsuitable flocks and/or solubility
increase [51]. The removal efficiency was observed to be lower than as expected (≥2000
mg/L of COD) since adsorption of the wastewater on surface of the electrodes caused
passivation of the electrode material.
Energy consumptions for initial COD concentrations of 1000, 2000, 4000, 6000 and 8000
mg/L were calculated as 6.35, 11.20, 13.8, 15.2 and 16.1 kWh/m3 for Fe electrode and 6.92,
11.17, 14.20, 15.71 and 16.84 kWh/m3 for Al electrode. As the initial COD concentration was
increased, values of the energy consumption increased, the electrode surfaces were
deactivated and potential between the electrodes was increased in the CEC reactor. Therefore,
the energy consumptions were increased with respect to the obtained results. On the other
hand, the electrode consumptions were 0.252, 0.363, 0.374, 0.320 and 0.301 kg Fe/m3 and
0.276, 0.345, 0.379, 0.328, and 0.321 kg Al/m3 at initial COD concentrations of 1000, 2000,
4000, 6000 and 8000 mg/L. Dissolved amount of Al and Fe electrodes per m3 was getting less
when concentration of COD was greater than 2000 mg/L due to existence of layer of
deposition film on surface of the electrodes (a layer of color precipitation related to the
wastewater) and deactivation of the electrode surfaces.

17
The other important issue in the treated wastewater was to evaluate parameters with
respect to discharge standards. The discharge standards for the textile industry in Istanbul are
set by Istanbul Water and Sewerage Administration (ISKI) which controls and inspects the
industrial wastewater discharges [52]. Industries are required to pretreat their wastewater to
meet the standards set by ISKI. The sewage discharge standard of COD for the dyehouse
effluents in Turkey is 800 mg/L. According to the obtained results, initial COD concentration
was reduced from 2000 mg/L to 800 mg/L (i.e., COD removal efficiency of 60% for Al and
Fe electrodes) at inlet flow rate of below 0.01 L/min, pHi 5.5, current density of 65 A/m2
and operating time of 80 min in the CEC process. It can be concluded with based on the
obtained results that the optimum conditions (j = 65 A/m2, tEC = 80 min, Q = 0.010 L/min, and
COD of 2000 mg/L) for COD, TOC and turbidity effluent concentrations from the wastewater
in CEC process were COD of 300 mg/L, TOC of 116 mg/L and turbidity of 111 (NTU) for Fe
electrode and COD of 460 mg/L, TOC of 136 mg/L and turbidity of 111 NTU for Al
electrodes. According to ISKI standards, values of COD, TOC and turbidity remained in the
treated wastewater were under the permissible limit of discharge standard. However, the legal
discharge limit to receiving environment (i.e, streams and rivers) for the textiles industry is
COD of 250 mg/L for 2 h composite sample according to the Turkish legislation. From results
of the above experiments, direct dischargeable effluents (the national water pollution
regulations) were not obtained by reducing the initial COD concentration of 2000 mg/L to
<250 mg/L. To comply this, it was needed additional process(es) (i.e. biological oxidation,
Fenton, photo-Fenton, photoelectro-Fenton, and electrooxidation processes) along with the
CEC process.
4.4. Comparison of economic and treatment performance of the results
Many studies were reported for the treatment of synthetic and real textile wastewater by
electrocoagulation in the literature [10, 15, 53]. In most cases, each paper mentioned in Table
2 was focused on one specific dye dissolved in pure water and the effects of various operating
parameters (e.g. pH, initial concentration, current density, electrolyte concentration, electrode
type (Fe, Al), temperature, electrode gap) on the removal efficiency were evaluated, in
particular regarding the COD level and the absorbance (color) at the maximum wavelength.
Very satisfactory results were usually reported in most cases with color removal efficiency
ranging between 95% and 100%. Although, there have been many studies on the treatments of
real textile and dyeing wastewater in a batch mode of operation by the EC process in the

18
literature, few similar studies was carried out in a batch mode of operation with the CEC
process. Therefore, the present study was performed for the treatment of the real textile
wastewater in the CEC process. Treatments of textile wastewaters with the CEC process in
the literature are summarised in Table 2 [24, 25, 29, 54-64]. As seen in Table 2, most of the
studies were dealt with the synthetic dying wastewater and electrodes such as Fe and stainless
steel plate anodes. Of 94% was related to removal of color efficiency except for [29] and over
50% was mainly concerned with removal of COD. In addition, color removal efficiency of
94% and COD removal efficiency of 63% were achieved with the real textile wastewater in
the CEC process. Other processes for treatment of textile wastewater expect for EC process
with respect to removal performances and operating cost are presented in Table 3 [65-71].
High COD (60%) and color (95%) removal efficiencies were obtained for synthetic and real
dyeing wastewaters (Table 3). Removals of color (94%) and COD (62%) were better with
coagulation/flocculation plus Fenton, Fenton plus coagulation/flocculation, photo-Fenton
processes and satisfied the limit values of discharge standards for treated textile wastewaters.
Fenton plus coagulation/flocculation or coagulation/flocculation plus Fenton (color of 97%
and COD of 63%), and photo-Fenton (color of 99% and COD of 94%) processes were
found to be more effective for the treatment of real textile wastewaters in a batch mode of
operation. Operating costs were varied between 1 $/m3 [69] and 6.85 $/m3 [65] (Table 3).
When the results in Table 3 for Al and Fe anodes were compared to the present study in terms
of removal efficiencies and cost, this study with the CEC process gave better performances
(85% and 1.562 $/m3 for Fe and 77% and 1.851 $/m3 for Al).
Table 2. The summary of studies on treatment of synthetic and real textile wastewater by
continuous flow electrocoagulation process.
Table 3. Comparisons of operating costs and treatment performances of textile wastewater by
the treatment processes except for the EC process.
4. Conclusions
In this study, the effects of operating parameters (current density, inlet flow rate,
operating time, and loading COD or TOC) from the real textile wastewater by the CEC
process on COD, TOC and turbidity removal efficiencies were investigated. The optimum
operating conditions were determined to be inlet flow rate of 0.010 L/min, operating time of

19
80 min (hydraulic retention time of 350 min), and current density of 65 A/m2 for both Fe and
Al electrodes. COD, TOC and turbidity removal efficiencies at the optimum conditions were
85%, 76% and 95% for Fe electrode, and 77%, 72% and 95% for Al electrode. Values of
COD, TOC and turbidity after the treatment at the optimum operating conditions reduced to
260 mg/L, 99 mg/L and 153 NTU for Fe electrode and 440 mg/L, 117 mg/L and 214 NTU for
Al electrode and these values were under the permissible limit to discharge into the sewage.
Operating costs at the optimum conditions were calculated as 1.562 $/m3 (7.282 $/kg COD)
for Fe electrode and 1.851 $/m3 (14.257 $/kg COD) for Al electrode. According to the results,
treatment of the wastewater with Fe electrode in the CEC process was 1.95 times more
efficient in terms of removed $/kg COD than that of Al electrode.
Removals of COD (1000-8000 mg/L), TOC (243-1942 mg/L) and turbidity (1113-8895
NTU) from spent dyeing bath wastewater were obtained as 80-20%, 74-16%, 96-36% for Al
electrode and 90-21%, 83-18%, and 93-30% for Fe electrode, respectively. The removal
efficiencies were decreased significantly in the wastewater containing COD of >2000 mg/L
since dye molecules and polymeric chemical species in the wastewater adsorbing the
electrode surfaces caused passivation or deactivating of the electrodes. The operating cost for
both electrodes increased with increased flow rate per m3 treated wastewater but the cost
decreased with per removed kg COD. It can be concluded that the CEC process was found to
be an efficient alternative method with respect to the other treatment methods employed for
the treatment of the similar dyehouse effluents.
Acknowledgements
The authors thank to the Scientific and Technological Research Council of Turkey
(TUBITAK) for their financial support with grant number of TUBITAK-CAYDAG 104Y267.

20
References
[1] Daneshvar N., Oladegaragoze A., Djafarzadeh N., Decolorization of basic dye solutions
by electrocoagulation: An investigation of the effect of operational parameters, J.
Hazard. Mater. 129 (2006) 116-122.
[2] Reddy S.S., Kotaiah B., Decolorization of simulated spent reactive dye bath using solar /
TiO2 / H2O2, Inter. J. Environ. Sci. Technol. 2 (2005) 245-251.
[3] O’Neill C., Hawkes F.R., Hawkes D.L., Lourenco N.D., Pinheiro H.M., Delee W., Colour
in textile effluents-sources, measurement, discharge consents and simulation: a review,
J. Chem. Technol. Biotechnol. 74 (1999) 1009-1018.
[4] Vandevivere P.C., Bianchi R., Verstraete W., Treatment and reuse of wastewater from the
textile wet-processing industry: review of emerging technologies, J. Chem. Technol.
Biotechnol. 72 (1998) 289-302.
[5] Correia V.M., Stephenson T., Judd S.J., Characterisation of textile wastewaters -a review,
Environ. Technol. 15 (1994) 917-929.
[6] Forgacsa E., Cserhatia T., Oros G., Removal of synthetic dyes from wastewaters: a
review, Environ. Inter. 30 (2004) 953- 971.
[7] Singh K., Arora S., Removal of synthetic textile dyes from wastewaters: A critical review
on present treatment technologies, Critical Rev. Environ. Sci. Technol. 41 (2011) 807-
878.
[8] Robinson T., McMullan G., Marchant R., Nigam P., Remediation of dyes in textile
effluent: a critical review on current treatment technologies with a proposed alternative,
Biores. Technol. 77 (2001) 247-255.
[9] Slokar Y.M., Le Marechal A.M., Methods of decoloration of textile wastewaters, Dyes
Pigments 37 (1998) 335-356.
[10] Brillas E., Martinez-Huitle C.A., Decontamination of wastewaters containing synthetic
organic dyes by electrochemical methods: An updated general review, App. Catal. B
166-167 (2013) 603-643.
[11] Chen G., Electrochemical technologies in wastewater treatment, Sep. Purif. Technol. 38
(2004) 11-41.
[12] Arslan-Alaton I., Kabdasli I., Hanbaba D., Kuybu E., Electrocoagulation of a real
reactive dyebath effluent using aluminum and stainless steel electrodes, J. Hazard.
Mater. 150 (2008) 166-173.

21
[13] Pajootan E., Arami M., Mahmoodi N.M., Binary system dye removal by
electrocoagulation from synthetic and real colored wastewaters, J. Taiwan Ins. Chem.
Eng. 43 (2012) 282-290.
[14] Lemlikchi W., Khaldi S., Mecherri M.O., Lounici H., Drouiche N., Degradation of
disperse red 167 azo dye by bipolar electrocoagulation, Separation Science and
Technology, 47 (2012) 1682-1688.
[15] Merzouk B., Yakoubi M., Zongo I., Leclerc J.P., Paternotte G., Pontvianne S., Lapicque
F., Effect of modification of textile wastewater composition on electrocoagulation
efficiency, Desalination, 275 (2011) 181-186.
[16] Phalakornkule C., Polgumhang S., Tongdaung W., Karakat B., Nuyut T.,
Electrocoagulation of blue reactive, red disperse and mixed dyes, and application in
treating textile effluent, J. Environ. Manage. 91 (2010) 918-926.
[17] Merzouk B., Madani K., Sekki A., Using electrocoagulation-electroflotation technology
to treat synthetic solution and textile wastewater, two case studies, Desalination, 250
(2010) 573-577.
[18] Aoudj S., Khelifa A., Drouiche N., Hecini M., Hamitouche H., Electrocoagulation
process applied to wastewater containing dyes from textile industry, Chemical
Engineering and Processing: Process Intensification, 49 (2010) 1176-1182.
[19] Arslan-Alaton I., Kabdasli I., Vardar B., Tunay O., Electrocoagulation of simulated
reactive dyebath effluent with aluminum and stainless steel electrodes, J. Hazard. Mater.
164 (2009) 1586-1594.
[20] Zodi S., Potier O., Lapicque F., Leclerc J.P., Treatment of the textile wastewaters by
electrocoagulation: Effect of operating parameters on the sludge settling characteristics,
Sep. Purif. Technol. 69 (2009) 29-36.
[21] Kabdasli I., Vardar B., Arslan-Alaton I., Tunay O., Effect of dye auxiliaries on color and
COD removal from simulated reactive dyebath effluent by electrocoagulation, Chem.
Eng. J. 148 (2009) 89-96.
[22] Alinsafi A., Khemis M., Pons M.N., Leclerc J.P., Yaacoubi A., Benhammou A.,
Nejmeddine A., Electro-coagulation of reactive textile dyes and textile wastewater,
Chem. Eng. Process. 44 (2005) 461-470.
[23] Kobya M., Can O.T., Bayramoglu M., Treatment of textile wastewaters by
electrocoagulation using iron and aluminum electrodes, J. Hazard. Mater. 100 (2003)
163-178.

22
[24] Merzouk B., Gourich B., Madani K., Vial Ch., Sekki A., Removal of a disperse red dye
from synthetic wastewater by chemical coagulation and continuous electrocoagulation:
A comparative study, Desalination, 272 (2011) 246-253.
[25] Merzouk B., Gourich B., Sekki A., Madani K., Vial Ch., Barkaoui M., Studies on the
decolorization of textile dye wastewater by continuous electrocoagulation process,
Chem. Eng. J. 149 (2009) 207-214.
[26] Chang E.E., Hsing H.J., Ko C.S., Chiang P.C., Decolorization, mineralization, and
toxicity reduction of acid orange 6 by iron-sacrificed plates in the electrocoagulation
process, J. Chem. Technol. Biotechnol. 82 (2007) 488-495.
[27] Canizares P., Martinez F., Lobato J., Rodrigo M. A. Electrochemically assisted
coagulation of wastes polluted with Eriochrome Black T, Ind. Eng. Chem. Res. 45
(2006) 3474-3480.
[28] Mollah M.Y.A., Pathak S.R., Patil P.K., Vayuvegula M., Agrawal T.S., Gomes J.A.G.,
Kesmez M., Cocke D.L., Treatment of orange II azo-dye by electrocoagulation (EC)
technique in a continuous flow cell using sacrificial iron electrodes, J. Hazard. Mater.
109 (2004) 165-171.
[29] Kim T.H., Park C., Shin E.B., Kim S., Decolorization of disperse and reactive dyes by
continuous electrocoagulation process, Desalination, 150 (2002) 165-175.
[30] Al-Shannag M., Al-Qodah Z., Bani-Melhem K., Qtaishat M.R., Alkasrawi M., Heavy
metal ions removal from metal plating wastewater using electrocoagulation: Kinetic
study and process performance, Chem. Eng. J. 260 (2015) 749-756.
[31] Cheballah K., Sahmoune A., Messaoudi K., Drouiche N., Lounici H., Simultaneous
removal of hexavalent chromium and COD from industrial wastewater by bipolar
electrocoagulation, Chem. Eng. Process. 96 (2015), 94-99.
[32] Gatsios E., Hahladakis J.N., Gidarakos E., Optimization of electrocoagulation (EC)
process for the purification of a real industrial wastewater from toxic metals, J. Environ.
Manage. 154 (2015) 117-127.
[33] Al-Shannag M., Bani-Melhem K., Al-Anber Z., Al-Qodah Z., Enhancement of COD-
nutrients removals and filterability of secondary clarifier municipal wastewater influent
using electrocoagulation technique, Sep. Sci. Technol. 48 (2013) 673-680.
[34] Vlachou M., Hahladakis J., Gidarakos E., Effect of various parameters in removing Cr
and Ni from model wastewater by using electrocoagulation, Global Nest J. 15 (2013)
494-503.

23
[35] Al-Shannag M., Lafi W., Bani-Melhem K., Gharagheer F., Dhaimat O., Reduction of
COD and TSS from paper industries wastewater using electro-coagulation and chemical
coagulation, Sep. Sci. Technol. 47 (2012) 700-708.
[36] Yahiaoui O., Lounici H., Abdi N., Drouiche N., Ghaffour N., Pauss A., Mameri N.,
Treatment of olive mill wastewater by the combination of ultrafiltration and bipolar
electrochemical reactor processes, Chem. Eng. Process. 50 (2011) 37-41.
[37] Drouiche N., Ghaffour N., Aoudj S., Hecini M., Ouslimane T., Fluoride removal from
photovoltaic wastewater by aluminium electrocoagulation and characteristics of
products.Chem. Eng. Trans. 17 (2009) 1651-1656.
[38] Bhatti M.S., Reddy A.S., Thukral A.K., Electrocoagulation removal of Cr(VI) from
simulated wastewater using response surface methodology, J. Hazard. Mater. 172
(2009) 839-846.
[39] Heidmann I., Calmano W., Removal of Cr(VI) from model wastewaters by
electrocoagulation with Fe electrodes, Sep. Purif. Technol. 61 (2008) 15-21.
[40] APHA (American Public Health Association). Standard methods for the examination of
water and wastewater, 20 th edition, USA, Washington D.C., 1998.
[41] Bayramoglu M., Kobya M., Can O.T., Sozbir M., Operating cost analysis of
electrocoagulation of textile dye wastewater, Sep. Purif. Technol. 37 (2004) 117-125.
[42] Donini J.C., Kan J., Szynkarczuk J., Hassan T.A., Kar K.L., The operating cost of
electrocoagulation, Can. J. Chem. Eng. 72 (1994) 1007-1012.
[43] Kobya M., Development of electrochemical reactor for treatment of industrial
wastewater, The Scientific and Technical Research Council of Turkey, Project number:
104Y267, June 2008, pp. 169.
[44] Sensoy M.T., Kobya M., Bayramoglu M., Akyol A., Optimization by response surface
methodology (RSM) of treatment of textile wastewater by electrocoagulation,
Conference on Environment problems, Kocaeli University, Department of
Environmental Engineering, 14-17 May 2008, pp. 1312-1320.
[45] Asselin M., Drogui P., Brar S.K., Benmoussa H., Blais J.F., Organics removal in oily
bilgewater by electrocoagulation process, J. Hazard. Mater. 151 (2008) 446-455.
[46] Aitbara A., Cherifi M., Hazourli S., Leclerc J.P., Continuous treatment of industrial dairy
effluent by electrocoagulation using aluminum electrodes, Desalina. Water Treat. DOI:
10.1080/19443994.2014.989411.

24
[47] Verma A.K., Dash R.R., Bhunia P., A review on chemical coagulation/flocculation
technologies for removal of colour from textile wastewaters, J. Environ. Manage. 93
(2012) 154-168
[48] Ince N.H., Tezcanli G., Treatability of textile dye-bath effluents by advanced oxidation:
preparation for reuse, Water Sci. Technol. 40 (1999) 183-190.
[49] Ramesh K.M., Saravanan K., Advanced treatment of textile yarn dyeing waste water
towards reuse using reverse osmosis membrane, Inter. J. App. Bioeng. 4 (2010) 25-33.
[50] Vlaicu I., Ciorba G.A., Electrocoagulation: An alternative method for treating industrial
wastewaters, The 6th International Conference on Hydraulic Machinery and
Hydrodynamics, Timisoara, Romania, October 21-22, pp. 729-732, 2004.
[51] Daneshvar N., Ashassi-Sarkhabi H., Tizpar A., Decolorization of orange II by
electrocoagulation method, Sep. Purif. Technol. 31 (2003) 153-162.
[52] ISKI (Istanbul Water and Sewerage Administration), Regulation Regarding the
Discharge of the Waste water into Sewage Systems, Istanbul, Turkey, 2013.
[53] Khandegar V., Saroha A.K., Electrocoagulation for the treatment of textile industry
effluent-A review, J. Environ. Manage. 128 (2013) 949-963.
[54] Zodi S., Merzouk B., Potier O., Lapicque F., Leclerc J.P., Direct red 81 dye removal by a
continuous flow electrocoagulation/flotation reactor, Sep. Purif. Technol. 108 (2013)
215-222
[55] Valero D., Ortiz J.M., Exposito E., Montiel V., Aldaz A., Electrocoagulation of a
synthetic textile effluent powered by photovoltaic energy without batteries: Direct
connection behaviour, Solar Energy Mater. Solar Cells 92 (2008) 291-297.
[56] Ardhan N., Ruttithiwapanich T., Songkasiri W., Phalakornkule C., Comparison of
performance of continuous-flow and batch electrocoagulators: A case study for
eliminating reactive blue 21 using iron electrodes, Sep. Purif. Technol. 146 (2015) 75-
84.
[57] Tyagi N., Mathur S., Kumar D., Electrocoagulation process fot textile wastewater
treatment in continuous upflow reactor, J. Sci. Ind. Res. 73 (2014) 195.198.
[58] Phalakornkule C., Sukkasem P., Mutchimsatth C., Hydrogen recovery from the
electrocoagulation treatment of dye-containing wastewater, Inter. J. Hydrogen Energy,
35 (2010) 10934-10943.
25
[59] Mollah M.Y.A., Gomes J.A.G., Das K.K., Cocke D.L., Electrochemical treatment of
Orange II dye solution-Use of aluminum sacrificial electrodes and floc characterization,
J. Hazard. Mater., 174 (2010) 851-858.
[60] Chang E.E., Hsing H.J., Ko C.S., Chiang P.C., Decolorization, mineralization, and
toxicity reduction of acid orange 6 by iron-sacrificed plates in the electrocoagulation
process, J. Chem. Technol. Biotechnol. 82 (2007) 488-495.
[61] Mollah M.Y.A., Pathak S.R., Patil P.K., Vayuvegula M., Agrawal T.S., Gomes J.A.G.,
Kesmez M., Cocke D.L., Treatment of orange II azo-dye by electrocoagulation (EC)
technique in a continuous flow cell using sacrificial iron electrodes, J. Hazard. Mater.
109 (2004) 165-171.
[62] Un U.T., Aytac E., Electrocoagulation in a packed bed reactor-complete treatment of
color and cod from real textile wastewater, J. Environ. Manage. 123 (2013) 113-119.
[63] Shin S.H., Kim Y.H., Jung S.K., Suh K.H., Kang S.G., Jeong S.K., Kim H.G., Combined
performance of electrocoagulation and magnetic separation processes for treatment of
dye wastewater, Korean J. Chem. Eng. 21 (2004) 806-810.
[64] Lin S.H., Peng C.F., Continuous treatment of textile wastewater by combined
coagulation, electrochemical oxidation and activated sludge, Water Res. 30 (1996) 587-
592.
[65] Modenes A.N., Espinoza-Quinones F.R., Manenti D.R., Borba F.H., Palacio S.M.,
Colombo A., Performance evaluation of a photo-Fenton process applied to pollutant
removal from textile effluents in a batch system, J. Environ. Manage. 104 (2012) 1-8.
[66] Rodrigues C.S.D., Madeira L.M., Boaventura R.A.R., Optimization and economic
analysis of textile wastewater treatment by photo-Fenton process under artificial and
simulated solar radiation, Ind. Eng. Chem. Res. 52 (2013) 13313-13324.
[67] Solmaz S.K.A., Birgul A., Ustun G.E., Yonar T., Colour and COD removal from textile
effluent by coagulation and advanced oxidation processes, Color. Technol. 122 (2006)
102-109.
[68] Rodrigues C.S.D., Boaventura R.A.R., Madeira L.M., Technical and economic feasibility
of polyester dyeing wastewater treatment by coagulation/flocculation and Fenton’s
oxidation, Environ. Technol. 35 (2014) 1307-1319.
[69] Rodrigues C.S.D., Madeira L.M., Boaventura R.A.R., Decontamination of an industrial
cotton dyeing wastewater by chemical and biological processes, Ind. Eng. Chem. Res.
53 (2014) 2412-2421.

26
[70] Eslami A., Moradi M., Ghanbari F., Mehdipour F., Decolorization and COD removal
from real textile wastewater by chemical and electrochemical Fenton processes: a
comparative study, J. Environ. Health Sci. Eng. 11 (2013) 1-8.
[71] Wang C.T., Chou W.L., Kuo Y.M., Chang F.L., Paired removal of color and COD from
textile dyeing wastewater by simultaneous anodic and indirect cathodic oxidation, J.
Hazard. Mater. 169 (2009) 16-22.

27
Fig. 1. Experimental setup of the CEC process.
0 10 20 30 40 50 60 70 80 900
10
20
30
40
50
60
70
80
90
100
Fe electrode
CO
D R
emo
val
Eff
icie
ncy
(%
)
Operating Time (min)
j (A/m2)
20
45
65
85
0 10 20 30 40 50 60 70 80 90 1000
10
20
30
40
50
60
70
80
90
100Al electrode
CO
D R
emoval
Eff
icie
ncy
(%
)
Operating Time (min)
j (A/m2)
20
45
65
85
Fig. 2(a). Effects of current density on COD removal efficiencies (pHi = 5.5, Q = 0.01
L/min).

28
0 10 20 30 40 50 60 70 80 900
10
20
30
40
50
60
70
80
90
Fe electrodeT
OC
Rem
ov
al E
ffic
ien
cy (
%)
Operating Time (min)
j (A/m2)
20
45
65
85
0 10 20 30 40 50 60 70 80 900
10
20
30
40
50
60
70
80
90Al electrode
TO
C R
emo
val
Eff
icie
ncy
(%
)
Operating Time (min)
j (A/m2)
20
45
65
85
Fig. 2(b). Effects of current density on TOC removal efficiencies (pHi = 5.5, Q = 0.01 L/min).
0 10 20 30 40 50 60 70 80 900
10
20
30
40
50
60
70
80
90
100Fe electrode
Tu
rbid
ity
Rem
ov
al E
ffic
ien
cy (
%)
Operating Time (min)
j (A/m2)
20
45
65
85
0 10 20 30 40 50 60 70 80 900
10
20
30
40
50
60
70
80
90
100
Al electrode
Tu
rbid
ity
Rem
ov
al E
ffic
ien
cy (
%)
Operating Time (min)
j (A/m2)
20
45
65
85
Fig. 2(c). Effects of current density on turbidity removal efficiencies (pHi = 5.5, Q = 0.01
L/min).

29
0 20 40 60 80 1000,0
0,5
1,0
1,5
2,0
2,5
Wsludge
ELC
ENC
Current Density (j, A/m2)
Slu
dg
e a
nd
Ele
ctr
od
e C
on
sum
pti
on
(k
g/m
3)
0
2
4
6
8
10
12
14
16
18
20
Fe electrode
En
erg
y C
on
sum
pti
on
(k
Wh
/m3)
0 20 40 60 80 1000,0
0,2
0,4
0,6
0,8
1,0
1,2
1,4
1,6
Wsludge
ELC
ENC
Current Density (j, A/m2)
Slu
dg
e a
nd
Ele
ctr
od
e C
on
sum
pti
on
(k
g/m
3)
0
5
10
15
20Al electrode
En
erg
y C
on
sum
pti
on
(k
Wh
/m3
)
0 20 40 60 80 100
2
4
6
8
10Fe electrode
Wsludge
ELC
ENC
Current Density (j, A/m2)
Slu
dg
e an
d E
lect
rod
e C
on
sum
pti
on
(k
g/k
g C
OD
)
0
20
40
60
80
100
120
140
En
erg
y C
on
sum
pti
on
(k
Wh
/kg
CO
D)
..
0 20 40 60 80 1000
2
4
6
8
10
12
Wsludge
ELC
ENC
Current Density (j, A/m2)
Slu
dg
e a
nd
Ele
ctr
od
e C
on
sum
pti
on
(k
g/k
g C
OD
)
0
20
40
60
80
100
120
140
160Al electrode
En
erg
y C
on
sum
pti
on
(k
Wh
/kg
CO
D)
Fig. 3. The amount of sludge generated, electrode and energy consumptions for Fe and Al
electrodes at different current densities in the CEC process.
0 20 40 60 80 1000,0
0,5
1,0
1,5
2,0
2,5
3,0
Op
era
tin
g C
ost
($
/m3 )
Current Density (j, A/m2)
Fe electrode
Al electrode
0 20 40 60 80 1000
5
10
15
20
25
Op
era
tin
g C
ost
($
/kg
C
OD
)
Current Density (j, A/m2)
Fe electrode
Al electrode
Fig. 4. Effects of current density for Al and Fe electrodes on the operating cost.
30
0 10 20 30 40 50 60 70 80 90 1000
10
20
30
40
50
60
70
80
90
Fe electrode
CO
D R
em
ov
al
Eff
icie
ncy
(%
)
Operating Time (min)
Q (L/min)
0.01
0.05
0.10
0.20
0 10 20 30 40 50 60 70 80 90 1000
10
20
30
40
50
60
70
80
90
Al electrode
CO
D R
em
ov
al
Eff
icie
ncy
(%
)
Operating Time (min)
Q (L/min)
0.01
0.05
0.10
0.20
Fig. 5(a). Effects of flow rate for both electrodes on COD removal efficiencies in the CEC
process (pHi = 5.5, j = 65 A/m2).
0 10 20 30 40 50 60 70 80 900
10
20
30
40
50
60
70
80
Fe electrode
TO
C R
em
ov
al
Eff
icie
ncy
(%
)
Operating Time (min)
Q (L/min)
0.01
0.05
0.10
0.20
0 10 20 30 40 50 60 70 80 900
10
20
30
40
50
60
70
80Al electrode
TO
C R
em
ov
al
Eff
icie
ncy
(%
)
Operating Time (min)
Q (L/min)
0.01
0.05
0.10
0.20
Fig. 5(b). Effects of flow rate for both electrodes on TOC removal efficiencies in the CEC
process (pHi = 5.5, j = 65 A/m2).
0 10 20 30 40 50 60 70 80 900
10
20
30
40
50
60
70
80
90
100Fe electrode
Tu
rbid
ity
Rem
ov
al E
ffic
ien
cy (
%)
Operating Time (min)
Q (L/min)
0.01
0.05
0.10
0.20
0 10 20 30 40 50 60 70 80 900
10
20
30
40
50
60
70
80
90
100
Al electrode
Tu
rbid
ity
Rem
ov
al E
ffic
ien
cy (
%)
Operating Time (min)
Q (L/min)
0.01
0.05
0.10
0.20

31
Fig. 5(c). Effects of flow rate for both electrodes on turbidity removal efficiencies in the CEC
process (pHi = 5.5, j = 65 A/m2).
0,00 0,05 0,10 0,15 0,20 0,250,00
0,25
0,50
0,75
1,00
1,25
1,50
1,75
2,00Fe electrode
Wsludge
ELC
ENC
Flow Rate (Q, L/min)
Slu
dg
e a
nd
Ele
ctr
od
e C
on
sum
pti
on
(k
g/m
3)
0
2
4
6
8
10
12
14
En
erg
y C
on
sum
pti
on
(k
Wh
/m3)
0,00 0,05 0,10 0,15 0,200,0
0,5
1,0
1,5
2,0
2,5
3,0
Wsludge
ELC
ENC
Flow Rate (Q, L/min)
Slu
dg
e an
d E
lect
rod
e C
on
sum
pti
on
(k
g/m
3)
0
2
4
6
8
10
12
14Al electrode
En
erg
y C
on
sum
pti
on
(kW
h/m
3)
0,00 0,05 0,10 0,15 0,20 0,250
2
4
6
8
10
12Fe electrode
Wsludge
ELC
ENC
Flow Rate (Q, L/min)
Slu
dg
e a
nd
Ele
ctr
od
e C
on
sum
pti
on
(k
g/k
gC
OD
)
30
40
50
60
70
80
En
erg
y C
on
sum
pti
on
(kW
h/k
g C
OD
)
0,00 0,05 0,10 0,15 0,20 0,250
5
10
15
20
Wsludge
ELC
ENC
Flow Rate (Q, L/min)
Slu
dg
e a
nd
Ele
ctr
od
e C
on
sum
pti
on
(k
g/k
g C
OD
)
0
20
40
60
80
100Al electrode
En
erg
y C
on
sum
pti
on
(k
Wh
/kg
CO
D)
Fig. 6. Values of sludge, electrode and energy consumptions at different flow rates in the
CEC process.

32
0,00 0,05 0,10 0,15 0,20 0,250,0
0,5
1,0
1,5
2,0
Op
era
tin
g C
ost
($
/m3 )
Flow Rate (Q, L/min)
Fe electrode
Al electrode
..
0,00 0,05 0,10 0,15 0,20 0,255
10
15
20
Op
era
tin
g C
ost
($
/kg
C
OD
)
Flow Rate (Q, L/min)
Fe electrode
Al electrode
Fig. 7. Effects of flow rate on the operating cost for Al and Fe electrodes.
0 10 20 30 40 50 60 70 80 90 1000
10
20
30
40
50
60
70
80
90
100Fe electrode
CO
D R
em
ov
al
Eff
icie
ncy
(%
)
Operating Time (min)
COD (mg/L)
1000
2000
4000
6000
8000
0 10 20 30 40 50 60 70 80 900
10
20
30
40
50
60
70
80
90
100
Al electrodeC
OD
Rem
ov
al
Eff
icie
ncy
(%
)
Operating Time (min)
COD (mg/L)
1000
2000
4000
6000
8000
Fig. 8. Effects of COD concentration on the treatment of the wastewater in the CEC process
(65 A/m2, pHi = 5.5).
0 1000 2000 3000 4000 5000 6000 7000 8000 90000,6
0,8
1,0
1,2
1,4
1,6
Op
era
tin
g C
ost
($
/m3)
COD Concentration (mg/L)
Fe electrode
Al electrode
0 1000 2000 3000 4000 5000 6000 7000 8000 90002
4
6
8
10
12
14
Op
era
tin
g C
ost
($
/kg
CO
D)
COD Concentration (mg/L)
Fe electrode
Al electrode
Fig. 9. Effects of COD concentration on the operating costs for Al and Fe electrodes.

33
Table 1. The characterizations of the textile dyehouse wastewater.
Parameters Before the CEC Average values After the CEC process
process before the CEC Fe Al
pH 6.5-7.1 6.8 8.4 8.2
COD (mg/L) 1940-2060 2000 300 460
TOC (mg/L) 520-450 485 116 136
Turbidity (NTU) 1850-2600 2225 111 111
Conductivity (mS/cm) 2.25-2.35 2.30 1.85 1.96
Total SS (mg/L) 210-250 230 10 15
Temperature (°C) 18-22 20 26 27
Fe (mg/L) - - 0.014 -
Al (mg/L) - - - 0.018

34
Table 2. The summary of studies on treatment of syntheticand real textile wastewater by continuous flow electrocoagulation process.
Dye and textile wastewater Experimental conditions* Optimum conditions* Ref.
Synthetic dye wastewater (a red dye:
mixture of 2-naphthoic acid and 2-
naphtol)
Ne: two Al electrodes (used as anode and
cathode), Connection mode: MP-P, Se = 192
cm2, Cdye = 25-200 mg/L (625-5000 mg/L
COD), pHi = 3.2-9.01, j = 20.8-62.5 mA/cm2,
CNaCl = 1500-5000 mg/L ( κ = 2.4-8 mS/cm), d
= 1 cm, Q = 25.2-78 L/h
Re,COD = 95-85%; Re,dye = 95-85%;
τ = 14 min, j = 31.25 mA/cm2,
Q = 37.2 L/h, τ = 14 min, pHi = 6.1,
κ = 2.4 mS/cm, ENC = 3.5-3.2 kWh/kg dye,
ELC = 0.155-0.180 kg Al/kg dye,
OC = 0.52-0.56 $/kg dye (Cdye = 100-200 mg/L)
[24, 25]
Synthetic dye wastewater (Reactive
Blue 49 (RB-49), Reactive Yellow-84
(RY-84), Disperse Blue 106 (DB-
106),Disperse Yellow 54 (DY-54) and
real textile wastewater
Ne: 4-7 pair as Al, Fe and stainless plate (SS)(as
both anodes and cathodes), Connection mode:
MP-P, Se = 640-1120 cm2, Cdye = 200-1000
mg/L, CCOD = 870 mg/L (wastewater), pHi = 4-
12, CNaCl = 0- 2000 mg/L, j = 1.01-4.5
mA/cm2;d = 0.5-3 cm, Q = 50-200 mL/min, τ =
26-6.5 min
Re,color = 99.5% (DB-106), 98% (DY-54), 90%
(RY-84) and72% (RB-49)
Re,COD = 62% (DB-106), 50% (DY-54), 60% (RB-
49) and 88% (RY-84),
Re,wastewater = 51.4% (COD) and 41.4% (color)
j = 4.45 mA/cm2,CNaCl= 1000 mg/L, d = 1 cm,
Cdye = 500 mg/L, τ = 13 min, Ne = 7 pairs Al
anodes, Q= 100 mL/min, the influence of the
anode: Al > SS >Fe
[29]
Synthetic textile wastewater (Direct
Red 81)
Ne: six Al plate anodes and cathodes,
Connection mode: BP-S, Se = 1200 cm2, Cdye =
50 mg/L, CCOD = 120 mg/L, Turbidity = 380
NTU, pHi = 7.5, j = 100-200 A/m2, κ =
2575 25 μS/cm , d = 1 cm, Q = 10-28 L/h, τ :
1.6-0.57 h
Re,dye = 71.5-90.2%, Re,COD = 52.3-76.1% and
Re,NTU = 99.9-95.6%,
τ : 1.6 h,j = 150 A/m2 and Q = 10 L/h (97.3%
NTU, 69.4% COD and 80.5% dye),
ENC = 52-66 kWh/kg Al (0.07-0.19 kWh/mg
removed dye)
[54]
Synthetic textile wastewater (Remazol
Red RB 133)
Ne: Al anode and two stainless plate athodes,
Connection mode: MP-P, Se = 235 cm2, Cdye =
250 mg/L, pHi = 6, j = 5-17 mA/cm2; κ= 249-
1966 μS/cm (NaCl), d = 0.75 cm, Q = 0.6-2
L/h, τ : 23-6.8 min
Re,dye = 99.3-93% (optimum 96.9%)
τ = 11.5 min, j = 10 mA/cm2,
Q = 1.2 L/h, κ : 500 μS/cm ,
ELC = 1.3-0.4 kg Al/m3 (theoretical)
[55]

35
Table 2 (continued)
Dye and textile wastewater Experimental conditions* Optimum conditions* Ref.
Synthetic textile wastewater
(Reactive Blue 21)
Ne: five pairs Fedisk electrodes (diameter = 12.2
cm), Connection mode: MP-P,Se = 1011 cm2,Cdye =
500 mg/L, κ = 2055μS/cm , d = 0.75 cm, Q = 0.75-
0.1 L/min, τ = 2-20 min
Re,color = 99%, Re,COD = 90%, j = 30 A/m2,
Q = 0.75-0.1 L/min, τ = 10-20 min,
ENC = 0.495 kWh/m3 (1 kWh/kg dye)
[56]
Synthetic textile wastewater (Basic
Red 5001 B)
Ne: one Fe anode and one Fe cathode, Connection
mode: MP-P, Se = 124.4 cm2, CCOD = 300 mg/L,
pHi = 9, j = 7.55-23 mA/cm2; κ = 4.7 mS/cm, d = 4
cm, Q = 75 mL/min, τ = 20-40 min
Re,dye = 95% and Re,COD = 76%,
τ = 20 min, j = 14-17 mA/cm2,
Q = 75 mL/min,
[57]
Synthetic textile wastewater
(Reactive Blue 140: RB 140;
Reactive Red 23: RR 23)
Ne: 25 circular shape Fe electrodes (diameter: 12.2
cm), Connection mode: MP-P, Se = 5625 cm2, Cdye
= 100 mg/L, j = 30-40 A/m2, d = 0.8 cm, pHi = 9.6,
κ = 875 25 μS/cm (NaCl), Q = 0.07-1140
mL/min, τ = 5-10 min
Re,dye = 96% (RB 140), Re,dye = 98% (RR 23)
j = 40 A/m2 (RB 140), j = 30 A/m2 (RR 23),
Q =884 mL/min, τ = 5 min, ENC = 1.42 kWh/m3
(RB 140), ENC = 0.69 kWh/m3 (RR 23),
OC = 0.152 $/m3
[58]
Synthetic textile wastewater
(Orange II)
Ne: five Al plate electrodes, Connection mode: BP-
S, Se = 1254 cm2, Cdye = 10-50 mg/L, j = 120-215
A/m2, pHi = 2-12.6, κ= 3.9-14.07 mS/cm (2-8 g/L
NaCl), d = 0.6 cm, Q = 300-575 mL/min, τ = 7.4-
4.2 min
Re,dye = 94.5%
j = 120 A/m2, τ = 7.4 min, Cdye = 10 mg/L,
pHi = 6.5, κ = 7.1 mS/cm (4 g/L NaCl),
Q = 350 mL/min
[59]
Synthetic textile wastewater (Acid
Orange 6)
Ne: six Fe plate electrodes, Connection mode: BP-S,
Se = 38.88 m2, Cdye = 50-200 mg/L, j = 0.06-150
A/cm2, pHi = 4-10, κ =200μS/dm , d = 0.5 cm, Q =
0.3-0.9 L/min, τ = 2.7-0.9 min
Re,color = 98%, Re,TOC = 40%,
j = 68.3 A/dm2, Cdye = 50 mg/L, pHi = 4,
Q = 0.3-0.5 L/min, τ = 2.7-1.6 min
[60]
Synthetic textile wastewater
(Orange II)
Ne: five carbon steel plate electrodes , Connection
mode: BP-S, Se = 1254 cm2 ,Cdye = 10-50 mg/L, j =
159.5-398.7 A/m2, pHi = 4.7-11, κ = 3.76-10.53
mS/cm (1.99-5.97 g/L NaCl), d = 0.6 cm, Q = 350-
600 mL/min, τ = 1.32-0.75 min
Re,dye = 98.5%
j = 319 A/m2, τ = 1.32 min, Cdye = 10 mg/L,
pHi = 7.3, κ = 3.81 mS/cm (2.02 g/L NaCl),
Q = 350 mL/min
[61]

36
Table 2 (continued)
Dye and textile wastewater Experimental conditions* Optimum conditions* Ref.
Real textile wastewater Semi-continuous flow packed bed
electrochemical reactor, Cylindrical Fe cathode
(height = 50 cm and diameter = 4.3 cm), Fe
hexagonal wire netting sheet anode (height =
50 cm and diameter = 1.6 cm), CCOD = 1953
mg/L, pH = 9.01, κ = 739 μS/cm , j = 20-50
mA/cm2, pHi = 3-9.01, 0.05 M Na2SO4, tEC =
10-90 min, Q = 240-930 mL/min
Re,COD = 90.84%, Re,color = %99
j = 20 mA/cm2, pHi = 9.01, tEC = 60 min,
Q = 540 mL/min and ENC = 69.1 kWh/kg COD
(for semi-continuous flow)
Re,COD = 98.5%, Re,color = 93.8%
j = 20 mA/cm2, pHi = 9.01, tEC = 60 min
Q = 20 mL/min, steady-state time = 30 min and
ENC = 51.8 kWh/m3 (for continuous flow).
[62]
Real textile wastewater Ne: one carbon steel anode and one stainless
steel cathode (tube-type electrodes),
Connection mode: MP-P, Se = 300.5 cm2
(anode) and 497.4 cm2 (cathode), CCOD = 450-
766 mg/L, Turbidity = 33.2-78.1 NTU, SS =
28-146 mg/L, pHi = 7.7-10.8, j = 142-426
A/m2; κ = 1551-2052 μS/cm , Q = 1.2-277
cm/s, τ = 0.8-1.7 min
Re,color = 96%
Re,COD = 81%,
Re,SS = 99%
τ = 0.8 min,
j = 426 A/m2,
Q = 1.2 cm/s
[63]
Real textile wastewater (dyeing and
finishing mill)
Ne: eight cast Fe anodes and eight stainless
steel cathodes, Connection mode: MP-P, Se =
3744 cm2, pHi = 4-9.4, j = 13.35-106.8
mA/cm2, κ = 3300μS/cm , CCOD = 1012 mg/L,
Q = 0.5-2 L/min, τ = 35.36-8.84 min
Re,COD = 63%
pHi = 7,j = 53.4 mA/cm2,
Q = 1 L/min, τ = 18 min,
OC = 0.34 $/m3
[64]
*j: current density, Re,p: removal efficiency, Q: flow rate, , τ : residence time in EC reactor, Se: effective electrode surface area, Ne : electrode
number, κ : conductivity, ENC: energy consumption, OC: operating cost, tEC: operating time, pHi: initial pH, MP-P: monopolar parallel, BP-S:
bipolar series.

37
Table 3. Comparisons of operating costs and treatment performances of textile wastewaters by the treatment processes except for the EC process.
Treatment process Experimental and optimum conditions Performance of treatment and
operating cost
Ref.
Photo-Fenton Process Characterization of wastewater: Real dyeing
wastewater (pH = 12.5, Turbidity = 310 NTU, CCOD =
1636 47 mg/L, CTOC = 638 8 mg/L).
Experimental conditions: pH = 2-8, [Fe2+] = 0.01-0.09
g/L, [H2O2] = 1-7 g/L, T = 35 oC and mean daily solar
irradiation = 13.6 MJ/m2.
Optimum conditions: pH = 3, [Fe2+] = 0.05 g/L, [H2O2]
= 6 g/L, irradiation time = 360 min.
Re,color = >99%,
Re,COD =94%,
Re,TOC = 85%
OC = 6.85 $/m3 (solar irradiation)
OC = 17.95 $/m3 (artificial irradiation)
[65]
Solar Photo-Fenton Process Characterization of wastewater: Synthetic polyester
dyeing wastewater (pH = 8.3, κ = 2.9 mS/cm, CCOD =
517.9 mg/L, CDOC = 143.1 mg/L and CBOD = 130.7
mg/L), Synthetic acrylic dyeingwastewater (pH = 6.8,
κ = 1503mS/cm, CCOD = 828.1 mg/L, CDOC = 334.1
mg/L and CBOD = < 1 mg/L), Synthetic cotton dyeing
wastewater (pH = 11.4, κ = 23.2 mS/cm, CCOD = 350
mg/L, CDOC = 117.5 mg/L and CBOD = 77.5 mg/L).
Experimental conditions: pH = 2-8, [Fe2+] = 0-350
mg/L, [H2O2] = 0.625-20 g/L, light flux = 7-500
W/m2and irradiation time = 120 min, pH = 3.5 and T =
50 oC.
Optimum conditions: [H2O2] = 6.5, 3.75 and 0.938 g/L
for acrylic, cotton and polyester dyeing; [Fe2+] = 113.8,
112.5 and 131.2 mg/L for acrylic, cotton and polyester
dyeing; light flux = 500 W/m2.
Re,color = 98-99% (for all wastewaters)
Re,COD = 72% (acrylic), 55.4%
(polyester), and 30.1% (cotton)
OC = 5.8 €/m3 (for acrylic dyeing)
OC = 3.5 €/m3 (for cotton dyeing)
OC = 1 €/m3 (for polyester dyeing)
[66]

38
Table 3 (continued)
Treatment process Experimental and optimum conditions Performance of treatment and
operating cost
Ref.
Coagulation (P-1: FeSO4 and P-2: FeCl3)
Fenton oxidation (P-3)
Fenton-like oxidation (P-4)
Ozone oxidation (P-5)
Peroxone process (O3+H2O2) (P-6)
Real textile wastewater (biologically pre-treated textile
industry effluent), pH = 7.8, κ = 6.14 mS/cm, CCOD =
160 mg/L, Ccolor = 0.193 (per cm at 600 nm).
Experimental conditions: Coagulant dosage: 50-700
mg/L (P-1 and P-2), H2O2 and FeSO4 or FeCl3 dosages:
100-500 mg/L and 100-500 mg/L and pH = 2-7 (P-3 and
P-4), time = 5-90 min, pH = 3-11, O3 dosage = 20
mg/min (P-5), H2O2 dosage = 5-25 mg/L and time 2-14
min (P-6).
Optimum conditions: 450 mg/L FeSO4 and 350 mg/L
FeCl3 (P-1 and P-2), FeSO4 (400 mg/L H2O2) (P-3), 350
mg/L FeCl3 (200 mg/L H2O2) (P-4), 360 mg/L O3 (P-5),
360 mg/L O3 and 5 mg/L H2O2 (P-6).
P-1: Re,COD = 62%, Re,color = 99%
OC = 5.02 $/m3
P-2: Re,COD = 64%, Re,color = 91%
OC = 0.19 $/m3
P-3: Re,COD = 78%, Re,color = 95%
OC = 0.59 $/m3.
P-4: Re,COD = 64%, Re,color = 71%
OC = 0.57 $/m3.
P-5: Re,COD = 43%, Re,color = 97%
OC = 4.94 $/m3
P-6: Re,COD = 54%, Re,color = 99%
OC = 5.02 $/m3
[67]
P: Process
Fenton (P-1)
Coagulation/Flocculation+Fenton (P-2)
Fenton+Coagulation/Flocculation (P-3)
Characterization of wastewater: Synthetic polyester
dyeing wastewater (pH = 8.3, CCOD = 517.9 7.3 mg/L,
CDOC = 143.1 0.7 mg/L, CBOD = 130.7 2.8 mg/L).
Experimental conditions: For P-1 (operating time = 0-
120 min, [Fe2+] = 275-400 mg/L and [H2O2] = 1-10
g/L), for P-2 (T = 10-70 oC, [Fe2+] = 0-241.3 mg/L,
operating time = 0-120 min and [H2O2] = 500-1500
mg/L), for P-3 ([Fe2+] = 0-241.3 mg/L, operating time =
0-120 min and [H2O2] = 500-1500 mg/L).
Optimum conditions: [H2O2] and [Fe2+] = 2.5 g/L and
350 mg/L (P-1), 1 g/L and 191.3 mg/L (P-2), 1.25 g/L
and 350 mg/L (P-3), pH = 3.5 and T = 50 oC.
Re,COD = 57.3%, Re,BOD5 = 52%,
Re,DOC = 55.7%,
OC = 2.7 €/m3 (for the P-1).
Re,COD = 79.2%, Re,BOD5 = 61.9%
Re,DOC = 75.7%,
OC = 3.1 €/m3 (for the P-2).
Re,COD = 78.9%, Re,BOD5 = 73.3%,
Re,DOC = 82.9%,
OC = 1.3 €/m3 (P-3).
[68]

39
Table 3 (continued)
Treatment process Experimental and optimum conditions Performance of treatment and
operating cost
Ref.
Fenton (P-1)
Coagulation/Flocculation+Fenton (P-2)
Fenton+Coagulation/Flocculation (P-3)
Biological oxidation+Fenton (P-4)
Characterization of wastewater: Real cotton dyeing
wastewater (pH = 10, κ = 11.5 mS/cm, CCOD = 495
mg/L, CDOC = 174.7 mg/L, CBOD = 127.5 mg/L)
Experimental conditions:
For P-1: (operating time = 60 min, T = 50 oC, pH = 3.5,
[Fe2+] = 37.5-300 mg/L and [H2O2] = 0.938-10 g/L).
For P-2: (200 mg/L Fe2+ and flocculant: 0.5 mg/L
Magnafloc 155 at coagulation/flocculation stage; 98.3
mg/L Fe2+, 500 mg/L H2O2, pH = 3.5, operating time =
60 min and T = 50 oC at Fenton stage).
For P-3:(18.8-37.5 mg/L Fe2+ and 2.5 mg/L Magnafloc
155 at coagulation/flocculation stage, 0.625-1.25 mg/L
H2O2, pH = 3.5, T = 50 oC, operating time = 60 min at
Fenton stage).
For P-4: (pH = 3.5, T = 50 oC, 1.25 g/L H2O2 and 37.5
mg/L Fe2+).
Optimum conditions:
[H2O2] = 1.25 g/L and [Fe2+] = 37.5 mg/L for P-1
Above experimental conditions for P-2
[H2O2] = 0.938 g/L and [Fe2+] = 37.5 mg/L for Fenton
stage for P-3
[H2O2] = 0.938 g/L and [Fe2+] = 37.5 mg/L, last four
cycles for SBR (sequential batch reactor) for P-4:
For P-1:Re,COD = 53%, Re,BOD5 =
33.6%, Re,DOC = 52.8%, Re,color =
94.3%, OC = 1.4 €/m3.
For P-2: Re,COD = 70.8%, Re,BOD5 =
47.6%, Re,DOC = 66.1%, Re,color =
99.5%, OC = 1 €/m3.
For P-3: Re,COD = 62.6%, Re,BOD5 =
47.5%, Re,DOC = 64.4%, Re,color =
96.6%, OC = 1 €/m3.
For P-4:Re,COD = 63%, Re,BOD5 =
49.5%, Re,DOC = 64.6%, Re,color =
96.5%, OC = 2.3 €/m3.
[69]

40
Table 3 (continued)
Treatment process Experimental and optimum conditions Performance of treatment and
operating cost
Ref.
Electrochemical Fenton (EF)
Chemical Fenton (CF)
Characterization of wastewater: Real textile wastewater
(pH = 6.5, κ = 0.5 mS/cm, CCOD = 1800 mg/L, Ccolor =
1080 ADMI, CBOD5 = 320 mg/L).
Experimental conditions:
For EF: (Fe anode and cathode (Se = 40 cm2, d = 3 cm),
operating time = 0-60 min, [H2O2] = 989-2472 mg/L,
j = 3.75-11.25 mA/cm2 and pH = 3.
For CF: [Fe2+] = 50-350 mg/L, operating time = 0-150
min and [H2O2] = 989-2472 mg/L.
Optimum conditions: [H2O2] = 1978 mg/L (for CF and
EF), [Fe2+] = 250mg/L (CF), j = 8.75 mA/m2 (EF),
operating time = 60 min (EF) and 120 min (CF).
Re,color = 72.9% and Re,COD = 70.6%,
OC = 17.56 $/kg COD (for EF).
Re,color = 52.3% and Re,COD = 51.2%,
OC = 8.6 $/kg COD (for CF)
[70]
Electro-oxidation process Characterization of wastewater: Realtextile wastewater
(pH 8.84, κ = 1.94mS/cm, 2175 color (ADMI unit),
1354 mg/L COD, 183.4 mg/L).
Experimental conditions: j = 20-80 mA/cm2, NaCl = 0-
20 g/L, operating time = 0-240 min, pH = 8-11, T = 25-
40 oC
Optimum conditions: j = 80 mA/cm2, NaCl = 20 g/L, pH
= 8, T = 40 oC, operating time = 240 min.
Re,color = 98.5%
Re,COD = 51.5%
OC = 643 $/kg COD
[71]