getting to higher-quality assessments: evaluating costs, benefits · pdf file ·...
TRANSCRIPT

iAffording Higher Quality Assessments
Getting to Higher-Quality Assessments: Evaluating Costs, Benefits, and Investment Strategies
By Barry Topol, John Olson, & Ed RoeberWith assistance from Pat Hennon
Stanford Center for Opportunity Policy in Education

Acknowledgements
This report was prepared with the generous support of the Hewlett Foundation. The authors would like to thank Linda Darling-Hammond and Frank Marshall Adamson for their invaluable input and advice, as well as the many individuals in state and local education agencies who provided information for this report.
Citation: Topol, B., Olson, J., Roeber, E., & Hennon, P. (2013). Getting to higher-quality assessments: Evaluating costs, benefits, and investment strategies. Stanford, CA: Stanford University, Stanford Center for Opportunity Policy in Education.
Stanford Center for Opportunity Policy in Education
Barnum Center, 505 Lasuen MallStanford, California 94305Phone: 650.725.8600 [email protected]://edpolicy.stanford.edu@scope_stanford

Table of Contents
Executive Summary .......................................................................................................... i
Introduction ..................................................................................................................... 1
Impact of NCLB on Testing Costs ............................................................................... 1
The Need for Measures of Higher Order Skills ............................................................ 2
Methodology .....................................................................................................................4
Overview of Study Procedures .....................................................................................4
Results ...............................................................................................................................6
How Much Is Being Spent on Assessments Today? .......................................................6
A. Survey of State Summative Assessment Costs .............................................6
B. District Surveys on Interim/Benchmark Assessment Spending ............... 9
Overall Estimate of Current Spending Levels ........................................................... 11
How Much Might the New, Higher-Quality Assessment Systems Cost? .........................12
Review of ASG 2010 Report—The Cost of New Higher Quality Assessments ............. 12
Review of PARCC and SBAC Proposed Assessment Systems ...................................... 15
Conclusions .....................................................................................................................16
References .......................................................................................................................17
Appendix: Typical and High Quality Assessment Designs .............................................18

iAffording Higher Quality Assessments
Executive Summary
mong the many forces influencing state assessment, the issues of increasing assessment quality, cost of innovative assessments, lack of state funds, and the increased amount and frequency of testing are at the forefront. Given the current financial situation in
most states, there is concern that new assessment designs, such as those developed by the two new assessment consortia—Smarter Balanced Assessment Consortia (SBAC) and Partnership for Assessment of Readiness for College and Careers (PARCC)—need to be as cost-effective and efficient as possible, as well as supportive of higher-quality learning that is more com-parable to assessments in high-achieving nations than the tests currently in wide use in the United States today.
As policymakers consider the costs of new assessment systems, it is important to understand the costs of existing testing systems that have evolved at the local as well as state levels, cur-rently pointed at improving performance on No Child Left Behind (NCLB) summative tests. To examine these issues, the Assessment Solutions Group (ASG) conducted a research effort in selected locations across the United States to estimate the total current assessment spend-ing per student combining summative, interim, and formative assessment approaches now in place. A sample of state and district staff was surveyed to collect this information. ASG then compared current assessment spending for state summative and interim assessments against what a new higher-quality assessment system, containing these types of assessments, might look like and cost.
The ASG study brings together this current survey data from states and districts along with data from a previous ASG study (Topol, Olson, & Roeber, 2010, p. 5), an unpublished ASG survey of states (2011), and Heppen et al. (2011) on use of interim assessments by large school districts. In this report, we review the results of all of our analyses to determine the affordability of higher-quality assessments.
An examination of the data indicates that higher-quality assessment systems—those that do a better job of measuring students’ critical thinking skills —should be readily affordable in to-day’s testing environment. ASG found that the average current state spending on mathematics and ELA summative assessments required by NCLB is in the $20–$25 per student range. Ad-ditional state spending on non-NCLB required assessments (additional assessments, domains, and grades) represent a potential additional source of funding for higher-quality assessments. ASG estimates this additional spending to be roughly $10 a student.
In addition, school districts are spending an average of $15–$20 or more per student on interim assessments and data management systems to house their test data. The combined costs of typical state and local spending on interim and summative assessments in ELA and mathematics are in the vicinity of $35–55 per pupil. Ironically, these investments are made in fragmented ways on tools that are not always well-aligned and are focused on tests that, in general, measure few of the more advanced skills needed for college and careers.
A more unified system of higher-quality assessments, combining state and district spending, could result in significant additional dollars that could be made available for an integrated system of higher-quality assessments or other educational uses.
A


1Affording Higher Quality Assessments
Introduction
n the past two years, significant activity has occurred nationwide in the area of K-12 educational assessment. In particular, two large initiatives are having a major impact in these areas. They are:
• CommonCoreStateStandards(CCSS)inmathematicsandEnglishlanguage arts,
• RacetotheTop(RTTT)commonstateassessmentconsortia(general,alternate, and English language proficiency assessments).
The development of the CCSS and the common state assessments, as well as other edu-cational reforms, represent important initiatives in upgrading the educational system in the United States. The CCSS is a joint project spearheaded by the Council of Chief State School Officers (CCSSO) and the National Governors Association (NGA) that devel-oped a common set of content standards for the states to benchmark their academic standards to some of the more rigorous educational systems in the world. These stan-dards are being used to focus the curriculum on the rigorous skills students will need to succeed in the 21st century and help states in terms of improving student education and assessment. As of early 2013, 45 states and the District of Columbia have adopted them.
The RTTT common state assessments, aligned to the CCSS, intend to make assessment an integral part of curriculum and instruction that actually improves student learning. The two main common assessment consortia, the Partnership for Assessment of Readi-ness for College and Careers (PARCC) and the Smarter Balanced Assessment Consor-tium (SBAC), aim to develop the next generation of higher-quality assessments that do a better job of measuring critical thinking skills and make use of technology in devel-oping and administering the assessments. Many states are eagerly looking forward to implementing these new consortium-developed assessments in 2014-2015 and beyond.
As we look to move to higher-quality assessments, two key questions arise in the at-tempt to understand whether these next generation assessments will be affordable:
• Whatiscurrentlybeingspentonassessments?
• Howmuchmighthigher-qualityassessmentscost?
Impact of NCLB on Testing Costs
In ASG’s previous report, The Cost of New Higher Quality Assessments: A Comprehensive Analysis of the Potential Costs for Future State Assessments (Topol, Olson, & Roeber, 2010), information was presented on the current costs for state assessments. A signifi-cant increase in testing occurred as a result of No Child Left Behind (NCLB) and the result is that the total amount of statewide assessment in the United States has increased
I

2 Stanford Center for Opportunity Policy in Education
dramatically since 2001. In some states that pioneered statewide assessment programs, a more than 500% increase in the size of the state assessment program took place. The amount of change in many other states has been comparable, with many adding state-wide assessments as a state accountability policy lever for the first time in their states’ history in addition to expanding assessments to meet federal requirements.
In addition, the required state assessments that once cost just a few million dollars per state can now run to as much as $100 million per year in a large state. Even though a portion of these costs is paid from federal funds, the state portion of the costs of testing has risen dramatically in recent years. In the past decade, the total amount of testing-related costs has increased dramatically. ASG estimated that, across the entire United States, contracts for summative assessment activities now cost between $800 million and $1 billion annually and are increasing. Other studies estimate that total state assess-ment costs (summative, formative, local, etc.) run from $1 billion to $1.3 billion (Topol, Olson, & Roeber). Although this is a large sum of money, it is worth noting that it con-stitutes far less than 1 percent of the nation’s $500 billion education budget.
Also as a function of NCLB, the content and format of tests have a much greater effect on instructional practice. Not only are tests given more frequently to more children—every child in every grade level from 3 to 8 plus one high school year—but test scores are used to drive an increasing number of high-stakes decisions, including student placements, promotions, and graduation; school rankings, intervention, and closure; and, more recently, teacher evaluations, compensation, and dismissal. This means that a growing share of instructional time and effort is focused on performance on the specific test instruments that are used for summative decisions.
However, the quality of state assessments has become a significant issue. Most states that were pursuing open-ended performance assessments in the 1990s dropped them during the NCLB era, largely due to cost issues. Many states now rely solely on mul-tiple-choice items on “bubble in” types of tests. Some are tests of rote memorization rather than measuring 21st century skills. In addition, as of the 2011-12 school year, interim/benchmark testing (sometimes including interim/benchmark assessments mas-querading as formative approaches) and other types of testing have been implemented. These tests are designed to determine which students are struggling academically so as to modify instruction and improve student performance on the summative assessments. All of this additional testing means that more time must be spent preparing for the state assessments, more teacher training is required (e.g., how to use assessment informa-tion to improve instruction), additional data systems require implementation, and other activities are taking place that use significant resources.
The Need for Measures of Higher Order Skills
Little evidence exists that any of this increase in testing and test preparation is leading to improved student learning or critical thinking skills or the abilities that will prepare them for college and careers. For example, recent national results from National As-

3Affording Higher Quality Assessments
sessment of Educational Progress and from international assessments such as Program for International Student Assessment, Progress in International Reading Literacy Study, and Trends in International Mathematics and Science Study show that, except for early grades mathematics, which are generally tested as basic arithmetic, the performance of U.S. students has remained largely flat or, in some cases, decreased. Most experts agree that we need to move, as many other countries have, toward a better system that aims for assessment that is “of,” “for,” and “as” learning, one where assessments measure not only what students have learned but can become a learning tool in and of themselves for students, parents, and teachers.
Given the current financial situation in most states, new assessment designs need to be as cost-effective and efficient as possible, while it is imperative that they support higher-quality learning. Education budgets continue to be tight and all levels of government must make the best use of their educational dollars. As educators and policymakers make decisions about how to design, conduct, and pay for assessments in the future, they need to weigh and balance accurate information about the range of costs that fall on schools, districts, and states, as well as the instructional costs and benefits of differ-ent designs for assessment items and tasks. If assessments are to provide “tests worth teaching to” (Resnick, 1987), it will be critical to ensure that high-quality assessment designs are married to plans for thoughtful investment and sustainability.
The big question that underlies all of the current planning is: are we—and will we be—spending our nation’s assessment dollars wisely? More testing usually means more student time spent on testing and test preparation, more time spent for teacher training on different assessments, and more valuable education dollars spent administering and scoring the exams. If we had better and higher-quality assessment systems might we be able to:
• Doabetterjobofmeasuringstudents’criticalthinkingskills?
• Usetheassessmentsthemselvestoimprovelearningandinstruction?
And if we were able to do these things, might our assessments have instructional ben-efits that balance out their costs?
The questions of the instructional benefits of high-quality assessments—both within the United States and internationally—are treated elsewhere (see, for example, Darling-Hammond & Adamson, 2010; Parke, Lane, & Stone, 2006). This paper provides data to answer the questions of how much we spend today on assessments, how much future higher-quality assessments might cost, and how education agencies might think about their assessment choices and investments.
4 Stanford Center for Opportunity Policy in Education
Methodology
SG conducted a research effort focusing on select locations across the United States (21 state education agencies, 16 local education agencies (LEAs), and one state with data on assessment spending for each of its 174 districts) to arrive at a
rough estimate of total current assessment spending per student combining summative, interim,andformativeassessmentapproachescurrentlyinplace.Whilethesedataarenot from a nationally representative sample of all educational systems in the country, they represent a wide range of state and district types. ASG contacted a targeted sample of large and small states and districts that had implemented interim/benchmark and/or formative assessments and were willing to share their data. Therefore, although much valuable data were collected that provide important and useful information on many of the types of assessment activities that are being implemented, the results reported here may not fully represent the national situation.
Wealsoexcludedthecostsofteacherandstudenttimeforadministeringandtakingthe tests, additional teacher training and administration time associated with interim testing, test preparation time and materials, costs of student interventions designed to improve test scores, supplemental education services (SES), professional development and, perhaps most importantly, the reduction in classroom time spent on actual summa-tive assessment test preparation activities. Consequently, these results underestimate the current costs of testing systems in many ways.
ASG then examined what improved assessments might cost versus current testing costs and compared the two. Among the key issues that are addressed regarding adminis-tering higher-quality assessments is the cost of scoring open-ended and performance items, especially if these are human-scored.
Overview of Study Procedures
For this study, which included surveys of 16 LEAs and one state education agency, ASG also used data from a previous cost study (Topol, Olson, & Roeber, 2010) along with the additional information that was gathered in an unpublished ASG survey of states (2011). The following series of activities were conducted:
• ASGtookstatesummativeassessmentinformationthatweregatheredin our separate survey of 21 states in 2011 to derive an estimate of what states currently spend on existing summative assessments1. ASG obtained information on the overall structure and costs for states’ cur-rent assessment programs.
A
1ASG gathered data on each state’s entire assessment program, subjects covered, types of tests, student counts, admin-istration mode, contract costs, purpose of each assessment, etc.

5Affording Higher Quality Assessments
• Currentspendingwasadjustedtoeliminatecostsoftestsbeyondmathematics and English language arts (ELA), in states that had them.
• ASGgatheredindependentdatafrom16districtsandonestateontheirinterim assessment programs. (Few states offer interim assessments; most such tests are purchased and managed by districts.) ASG con-ducted interviews in early 2012 with staff from these districts and state to gather data on the structure and costs for their interim and forma-tive assessments and other costs related to improving student perfor-mance on the state’s summative assessment. (Some agencies call these formal interim or benchmark tests “formative assessments,” although the term formative assessment has been defined by many researchers and practitioners as a much more comprehensive process of instruc-tionally-embedded tasks, diagnostic activities, and scoring or evalua-tion exercises on the part of teachers.2Wedidnotseektocollectdataon these kinds of curriculum-embedded formative assessments and ac-tivities.)Wewerealsoabletogatherinterimassessmentspendingdatafor all of Kentucky’s 174 school districts. For the surveyed districts and state, education department staffs were asked to provide details on the following items in the survey:
1) Interim and formative assessment spending
a) Total annual costs paid to outside vendors for assessment products
b) Assessment description, mode of administration, number of admin istrations per year, domains assessed, and so forth.
c) Number of students assessed by grade
2) Annual spending on other assessments designed to improve stu- dent summative assessment performance
3) Other spending by state or district
a) Resources (labor) related to test/item development or test result reporting
b) Instructional and data management systems—ongoing operating costs
2 CCSSO defines formative assessment as follows: “Formative assessment is a process used by teachers and students during instruction that provides feedback to adjust ongoing teaching and learning to improve students’ achievement of intended instructional outcomes.”

6 Stanford Center for Opportunity Policy in Education
• Inaddition,ASGsummarizeddatafromasurveyoflargeurbanschooldistricts conducted by the Council of the Great City Schools (CGSC) and American Institutes for Research (AIR) (Heppen et al., 2011). There are 65 current district members in CGCS representing about 15% of the student population in the United States. The report from CGCS/AIR provides details on what districts are currently doing with their implementation of interim assessments. The survey has informa-tion on the types of interim testing in districts but does not include any cost data.
• ASGresearchedthepricingforeightmajorinterimassessmentprod-ucts in use today and used their average pricing as a validity check on the data ASG gathered from its district and state survey.
• ASGthencombinedper-studentpricingforinterimassessmentswiththe summative assessment data and summarized the results.
Results
n this section of the paper, we review the results of our analyses to determine how much is currently being spent on assessments and how much higher-quality assessments might cost. The answer to these two questions will allow us to get a sense as to
whether higher-quality assessments are affordable given current budget constraints.
Withthesedata,wecancomparecurrentspendinglevelsonsummativeandinterimas-sessments, both separately and combined, with the potential cost of new higher-quality assessments. The analysis shows the total funds potentially available (state, district and combined) for unified, higher-quality assessment systems.
How Much Is Being Spent on Assessments Today?
A. Survey of State Summative Assessment Costs
In 2011, ASG surveyed (unpublished) a number of state education agencies (SEAs) on the current costs of their summative assessment systems in order to gain a better sense of current assessment spending, to compare actual state spending on summative assessments with the ASG cost model predictions, and to determine if new, higher-quality assessments will be affordable given current state and district spending and financial constraints.
ASG conducted a detailed survey of the assessment components, student counts, and program costs of 21 SEAs3. The amounts reported included all fees paid to outside ven-dors for assessment services. For the survey, all states were invited to participate and 21
I
3CA,CO,CT,FL,IL,IA,KY,MD,MI,MO,NM,NC,OH,PA,SC,TN,UT,VT,WV,WI,WY

7Affording Higher Quality Assessments
$0–$9.99 $10–$14.99 $15–$19.99 $20–$24.99 $25–29.99 $30–$39.99 $40–49.99 OVER $50
3
444
State Spending on NCLB Math and ELA Assessments:Number of States in Each Per Student Cost Range
2 2
1 1
FIGuRE 1: CuRRENT STATE SuMMATIvE ASSESSMENT SPENdING
$ $10 $20 $30 $40 $50 $60 $70
NCLB Math/ELA State Spending Range–Cost/Student
$114.46
$54.50
$50.82
$40.11
$38.57
$35.88
$4.12
$8.21
$10.91
$11.10
$12.79
$13.37
$17.78
$19.08
$20.52
$20.70
$21.60
$22.00
$28.32
$30.88
$31.01
FIGuRE 2: INdIvIduAL STATE SuMMATIvE ASSESSMENT COSTS
8 Stanford Center for Opportunity Policy in Education
provided data. ASG took the data for state assessment spending and student population, made adjustments to include only the mathematics and ELA NCLB-required subjects and student counts, and then developed an estimate of the average cost per student for the mathematics and ELA NCLB-required assessment components.
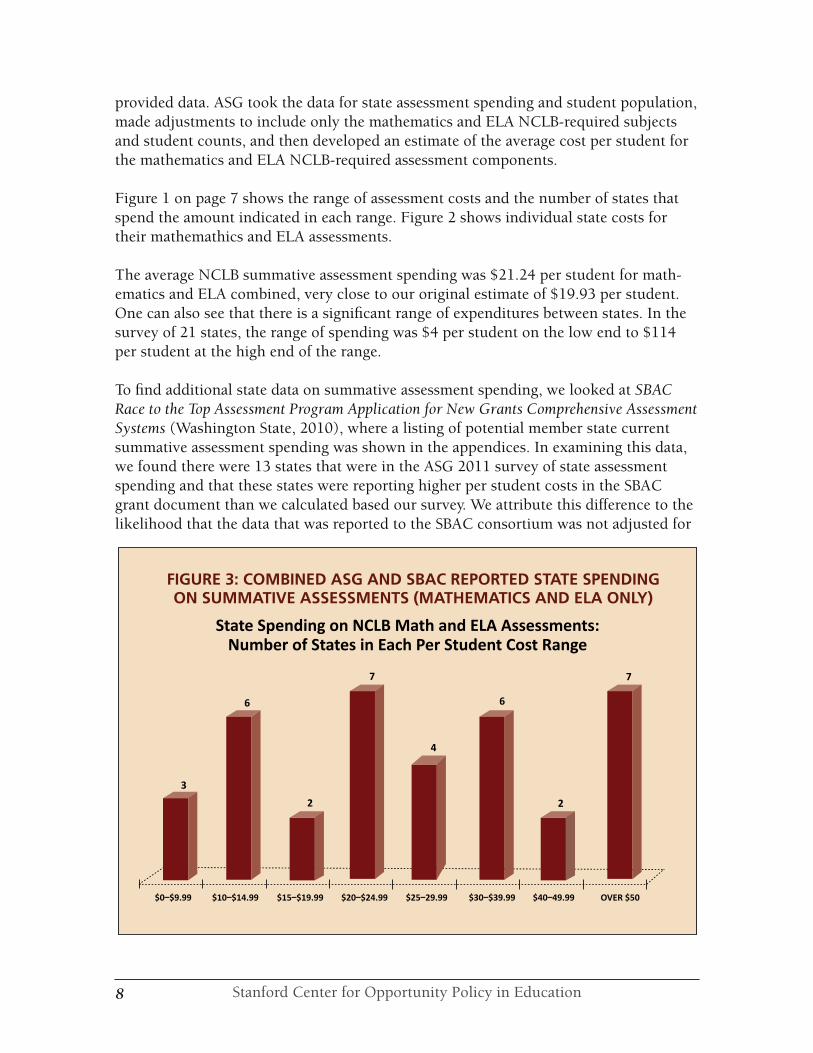
Figure 1 on page 7 shows the range of assessment costs and the number of states that spend the amount indicated in each range. Figure 2 shows individual state costs for their mathemathics and ELA assessments. The average NCLB summative assessment spending was $21.24 per student for math-ematics and ELA combined, very close to our original estimate of $19.93 per student. One can also see that there is a significant range of expenditures between states. In the survey of 21 states, the range of spending was $4 per student on the low end to $114 per student at the high end of the range.
To find additional state data on summative assessment spending, we looked at SBAC Race to the Top Assessment Program Application for New Grants Comprehensive Assessment Systems(WashingtonState,2010),wherealistingofpotentialmemberstatecurrentsummative assessment spending was shown in the appendices. In examining this data, we found there were 13 states that were in the ASG 2011 survey of state assessment spending and that these states were reporting higher per student costs in the SBAC grantdocumentthanwecalculatedbasedoursurvey.Weattributethisdifferencetothelikelihood that the data that was reported to the SBAC consortium was not adjusted for
$0–$9.99 $10–$14.99 $15–$19.99 $20–$24.99 $25–29.99 $30–$39.99 $40–49.99 OVER $50
7
6
7
6
State Spending on NCLB Math and ELA Assessments:Number of States in Each Per Student Cost Range
3
2
4
2
FIGuRE 3: COMBINEd ASG ANd SBAC REPORTEd STATE SPENdING ON SuMMATIvE ASSESSMENTS (MATHEMATICS ANd ELA ONLy)

9Affording Higher Quality Assessments
non-NCLB required subjects and student counts. Consequently, we have made adjust-ments to the data for 16 states that we did not survey and present a combined table (ASG-surveyed states plus additional SBAC-reported states, adjusted) of NCLB-required summative assessment spending in Figure 3 (page 8).
The average state spending on the mathematics and ELA components of their NCLB summative assessment programs was $24.52 per student for the larger 37-state sample. From the data above we estimate that an average state currently spends between $20 and $25 on their mathematics and English language arts NCLB assessment components.
B. district Surveys on Interim/Benchmark Assessment Spending
In 2012, ASG surveyed 16 districts and one state on their spending for interim/bench-mark assessments and test data management systems. Interim assessments and test data management systems are designed to improve student performance on the state sum-mative assessment and provide educators with the data they need to identify students potentially needing extra instructional assistance. As such, one can consider them to be part of a total summative assessment system.
It should be noted that districts also spend money on test preparation materials, teacher professional development in the assessment area, student tutoring and remediation, and other Supplemental Education Services required by NCLB. The amount spent in these ar-eas is significant. However, due to differences in data reporting and data availability at the district level, we decided to limit our analysis to district spending on interim assessments (sometimes also called formative assessments), and test data management systems.
Additionally, ASG reviewed a soon-to-be published survey by the CGCS and AIR (Hep-pen, et al.) that looked at interim assessment practices among the council’s then-67 school districts. Separate surveys in each district were administered to the research director and curriculum coordinator and 62 districts responded to the survey. These 62 districts repre-sent almost 15% of the nations’ K-12 public school students. The findings in this study al-lowed ASG to become more comfortable with the findings in its survey of school districts and helped validate the data. Among the key findings in the CGCS /AIR report:
1. use of interim assessments is prevalent in urban districts. All re-search directors indicated that interim assessments are administered in reading/English language arts in their districts, and 94% of re-search directors reported that interim assessments are administered in mathematics.
2. Interim assessments are created through a collaborative effort. Ac-cording to the research directors surveyed, assessments were created through collaboration among district-level staff, teachers, and commer-cial test publishers. Commercial test publishers were reported to have constructed interim assessments in reading in 57% of the districts and

10 Stanford Center for Opportunity Policy in Education
in mathematics in 45% of the districts. However, a higher percentage of curriculum coordinators indicated that commercial test publishers help construct the assessments in reading (76%).
3. The district provides concrete supports to encourage the use of inter-im assessment data to increase student achievement. Overall, curricu-lum coordinators reported that they received district supports. For example, 88% agreed or strongly agreed that the district has invested substantial resources to support the use of data to guide instruction and decision making.
4. A total of 45% reported that their data systems were off-the-shelf commercial products, while 49% reported their systems were created by a vendor working in collaboration with the district.
5. Nearly all districts offer training and professional development. Among curriculum coordinators, 89% reported that their district em-ploys or assigns support staff, such as data coaches, who are responsi-ble for helping schools work with student performance data, including interim assessment data.
WhiletheCGCS/AIRstudydidnotlookatdistrictcostdata,thequalitativedataprovid-ed above—the results of ASG’s district surveys—and a look at the costs of some popular interim assessment products on the market give us comfort that the spending figures gathered in our survey of districts are reasonable. In looking at the cost of interim as-sessment products, ASG examined the costs for eight vendor-developed assessments that are used by districts in their assessment programs4. The average cost of these prod-ucts is $12 per student for the base product. Additional product and reporting features, as well as data systems are typically extra. Note that many districts we surveyed use more than one product and several use additional product features, as well as an assess-ment database and reporting system.
The ASG survey of 16 districts and one state’s spending on interim assessments and as-sessment data systems found similar results to that of the CGCS/AIR report. All districts surveyed by ASG used interim assessments in their testing programs. Most districts used products developed by vendors while a few created the interim assessments themselves.
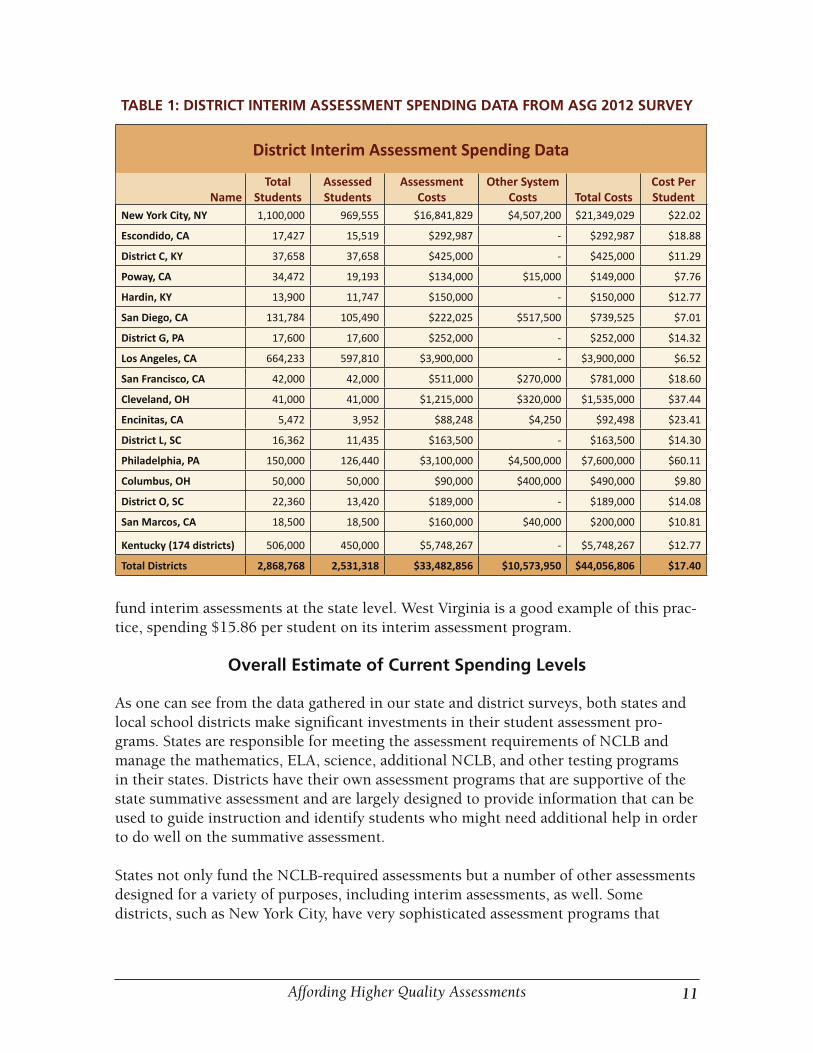
Table 1 shows the districts, number of students, and spending on interim assessments and assessment data systems.
The weighted average per-student district expenditure is $17.40 per student (un-weighted average $18.07, excluding the KY districts). Additionally, a handful of states
4 MAP-NWEA;RenaissanceLearning–STAR;PearsonGMADE/GRADE;Galileo–ATI;iReady–CurriculumAssoci-ates; ipGrowth – Core K-12 Assessment Center; Performance Series – Scantron; Accuity - CTB
11Affording Higher Quality Assessments
fundinterimassessmentsatthestatelevel.WestVirginiaisagoodexampleofthisprac-tice, spending $15.86 per student on its interim assessment program.
Overall Estimate of Current Spending Levels
As one can see from the data gathered in our state and district surveys, both states and local school districts make significant investments in their student assessment pro-grams. States are responsible for meeting the assessment requirements of NCLB and manage the mathematics, ELA, science, additional NCLB, and other testing programs in their states. Districts have their own assessment programs that are supportive of the state summative assessment and are largely designed to provide information that can be used to guide instruction and identify students who might need additional help in order to do well on the summative assessment.
States not only fund the NCLB-required assessments but a number of other assessments designed for a variety of purposes, including interim assessments, as well. Some districts, such as New York City, have very sophisticated assessment programs that
District Interim Assessment Spending Data
NameTotal
StudentsAssessed Students
Assessment Costs
Other System Costs Total Costs
Cost Per Student
New York City, NY 1,100,000 969,555 $16,841,829 $4,507,200 $21,349,029 $22.02
Escondido, CA 17,427 15,519 $292,987 - $292,987 $18.88
District C, KY 37,658 37,658 $425,000 - $425,000 $11.29
Poway, CA 34,472 19,193 $134,000 $15,000 $149,000 $7.76
Hardin, KY 13,900 11,747 $150,000 - $150,000 $12.77
San Diego, CA 131,784 105,490 $222,025 $517,500 $739,525 $7.01
District G, PA 17,600 17,600 $252,000 - $252,000 $14.32
Los Angeles, CA 664,233 597,810 $3,900,000 - $3,900,000 $6.52
San Francisco, CA 42,000 42,000 $511,000 $270,000 $781,000 $18.60
Cleveland, OH 41,000 41,000 $1,215,000 $320,000 $1,535,000 $37.44
Encinitas, CA 5,472 3,952 $88,248 $4,250 $92,498 $23.41
District L, SC 16,362 11,435 $163,500 - $163,500 $14.30
Philadelphia, PA 150,000 126,440 $3,100,000 $4,500,000 $7,600,000 $60.11
Columbus, OH 50,000 50,000 $90,000 $400,000 $490,000 $9.80
District O, SC 22,360 13,420 $189,000 - $189,000 $14.08
San Marcos, CA 18,500 18,500 $160,000 $40,000 $200,000 $10.81
Kentucky (174 districts) 506,000 450,000 $5,748,267 - $5,748,267 $12.77
Total Districts 2,868,768 2,531,318 $33,482,856 $10,573,950 $44,056,806 $17.40
TABLE 1: dISTRICT INTERIM ASSESSMENT SPENdING dATA FROM ASG 2012 SuRvEy

12 Stanford Center for Opportunity Policy in Education
include a number of different assessments used for a wide variety of purposes. It is also worth noting that New York City and the other New York state districts provide teachers to score the open ended items for the state summative assessment, thereby giving teachers important professional development experiences, as well as reducing overall state assessment costs.
An examination of the data above indicates that states spend around $20–$25 per stu-dent on their NCLB-mandated mathematics and ELA summative assessment programs. Additionally, states spend roughly $10 per student (based on our sample of 21 states) on other non-mandated testing (additional assessments, grades, and subjects) although there is a wide disparity in this spending by state. Furthermore, districts appear to be spending $15–$20 or more on their interim/benchmark assessments and data systems. All in all, states and their districts are spending $35–$55 per student on testing, not counting any of the related human resources and other time that goes into the testing and test prepara-tion, professional development, data analysis, interventions and supplemental education services designed to raise scores. All these factors are pointed at relatively narrow kinds of learning that have a dubious relationship to the skills and abilities students are now being called upon to acquire.
In total, these investments amount to many billions of dollars of educational investment that may not be leveraging the kinds of instruction required to meet the Common Core standards and to master 21st-century skills.
This raises an important question: Might our nation’s schools be able to improve test quality, and better invest valuable resources with a more integrated, higher-quality assessment system, especially if resources currently spent in uncoordinated, fragmented ways can be coordinated to support complementary assessment activities?
How Much Might the New, Higher-Quality Assessment Systems Cost?
Review of ASG 2010 Report:
The Cost of New Higher Quality Assessments
ASG conducted an analysis of the affordability of higher-quality assessments (2010) just prior to the U. S. Department of Education issuance of the Race to the Top Common AssessmentGrantguidelines.WorkingwiththeStanfordCenterforOpportunityPolicyin Education (SCOPE), ASG determined the potential cost of new, higher-quality assess-ments. In the study, ASG:
1. Calculated the “pro forma” cost of a “typical” current summative assessment used by a typical state. ASG used its Assessment Cost Model for this calcula-tion. The model used to determine the cost of the assessment included all costs necessary to develop the instrument, administer it on an ongoing basis, and refresh a percentage of the items annually. The functional areas estimated in

13Affording Higher Quality Assessments
the cost study included item development (including bias/sensitivity meet-ing travel), IT, production and manufacturing (printing), composition, QA, program management, scoring, reporting, scanning, editing, warehousing and distribution, and psychometrics.
2. Created a higher-quality assessment design. The design consisted of mul-tiple choice, open-ended items, and both short and long performance tasks. (Wetermtheseshorttasks—whichareon-demandactivitiesthatstudentscomplete in a class period involving a written activity or a performance that is observed and rated by the teacher—“performance events.” Longer activi-ties that students will work on in and outside of class for periods ranging from a couple of days to several weeks, that result in a paper, a completed project, and/or presentation are called “performance tasks.”) The higher-quality assessment design included more open-ended items than are typi-cally seen in current assessments, as well as some performance events and performance tasks designed to measure students’ critical thinking skills. (See Appendix A for the “typical” and “high-quality” test designs.)
3. Produced state cost estimates. These are estimates of what it would cost a single state to implement the higher-quality assessment design
4. Examined various strategies for reducing costs of the higher-quality assessments. These included:
a. Participating in a state assessment consortium.
b. Using computer-based technology to deliver the assessment.
c. Implementing artificial intelligence to score the assessment’s perfor- mance items.
d. Using teachers to score the performance items either, 1) as part of their professional development (non-compensated) or, 2) by com- pensating them with a stipend of $125 a day.
e. Implementing various other computer-based strategies such as using distributed scoring for the short and extended constructed response items.5
A summary of the results is shown in the charts that follow. As shown in Figure 4 (page 14), the cost of the current typical assessment (for ELA and mathematics) was esti-mated to be $19.93 per student. The cost of a single state implementing a higher-quality assessment was $55.67 per student, or almost three times that of the typical current assessment. The cost for 30 states implementing the same higher-quality assessment together, before cost reduction strategies are employed, is $38.83 per student. ASG then determined the impact of different operational strategies on reducing the per-student
5 For a copy of the full report go to http://edpolicy.stanford.edu/publications/pubs/120

14 Stanford Center for Opportunity Policy in Education
TYPICAL ASSESSMENT SINGLE STATE HIGH QUALITY ASSESSMENT
30 STATE CONSORTIA HIGH QUALITY
ASSESSMENT (PPT)
$55.67
FIGURE 4: SUMMARY OF ASSESSMENT COSTS FOR TYPICAL AND HIGHER QUALITY ASSESSMENTS
Comparison of Typical Assessment, High Quality Assessment & Consortia Based High Quality Assessment
$19.93
$38.88
$60
$50
$40
$30
$20
$10
ONLINE DELIVERY TEACHER SCORING WITH $125 STIPEND
AI SCORING–$6,000 ITEMTRAINING & $.50 ITEM
OTHER30 STATE CONSORTIA BASE PPT TEST
Higher Quality AssessmentCumulative Cost Impact of Various Assessment Delivery Options
$40
$35
$30
$25
$20
$15
$10
$5
$38.83
$35.84
$25.71 $24.78
$21.19
FIGURE 5: IMPACT OF VARIOUS COST REDUCTION STRATEGIES ON HIGHER QUALITY ASSESSMENT COSTS
Source: Topol, Olson, & Roeber (2010)
Source: Topol, Olson, & Roeber (2010)

15Affording Higher Quality Assessments
costs of the higher-quality assessment (see Figure 5, page 14). Implementing all of the strategies, including teacher scoring with a $125/day stipend, resulted in a per-student cost of $21, or roughly what the typical assessment costs today.
A key assumption in arriving at these costs estimates is that performance items and performance tasks can be scored effectively and efficiently, either by humans or using artificial intelligence. There is substantial evidence that well-designed performance tasks can be scored reliably by humans and that many can be scored reliably by computer as well (Lane, 2010). The efficient scoring of these item types will be critical to deliver-ing affordable higher-quality assessments. Cost estimates are highly sensitive to these assumptions.
Given the current costs of developing and fine-tuning algorithms for artificial intel-ligence (AI) scoring of open-ended items and tasks, in many cases the costs of human scoring are nearly comparable. Of course, with very high volume, the per-item costs of AIscoringgodownsignificantly.Withhumanscoring,theestimatedtime(andcost)forscoring decreases, somewhat, as scorers become more highly skilled.
A benefit of teacher scoring is that it supports teacher learning about the nature of the standards and assessments, and can stimulate improvements in instruction, which is a major goal of assessment policy. In some places, professional development days are used as the vehicle for teacher scoring, shifting the costs of this component of the assessment to the professional learning budget. Finding the right blend of machine and human scoring to optimize benefits and reduce costs will be an important part of building an efficient system.
Review of PARCC and SBAC Proposed Assessment Systems
ASG worked with both the PARCC and SBAC assessment consortia in 2010, assisting them in the design and cost analysis of their proposed assessment systems prior to sub-mission of their proposals to U.S. Department of Education. Subsequent to our initial work with the consortia, ASG has assisted PARCC in some further cost analysis related to its updated assessment system design.
Both the PARCC- and SBAC-proposed assessment systems are constructed to be higher-quality assessments using a variety of new item types (computer enhanced, performance related)designedtotest21stcenturyskills.Whiletheseassessmentsarestillindevel-opment, they are both expected to cost in the $18 –$25 per-student range. Again, the cost estimates are somewhat dependent on the strategies chosen to score performance events and performance tasks efficiently.
Both assessment consortia will also offer either interim and/or diagnostic assessments as part of their integrated assessment systems. These assessment components are expected to cost between $7 and $8 additional per student, although the designs for these assess-ments are still in progress.

16 Stanford Center for Opportunity Policy in Education
Conclusions
he Common Core State Standards and new assessment consortia represent two potentially significant improvements in our education system. New higher-quality assessments—those that are aligned to the Common Core, test 21st-century skills,
and assist in learning and instruction — are sorely needed in order to achieve an im-proved educational system.
An examination of the data indicates that higher-quality assessment systems—those that do a better job of measuring students’ critical thinking skills—should be readily af-fordable in today’s testing environment if delivered through a consortium with a combi-nation of online and teacher scoring. The average current state spending on mathemat-ics and ELA summative assessments required by NCLB is in the $20 –$25 per-student range, exclusive of other NCLB required tests (such as English language proficiency assessments and assessments for students with significant disabilities). Additional state spending on non-NCLB required assessments (additional subject areas, grades assessed, or different types of tests) might represent an additional source of fund-ing for higher-quality assessments, although proponents of assessments in areas such as science and social studies are likely to object. ASG estimates this amount to be roughly $10 per student (based on our survey of 21 states) although there is a wide variation in state spending for these additional assessment components. Additionally, districts are spending an average of $15 –$20-plus per student on interim assessments and data management systems to house their test results. Thus, the total costs of current interim and summative assessments average roughly $35 –$55 per pupil across the country.
Given that the two assessment consortia are estimating per-student costs of $20-$25 for summative assessments, and fewer than $10 per student for closely aligned and diag-nostically-designed formative and interim assessments, it would appear these higher-quality assessments are affordable within current budget constraints.
A more comprehensive and unified system of higher-quality assessments, combining state and district spending, would result in significant additional dollars that could be made available for higher-quality assessments or other education uses (e.g., instruc-tion for students, technology upgrades). The inclusion of aligned formative and interim assessments raises these costs much less than what states and localities are spending in the current marketplace for a much more fragmented and generally lower-quality basket oftests.Whileavarietyofhurdleswouldhavetobeworkedoutinmanystatesinorderto make this possible, the prospect of even higher-quality assessment systems is plau-sible and bears further exploration.
T

17Affording Higher Quality Assessments
References
Darling-Hammond, L. & Adamson, F. (2010). Beyond basic skills: The role of performance assessment in achieving 21st century standards of learning. Stanford, CA: Stanford University, Stanford Center for Opportunity Policy in Education.
Heppen,J.,Jones,W.,Faria,A.,Sawyer,K.,Lewis,S.,Horwitz,A.,etal.(2011).Using data to improve instruction in the Great City Schools: Documenting current practice.Washington,DC,AmericanInstitutes for Research and The Council of Great City Schools.
Lane, S. (2010). Performance assessment: The state of the art. Stanford, CA: Stanford University, Stanford Center for Opportunity Policy in Education.
Parke, C. S., Lane, S., & Stone, C. A. (2006). Impact of a state performance assessment program in read-ing and writing. Educational Research and Evaluation, 12(3), 239-269.
Resnick, L. B. (1987). Education and learning to think.Washington,DC:NationalAcademyPress.
SBAC Race to the Top Assessment Program Application for New Grants Comprehensive Assessment Systems. (StateofWashington,2010).
Topol, B., Olson, J., & Roeber, E. (2010). The cost of new higher quality assessments: A comprehensive anal-ysis of the potential costs for future state assessments. Stanford, CA: Stanford University, Stanford Center for Opportunity Policy in Education.
Topol, B., Olson, J., & Roeber, E. (2011). Unpublished survey of 21 state assessments and costs. Assess-ment Solutions Group.

18 Stanford Center for Opportunity Policy in Education
Appendix
Typical and High Quality Assessment designs
SuMMATIvE ASSESSMENT ITEM COuNTS
Mathematics
Multiple Choice
Short Constructed
Response
Extended Constructed
Response
Performance Event
Performance Task
Current Typical Assessment 50 0 2 0 0
High Quality Assessment 25 2 (1 in grade 3)
2 (0 in gr. 3, 1 in gr. 4)
2 2 (0 in gr. 3, 1 in gr. 4)
SuMMATIvE ASSESSMENT ITEM COuNTS
English Language Arts
Multiple Choice
Short Constructed
Response
Extended Constructed
Response
Performance Event
Performance Task
Current Typical Assessment (Reading) 50 0 2 0 0
Current Typical Assessment (Writing)* 10 0 1 0 0
High Quality Assessment (Reading)
25 2 (1 in gr. 3 & 4)
2 (1 in gr. 3 & 4)
2 1
High Quality Assessment (Writing)*
10 2 (1 in gr. 3 & 4)
2 (1 in gr. 3 & 4)
2 0
*Administered in grades 4, 7, and 10
Source: Topol, Olson, & Roeber. (2010).

About SCOPE
The Stanford Center for Opportunity Policy in Education (SCOPE) fosters research, policy, and practice to advance high quality, equitable education systems in the United States and internationally. SCOPE is an affiliate of the Stanford Graduate School of Edu-cation and the Center for Comparative Studies in Race and Ethnicity.http://edpolicy.stanford.edu
About the Assessment Solutions Group
The Assessment Solutions Group (ASG) is a consulting organization with a mission of assisting state departments of education and other institutions interested in improving educational assessment in adding value throughout assessment design, costing, procure-ment, and management functions. http://www.assessmentgroup.org