openness and isolation: the trade performance of the ...eprints.lincoln.ac.uk/18866/7/18866...
TRANSCRIPT
1
Openness and isolation: The trade performance of the Former Soviet Central Asian
countries
Arman Mazhikeyev a, T. Huw Edwards
a, and Marian Rizov
b *
a Loughborough University
b Middlesex University
Previous studies characterize some of the Former Soviet Central Asian countries (CACs) as
“more open” (Kazakhstan, Kyrgyzstan) and others as “more isolated” (Tajikistan, Turkmenistan
and Uzbekistan) depending on their trade-over-GDP ratio. Being an open or isolationist economy
has resulted respectively in more or less suitable environment for business and investment. We
investigate the drivers of CACs trade performance by measuring contributions of country-
specific properties and networking factors in 185 bilateral CACs trade flows over the period
1995-2011. We find that, even though all CACs’ trade has increased greatly since 1995, for the
more open economies (Kazakhstan and Kyrgyzstan) trade changes are mainly explained by
networking (bilateral) factors while for isolationist economies (Turkmenistan, Uzbekistan and
Tajikistan) changes in trade are mostly explained by country-specific properties.
Keywords: trade performance, gravity models, transition, Central Asia, FSU
* This paper is based on Arman Mazhikeyev’s doctoral thesis, however, the authors’
contributions to the paper are equal.
2
Openness and isolation: The trade performance of the former Soviet Central Asian
countries
1 Introduction
While much of the literature on post-Soviet transition has focused on the experiences of the
countries in Central and Eastern Europe and the Russian Federation, the Central Asian countries
(CACs) have received relatively less attention.1
There is no study focusing on the trade
determinants and performance of CACs, even though it has been recognized that there is a strong
correlation between success in transition from plan to market and foreign trade performance
(Kaminski et al., 1996). In addition, the international business (IB) literature has not paid enough
attention to the developments in Central Asia after the disintegration of the Soviet Union and
there is no study focusing on the business environment in CACs and their trade performance.2
Much of the existing (economics) literature has tended to treat the CACs as a relatively
homogenous region. However, after more than two decades of independence, important
differences are emerging. In terms of trade performance, the trade/GDP ratio over the period
1995-2011 is much higher for Kazakhstan and Kyrgyzstan (38% on average) than for Tajikistan,
Uzbekistan, and Turkmenistan (26% in average). This ranking also corresponds to that in the
2013 World Bank “Doing Business” report, which reflects the ease of doing business, tax
collection, investor protection, access to credit, trading across borders, corruption, economic
freedom, and competitiveness. Kazakhstan (49th
out of 183 countries) is the highest ranking CAC,
followed by Kyrgyzstan (70), Tajikistan (141), and Uzbekistan (154) while Turkmenistan is not
ranked at all. This perhaps illustrates the close ties between trade openness and overall politico-
economic reforms.
The standard transition literature emphasises a combination of initial conditions and the
reform policies adopted during the transition period (Falcetti et al., 2005 present a good review).
Both initial conditions and, especially, reform policies vary substantially. Trade performance
1 Some notable exceptions are Rumer (1995; 2000a; 200b), Pomfret (2000; 2003), Burghart and Sabonis-Helf (2004),
Starr (2004), Hausmann et al. (2005), Dowling and Wignaraja (2005; 2006), and UNDP (2005) which focus on
general economic development and political issues. 2 The IB literature has a few examples of papers on disintegration and rebuilding of networks between former Soviet
republics (e.g., Davis et al, 1996), but these papers are now rather old. Pittman (2013) covers Central Asia, but from
the limited perspective of transport system restructuring.
3
clearly reflects, in part, initial conditions, such as resource abundance, geography, transport
infrastructure, specialization, colonial ties, and so on (Elbourgh-Woytek, 2003; Grigoriou, 2007;
Levy, 2007; Pomfret, 2011; Sinitsina, 2012; Suvankulov and Guc, 2012) as well as national
business culture (Buck et al., 2000; Dow and Karunaratna, 2006; Wu et al., 2012) or corporate
governance (Filatochev et al., 2003). These are quite heterogeneous, as we discuss below.
However, there is also a strong contrast in terms of reforms enacted since the mid-1990s, as
measured by the EBRD transition indicators (Stark and Ahren, 2012). It is not easy to
disentangle the effects of varied initial conditions from those of ongoing reforms, and this is
made even harder by a changing global and regional environment which impacts the different
players to varied degrees (Levy, 2007).
In the paper, we develop an IB-inspired theoretical framework to motivate hypotheses
and investigate which factors are more important for each individual CAC by measuring the
proportional share of country-specific properties and networking factors in bilateral trade flows.
We do this by utilizing the gravity concept (e.g., Head et al., 2010; Zwinkels and Beugelsdijk,
2010), which explains bilateral trade in terms of country “masses” (country properties) and
“distances” (networking). From the previous literature in the field, we would anticipate that these
countries are all relatively isolated from the rest of the World. However, Pomfret (2006) has
indicated that some of these countries have started engaging in serious reforms, while others are
much slower – we will be seeking evidence in support of this. We therefore expect that these
countries are more heterogeneous than the previous literature has recognised. In addition to
documenting this heterogeneity, we would identify factors impacting trade, and link policy
reform to trade performance and business development.
In terms of the detailed econometric work, by taking a ratio of the ratios of bilateral trade,
we can separate country-specific from networking (bilateral) factors. Our analysis of 185 CACs
bilateral trade observations, based on a 37 country panel covering the 1995-2011 period shows
that: (i) networking factors explain 50% or more of changes in Kazakhstan’s and Kyrgyzstan’s
trade flows and 5-14% of changes in Turkmenistan’s, Uzbekistan’s and Tajikistan’s trade; (ii) 75%
of changes in the 185 bilateral CACs’ trade flows are mainly explained by country specific
properties, i.e., monadic driven trade; (iii) 25% of the 185 bilateral CACs’ trade flows are
explained by networking (bilateral) factors such as transport costs, combined with

4
landlockedness and RTAs, i.e., dyadic driven trade; (iv) open CACs are more sensitive to global
and regional shocks compared to isolationist CACs.
2 Context, theory and hypotheses
2.1 The CACs context
All the CACs became independent in 1991. Similarities in initial conditions reflect their history,
geographic closeness and cultures. CACs populations originate from the same Turkic tribes.
Historically, all were colonized by Tsarist Russia and belonged to the Soviet Union for over 70
years. All geographically landlocked, CACs differ in terms of neighbours, land sizes and
landscape, size of population, endowment of natural resources, and historic production
specialization. Kazakhstan possesses the largest territory, borders with Russia and China and has
relatively better rail and road connections left from Soviet times. It is well endowed with oil, coal,
metals and agricultural land. By contrast, Kyrgyzstan and Tajikistan are mountainous, smaller in
size and population and have mountain borders with China and Afghanistan. Uzbekistan has a
relatively large population, possesses substantial natural gas reserves and good conditions for
cotton production. Turkmenistan is much more sparsely populated, but well-endowed with
natural gas.
Pomfret (2005) among others concludes that transition reforms proceeded faster in
Kyrgyzstan and Kazakhstan and slower in Tajikistan, Uzbekistan and Turkmenistan. EBRD
transition indicators show a similar ranking in terms of privatization and price liberalization -
policies which are an important stage of ongoing transition reforms (Barlow and Radulescu,
2005; Stark and Ahren, 2012). Although Uzbekistan did well with price liberalization in the mid-
1990s, it kept enterprises under state control and has been slow with other reforms. Gas-rich
Turkmenistan has been reluctant to make substantial changes in its economy, although after the
death of the president Nyazov in 2006 the country has begun to liberalize. Tajikistan went
through a civil war (1992-1997) and since then has been slow to implement reforms.
The CACs faced huge trade and production hardships with the Soviet collapse and
subsequent hyperinflation in 1991-1996. Within a year of independence trade with Russia fell
tenfold (Sinitsina, 2012). Later, in 1998-1999, the CACs were hit by the Russian financial crisis.
Despite these circumstances, countries were already beginning to diverge in terms of
international integration – particularly, though not exclusively with Russia. Already by 1998
5
Kazakhstan, Kyrgyzstan and Tajikistan had joined several major RTAs with Russia, including
the CISFTA in 1994, EurAsEc and SCO in 1996 while Uzbekistan and Turkmenistan were only
observers (see Appendix, Box 1). The CACs’ trade with Russia was damaged substantially by
the 1998 crisis, especially those countries which had engaged in integration (Westin, 1999). The
more isolationist Turkmenistan and Uzbekistan had less exposure. The period 2000-2007 was
more fruitful as world prices for the CACs’ primary export goods (oil, gas, cotton) accelerated
and volumes of trade and FDI inflows, mainly from China and Europe, increased. The main
beneficiaries were the more open economies, but Uzbekistan and Turkmenistan also benefited
from a global boom and increasing global gas demand, negotiating with China and Iran to reduce
their dependence on the Russian market. The 2008 crisis had both direct and indirect effects on
the CACs’ trade and economic wellbeing. The exposure of Kazakhstan’s banks to the global
financial crisis spread to Tajikistan and Kyrgyzstan. Uzbekistan and Turkmenistan which had
more limited financial links with the other CACs, Russia and rest of the world where originally
less affected by the crisis.
2.2 Theory and hypotheses
A game tree of openness and trade: actors and interactions
The degree of openness or isolation of an economy can be seen as the outcome of the interaction
of decisions of a number of actors in response to their environment and to each other. The
principle actors in any economy constitute consumers/voters, government, MNEs and local firms:
however, we should also note that the specific post–Soviet environment tends to include
important roles for ethnic (particularly Russian) minorities and for the politically-connected
oligarchs who rose during and just after the fall of Communism. Broadly speaking, Figure 1
shows a game tree outlining the interactions of these actors.
- Figure 1 here -
Trade policy is set by the governments, and may take the form of multilateral
liberalisation or regional integration (the latter being increasingly favoured by the intended
development of the Eurasian Union). Governments also set the regulatory environment
governing trade and FDI, and have influence on the legal environment, as well as influencing the
quality of transport linkages and border efficiency. The presence of multinational agreements

6
and RTAs shows that governments interact with one another: particularly their neighbours (and
the rest of the world).
At the same time, however, the trade performance of an economy depends upon the
decisions of other actors (at micro level), notably firms. If the larger local firms and MNEs
respond to liberalisation by expanding trade greatly, then the country will see an increase in
competition and specialisation gains from trade, in turn benefiting consumers. The more elastic
is firms’ response, the less will be the ‘beggar-my-neighbour’ incentive of a country to protect its
economy for terms-of-trade reasons (Edwards, 2010). Firms’ responses will, of course, reflect
remoteness and transport networks, as well as ‘psychic’ distance as demonstrated by Dow and
Karunaratna (2006). Limao and Venables (2001) find that trade performance is affected by high
overland transport costs of goods. Historic business networks (Rauch and Trindade,. 2002) and
their collapse and re-emergence (Davis et al., 1996) and colonial ties (Head et al., 2010)3 also
play an important role. To the extent that MNEs drive the trade response, their liability of
foreignness (Zaheer, 1995, 2002) can be an important factor as well. However, Yildiz and Fey
(2012) argue that in transition (and emerging) countries the liability of foreignness is relatively
less important due to ability of NMEs to bypass local suppliers, customers’ favourable
stereotypes and curb of appeal brought by the MNEs, and possibly host governments’ desire for
FDI and foreign technology (e.g., Bevan et al., 2004).
Depending upon the response of firms, there will be gains in income (perhaps with
offsetting losses in security) to voters (in Figure 1, defined as theta which will increase).
However, in countries of limited democracy with powerful oligarchs, the lobbying power of the
latter is also crucial: if oligarchs’ power is based in exporting industries (such as through the
control of natural resources), they may favour trade expansion, while if they control import-
competing industries they will resist growth in trade or FDI (in Figure 1, (1-theta) will increase).
In line with standard political economy bargaining theory, we can see the decision-
making by government as reflecting the relative bargaining weights of voters and oligarchs,
which will be dependent on the political and institutional makeup of the country.
The actors in the CACs
3Acharya et al. (2011) assert the impact of colonial ties between former Soviet countries on current trade patterns.

7
Governments: A recent IMF Survey (IMF, 2012) finds a strong correlation between political
regime and trade policies of the CACs. While all countries have relatively authoritarian regimes,
there are still considerable differences in political systems. Kyrgyzstan and Kazakhstan are
somewhat more liberal compared to Tajikistan, Turkmenistan and Uzbekistan. Kaser (1998) and
Luong and Weinthal (2002) link CACs’ economic performance to variation in political regimes,
as Kazakhstan is characterized as “populist with soft autocracy”, Kyrgyzstan as “dualist with
electoral democracy”, and Uzbekistan, Tajikistan and Turkmenistan as “centralist with hard
autocracy”. Reflecting this, economic liberalisation of each CAC is at different stages. There are
many other related country-specific features (majority and minority population make up,
liberalisation level, FDI level and so on) that affect CACs trade performance. Some CACs
(Turkmenistan, Uzbekistan and Tajikistan) have a higher level of government intervention and
state control in their economies compared to others (Kyrgyzstan and Kazakhstan) where the
economy is more liberal and relatively more influenced by regional or global economic
conditions.
Firms: According to Pomfret (2010), Turkmenistan, Uzbekistan and Tajikistan, relative
to Kazakhstan and Kyrgyzstan, are among the slowest of the transition economies to reform,
with firms facing less competition and softer budget constraints compared to Russia, let alone the
EU Accession states. Nevertheless, the CACs, like other transition countries, have experienced
radical transformations in their political and business landscapes due to the wave of deregulation
and liberalization of their economies after the dissolution of the Soviet Union (Hoskisson et al.,
2000; Filatotchev et al., 2003). These dramatic economic and political changes affecting CACs
firms can be seen as regulatory punctuations leading to radical environmental change (Haveman
et al., 2001; Perez-Batres and Eden, 2008). Firms’ strategic responses to radical environmental
change are an important factor for the aggregate trade performance of CACs.
To better understand firm responses to regulatory punctuations in the CACs, we find
useful insights in the IB literature on liability of foreignness, and particularly the extension to
this concept by Perez-Batres and Eden (2008) who introduced the parallel concept of “liability of
localness”. Eden and Miller’s (2004) definition of liability of foreignness focuses on the socio-
political and relational hazards associated with “being a stranger in a strange land”. Similar to
liability of foreignness facing potential MNE incomers (e.g., Zaheer and Mosakowski, 1997;
Eden and Miller, 2004), the ongoing transition reforms are producing a degree of ‘liability of

8
localness’ (Perez-Batres and Eden, 2008), with local firms less familiar with operating in a
globalised and marketised environment. Thus, liability of localness is about the added costs
faced by local firms, adjusting to “now” being different from “then”; the competitive landscape
facing the firms has shifted markedly, necessitating new strategies for survival. Local firms need
to learn the ‘rules of the game’ under liberalisation (Dunning, 2003; Miller and Pisani, 2007).
Perez-Batres and Eden (2008) demonstrate that emerging market firms with international
experience in developed countries can better interpret their home market evolving institutions
which in turn lessens the emerging market firms’ liability of localness. In a related analysis
D'Aveni and Macmillan (1990) show that under strenuous situations, such as regulatory
punctuations, firms focusing their attention on the external environment outperformed those
focusing their attention on the internal aspects of the business. Their argument rests on the notion
that most internal aspects of the business are not necessarily aligned with the new business
landscape and need to change. Alternatively, firms that focus on the internal aspects of their
business, during strenuous situations, may be operating under the assumptions of past cognitive,
normative, or regulatory structures. Given the prevailing privatization methods in CACs such as
buyouts by local managers and “give-away” deals (Filatotchev et al., 2003) many firms with
incumbent managers have focused their attention on the internal aspects of the business thus
facing high liability of localness.
Furthermore, under uncertain political and economic conditions such as after the
dissolution of the Soviet Union, many CACs firms would have not necessarily understood their
new institutional environment and this misconception (Scott, 1997) has hindered their ability to
function. According to March (1988), the greater the uncertainty, the more likely organizations
are to engage in exchange relations with those with whom they have transacted in the past and
with those of similar status. Thus, in the CACs, given that many firms were trading or had closer
organisational links with firms from other Soviet Union countries, especially Russia, it is likely
that trade patterns after political independence and market liberalisation will remain strongly
associated with the former Soviet Union countries, and in particular Russia. Such an assertion is
also in line with Dow and Karunaratna’s (2006) concept of ‘psychic’ distance stimuli.
In summary, the implication for our theoretical framework is that the liability of localness
produces a position where oligarchs and state-actors in industries opening to foreign competition
may lose. In turn, the weakness of local firms – the liability of localness - increases the profit-

9
shifting motives for protectionism (Bagwell and Staiger, 2012), and also increases the risks of
protectionist lobbying by oligarchs.
Voters and the role of minorities: Although Russian-speaking minorities have shrunk
considerably since 1989, estimates from 2007 suggest that there were still 4 million ethnic
Russians in Kazakhstan (25% of the population) and 500,000 (or about 10% of the population) in
Kyrgyzstan. By contrast, the formerly sizeable Russian populations in Uzbekistan, Tajikistan and
Turkmenistan have shrunk to less than 3% of the population (Peyrouse, 2008). Given that the role
of language ties is often emphasised as a driver of trade (Dow and Karunaratna, 2006), it is likely
that Russian minorities will stimulate policy towards openness – at least in the form of RTAs
with Russia (and Belarus). This is magnified by the increasing foreign policy assertiveness of
Russia vis a vis ethnic Russians beyond its borders.4 Ethnic composition and pressure from
Russia may both explain why Kazakhstan and Kyrgyzstan are more open – yet more biased
towards Russia – in trade than other CACs.
The environment and specificities of CACs: The CACs are large in area, though sparsely
populated, and are all landlocked. This reduces trade potential, compared to countries with sea
ports. Raballand (2003) emphasizes the variation in the effect of landlockedness in each CAC.
Adding to this are issues of transport infrastructure and logistics services in the CACs (Grigoriou,
2007). Reduced trade potential also reduces the potential benefits to a country from trade
liberalisation. Again, Kazakhstan, which has industrialised border areas closer to the Russian
Urals, may have more trade potential than countries further to the South.
Resource endowment has an important influence on trade performance. Auty (2001),
World Bank (2002), Pomfret (2004), Felipe et al. (2012) all point out that there is a strong
correlation between the resource abundance and trade performance of the CACs. Turkmenistan
and Kazakhstan can be viewed as much richer in resources than the other CACs; while this has a
clear effect on trade outcome (the recovery in resource prices from 2000 boosted these
economies), the effect upon policy is harder to determine, since Kazakhstan is relatively open
and Turkmenistan isolationist.
Historical environment also affects current performance by government and firms. The
role of inter-firm networking is explored in Davis et al. (1996) for the case of decline and re-
emergence of Soviet era ties in Estonia – but similar networking factors apply to Central Asia.
4 http://www.eurasiareview.com/06082014-post-crimea-central-asian-fear-putins-stick-analysis/
10
Historically poor governance may make effective trade reforms difficult. Tai and Lee (2009)
emphasise bureaucratic barriers to trade: investors spend 20% (in Kazakhstan and Kyrgyzstan)
and 48% (in Tajikistan, Turkmenistan, and Uzbekistan) of their time to deal with unnecessary
bureaucracy. Using the 2010 World Bank Governance Indicators (WGI), Magilevski (2012)
points out the heterogeneity of governance efficiency; out of 230 countries, Kazakhstan ranks
138, Kyrgyzstan 171, Tajikistan 187, Uzbekistan 199, and Turkmenistan 201. The importance of
governance environment for trade is also emphasized by Wu et al. (2012).
Hypotheses: expectations and feedback in the openness game
Non-government actors will affect government policy via three routes. The first is through direct
feedback: the various players will support or oppose reform depending upon their perceived self-
interest: their influence will depend upon the political reality and bargaining power. The second
is through expectations (affected by uncertainty), as in any forward-looking game expected gains
will determine the nature and degree of lobbying. The third is the interaction of different lobbies
across countries, given that the benefits of trade liberalisation are usually greater when the
countries act concertedly.
The history of post-Communist transition countries’ reform process is also important in
determining whether a country is likely to engage in further liberalisation. Based on EBRD data,
Barlow and Radulescu (2005) find, for example, that reform is more likely to continue and
spread to other areas in economies where there is early privatisation of small business. This may
well feed back through differences in the lobbying balance within the economies.
Trade outcomes (the relative size and changes in trade for each CAC) can be seen in
Table 1. Crucially, observed trade in all CACs has recovered sharply in the period since 1998.
The common factor is that incomes in the Central Asian region grew sharply, spurred by growing
demand from its main export market (Russia) and, in resource-rich countries, by rising mineral
prices. While Kyrgyzstan may have seen lower export growth than, say, Turkmenistan, this
difference can be explained by the fact that the latter is a major gas exporter, at a time when
fossil fuel demand was buoyant, while the former is resource-poor.
- Table 1 here -
Clearly, observed changes in trade volumes reflect the complex interactions represented
in the openness game tree: the key role of gravity analysis that follows is in decomposing and
11
quantitatively explaining the outcomes depicted in Table 1. Following on the discussion in our
theory section and to help interpret in a structured way our gravity analysis results we formulate
four empirical hypotheses:
H1: The observed recovery in trade volume (outcome measures of global integration) is
not necessarily driven by falling trade costs (policy measure), but partially reflects other
country specific or environmental factors.
H2: Networking (bilateral) factors have strongly boosted trade in the more open CACs,
whereas the more isolationist countries’ trade has grown in spite of, rather than because
of, trade policy.
H3: The countries which have opted for stronger regional integration with other CIS
states are also more open towards the Rest of the World (RoW) than the isolationist
CACs.
H4: Cyclical fluctuations in the trade of the more open CACs are more closely linked to
those of the RoW while isolationist CACs’ trade is only weakly affected by cyclical
fluctuations in the RoW economies.
If trade reforms can be seen as part of an overall reform process, then we would
anticipate that the more reforming countries are reducing the liability on foreign firms doing
business, but the trade-off is that the liability on local firms is increased. However, this may in
turn spur reforms among local firms, increasing their ability to export. This dynamic process is
consistent with the more macroeconomic-level predictions in H2. The ability to export more to
the RoW in H3 again reflects the effects of trade reforms within the CIS, and Kazakhstan and
Kirgizstan, prompting restructuring of local firms, overcoming their liability for exporting.
3 Methodology and data
3.1 The gravity concept
We utilise the gravity model of trade (GMT), a modified form of Newton's gravity equation, this
predicts bilateral trade flows based on economic sizes and geographic distance of two trading
countries (Zwinkels and Beugelsdijk, 2010). The GMT has been proven to be consistent with
empirical findings, and to which have been added theoretical foundations (Anderson and van
Wincoop, 2003; Bergstrand, 1989; Deardorff, 1998; Eaton and Kortum, 2002; Chaney, 2008;

12
Helpman et al., 2008). We start with Anderson and van Wincoop’s (AvW, 2003) theory-based
GMT which takes the following form:
𝑥𝑖𝑗 =𝑦𝑖𝑦𝑗
𝑦𝑤(
𝑡𝑖𝑗
𝑃𝑖𝑃𝑗)1−𝜎, (1)
where 𝑥𝑖𝑗 is nominal exports from country i to country j, 𝑦𝑖 and 𝑦𝑗 are economic sizes of country
i and j, respectively, 𝑦𝑤 is world economic size, 𝑡𝑖𝑗 is trade cost, 𝑃𝑖 and 𝑃𝑗 are the respective
price indices, and 𝜎 is the elasticity of substitution.5,6
World economic size equals the sum of nominal incomes of all countries j, 𝑦𝑤 = ∑ 𝑦𝑗𝑗 .
Theoretically, the economic size of country i (𝑦𝑖) is equal to the gross consumption of goods
(produced in country i) by country j at a price (𝑝𝑖𝑗) that differs from j’s domestic price level by
the inclusion of a trade cost (𝑡𝑖𝑗):
𝑦𝑖 = ∑ 𝑐𝑖𝑗𝑗 𝑝𝑖𝑗. (2)
Country j’s economic size (𝑦𝑗) is calculated analogously. It is common practice in a gravity
analysis to weight the economic size using the nominal GDP of the country.
The central contribution of AvW (2003) is the concept of multilateral resistance to trade
(MRT). The outward trade resistance, 𝑃𝑖 and inward trade resistance, 𝑃𝑗 are price indices that
take into account the weighted aggregate values of observable traded costs across all possible
export partners of i and import partners of j respectively, and take the form of CES unit cost
functions:
𝑃𝑖 = (∑ 𝑃𝑗𝜎−1𝜃𝑗𝑡𝑖𝑗
1−𝜎𝑗 )
1
1−𝜎, (3)
𝑃𝑗 = (∑ 𝑃𝑖𝜎−1𝜃𝑖𝑡𝑖𝑗
1−𝜎𝑖 )
1
1−𝜎. (4)
While MRT terms are not directly observable, gravity studies provide methods to proxy them.7
5 Note that equation (1) follows AvW (2003) in assuming imports and exports have a proportional effect on bilateral
trade; however, this assumption can easily be relaxed, as we do later in our estimated equations. 6 The elasticity of substitution should be larger than one, 𝜎 >1, but exact values may change as preferences and trade
opportunities change. The debates over precise level of elasticity of substitution have been ongoing for quit long,
and it seems there is still no consensus what it should be like. For example, some papers use relatively low 𝜎; for
example Backus et al. (1994) use 1.5 and Coeurdacier et al. (2007) use 0.6-2. Other papers use relatively high 𝜎; for
example, Hummels (2001) at around 9 and Romalis (2007) chooses 11. However, since Eaton and Kortum (2002)
and AvW (2004), many trade papers tend to pick value somewhere between 5-10, although some papers have
estimated it instead. 7 AvW (2003) proposed an iterative procedure to estimate MRT terms based on non-linear least squares but because
of its complexity it was overshadowed by simpler proxies such as “remoteness” or fixed effect dummies.
13
AvW (2003) assume that trade costs, 𝑡𝑖𝑗 , are symmetric, and of “iceberg” form
(Samuelson, 1952):
𝑡𝑖𝑗 = ∑ (𝑧𝑖𝑗𝑚)𝛾𝑚
𝑚=1 , (5)
where 𝑧𝑖𝑗𝑚 is a function of bilateral trade barriers (transport cost, tariffs, quotas etc.) and the
parameter 𝛾𝑚. The geographic distance between trading countries i and j can serve as proxy of
transport cost.
3.2 The gravity decomposition
The GMT is a simple model with strong predictive power, and has been extensively used for
empirical studies since its first implementation by Tinbergen (1962). Researchers have
developed extension and decomposition techniques to allow the GMT to measure overall trade
costs (AvW, 2004; Jacks et al., 2009; Head et al., 2010) or unobservable MTRs (AvW, 2003;
Baier and Bergstrand, 2009).
We make use of a gravity consistent extension of the AvW procedure called the “tetrad”
method (see Head et al., 2010). This allows us to capture time varying bilateral effects (for
instance, caused by changes in tariffs or non-tariff measures) on trade volumes by eliminating
(by division) all importer, exporter, and global (time) effects as well as fixed bilateral effects
(such as distance or colonial ties). In addition to exporter i and importer j countries, we need to
take another two countries, one as reference exporter l and another as reference importer k. So by
taking a “tetrad” of equation (1) with ij, ik, lj, and lk sets and denoting it as ℶ, it can be
represented as
ℶ(𝑖𝑙)(𝑗𝑘) =𝑥𝑖𝑗 𝑥𝑖𝑘⁄
𝑥𝑙𝑗 𝑥𝑙𝑘⁄, (6)
which then through elimination of monadic (𝑦𝑖𝑦𝑗
𝑦𝑤(𝑃𝑖𝑃𝑗)1−𝜎) and fixed dyadic terms (𝑡�̅�𝑗) can be
reduced to “tetrad” of 𝜑s:
ℶ(𝑖𝑙)(𝑗𝑘) =𝜑𝑖𝑗 𝜑𝑖𝑘⁄
𝜑𝑙𝑗 𝜑𝑙𝑘⁄= 𝜑𝑖𝑗𝑡̃ , (7)
where 𝜑𝑖𝑗𝑡̃ = (𝑡𝑖𝑗)1−𝜎 is an overall measure of observable and unobservable trade-cost factors.
Although 𝜑𝑖𝑗𝑡̃ s contain elasticity of substitution (𝜎), no assumption about the level of elasticity
needs to be imposed which is crucially important since exogenously introduced level of elasticity
is always questionable.

14
Unlike traditional fixed effect methods, the tetrad approach allows for time-varying
changes in relative trade costs across different country pairs. For example, Head et al. (2010)
analyse the time varying effect of independence on trade between a metropolis (colonizer),
colony, and siblings (other colonies), to capture the effect of other relevant bilateral factors
(changes in RTA, GATT membership, and currency rates). Romalis (2007) used the approach to
evaluate the effect of NAFTA tariffs on trade flows among USA, Mexico, and Canada. Our
purpose is to decompose the GMT into two parts:
𝑥𝑖𝑗 = 𝐷𝑖𝑗𝑀𝑖,𝑗, (8)
where the dyad, 𝐷𝑖𝑗, stand for varying overall trade measure powered by trade elasticity, 1 − 𝜎.
The dyad represents the country-pair-specific (ij) networking or trade cost component of trade:
𝐷𝑖𝑗 = 𝜑𝑖𝑗. (9)
The monad, 𝑀𝑖,𝑗, is the combination of the country specific components for each country in the
pair ij: economic size and MRT. This is derived by eliminating 𝐷𝑖𝑗 from equation (1):
𝑀𝑖,𝑗 =𝑦𝑖𝑦𝑗
∑ 𝑦𝑗𝑗 (𝑃𝑖𝑃𝑗)1−𝜎. (10)
3.3 Data
Our bilateral trade panel contains 37 countries over the period 1995-2011.8 The selection of
countries was based on volume of trade with the CACs region. Sadly, data on 1989-1992 period
are either missing or if reported are unreliable; these problems also apply to the data for the
period till 1994 which is characterized by hyperinflation. Consequently, our study starts from
1995.
Bilateral trade flows and tariff rates for the 1995-2011 period, in 2007 US dollars were
obtained from WITS (www.wits.org). This contains both the COMTRADE and TRAINS
bilateral databases, both of which contain some of the necessary data, as COMTRADE covers
only WTO members, while TRAINS covers all the CACs, but aggregates the EU into one single
region. The other issue was that one third of all trade data for some countries was missing or
8 The 37 countries considered are Algeria, Austria, Azerbaijan, Belarus, China, Croatia, Finland, France, Georgia,
Germany, Greece, Hungary, India, Iran, Italy, Japan, Kazakhstan, Korea, Kyrgyzstan, Lithuania, Moldova,
Netherlands, Norway, Poland, Romania, Russian Federation, Saudi Arabia, Spain, Switzerland, Tajikistan, Turkey,
Turkmenistan, Ukraine, United Arab Emirates, United Kingdom, United States, and Uzbekistan.

15
unreported; consequently we had to use interpolation which allowed reduction of missing trade
data from 1/3 to 1/5.
GDP levels were obtained from the IMF International Financial Statistics database
(www.imf.org ), while geographic distances between capital cities of the countries and standard
gravity dummies for colonization, common language, and common border were obtained from
CEPII (www.cepii.fr). Additional binomial dummies for landlockedness and RTA membership
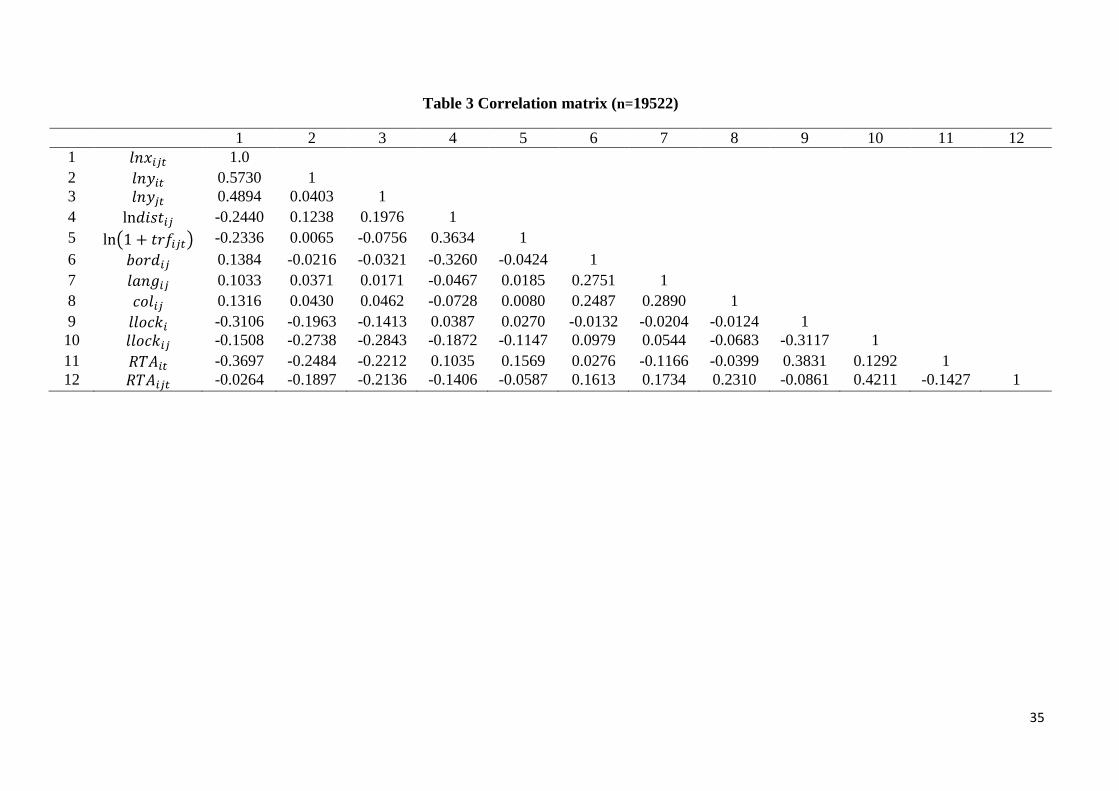
were also included. Summary statistics, description of variables and correlation matrixes are
reported in Table 2 and Table 3 respectively.
- Tables 2 and 3 here –
3.4 The estimation model
We estimate a set of log-linear models. First, we consider a standard OLS model with fixed
effect dummies:
𝑙𝑛𝑥𝑖𝑗𝑡 = 𝑎0 + 𝑎1𝑙𝑛𝑦𝑖𝑡 + 𝑎2𝑙𝑛𝑦𝑗𝑡 + 𝑎3𝑙𝑛𝑡𝑖𝑗𝑡 + 𝑎4𝐼𝑖𝑡 + 𝑎5𝐼𝑗𝑡 + 𝑎6𝐼𝑡 + 𝜀𝑖𝑗𝑡, (11)
where 𝑎0 is constant, 𝑦𝑖𝑡 and 𝑦𝑗𝑡 are proxied with nominal GDP levels of exporter 𝑖 and importer
𝑗 country respectively, 𝑎3 = 1 − 𝜎 is trade elasticity, 𝜀𝑖𝑗𝑡 is error term; 𝐼𝑖𝑡 is exporter-year, 𝐼𝑗𝑡 is
importer-year, and 𝐼𝑡 represents year binary dummies to proxy 𝑃𝑖𝑡, 𝑃𝑗𝑡, and 𝑦𝑤, respectively, for
theoretical consistency. Our trade costs take the following form:
𝑙𝑛𝑡𝑖𝑗 = 𝑏1ln𝑑𝑖𝑠𝑡𝑖𝑗 + 𝑏2 ln(1 + 𝑡𝑟𝑓𝑖𝑗𝑡) + 𝑏3𝑙𝑎𝑛𝑔𝑖𝑗 + 𝑏4𝑐𝑜𝑙𝑖𝑗 + 𝑏5𝑏𝑜𝑟𝑑𝑖𝑗 +
𝑏6𝑙𝑙𝑜𝑐𝑘𝑖 + 𝑏7𝑙𝑙𝑜𝑐𝑘𝑖𝑗 + 𝑏8𝑅𝑇𝐴𝑖𝑡 + 𝑏9𝑅𝑇𝐴𝑖𝑗𝑡 + 𝑢𝑖𝑗𝑡.
(12)
In equation (12), the geographic distance (dist) proxy for transport cost, trf 9 stands for border
cost, and further binomial dummies capture effects of historic (common language and colony),
geographic (sharing borders, one and both landlocked), and economic linkages (one and both in
RTA) effects on trade cost; u is error term. In the equation time constant variables, unlike time
variant ones, have no time subscript.
As previously mentioned, the derived values from tetrading - the dyads - stand for time-
varying bilateral factors, which can be expressed as:
𝑙𝑛𝑥𝑖𝑗𝑡 = 𝑑0 + 𝑑1𝑙𝑛𝑦𝑖𝑡 + 𝑑2𝑙𝑛𝑦𝑗𝑡 + 𝑑3𝑙𝑛𝜑𝑖𝑗𝑡̃ + 𝑑4𝐼𝑖𝑡 + 𝑑5𝐼𝑗𝑡 + 𝑑6𝐼𝑡 + 𝜖𝑖𝑗𝑡,
(13)
9 Taking log of 1+trf is necessary to account for the cases with zero tariffs in our data.
16
where
𝑙𝑛𝜑𝑖𝑗𝑡̃ = 𝑐0 + 𝑐1𝑙𝑛𝑑𝑖𝑠𝑡𝑖𝑗 + 𝑐2 ln(1 + 𝑡𝑟𝑓𝑖𝑗𝑡) + 𝑐3𝑙𝑎𝑛𝑔𝑖𝑗 + 𝑐4𝑐𝑜𝑙𝑖𝑗 + 𝑐5𝑏𝑜𝑟𝑑𝑖𝑗 +
𝑐6𝑙𝑙𝑜𝑐𝑘𝑖 + 𝑐7𝑙𝑙𝑜𝑐𝑘𝑖𝑗 + 𝑐8𝑅𝑇𝐴𝑖𝑡 + 𝑐9𝑅𝑇𝐴𝑖𝑗𝑡 + 𝑢𝑖𝑗𝑡.
(14)
Feenstra (2004) states that fixed effects models are the most reliable and simple method
to estimate gravity of trade flows. The fixed effect dummies proxy the omitted MRT terms effect.
If the interest is as in our case to estimate coefficients of time-invariant variables (such as
distance) then Dummy Variable Least Squares (DVLS) method which works the same way as
fixed effects model is appropriate to use.10
Potentially, DVLS estimates could suffer from serial correlation, non-stationarity and
endogeneity. Moreover, DVLS does not take into account zero trade values where it is unknown
whether these are true zeroes or unreported values. In any case zero trade values should not be
neglected, especially when 1/5 of our observations are zeroes. Experts suggest re-estimating the
GMT using other estimators that handle these issues such as TSLS (Two Stage Least Squares) to
control for endogeneity bias (Egger et al., 2011), DVLS (with AR option) - for autocorrelation
issue (Martin and Pham, 2009), PPML (Poisson Pseudo Maximum Likelihood) estimator - for
inclusion of zero trade values, and FDE (First Differencing) estimator - for stationarity of
variables as discussed by Zwinkels and Beugelsdijk (2010). Following the relevant literature we
run tests for non-stationarity and co-integration and report the results in Table 4 which shows
that some variables (GDPs and RTAs) are non-stationary in levels but stationary in first
differences. Furthermore, there seems to be no issues with cointegration of variables.
- Table 4 here -
4 Estimation results
4.1 Gravity model results
Results are presented in Table 5, where control variables are categorized into country-specific
factors (importer and exporter GDP), time-invariant bilateral (networking) factors (distance,
landlockedness, shared common borders, common language, and common historical colonizer),
and time-variant bilateral factors (tariff rates, participation in RTA). The estimates in columns 1
to 5 are obtained using (1) Dummy Variable Least Squares (DVLS) with the STATA’s robust
10
The fixed effect estimator drops all the variables that are constant over time like distances, therefore, including
fixed effect dummies produces the same results as the fixed effect estimator but also estimates coefficients for
constant variables.
17
and cluster option, (2) DVLS with AR option, (3) Two Stage Least Squares (TSLS), (4) Poisson
Pseudo Maximum Likelihood (PPML) estimator, and (5) First Differencing (FDE) estimator
respectively.
- Table 5 here -
Regarding signs, estimated coefficients across different estimators show a logical
relationship between the explained variable and explanatory variables and agree with correlation
matrix results (Table 3); trade is positively associated with both exporter and importer GDPs as
well as with the dummies for a common language, and with the countries being members of the
same RTA, while in contrast, distance, landlockedness, and tariff rates are negatively correlated
with trade. However, we observe some sign disagreements of coefficients (depending on
estimator in use) such as unexpected signs of tariff and colony variables in PPML column.
Common border is found in many gravity papers to have positive correlation to trade, but only
TSLS column confirms it in the CACs case.
Regarding magnitudes, estimated coefficients across all estimators are similar which
enables us to confirm a range of predictions. DVLS and DVLS (AR) coefficients are more
similar compared to TSLS or PPML ones, indicating that serial correlation is not a severe issue
(as expected for short time-series panel). Controlling for endogeneity changes some coefficients
slightly (GDPs, distance, and border), but inclusion of zero trade values produces even more
change in coefficients for most variables. This is notable from the number of observations in the
DVLS and TSLS cases (19,522) and in the PPML case (23,273). Inclusion of more observations
indeed gives more precise estimates, and in fact we observe quite a significant change in
coefficient values. Despite the improvements in estimates due to inclusion of zero trades it is
hard to rely on PPML as its goodness of fit is only 59% and lower than the other estimators’ fit
of 81-82%. FDE compared with DVLS provides coefficients almost twice smaller – a regularity,
which has been pointed out in Zwinkels and Beugelsdijk (2010).
Based on equations (13)-(14) gravity variables are re-estimated and reported in Table 6.
Comparing the country specific coefficients in Table 6 (part a) and Table 5 confirm that importer
GDP is more important than the exporter’s, however, DVLS (AR) provides more similar values
that are in line with GDP coefficients presented in Table 5. In Table 6 (part b) dependent variable
is a product of a tetrad which is regressed over gravity trade cost variables. Coefficient signs and
magnitudes are quite similar to ones in Table 5 while coefficients for some variables such as

18
landlockedness are significant and quite high, at least for estimates from DVLS, DVLS (AR) and
PPML, while TSLS values fall well in line with gravity estimates. Estimated coefficients by both
the gravity and tetrad models can be grouped into two categories according to their economic
and statistical significance.
- Table 6 here -
Variables which are both statistically and economically significant: tariffs, distance and
landlockedness
A 10% increase in distance leads to a 16-22% decrease in trade. Similar results are obtained by
Suvankulov and Guc (2012). Usually gravity studies estimate distance coefficient equal to one
but the geographic distance is indeed important factor when we talk about CACs trade. The huge
distance of CACs from the major trade centres creates a big obstacle for their goods to be
competitive in world markets. The effect is exacerbated further by the fact that CACs are
landlocked having no direct access to sea corridors. A 13-35% or 10-51% trade drops when one
(exporter or importer) or both traders are landlocked respectively. Except for the PPML results in
Table 5, we find that tariffs are statistically and economically significant as an increase in tariff
rate by 1% causes about 1.9-3.8% reduction in trade.
Variables which are only statistically (but not economically) significant: RTA membership,
GDP levels and common border
To reduce trading costs CACs join RTAs which is beneficial only to those who are in the same
RTA. A pair of countries joining a RTA leads to 5-16% trade increase, while if only one country
is a RTA member trade drops by 0.6-17%. A 10% increase of exporter’s GDP increase trade by
0.6-4.8%, while 10% importer’s GDP increase leads to 3.9-7.8% increase in trade meaning that
importer’s GDP is twice as important in the case of CACs. This finding makes sense when we
consider the fact that overland transportation costs in trade with CACs are very high and these
are passed to importers (AvW, 2004). In contrast to other gravity studies, a common border
negatively affects trade - trade drops by 0.3-1%. This might be explained by the fact that we
considering trade of landlocked countries which have to pay extra costs associated with crossing
territories of neighbouring (landlocked) countries in order to export or import goods.
4.2 Gravity decomposition results
19
There are 185 (5 CACs by 37 partners) country pair trade relations decomposed into monadic
(country-specific) and dyadic (networking) components. By plotting these over the period 1995-
2011, we can observe changes in the trade flows and bilateral relations over time. For simplicity
trade and dyads obtained only by DVLS estimator and using France and Germany as reference
importer and export respectively are reported. We find that in 17 years of independence each
CAC improved its trade with all countries in the pool (37 countries including intra-trade) and
country-specific and networking factors increased their influence. The changes vary from
country pair to country pair though, but it is still feasible to categorize results into two groups as
follows.
Monadic-driven bilateral trade
In this group of country pairs, a gap appears between trade flow and bilateral trade component
(dyad) which becomes wider over time. This happens because the slope of growing trade flows is
greater than that of the dyadic component. 136 country-pair relationships (or about 75% of all
bilateral trade) fall into this category. The example of country-pair trade dominated by monadic
factors is shown in Figure 2 (plot 1).
- Figure 2 here -
Dyadic-driven bilateral trade
In this group of country pairs trade is increasing at the same rate as dyadic costs do while
monadic component is constant over time. 49 (or about 25%) country-pair relationships fall into
this category. The example of dyadic driven country-pair trade is shown in Figure 2 (plot 2).
The aggregate dyadic and monadic component shares in bilateral trade of each CAC are
reported in Table 7 and show remarkable heterogeneity in trade behaviour. Detailed information
on all 185 country pairs is reported in Mazhikeyev et al. (2014). Comparing our estimates of
dyads (networking effects) with results from the alternative method offered in Novy (2013),
which assumes trade elasticity equal to 8, produced similar dynamic changes in dyads and
overall trade costs over time. This similarity confirms that tetrading can be successfully
employed for decomposition analysis in the case of CACs.
- Table 7 here -
5 Discussion and conclusions

20
Our study confirms the four hypotheses set out in section 2. First of all, while all CACs have
experienced growing trade since the end of the 1998 Russian crisis, this does not mean that the
countries are homogeneous. In fact, while they share aspects of culture, history and
landlockedness, the CACs show considerable variety in initial conditions (size, population,
resource base, specialisation). Moreover, in terms of transitional reforms, there is a considerable
divergence between Kazakhstan and Kyrgyzstan, in the reformist camp, and the other CACs.
Reform in terms of trade tends to be strongly correlated with other transitional reforms such as
privatisation and enterprise restructuring linking at theoretical level to the liability of localness
concept that we tried to utilise in explaining the micro (firm) level drives of trade performance.
Secondly, we note that trade has grown considerably in all countries, reflecting the rise in
Russian and regional incomes (following stabilisation and oil/gas price recovery). Oil and gas
exporters have particularly benefited. However, the evidence is that the more isolationist states
have simply relied on these, possibly fortuitous factors to boost their trade, whereas the more
reform-minded states have achieved considerable trade growth through reducing trade costs.
Hence, the growth and fluctuations in trade of the “more isolationist” economies Turkmenistan,
Tajikistan and Uzbekistan are driven by changes over time in monadic variables (primarily GDP)
while trade partnerships of “more open” economies Kazakhstan and Kyrgyzstan are driven
roughly equally by dyadic variables (changes in trade costs) as well as monadic variables.
We re-emphasise that our findings summarised above are subject to some data limitations
and caveats associated with the estimation methods used. Next we discuss implications of our
results for business strategy and government policy.
Globalization vs. regionalization
In the era of globalization, countries build more trade connections that raise income and welfare.
However, there are also some negative implications: not just in terms of trade diversion where
integration is regional, but also in terms of vulnerability to shocks. For example, during the 1998
Russian crisis The Euromoney Risk Ranking for Russia went up from 78 (in December 1997) to
129 (in September 1998). Observing this situation, Fitch IBCA lowered Russian International
Credit Rating from B+ to CCC-. As a result, Russian interest rates increased from 3% to 6%.
This had a strong impact upon the CACs, both through monadic effects (GDP in a major export
market reduced), and through trade costs (since access to finance is important for trade).
Kazakhstan, with a common border with Russia, was more exposed than Tajikistan and
21
Kyrgyzstan, and was hit by the crisis harder (Westin, 1999), although even the isolationist CACs
were dependent on Russia as the primary export market for their gas, as dictated by pipeline
routes. Financial shortages reduced CACs-Russia trade in both directions by 40%. Furthermore,
the debt-to-GDP ratio, in early 1999, rose more sharply for small open CACs, Kyrgyzstan (54%)
and Tajikistan (90%), and less for large and more diversified Kazakhstan (17%) while for
isolationist Turkmenistan (1.7%) and Uzbekistan (- 4.4%) the effect was negligible (Pastor and
Damjanovic, 2001).
In support of Hypothesis 4 the current fall in the global price of oil, and the effects of
Western sanctions on Russia will have heterogeneous effects on these countries. Paradoxically,
the countries which have reformed trade more, Kazakhstan and Kyrgyzstan, are more tied in the
short-medium term to fluctuations in the Russian economy, and their currencies are already
showing evidence of spillover of the current Russian crisis.
Transport links and RTAs
The CACs’ location in the heart of Eurasia is strategically important but imposes a disadvantage
in trade. Overland transport costs of goods average $1380/1000km, almost 10 times higher than
by sea ($190/1000km) raising trade costs by 60% as found by Limao and Venables (2001).
According to the Vinokurov (2009) CACs main trade flows go in three main directions: (i) to
Russia and Europe via the Trans-Asian-Railway (Tashkent/Bishkek – Dushanbe – Almaty -
Moscow/Kiev) or TRACECA (Bishkek – Tashkent – Almaty – Aktau – Baku – Batumi); (ii) to
Iran, Turkey, and Saudi Arabia via the Central-Railway (Almaty/Bishkek – Tashkent –
Ashkhabat – Turkmenbashi – Tehran – Istanbul); (iii) to China and Asian-Pacific Region via the
East-Trans-Asian-Railway (Tashkent - Bishkek/Dushanbe – Dostyk – Lianyungang). Leamer
and Levinsohn (1994) rightly assert that “distance matters and it matters a lot”; since 90% of
CACs trade is by rail the assertion is particularly relevant for the CACs case.
Raballand (2003) found that the trade of landlocked Former Soviet Union countries fell
by 80% compared to coastal ones during 1995-1999. Landlocked CACs had to negotiate with
bordering coastal states, as well as other landlocked states controlling routes (Grigoriou, 2007).
For example, Uzbekistan is virtually surrounded by other landlocked countries. Trade barriers
imposed by (coastal) Russia to landlocked CACs were very high (Djarkov and Freud, 2002).
Even though Uzbekistan, Kyrgyzstan and Tajikistan share a border with coastal China, trade is
impeded by the Himalaya-Tibet massif, and the only convenient geographic corridor to China is

22
the Djunghar Gate of Kazakhstan. Note that the infrastructure and rail roads to China were built
during the Soviet era mostly with strategic considerations (Grigoriou, 2007), and partly reflect
poor Soviet-Chinese relations since the late 1950s. Furthermore, Pittman (2013) finds that
reforms to the monopolistic freight railways in the Former Soviet Union have slowed to a halt
over time, and that even the more reform-minded countries (the Baltics, Russia and Kazakhstan)
have not followed the path of Western railway modernisation.
While our study finds RTA membership to be only weakly economically significant,
RTAs potentially allow CACs to lessen transport and transit costs as well as to improve regional
transport infrastructure and create transport corridors. However, the complexity of regional trade
partnerships often creates additional obstacles. Moreover, most of the regional RTAs have had
relatively little practical importance (Acharya et al., 2011). The major exception is the Eurasian
Custom Union (EACU) which unifies the external tariffs of Kazakhstan, Russia and Belarus.
Magilevskii (2012) demonstrates the EACU effect by pointing out that the trade turnover
between Kazakhstan and Russia increased by 28% between 2010-11, while for the same period
growth rate of trade between the Customs Union of Belarus, Kazakhstan and the Russian
Federation and the other CACs is 19%. Kyrgyzstan is likely to join the EACU next year and
Tajikistan is currently negotiating its membership. However, Kassenova (2012) reports that
despite the EACU formation, Kazakhstan still faces high Russian NTBs. Furthermore, there are
serious questions outstanding, especially for those CACs reluctant to reform, like Turkmenistan
and Uzbekistan, who are not showing any sign of interest in the EACU.
Other important factors of trade
Other factors of importance are the conditions of access and use of CACs’ transport
infrastructure (Grigoriou, 2007), CACs access to sea ports (Kulipanova, 2012), transit systems in
the region (Raballand, 2003). Trade barriers, indeed, are reaching beyond the transport and
border costs, and as mentioned in AvW (2004) also include policy costs (tariff and non-tariff like
quotas), cost of information and currency exchange, finance, distribution costs and trade costs
associated with unobservable barriers linked to cultural and historic ties. Indeed, trade costs as
estimated in our gravity formulation will include any costs of business regulation and corruption.
Evans (1999) suggest that political systems, differences in education, production, market and
industrial structure should be considered as primary factors of trade. Dow and Karunaratna (2006)
examine 37 different studies to identify main ‘psychic’ distance factors. They find that culture,

23
language, education level, religion, time zone, industrial development, and political systems are
most common factors used in trade studies. Of these factors, the latter two are likely to be most
relevant for the CACs. Inherited from Soviet days the main industries and infrastructure in CACs
are quite outdated, but the energy rich CACs (Kazakhstan, Uzbekistan and Turkmenistan) using
oil and gas revenues have been able to modernize their industries, while Tajikistan and
Kyrgyzstan developed their agrarian sectors. Regarding the political system, the IMF (2012)
finds that relatively liberal (more accurately less authoritarian) political systems (like in
Kyrgyzstan, compared to Turkmenistan and Uzbekistan) are linked to less restrictive trade
regimes.
To conclude: we find a relationship between being an open/isolationist country and having
dyadic/monadic driven trade with other countries. Open CACs’ (Kazakhstan and Kyrgyzstan)
trade performance is mostly explained by time varying bilateral factors while the trade
performance of isolationist CACs (Tajikistan, Turkmenistan and Uzbekistan) is affected mostly
by country-specific properties. The IB literature on liability of localness versus foreignness has
particular relevance to CACs, because of their past Soviet ties. Under the Soviet system, trade
and other economic reforms which would place local enterprises at a liability, were avoided. The
price was greatly reduced incentive to innovate or to develop products saleable on world markets.
Our hypotheses and gravity evidence show that those CACs which are now reforming are
achieving an increasing ability to export to markets more widely than simply the former Soviet
countries, even though Russia remains the primary trade partner in many cases. A possible
implication is that, at least in industries where Russian businesses themselves have reformed, the
process of integration into an Eurasian bloc may not necessarily be damaging to export
performance with the rest of the world. However, some countries may fear loss of sovereignty
(Dragneva and Wolczuk, 2013) or look for alternative alliances to the East or the South. Clearly,
the ongoing CACs integration processes and their international business implications present an
interesting case for future research.

24
References
Acharya, R., Crawford, J., Maliszewska, M., & Renard, C. (2011). Landscape, Preferential Trade
Agreement Policies for Development, In J. P. Chauffour, & J.C. Maur (Eds.),
Preferential Trade Agreement Policies for Development (pp. 37-69). Washington D.C.:
The World Bank.
Anderson, J.E., & Van Wincoop, E. (2003). Gravity with Gravitas: A Solution to the Border
Puzzle. American Economic Review, 69(1), 106-116.
Anderson, J.E., & Van Wincoop, E. (2004). Trade Costs. Journal of Economic Literature, 42(3),
691-751.
Auty, R. (2001). Reforming Resource-Abundant Transition Economies: Kazakhstan and
Uzbekistan. In R. Auty (Ed.), Resource Abundance and Economic Development (pp. 260-
276), Oxford: Oxford University Press.
Backus, D., Kehoe, P., & Kydland, F. (1994). Dynamics of the Trade Balance and the Terms of
Trade: The J-Curve?. The American Economic Review, 84(1), 84-103.
Bagwell, K., & Staiger, R. W. (2012). Profit Shifting And Trade Agreements In Imperfectly
Competitive Markets. International Economic Review, 53(4), 1067-1104.
Baier, S., & Bergstrand, J. (2009). Bonus Vetus OLS: A Simple Method for Approximating
International Trade Cost Effects using the Gravity Equation. Journal of International
Economics, 77(1), 77-85.
Barlow, D., & Radulescu, R. (2005). The sequencing of reform in transition economies. Journal
of Comparative Economics, 33(4), 835-850.
Bergstrand, J. (1989). The Generalized Gravity Equation, Monopolistic Competition and the
Factor-Proportions Theory in International Trade. The Review of Economics and
Statistics, 71(1), 143-53.
Bevan, A., Estrin, S., & Meyer, K. (2004). Foreign investment location and institutional
development in transition economies. International Business Review, 13, 43-64.
Buck, T., Filatotchev, I., Demina, N., & Wright, M. (2000). Exporting Activity in Transitional
Economies: an Enterprise-Level Study. Journal of Development Studies, 37(2), 44-66.
Burghart, D., & Sabonis-Helf, T. (2004). In the tracks of Tamerlane: Central Asia’s path to the
21st century. (1
st ed.). Washington D.C.: CreateSpace Independent Publishing Platform,
(Chapter 18).
25
Chaney, T. (2008). Distorted gravity: The intensive and extensive margins of international trade.
American Economic Review, 98(4), 1707-1721.
Grigoriou, C. (2007). Landlockedness, infrastructure and trade: new estimates for Central Asian
countries. Policy Research Working Paper Series No. 4335, Washington D.C.: The World
Bank.
Coeurdacier, N., Kolmann, R., & Martin, P. (2007). International Portfolios with Supply,
Demand and Redistributive Shocks. National Bureau of Economic Research Working
Paper 13424.
Davis, J. H., Patterson, J. D., & Grazin, I. (1996). The Collapse and Reemergence of Networks
within and between Republics of the Former Soviet Union. International Business
Review, 5(1), 1-21.
D'Aveni, R. A., & Macmillan, I. C. (1990). Crisis and the content of managerial communications:
a study of the focus of attention of top managers in surviving and failing firms.
Administrative Science Quarterly, 35 (4), 634–657.
Deardorff, A. (1998). Determinants of Bilateral Trade: Does Gravity Work in a Neoclassical
World?’. In A. Frankel (ed.), The Regionalization of the World Economy (pp. 7-32).
Chicago: University of Chicago Press.
Djankov, S., & Freud, C. (2002). Trade Flows in the Former Soviet Union, 1987 to 1996.
Journal of Comparative Economics, 30(1), 76-90.
Dow, D., & Karunaratna, A. (2006). Developing a multidimensional instrument to measure
psychic distance stimuli. Journal of International Business Studies, 37, 578-602.
Dowling, M., & Wignaraja, G. (2005). Central Asia: Mapping Future Prospects. Working Papers
05-2006. Singapore Management University.
Dowling, M., & Wignaraja, G. (2006). Central Asia after Fifteen Years of Transition: Growth,
Regional Coorepation, and Policy Choices. Working Papers on Regional Economic
Integration. Asian Development Bank.
Dragneva, R., & Wolczuk, K. (2013). Commitment, asymmetry and flexibility: making sense of
Eurasian economic integration. In R. Dragneva & K. Wolczuk (eds.), Eurasian Economic
Integration: Law, Policy and Politics (pp. 204-222). Padstow: T.J. International Ltd.
Dunning, J.H. (2003). Making Globalisation Good: The Moral Challenges of Global Capitalism
(1st ed.). Oxford: Oxford University Press, (Part III).

26
Eaton, J., & Kortum, S. (2002). Technology, Geography and Trade. Econometrica, 70(5), 1741-
1779.
Eden, L., & Miller, S.R., (2004). Distance matters: liability of foreignness, institutional distance
and ownership strategy. In M. A. Hitt, & J. L. Cheng (Eds.), Advances in International
Management, Theories of Multinational Enterprise: Diversity, Complexity and Relevance
(pp. 182–222). Boston: Elsevier.
Edwards, T. H. (2010). Globalisation as a 'good times' phenomenon: A search-based explanation.
Economics - The Open-Access, Open-Assessment E-Journal, Kiel Institute for the World
Economy, 4(24), 1-48.
Egger, P., Larch, M., Staub, K. & Winkelmann, R. (2011). The Trade Effects of Endogenous
Preferential Trade Agreements. American Economic Journal, 3(3), 113-143.
Elbourgh-Woytek, K. (2003). Openness and Distance: Trade Developments in the
Commonwealth of Independent States, 1993-2002. IMF Working Paper WP/03/207.
Evans, P. (1999). Uzbekistan. Human Rights Watch World Report. Human Rights Development.
Falcetti, E., Lysenko, T., and Sanfey, P. (2005). Reforms and growth in transition: re-examining
the evidence. Working Paper No 90. European Bank for Reconstruction and
Development.
Feenstra, R. (2004). Many Goods and Factors. In Advanced International Trade: Theory and
Evidence (1st ed.), UK: Princeton University Press (pp. 64-99).
Felipe, J., Kumar, U., Abdon, A., and Bacate, M. (2012). Product complexity and economic
development. Structural Change and Economic Dynamics, 23(1), 36-68.
Filatochev, I., M.Wright, K., Uhlenbruck, L.T., and Hoskisson, R.E. (2003). Governance,
organizational capabilities, and restructuring in transition economies. Journal of World
Business, 38, 331-347.
Hausmann, R., Hwang, J. and Rodrik, D. (2005). What You Export Matters. NBER Working
Papers 11905, National Bureau of Economic Research.
Haveman, H. A., Russo, M. V., & Meyer, A. D. (2001). Organizational environments in flux: the
impact of regulatory punctuations on organizational domains, CEO succession, and
performance. Organization Science, 12 (3), 253–273.
Head, K., Mayer, T., and Ries, J. (2010). The Erosion of Colonial Trade Linkages After
Independence. Journal of International Economics, 81(1), 1-14.
27
Helpman, E., Melitz, M. and Rubinstrein, Y. (2008). Estimating trade flow: Trading partners and
trading volumes. Quarterly Journal of Economics, 123(2), 441-487.
Hoskisson, R.E., Eden, L., Lau, C.M., & Wright, M. (2000). Strategy in emerging economies.
Academy of Management Journal, 43(3), 249–267.
Hummels, D. (2001). Toward a Geography of Trade Costs. GTAP Working Papers 1162, Purdue
University.
International Monetary Fund (IMF). (2012). Regional Economic Outlook: Middle East and
Central Asia. World Economic and Financial Surveys. International Monetary Fund.
Jacks, D., Meissner, C., & Novy, D. (2009). The role of trade costs in the great trade collapse. In
R. Baldwin (ed.), The Great Trade Collapse: Causes, Consequences and Prospects,
London: Centre for Economic Policy Research (pp. 159-167).
Kaser, M. (1998). Stabilization and Reform: The experiences of five Central Asian States.
Available on https://www.imf.org/external/np/eu2/kyrgyz/pdf/kaser.pdf (accessed 18
May 2013).
Kassenova, N. (2012). Kazakhstan and Eurasian Economic Integration: Quick Start, Mixed
Results and Uncertain Future. Paris: Centre Russie/NEI.
Kaminski, B., Wang, Z.K. & Winters, A. (1996). Foreign Trade in the Transition: The
International Environment and Domestic Policy. Series on Economies in Transition.
Washington D.C.: UNDP and World Bank.
Kulipanova, E. (2012). International Transport in Central Asia: Understanding the Patterns of
(Non-) Cooperation. Working Papers No. 2, University of Central Asia.
Leamer, E., & Levinsohn, J. (1994). International Trade Theory: The Evidence. NBER Working
Papers No. 4940, The National Bureau of Economic Research.
Levy, B. (2007). The interface between globalization, trade and development: Theoretical issues
for international business studies. International Business Review, 16(5), 594-612.
Limao, N., & Venables, J. (2001). Infrastructure, Geographical Disadvantage and Transport
Costs. World Bank Economic Review, 15, 451-479.
Luong, P.J., & Weinthal, E. (2002). New Friends, new Fears in Central Asia. Foreign Affairs,
81(2), 61-70.
Magilevskii, R. (2012). Trends and Patterns in Foreign Trade of Central Asian Countries.
Working Papers No. 1, University of Central Asia.
28
March, J. G. (1988). Variable Risk Preferences and Adaptive Aspirations. Journal of Economic
Behavior and Organization, 9, 5-24.
Martin, W., Anderson, K. & Pham, S. (2009). Effects of GATT/WTO on Asia's Trade
Performance. School of Economics Working Papers 2009-11, University of Adelaide.
Mazhikeyev, A., Edwards, T.H., & Rizov, M. (2014). Openness and Isolation: the comparative
trade performance of the Former Soviet Central Asian countries, Discussion Paper Series
2014_02, Department of Economics, Loughborough University.
Miller, V.V., & Pisani, M.J. (2007). Economic development, global business strategy, and
institutional legitimacy: the MNC as an institutionalized form of neo-dependency.
Strategic Management Review, 1 (1), 1–28.
Novy, D. (2013). Gravity Redux: Measuring International Trade Costs with Panel Data.
Economic Inquiry, 51(1), 101-121.
Pastor, G.. & Damjanovic, T. (2001). The Russian Financial Crisis and its Consequences for
Central Asia. Working Paper WP/01/169, International Monetary Fund.
Perez-Batres, L., & Eden, L. (2008). Is there liability of localness? How emerging market firms
respond to regulatory punctuations. Journal of International Management, 14, 232-252.
Peyrouse, S. (2008). The Russian Minority in Central Asia: Migration, Politics, and Language.
Occasional Paper #297, Woodrow Wilson International Center for Scholars, Kennan
Institute, Washington, D.C.
Pittman, R. (2013). The freight railways of the former Soviet Union, twenty years on: Reforms
lose steam. Research in Transportation Business and Management, 6, 99-115.
Pomfret, R. (2000). The Uzbek Model of Economic Development, 1991-99. Economics of
Transition, 8(3), 733-748.
Pomfret, R. (2003). Trade and Exchange Rate Policies in Formerly Centrally Planned Economies.
The World Economy, 26(4), 585-612.
Pomfret, R. (2004). Sequencing Trade and Monetary Integration: Issues and Applications to Asia.
School of Economics Working Paper 2004-14, University of Adelaide.
Pomfret, R. (2005). Trade policies in Central Asia after EU enlargement and before Russian
WTO accession: Regionalism and integration into the world economy. Economic Systems,
29(1), 32-58.

29
Pomfret, R. (2010). Central Asia after Two Decades of Independence. Working Paper No.
2010/553, United Nations University, UNU-WIDER.
Pomfret, R. (2011). Exploiting Energy and mineral resources in Central Asia, Azerbaijan and
Mongolia. Comparative Economic Studies, 53(1), 5-33.
Raballand, G. (2003). Determinants of the negative impact of being landlocked on trade: an
empirical investigation through the Central Asian case. Comparative Economic Studies,
45, 520-536.
Rauch, J. E., & Trindade, V. (2002). Ethnic Chinese Networks In International Trade. The
Review of Economics and Statistics, 84(1), 116-130.
Romalis, J. (2007). NAFTA's and CUSFTA's impact on international trade. Review of Economics
and Statistics, 89(3), 416‐435.
Rumer, B. (1995). Disintegration and Reintegration in Central Asia. In B. Rumer (ed.) Central
Asia in transition: dilemmas of political and economic development (pp. 5-23). New
York: M. E. Sharpe.
Rumer, B. (2000a). Economic Crisis and Growing Intraregional Tensions. In B. Rumer (ed.),
Central Asia and the new global economy (pp. 3-9), New York: M. E. Sharpe.
Rumer, B. (2000b). The Search for Stability in Central Asia. In B. Rumer (ed.), Central Asia: A
Gathering Storm? (pp. 3-16). New York: M. E. Sharpe.
Scott, W. R. (1997). Institutions and Organizations. Administrative Science Quarterly, 42 (4),
821-824.
Sinitsina, I. (2012). Economic Cooperation between Russia and Central Asian Countries: Trends
and Outlook. Working Paper No. 5, University of Central Asia.
Stark, M., & Ahrens, J. (2012). Economic Reform and Institutional Change in Central Asia:
towards a new model of the developmental state. Forschungspapier 2012/05, Private
Hochschule, Goettingen.
Starr, F. (2004). Xinjiang: China’s Muslim Borderland (Studies of Central Asia and the
Caucasus), New York: M. E. Sharpe.
Suvankulov, F., & Guc, Y. (2012). Who is Trading Well in Central Asia? A Gravity Analysis of
Exports from the Regional Powers to the Region. Eurasian Journal of Business and
Economics, 5(9), 21-43.

30
Tinbergen, J. (1962). An Analysis of World Trade Flows. In Tinbergen (ed.), Shaping the World
Economy, New York: Twentieth Century Fund.
United Nations Development Programme (UNDP). (2005). Human Development Report in
Central Asia. Human Development Report Office, UN.
Vinokurov, E., Dzhadraliyev, M., & Shcherbanin, Y. (2009). The EurAsEC Transport Corridors.
Eurasian Development Bank.
Westin, P. (1999). The Domino Effect of the Russian Crisis. Russian Economic Trends, 8(4), 46-
54.
World Bank (2002). Transition: The First Ten Years. Washington D. C.: The World Bank.
Wu, J., Li, S., & Samsell, D. (2012). Why some countries trade more, some trade less, some
trade almost nothing: The effect of the governance environment in trade flows.
International Business Review, 21, 225-238.
Yildiz, H.E., and Fey, C.F. (2012). The liability of foreignness reconsidered: New insights from
the alternative research context of transforming economies. International Business
Review, 21(2), 269-280.
Zaheer, S. (1995). Overcoming the Liability of Foreignness. The Academy of Management
Journal, 38, 341-363.
Zaheer, S., & Mosakowski, E. (1997). The dynamics of the liability of foreignness: a global
study of survival in financial services. Strategic Management Journal, 18 (6), 439–463.
Zaheer, S. (2002). The liability of foreignness, redux: a commentary, Special Issue on “The
Liability of Foreignness”, Journal of International Management, 8(3), 351-358.
Zwinkels, R., and Beugelsdijk, S. (2010). Gravity equations: Workhorse or Trojan horse in
explaining trade and FDI patterns across time and space? International Business Review,
19, 102-115.

31
Figure 1 A game tree of openness and trade: actors and interactions

32
Figure 2 Illustrative examples of Monadic-driven and Dyadic-driven trade
-15
-14
-13
-12
-11
-10
0
1
2
3
1995 1998 2001 2004 2007 2010
Uzbekistan-Kazakhstan pair
-16
-15
-14
-13
-12
-2
-1
0
1
2
1995 1998 2001 2004 2007 2010
Kyrgyzstan-US pair
Monadic
driven
trade
Dyadic driven trade

33
Table 1 CACs exports, imports and internal trade
1995-99 2000-03 2004-07 2008-11
Total Exports (in bln U.S. dollars) Kazakhstan 21.9 29.0 64.0 103.4
Kyrgyzstan 1.3 1.5 2.2 2.6
Tajikistan 0.9 0.8 1.7 2.2
Turkmenistan 4.5 5.9 14.1 18.9
Uzbekistan 5.7 4.9 11.9 19.8
Total Imports (in bln U.S. dollars)
Kazakhstan 22.3 28.4 66.6 93.4
Kyrgyzstan 1.3 1.4 2.5 2.6
Tajikistan 0.9 0.8 1.9 2.4
Turkmenistan 4.5 5.6 14.4 28.1
Uzbekistan 5.7 4.7 13.7 22.0
Total Internal trade (in bln U.S. dollars)
Kazakhstan 20.2 23.4 73.7 135.5
Kyrgyzstan 1.6 1.5 3.1 5.1
Tajikistan 1.0 1.2 3.0 5.8
Turkmenistan 3.6 7.7 20.0 32.2
Uzbekistan 14.2 11.1 18.3 38.8
Source: IMF World Economic Outlook Database (2013)

34
Table 2 Descriptive statistics for the variables (n=23274)
Variable Description Min Max Mean s.d.
𝑦𝑟 Year 1995 2011 2003 4.899
𝑥𝑖𝑗𝑡 Exports, in billions of US dollars 0 1038090 971.21 14862.54
𝑦𝑖𝑡 GDP of exporter, in billions of US
dollars
0.569 28062 972.01 2345.5
𝑦𝑗𝑡 GDP of importer, in billions of US
dollars
0.569 28062 972.01 2345.5
𝑑𝑖𝑠𝑡𝑖𝑗 Geographic distance, in km 69.04 11763.9 3512.8 2578.6
𝑡𝑟𝑓𝑖𝑗𝑡 Effectively applied tariffs, in
percentages
0 121.04 3.4594 5.6896
𝑏𝑜𝑟𝑑𝑖𝑗 Dummy for common border
between I and j is 1, otherwise 0
0 1 0.078 0.2695
𝑙𝑎𝑛𝑔𝑖𝑗 Dummy for common language
between I and j is 1, otherwise 0
0 1 0.0394 0.1946
𝑐𝑜𝑙𝑖𝑗 Dummy for common colonial
history between I and j is 1,
otherwise 0
0 1 0.0321 0.1763
𝑙𝑙𝑜𝑐𝑘𝑖 Dummy for landlocked I is 1,
otherwise 0
0 1 0.4558 0.4980
𝑙𝑙𝑜𝑐𝑘𝑖𝑗 Dummy for both landlocked I and j
is 1, otherwise 0
0 1 0.1234 0.3289
𝑅𝑇𝐴𝑖𝑡 Dummy for RTA membership of I
only is 1, otherwise 0
0 1 0.3389 0.4733
𝑅𝑇𝐴𝑖𝑗𝑡 Dummy for both, I and j, are
members of the same RTA is 1,
otherwise 0
0 1 0.0467 0.2111
𝑅𝑎𝑑𝑖 Radius of I from (0,0) geographic
coordinate
3.6427 17.33361 10.268 3.8370
𝑅𝑎𝑑𝑗 Radius of j from (0,0) geographic
coordinate
3.6427 17.33361 10.268 3.8370
35
Table 3 Correlation matrix (n=19522)
1 2 3 4 5 6 7 8 9 10 11 12
1 𝑙𝑛𝑥𝑖𝑗𝑡 1.0
2 𝑙𝑛𝑦𝑖𝑡 0.5730 1
3 𝑙𝑛𝑦𝑗𝑡 0.4894 0.0403 1
4 ln𝑑𝑖𝑠𝑡𝑖𝑗 -0.2440 0.1238 0.1976 1
5 ln(1 + 𝑡𝑟𝑓𝑖𝑗𝑡) -0.2336 0.0065 -0.0756 0.3634 1
6 𝑏𝑜𝑟𝑑𝑖𝑗 0.1384 -0.0216 -0.0321 -0.3260 -0.0424 1
7 𝑙𝑎𝑛𝑔𝑖𝑗 0.1033 0.0371 0.0171 -0.0467 0.0185 0.2751 1
8 𝑐𝑜𝑙𝑖𝑗 0.1316 0.0430 0.0462 -0.0728 0.0080 0.2487 0.2890 1
9 𝑙𝑙𝑜𝑐𝑘𝑖 -0.3106 -0.1963 -0.1413 0.0387 0.0270 -0.0132 -0.0204 -0.0124 1
10 𝑙𝑙𝑜𝑐𝑘𝑖𝑗 -0.1508 -0.2738 -0.2843 -0.1872 -0.1147 0.0979 0.0544 -0.0683 -0.3117 1
11 𝑅𝑇𝐴𝑖𝑡 -0.3697 -0.2484 -0.2212 0.1035 0.1569 0.0276 -0.1166 -0.0399 0.3831 0.1292 1
12 𝑅𝑇𝐴𝑖𝑗𝑡 -0.0264 -0.1897 -0.2136 -0.1406 -0.0587 0.1613 0.1734 0.2310 -0.0861 0.4211 -0.1427 1

36
Table 4 Non-stationarity and cointegration test results
(a) Phillips-Perron non-stationarity test
Statistic p-value Statistic p-value
𝑙𝑛𝑥𝑖𝑗𝑡 Level Difference
P Inverse chi-squared (2610) 6495.4 0 2.18e+04 0
Z Inverse normal -17.1 0 -95.4 0
L* Inverse logit t(6234) -29.1 0 -162.7 0
Pm Modified inverse chi-squared 53.4 0 265.2 0
𝑙𝑛𝑦𝑖𝑡 Level Difference
P Inverse chi-squared (2738) 1439.1 1 5220.6 0
Z Inverse normal 21.3 1 -25.3 0
L* Inverse logit t(6664) 19.2 1 -26.9 0
Pm Modified inverse chi-squared -17.5 1 33.5 0
𝑙𝑛𝑦𝑗𝑡 Level Difference
P Inverse chi-squared (2738) 1439.1 1 5220.6 0
Z Inverse normal 21.3 1 -25.3 0
L* Inverse logit t(6664) 19.2 1 -26.9 0
Pm Modified inverse chi-squared -17.5 1 33.5 0
ln(1 + 𝑡𝑟𝑓𝑖𝑗𝑡) Level Difference
P Inverse chi-squared (2738) 6777.9 0 2.72e+04 0
Z Inverse normal -25.1 0 -127.4 0
L* Inverse logit t(5994) -37.1 0 -215.5 0
Pm Modified inverse chi-squared 54.6 0 330.7 0
𝑅𝑇𝐴𝑖𝑡 Level Difference
P Inverse chi-squared (2738) 283.7 1 3795.4 0
Z Inverse normal 11.8 1 -46.9 0
L* Inverse logit t(2039) 10.7 1 -51.7 0
Pm Modified inverse chi-squared -33.1 1 14.2 0
𝑅𝑇𝐴𝑖𝑗𝑡 Level Difference
P Inverse chi-squared (2738) 209.4 1 3631.5 0
Z Inverse normal 13.7 1 -46.7 0
L* Inverse logit t(1834) 12.4 1 -52.2 0
Pm Modified inverse chi-squared -34.1 1 12.1 0
(b) Westerlund ECM cointegration test
𝑥𝑖𝑗𝑡/𝑦𝑖𝑡/ 𝑙𝑛𝑦𝑗𝑡/𝑅𝑇𝐴𝑖𝑡/𝑅𝑇𝐴𝑖𝑗𝑡 Statistic Z-value P-value
Gt -1.155 50.005 1
Ga 2.997 77.040 1
Pa 11.493 101.502 1 Note: in (a) null hypothesis is variable is non-stationary, and in (b) null hypothesis is no cointegration

37
Table 5 Gravity regression estimates
Estimation Method DVLS DVLS(AR) PPML TSLS FDE
(1) (2) (3) (4) (5)
Dependent variable: 𝑙𝑛𝑥𝑖𝑗𝑡
Country specific terms
Constant 10.49*** 12.48*** 20.23*** 5.87*** 0.16***
(1.205) (0.84) (1.135) (0.421) (0.036)
𝑙𝑛𝑦𝑗𝑡 0.78*** 0.69*** 0.55*** 0.62*** 0.39*
(0.046) (0.028) (0.043) (0.012) (0.17)
𝑙𝑛𝑦𝑖𝑡 0.14*** 0.07*** 0.41*** 0.26*** 0.07**
(0.038) (0.013) (0.04) (0.009) (0.025)
Time invariant bilateral terms
𝑙𝑛𝑑𝑖𝑠𝑡𝑖𝑗 -1.67*** -1.68*** -2.19*** -1.04***
(0.092) (0.05) (0.1) (0.053)
𝑏𝑜𝑟𝑑𝑖𝑗 -0.29*** -0.33* -1.16*** 0.44*
(0.160) (0.143) (0.189) (0.2)
𝑙𝑎𝑛𝑔𝑖𝑗 0.40 0.43* 0.64 0.54
(0.213) (0.187) (0.334) (0.314)
𝑐𝑜𝑙𝑖𝑗 0.48 0.49* -0.63* 0.63
(0.286) (0.212) (0.252) (0.767)
𝑙𝑙𝑜𝑐𝑘𝑖 -1.25** -1.88*** -3.72*** -1.5***
(0.446) (0.347) (0.371) (0.108)
𝑙𝑙𝑜𝑐𝑘𝑖𝑗 -1.02 -2.24** -5.24*** -1.55***
(1.874) (0.691) (0.703) (0.756)
Time variant bilateral terms
ln(1 + 𝑡𝑟𝑓𝑖𝑗𝑡) -3.65*** -2.55*** 0.44 -3.83*** -1.99***
(0.518) (0.163) (2.284) (0.175) (0.372)
𝑅𝑇𝐴𝑖𝑡 -0.01 -0.02 -1.12*** 0.03 -0.04
(0.046) (0.024) (0.32) (0.03) (0.025)
𝑅𝑇𝐴𝑖𝑗𝑡 0.41*** 0.35*** 1.64*** 0.42*** 0.20***
(0.047) (0.026) (0.189) (0.024) (0.027)
Observations 19,522 19,522 23,273 19,522 18,079
Adj. R-squared 0.82 0.82 0.59 0.64
Note: Robust standard errors are in parentheses. Significance levels are *** p<0.001, ** p<0.01, * p<0.05
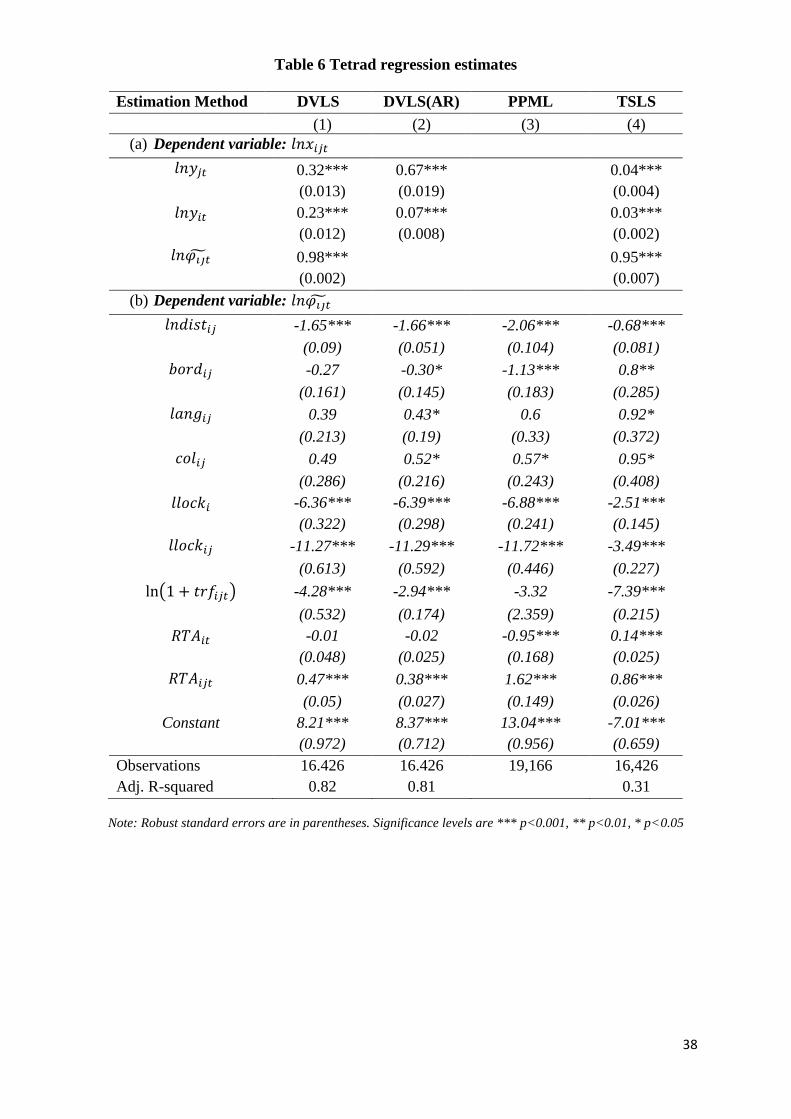
38
Table 6 Tetrad regression estimates
Estimation Method DVLS DVLS(AR) PPML TSLS
(1) (2) (3) (4)
(a) Dependent variable: 𝑙𝑛𝑥𝑖𝑗𝑡
𝑙𝑛𝑦𝑗𝑡 0.32*** 0.67***
0.04***
(0.013) (0.019)
(0.004)
𝑙𝑛𝑦𝑖𝑡 0.23*** 0.07***
0.03***
(0.012) (0.008)
(0.002)
𝑙𝑛𝜑𝑖𝑗𝑡̃ 0.98***
0.95***
(0.002)
(0.007)
(b) Dependent variable: 𝑙𝑛𝜑𝑖𝑗𝑡̃
𝑙𝑛𝑑𝑖𝑠𝑡𝑖𝑗 -1.65*** -1.66*** -2.06*** -0.68***
(0.09) (0.051) (0.104) (0.081)
𝑏𝑜𝑟𝑑𝑖𝑗 -0.27 -0.30* -1.13*** 0.8**
(0.161) (0.145) (0.183) (0.285)
𝑙𝑎𝑛𝑔𝑖𝑗 0.39 0.43* 0.6 0.92*
(0.213) (0.19) (0.33) (0.372)
𝑐𝑜𝑙𝑖𝑗 0.49 0.52* 0.57* 0.95*
(0.286) (0.216) (0.243) (0.408)
𝑙𝑙𝑜𝑐𝑘𝑖 -6.36*** -6.39*** -6.88*** -2.51***
(0.322) (0.298) (0.241) (0.145)
𝑙𝑙𝑜𝑐𝑘𝑖𝑗 -11.27*** -11.29*** -11.72*** -3.49***
(0.613) (0.592) (0.446) (0.227)
ln(1 + 𝑡𝑟𝑓𝑖𝑗𝑡) -4.28*** -2.94*** -3.32 -7.39***
(0.532) (0.174) (2.359) (0.215)
𝑅𝑇𝐴𝑖𝑡 -0.01 -0.02 -0.95*** 0.14***
(0.048) (0.025) (0.168) (0.025)
𝑅𝑇𝐴𝑖𝑗𝑡 0.47*** 0.38*** 1.62*** 0.86***
(0.05) (0.027) (0.149) (0.026)
Constant 8.21*** 8.37*** 13.04*** -7.01***
(0.972) (0.712) (0.956) (0.659)
Observations 16.426 16.426 19,166 16,426
Adj. R-squared 0.82 0.81
0.31
Note: Robust standard errors are in parentheses. Significance levels are *** p<0.001, ** p<0.01, * p<0.05

39
Table 7 Summary of Dyadic and Monadic driven trade
Country pair trade of Dyadic driven Monadic driven
Kazakhstan 58% 42%
Kyrgyzstan 50% 50%
Tajikistan 8% 92%
Turkmenistan 4% 96%
Uzbekistan 4% 96%

40
Appendix, Box 1 Main Central Asia RTAs (in chronological order)
• 1991 - Central Asian Commonwealth (CAC) with five members (Kazakhstan, Kyrgyzstan,
Tajikistan, Turkmenistan and Uzbekistan) was established; the organization merged with the
EurAsEC in 2006.
• 1994 - Commonwealth of Independent States Free Trade Agreement (CISFTA) was created
covering all the CIS countries, although by 2009, only eight of its members (Kazakhstan,
Russia, Belarus, Kyrgyzstan, Tajikistan, Armenia, Moldova, and Ukraine) remained, with the
other CIS countries (Azerbaijan, Uzbekistan and Turkmenistan) becoming observers.
• 1996 - Eurasian Economic Community (EurAsEC) was established by Kazakhstan, Russia
and Belarus. In 2001, these three countries as well as Kyrgyzstan and Tajikistan signed a
treaty to organize a common system of water and energy use. Uzbekistan withdrew from the
organisation.
• 1996 - Shanghai Cooperation Organization (SCO) was formed among China, Kazakhstan,
Kyrgyzstan, Russia, Tajikistan, and further in 2001 Uzbekistan joined the group as well.
• 1998 - Ukraine and Kyrgyzstan joined the WTO (as did Russia in 2012).
• 2010 - Eurasian Customs Union (EACU) was established between Kazakhstan, Russia and
Belarus, which is intended to be the first step towards forming “Common Economic Space”, a
common supranational system of trade and tariffs connecting all CIS countries.