capital account openness, political institutions and fdi ... · capital account openness, political...
TRANSCRIPT

JOURNAL OF ECONOMIC DEVELOPMENT 53 Volume 41, Number 2, June 2016
CAPITAL ACCOUNT OPENNESS, POLITICAL INSTITUTIONS AND
FDI IN MENA REGION: AN EMPIRICAL INVESTIGATION
MOUNA GAMMOUDI AND MONDHER CHERIF
*
Université de Reims Champange Ardenne, France
This paper examines how capital account liberalization (CAL) affects Foreign Direct
Investment (FDI) inflows. We use the System Generalized-Method-of-Moments (GMM)
estimator developed for the dynamic panel model for a sample of 17 Middle East North and
Africa (MENA) countries from 1985 to 2009. Our findings reveal that the positive impact of
CAL on FDI depends on the political stability in a host country. Furthermore, results show
that enhancing democratic institutions, enforcing property rights, reducing the risk of
expropriation and the religious tension seem to be some of the most promising policies in
terms of attracting FDI in the region. Also, we find that foreign investors value the quality of
institutions more than the level of corruption or bureaucracy quality in the location choice.
Our results are robust by using a different database of institutional qualities. Research
findings are relevant for MENA countries given that many of them have engaged in a
process of liberalization and have weak institutions.
Keywords: Capital, Account Liberalization, Foreign Direct Investment, Institutional
Quality, GMM-System JEL classification: C23, D73, F21, F43
1. INTRODUCTION While global cross border capital flows have risen to reach nearly $6 trillion in 2004,
only a small fraction (about 6.4 percent) flows to developing countries. Researchers cannot help but ask, why doesn't capital flow from rich to poor countries as predicted by classical economic theory?
Some academics and policy makers are seeking to provide a possible explanation for “why?” despite the surge in capital mobility over the last decade, FDI inflows to developed countries are much larger than those to developing countries. Addressing this question, an important strand of literature Kaminsky and Schmukler (2003), Kose et al.
* We would like to thank the anonymous referee for valuable comments. All remaining errors are our own.

MOUNA GAMMOUDI AND MONDHER CHERIF 54
(2003), Campion and Neumann (2004) and Caprio et al. (2001) have paid special attention to the role of financial liberalization in absorbing FDI. They suggest that countries can attract more international capital flows by de-regulating activities in their domestic financial markets, liberalizing their capital account transactions and equity markets. Brafu-Insaidoo and Biekpe (2014) employ three explanations on how capital account liberalization affects capital inflows: Firstly, the removal or relaxation of restrictions on foreign ownership limitations can increase FDI inflows. Secondly, the de-regulation of offshore borrowing can attract more foreign private loan inflows through the removal of quantitative restrictions on overseas borrowing and the provision of tax incentives. Thirdly, the abolition of multiple exchange rate practices can enhance the foreign capital inflows by eliminating economic distortion, and reducing the uncertainties and the risks about exchange rates particularly during repatriation of capital or income from capital.
Another body of literature (Chan and Gemayel, 2004; Onyeiwu, 2003; Daniele and Marani, 2006; Alfaro et al., 2008) have focused on the role of political stability and institutional quality in boosting FDI. They all suggest that low institutional quality is the leading factor in explaining the lack of capital flows from rich to poor countries. Recently, Asiedu and Lien, (2011) and Okada (2013) have examined the impact of institutional factors on the degree of association between capital control and FDI inflows show that financial openness improves FDI inflow only in countries with good institutional quality comparing to countries with poor institutional quality.
In this paper, we try to give an explanation on the question “why FDI does not flows from rich to poor countries” by examining the role of interaction effect of financial openness and institutional quality in enhancing FDI in the MENA region. The MENA region is a particularly interesting example for this study, given that although most member countries have undertaken financial liberalization in the 1980’s as part of the structural adjustment programs of the IMF and World Bank in order to promote FDI, it continues to attract a smaller share of FDI than all other regions except for Sub-Saharan Africa. Over the period between 2006 and 2010, the share of FDI inflows in the MENA region represented on average about 6.5 percent of the world’s total FDI inflows, against 23.62 percent in East Asia and Pacific and 8.72 percent in Latin America and Caribbean. The Europe and Central Asia region have maintained the lion’s share of global FDI flow (59 percent). This distribution is not only particular to this period or one year, but also of the whole previous decades (World Bank’s World Development Indicators).
The level of FDI inflows to MENA region is lower for two main reasons: The first one is related to the fact that multinational firms are unlikely to invest in countries with bad institutions even if these countries become more financially open. In contrast, if countries which have good institutions become more financially open, it is expected that international capital flows to these countries will increase. The second one is that, in the financially open countries, a perceived deterioration in its policy environment could be punished by the flight of capital out of the country.
This paper answers three questions: (i) does capital openness promote FDI in the

CAPITAL ACCOUNT OPENNESS, POLITICAL INSTITUTIONS AND FDI 55
MENA region? (ii) does political risk alter the relation between capital openness and FDI ? (iii) does the effect of capital openness on FDI depend on the threshold level of institutional quality beyond which CAL can foster FDI inflows?
We contribute to the literature in several ways: firstly, we study the effect of financial globalization on international capital inflows, which remains controversial by using a sample of 17 MENA countries from 1985 to 2009. Secondly, while some previous studies have analyzed the effects of financial openness and institutional quality on FDI separately, our study examines the role of institutional quality as a key factor in explaining the mixed results of financial openness on FDI inflows. Our attention is particularly focused on testing whether institutional quality in MENA region can alter the relation between capital openness and FDI. Finally, we empirically investigate the impact of detailed sub-components of political risk on the degree of association between capital control and the FDI inflows.
We focus on the two influential paper given by Noy and Vu (2007) and Okada (2013), who introduced the interaction terms between institutional quality and capital openness to examine the impact of institutional factors on the degree of association between capital control and FDI inflows. Our model differs from theirs in that we look at more than one aspect of institutional quality such as government stability, socioeconomic conditions, investment profile, internal conflict, external conflict, corruption, military in politics, religious tensions, law and order, ethnic tensions, democratic accountability and bureaucracy quality. To check the robustness of our results we use an alternative set of institutional quality given by Kaufmann et al. (2010).
The remainder of the paper is organized as follows: Section 2 presents a review of empirical literature. Section 3 describes the data and methodological framework. Section 4 presents the empirical results and Section 5 concludes.
2. LITERATURE REVIEW There are a few empirical studies that have been done to investigate the impact of
financial liberalization on FDI inflows, and a few empirical analyses have focused on the effects of capital controls. In this section, we recall the main research studies in this subject.
In an influential book on the consequences of trade barriers, Bhagwati (1978) argued that FDI contributes to growth by enhancing economic efficiency and that open economies are more likely to attract FDI. Gastanaga et al. (1998) supported the notion that countries with relatively liberalized capital accounts attracted more foreign direct investment flows than countries that are more closed. The study investigated up to forty nine developing countries, and found that openness to international capital flows and foreign direct investment in particular had a positive impact on the level of foreign direct investment flows. It also suggests that more liberalized economies have investment ratios that are higher than closed economies and this behavior is associated with higher
MOUNA GAMMOUDI AND MONDHER CHERIF 56
FDI inflows. Kyaw (2006) suggests that developing countries can increase the attractiveness to foreign direct investors by reducing the impediments to capital movements. Fratzscher and Bussiere (2008) show that the size of FDI inflows can influence the effect of capital account openness on growth in the longer terms. They assert that “The acceleration of growth immediately after liberalization is found to be often driven by an investment boom and a surge in portfolio and debt inflows. By contrast, the quality of domestic institutions, the size of FDI inflows and the sequencing of the liberalization process are found to be important driving forces for growth in the medium to longer term”.
Asiedu and Lien (2004) who use a panel data which covers 96 developing countries over the period 1970 to 2000 examine the impact of three types of capital control policies on FDI: the existence of multiple exchange rates; restrictions on capital account, and restrictions on the repatriation of export proceeds. They present mixed findings with some evidence that FDI flows are impacted by capital account policies, but only in specific geographical regions. More precisely, they find that the impact of capital controls on FDI varies by region and has changed over time. In the 1970s and 1980s, none of the policies had a significant impact on FDI. In the 1990s, all three were significant. Furthermore, capital controls have no effect on FDI to SSA and the Middle East, but affects FDI to East Asia and Latin America adversely.
Kinga Z. Elo (2007) analyzes the effects of capital controls on FDI by using the data of 81 countries from 1980 to 2001 and shows that capital controls reduce the quality of foreign direct investments both in terms of volatility and volume. The effects of capital controls on FDI depend heavily on the country’s economic environment, particularly its country risk characteristics.
Butkiewicz and Yanikkaya (2008) find that developing countries with capital controls are less likely to benefit from capital inflows, especially from FDI, so capital restrictions reduce the benefit of FDI on growth. Rachdi and Saidi (2011) find a positive correlation between the liberalization of the capital account and economic growth via FDI.
Some less optimistic conclusions on the effect of capital account openness are suggested by Aizenman and Noy (2004) who find that capital controls have no impact on aggregate capital flow volumes. Brafu-Insaidoo and Biekpe (2014). examine the impact of different aspects of external financial liberalization, domestic financial deregulation and regionalism on international capital flows on the case of 37 SSA countries, among other results, they find that while the aggregate capital account liberalization is not significant, the liberalization of inward FDI directly increases FDI. In the same vein, Cherif et al. (2011) show that the effects of capital openness policies on FDI depend on the host region, it is an ingredient for attracting FDI in Latin America whereas it repeals FDI in Central and Eastern Europe countries. In the Mediterranean region, South Asia and Africa, it seems to be inconsistent.
This controversy has prompted research on the evaluation of the possible preconditions under which capital account liberalization may promote FDI inflows.

CAPITAL ACCOUNT OPENNESS, POLITICAL INSTITUTIONS AND FDI 57
Some of them have underlined the influence of institutional qualities in the host countries on the degree of association between CAL and FDI inflows.
Noy and Vu (2007) construct an annual panel dataset for 62 developing and 21 developed countries from 1984 to 2000 and they conduct an empirical analysis for each group separately, given that the factors that affect FDI inflows are different across the two groups .They use a standard FDI determination model with fixed effect and they add the capital control variable. Furthermore, in order to examine whether the impact of capital controls on FDI inflows is sensitive to different institutional factors like corruption, financial risk and political stability they include interaction terms between capital openness and corruption, interaction between capital openness and institutional variables. Among other results, they show that an increase of one standard deviation in the capital openness will increase FDI inflows by 0.71 percent and 0.32 percent for the developing countries and developed countries samples, respectively. They underline that the liberalization of the capital account is not sufficient to generate increases in inflows unless it is accompanied by a lower level of corruption or a decrease in political risk. These results are obtained by using fixed effects and least squares estimators and confirmed by GMM dynamic two step panel estimator. Cherif et al. (2011) argue that capital account openness does not enhance foreign investment into domestic markets unless it is associated with passing new laws, easing regulations and improving governance in order to attract foreign investors.
Okada (2013) uses a dynamic panel model to examine how financial openness and institutional quality affect international capital inflows in the sample of 112 countries from 1985 to 2009. He finds that while financial openness and institutional quality do not individually have significant impacts on international capital inflows, their interaction effects are significant. He confirms the assumption that the partial effect of capital openness on FDI inflows is depending on the level of institutional quality. He concludes that capital account openness improves FDI inflow only in countries with good institutional quality compared to countries with poor institutional quality. Furthermore, among institutional factors, bureaucratic quality and law and order appear to play an important role in promoting FDI.
3. DATA AND METHODOLOGICAL FRAMEWORK To examine whether the liberalization of the capital account is sufficient to generate
increases in FDI inflows, this study uses a sample of 17 MENA countries from 1985 to 2009. Our empirical approach is inspired by a theoretical framework due to Noy and Vu (2007) and Okada (2013). Accordingly, we employ a dynamic panel model for FDI net inflows which includes a lagged dependent variable. Our basic empirical model is therefore as follows:

MOUNA GAMMOUDI AND MONDHER CHERIF 58
, = , + , + , ∗ ,
+ , + + + ,
(1)
where i refers to countries, t to time and is the country specific fixed effects. Our dependent variable is net FDI/GDP, , is the lagged value, KAOPEN is the
indicator of capital account liberalization,1 POLITICAL is a measure of political risk,2 ( ∗ ) is the interaction term or indirect impact of CAL on FDI. This will determine the political risk threshold level. is a vector of macroeconomic control variables that include the variables most used in the literature, namely, Trade Openness (TO), Financial development indicator (PC), Market size (GDPGR), Inflation (INF) and Natural Resource availability (FUEL). Detail on the variable definitions and sources are available in Table A1, and summary statistics for key variables are provided in Table A2 (Appendix).
We are interested in the partial effect of capital openness on FDI inflows, which varies with the level of political risk:
= + ∗ .(2)
The expected results that can examine the role of political stability to channelize the
impact of capital openness on FDI can be illustrated as follows: · If both and have positive sign, capital openness has a positive impact on FDI
inflows, and institutional factors further enhance that positive impact. · If is positive and is negative, capital openness has a positive impact on FDI
inflows, and institutional factors detract from that positive impact. · If negative is and is positive, capital openness has a negative impact on FDI
inflows, and institutional factors alleviate that negative impact. · If both and have negative signs, capital openness has a negative impact on
FDI inflows, and institutional factors aggravate that negative impact. Equation (1) allows us to calculate the threshold level of political risk in the short
1 Among other measures of capital account liberalization, we adopt the KAOPEN index as developed by
Chinn and Ito (2008). One of the merits of this index is that it refers to the intensity of capital controls
because it incorporates other types of restrictions such as current account restrictions, not just capital account
controls. Also, this index covers many countries (181 countries) for a long time period (1970 through 2008)
(Table A1 in appendix). We use the updated database from 1970 through 2011. 2 We use two composits index of political risk: the ICRG index which is based on political risk rating
provided by the PRS Group, comprising 12 subcomponents and EURO index as an altenative measure of
political risk which is provided by Euromoney.

CAPITAL ACCOUNT OPENNESS, POLITICAL INSTITUTIONS AND FDI 59
period3 beyond which capital openness promotes FDI inflows. Thus, the positive effect of capital openness on FDI inflows is observed when:
> 0,(1a)
↔ + ∗ > 0.(1b) Therefore the threshold level of political risk is given by the following expression:
> −
. (1c)
Next, to reveal the key role of each 12 sub-components of the political risk index to
explain the relation between capital openness and FDI we include k which represents respectively the effects of government stability, socioeconomic conditions, investment profile, internal and external conflict, corruption, military in politics, religious tensions, law and order, ethnic tensions, democratic accountability, and the quality of bureaucracy. Moreover, to avoid the problem of multicollinearity, the 12 indicators will be singly added to our regression. As a robustness check, we adopt another set of institutional qualities given by Kaufmann et al. (2010). They construct six different indicators, each representing a different dimension of governance: Voice and accountability, political stability, government effectiveness, regulatory quality, rule of law and control of corruption.4
Our Model is written as follows:
, = , + , + , ∗ , + ,
+ + , .(3)
One of econometric problems that may arise from estimating Equations (1) and (3) is
that the dynamic structure of the model makes the OLS estimator upwards biased and inconsistent, due to the correlation between the unobserved country-specific and the lagged FDI (Baltagi, 2008). The GMM estimator suggested by Arellano and Bond (1991) provides consistent estimates for such models. This estimator often referred to as the “difference” GMM estimator takes the first difference of the data and then uses lagged
3 The long period effects can be derived by dividing each of the , and by(1 − ) the coefficient
of the lagged depended variable (Baltagi et al., 2009). 4 All the individual variables have been rescaled to run from zero to one, with higher values indicating
better outcomes.
MOUNA GAMMOUDI AND MONDHER CHERIF 60
values of the endogenous variables as instruments. This allows to get rid of country specific effects and eliminates any endogeneity that may be due to the correlation of these country specific effects and the explanatory variable.
Arellano and Bover (1995) and Blundell and Bond (1998) point out that when the explanatory variables are persistent over time, lagged levels are weak instruments for first differences. Blundell and Bond (1998) proposed a more efficient estimator, the “system GMM estimator”, which mitigates the poor instruments problem by using additional moment conditions. However, the system estimator has one disadvantage: it uses too many instruments. Thus, the difference estimator suffers from the “weak” instruments problem and the system estimator exhibits the “too many” instruments problem (Asiedu and Lien, 2011). In our study we use the system GMM approach which generally produces more efficient and precise estimates compared to difference GMM by improving precision and reducing the finite sample bias (Baltagi, 2008).
To verify the consistency of the GMM estimator, we consider two specification tests: First, the Hansen test (J-test) for over-identifying restrictions. The hypothesis being tested is that the chosen instruments are uncorrelated with the residuals. If the null hypothesis is not rejected, the instruments are valid. Second, the Arellano-Bond test for autocorrelation, examines the null hypothesis of no order serial correlation in the first-differenced residuals. We check for second-order correlation AR (2)5 which should be not rejected the null hypothesis.
4. THE EMPIRICAL RESULTS Using the econometric method outlined above, this section presents regression
results of the relationship between capital openness and FDI in the presence of political risk. We proceed to do various tests using Equation (1). Results are presented in Table 1. However, we do not only address the political risk composite, but also the components of political institutions. Using Equation (3) we report the relationship between financial openness, FDI and each of 12 indicators of institutional indicators in Table 2. We present the results of our robustness check in Table 3.
The GMM system regressions satisfy both the Hansen test of over-identifying restrictions and the serial correlation test. In all our model specifications, the Hansen test cannot reject the null hypothesis that our instruments are valid. Moreover, the AR (2) test fails to reject the null hypothesis that there is no second order autocorrelation in the differentiated residuals.
5 By construction, the differenced error term is probably first order serially correlated even if the original
error term is not.

CAPITAL ACCOUNT OPENNESS, POLITICAL INSTITUTIONS AND FDI 61
4.1. Capital Openness, Political Risk and FDI Table 1 reports the empirical results of the regressions on the link between capital
openness, political risk and FDI for our sample of 17 countries between 1985 and 2009. As a first step, in regression (1) we include all of the control variables such as trade openness, inflation, fuel, private credit and GDP growth rate without capital account openness variable. As a second step, in regression (2) and (3) we separately, add two main explanatory variables, financial openness and political risk. Then, the regression (5) reports the results where we control these two factors simultaneously. Finally, in regression (7) we present results for whether political risk can alter the relation between capital openness and FDI, thus we introduce the interaction term between capital openness and political risk. Columns (4), (6) and (8) report results of the alternative index of political risk produced by Euromoney.
First, let us take a look at the main determinant of FDI in the absence of capital openness policy, column 1 in Table 1 shows that the coefficients of lagged FDI and Fuel variables are positive and statistically significant at 1 and 10 percent, respectively. A one standard deviation increase in the share of fuel in total merchandise exports (which is a proxy for natural resources abundance) drives the ratio of FDI to GDP positively by 1.04 percentage points in the MENA region [dFDI/dFUEL= 0.026 × 40 = 1.04]. The non-significance of GDP growth rate can be explained by the fact that the majority of MENA countries are endowed with natural resources. Thus, economic growth may not be an important factor in the decision to invest in these countries while natural resource availability is very important for attracting FDI in MENA region (Wasseem, 2012).
The empirical results indicate that CAL has a significant positive impact on FDI, when we include capital account openness indicator in regression (column 2), estimation shows that an increase in capital openness by one standard deviation is associated with an FDI inflows increase by about 0.98 percentage points [dFDI/dKAOPEN=0.562× 1.753=0.98]. We use an example to illustrate the positive effect of capital openness on FDI. Consider two MENA countries that have extremely different levels of KAOPEN: Syria, has the least capital KAOPEN in MENA region and U.A.E, the country that has the highest KAOPEN in the region. Then, all else equal, an improvement in KAOPEN from the level of Syria ( = −1.83) to the level of U.A.E ( =2.5) will increase FDI inflows by about 2.43 percentage points in the short run and by 7.31 percentage points in the long-run. This follows from the fact that the short-run effect of a
∆ change in KAOPEN on FDI is given by ∗ ∆ and the long-run effect is ( ∗∆)
. Where
is the estimated coefficient of KAOPEN and ρ is the estimated coefficient of
, . Here, ∆=[2.5-(-1.83)] and from Table (1) =0.562 and =0.659. Then
[ / = [ 0.562 * (2.5 -(- 1.83)] = 2.43] in the short-run and 7.31 [0.562*(2.5-(-1.83)]/1-0.659=7.31] in the long-run. One explanation given by Cherif et al. (2011) is that foreign investors look for the assurance that allows them to repatriate their investment at any time. So, they prefer to invest in countries with more open capital

MOUNA GAMMOUDI AND MONDHER CHERIF 62
account. This finding is consistent with Noy and Vu (2007). The fuel variable became non-significant, suggesting that foreign direct investors
prefer to operate in countries with an open capital independently of natural resource abundance and market size. Political stability does not appear to have a significant direct effect on FDI (column 3 and 4) in the MENA region and trade openness is significant at the level of 1%. Private credit, on the contrary, does not affect FDI flows at conventional levels of significance (column 1, 2, 3 and 4). The estimated coefficient of lagged FDI is positive and significant, an indication that FDI is persistent. Indeed, this provides justification for using the Blundell and Bond (1998) GMM estimator. In column (5) and (6) we add ICRG and EURO political risk indexes, results indicate that the coefficient of KAOPEN “ ” became negative and significant at the level of 1% and 10%, respectively. We can infer that political instability appears to have a negative impact on capital openness policy and FDI relationship.
Then, to check whether the impact of capital control on FDI inflows is sensitive to political risk, we include the interaction term between these two variables. Results are reported in column (7) and (8) of Table 1. Using Equation (1), the marginal effect of financial openness is given by [ / = + ∗ ]. Based on the ICRG political risk index (column 7, Table 1), We first note that <0 and >0, implying that there exists a threshold value of institutional quality, such that [ / = + × =0]. This implies that [ / >0] if and only if political>political*. The marginal effect of financial openness on FDI increases with institutions, and the threshold level of institutions between the negative and positive partial effect is 0.63 (2.469/3.868=0.63) which is 65th percentile in this sample. That means that in our sample at most 35 percent (at least 65 percent) of the observations are greater (smaller) than 0.63 (see Figure 1 in Appendix for more details). Based on the EURO political risk index (column 8, Table 1), the corresponding threshold level is 0.52 (1.598/03.04=0.52) which represents the 65th percentile in our sample.
The total effect of a one-unit increase in KAOPEN in MENA region is calculated to be -0.11[-2.469+ (3.868*0.61) =-0.11]6 percentage point using the MENA average of POLITICAL, 0.61.7 The negative effect of capital openness on FDI in the MENA countries can be explained by the fact that MENA region has not attained on average the threshold level of institutional quality behind which financial openness can affect positively and significantly FDI inflows. The average value of institutional quality in the MENA countries is 0.61 (Column 7, Table 1) which is lower than 0.63 threshold levels seen from the estimations. The Table illustrates that, in order to benefit from the positive effect of CAL on FDI, MENA countries must possess a level of political risk greater
6 Calculations of overall effect of capital openness on FDI are based on column 7 (Table 1). To simplify
calculations, we consider here the mean of a measure of ICRG political risk index which equal to 0.61. 7 For the rest of interpretation we use results given by the ICRG political risk index.

CAPITAL ACCOUNT OPENNESS, POLITICAL INSTITUTIONS AND FDI 63
than the threshold level of 0.63 (see Figure 2 in Appendix for more details).
Table 1. Arellano-Bond GMM Estimation: Capital Openness, Political Risk and FDI (1985-2010)
Dependent
variable:
FDI/GDP
(1) (2) (3) (4) (5) (6) (7) (8)
1-tFDIa 0.578
(0.000)***
0.659
(0.000) ***
0.904
(0.000) ***
0.982
(0.000) ***
0.981
(0.000)***
0.809
(0.000)***
0.648
(0.000)***
0.884
(0.000)***
KAOPENb
0.562
(0.092)*
-0.922
(0.003)***
-0.638
(0.064)*
-2.469
(0.091)*
-1.598
(0.050)**
GDPGR -0.023
(0.642)
0.001
(0.950)
-0.006
(0.619)
0.003
(0.888)
0.015
(0.274)
-0.010
(0.569)
0.004
(0.779)
0.029
(0.237)
TO -0.014
(0.327)
0.00
(0.992)
0.011
(0.000)***
0.015
(0.002)***
0.025
(0.014)**
0.034
(0.022)**
0.12
(0.006)***
0.009
(0.110)
INF 0.014
(0.439)
-0.003
(0.658)
0.002
(0.522)
0 .002
(0.623)
0.006
(0.581)
-0.002
(0.772)
-0.15
(0.059)*
0.005
(0.295)
FUEL 0.026
(0.088)*
-0.015
(0.066)*
0.003
(0.011)**
-0.003
(0.304)
0.013
(0.033)**
-0.005
(0.511)
-0.12
(0.034)**
-0.007
(0.039)**
PC -0.045
(0.264)
0.004
(0.691)
0.002
(0.727)
0.009
(0.245)
0.013
(0.220)
0.014
(0.337)
0.005
(0.560)
0.018
(0.088)*
POLITICAL
-0.548
(0.478)
-0.008
(0.213)
0.091
(0.965)
0.021
(0.153)
-1.10
(0.361)
-1.179
(0.348)
KAOPEN*
POLITICAL
3.868
(0.081)*
3.04
(0.051)*
CONSTANT -1.10
(0.589)
1.07
(0.338)
0.104
(0.831)
-0.470
(0.249)
-3.07
(0.036)**
-3.00
(0.114)
0.962
(0.314)
-0.68
(0.140)
Arellano-Bond
AR (2) testc
p = 0.35 P=0.38 P= 0.36 P= 0.23 P= 0.36 P= 0.18 P= 0.37 P=0.27
J-testd p = 0.65 p = 0.30 p = 0.27 P=0.31 p =0.37 P= 0.31 P= 0.26 P=0.7
Observations 232 230 232 175 230 174 230 174
Mean 0.61 0.50
Threshold Level
of Political 0.63 0.52
Notes: ***, **, * refer to the 1, 5 and 10% levels of significance respectively. The model is estimated with
the two-step Arellano-Bond GMM dynamic panel methodology which is asymptotically efficient and robust
for all kinds of heteroskedasticity. a FDI t-1 is considered to be a predetermined variable and it is instrumented
by their lagged values of at least one period. b KAOPEN is supposed to be endogenous, therefore we use
lagged values of at least two periods as an instrument (Arellano and Bover, 1995). The explanatory variables
such as control variables and political indicators are considered as exogenous thus, we use their current
values as instruments. To ensure comparability among the components and easier interpretation of the results,
we rescaled the sub-components from 0 to1. c AR (2) is a test of second-order residual serial correlation. d
J-test is the Hansen overidentification test. Rows [17] show the threshold level of the political risk variable
beyond which the capital account openness has a positive impact on FDI.
MOUNA GAMMOUDI AND MONDHER CHERIF 64
We provide an example to illustrate the role of the interaction between capital openness and good institutions in boosting FDI. The average value of POLITICAL is equal to 0.54 for Iran and 0.64 for Bahrain. Suppose the degree of financial openness, KAOPEN, for Syria increases by one sample standard deviation. Then for the regressions that employ ICERG as a measure of institutional quality (Column 7), the increase in financial openness will decrease FDI in Iran by about -0.66 percentage points. [ / =(2.469+3.868´0.54)´1.753=-0.66]. Now suppose Iran implements policies that lead to an improvement in its institutions, such that the value of POLITICAL increases to the level of Botswana. Then, a one standard deviation increase in KAOPEN will increase FDI by 0.011 percentage points [ / = (-2.469+3.868´0.64) ´1.753=0.011]. Therefore, financial openness increases FDI inflows in MENA countries where political stability is above 0.63, and decreases it in countries where political stability is below this threshold. In other words, FDI inflows in countries with higher political stability (>0.63) benefit more from financial openness than those in countries with lower political stability.
Figure 2 presents a visual picture of the total effect of a one-unit increase in KAOPEN, based on each country’s value of the political risk index for the MENA countries. The countries are placed in order of the magnitude of the total effect. Countries, such as Oman and U.A.E that show positive effects of financial opening, have attained a threshold level of legal and institutional development, whereas countries with underdeveloped institutional infrastructure may hamper the FDI inflows. So, we categorize our sample countries into two: Category A refers to countries where capital openness policy may promote FDI, and Category B refers to countries where an increase in capital openness may not result in an increase in FDI, and may possibly reduce FDI, which represents 35 percent and 65 percent in our study, respectively. Therefore, Bahrain, Kuwait, Oman, Qatar, U.A.E and Tunisia fall in Category A and Algeria, Egypt, Iran, Jordan, Lebanon, Libya, Morocco, Syria, Saudi Arabia ,Turkey and Yemen fall in Category B.
4.2. Capital Openness, Unbundling Institutions and FDI In a previous subsection, institutional quality is discussed as a composite index of
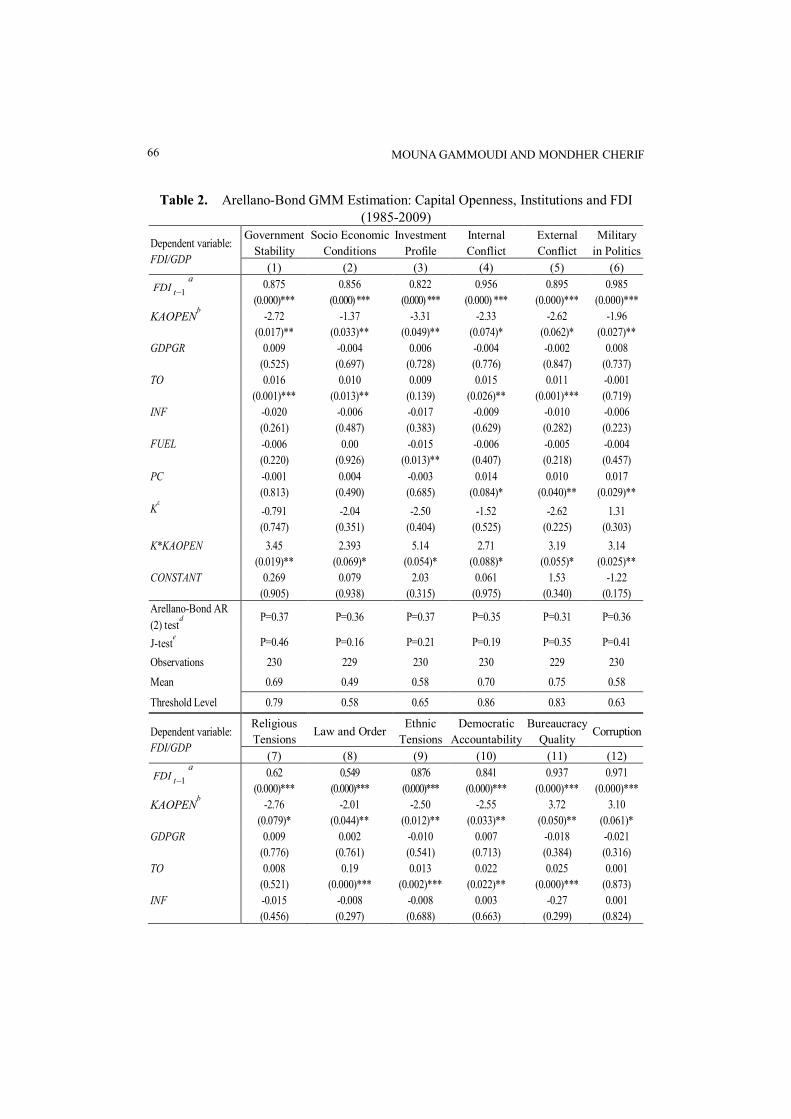
political risk comprising 12 sub-components. However, this index may be too aggregated to capture the appropriate effects on FDI inflows. Table 2 summarizes the results from the regressions run with each of the components of the political risk index by using equation (4), (government stability, socioeconomic conditions, investment profile, internal conflict, external conflict, corruption, military in politics, religious tensions, law and order, ethnic tensions, democratic accountability and bureaucracy quality) by introducing the interaction terms. Results show that the estimated coefficient of democratic accountability and law and order are positive and significant at the 1% level, this implies that high levels of democracy and property rights protections increase FDI inflows to the MENA region (Column 8 and 10).

CAPITAL ACCOUNT OPENNESS, POLITICAL INSTITUTIONS AND FDI 65
The main finding is that, the effect of the interaction term between financial openness and the political risk index on FDI depends on the institutional indicators used in regression. In columns (1)-(10), where government stability, socioeconomic conditions, investment profile, internal conflict, external conflict, military in politics, religious tensions, law and order, ethnic tensions and democratic accountability are used as the proxy for institutional quality, the coefficient of interaction term between financial openness and each institutional quality is significant and positive, suggesting that financial openness alone may lead to hamper FDI inflows ( KAOPEN has a negative sign) but that this outcome can be avoided only if countries have attained a threshold level of institutional quality. However, in all cases, MENA region seems far from the threshold level (mean<threshold level). Furthermore, results show that some institutional aspects matter more than others, financial openness policy in a country with important scores in democratic accountability, religious tension and investment profile attract more foreign investors. These results suggest that capital account policy induced effects are stronger in democracies than in autocracies countries as argued by Asiedu and Lien (2011).
In the specification containing bureaucracy quality and corruption, the coefficients of the interaction term are statistically significant at the five and ten percent level, respectively, and are negative. This suggests that financial openness reduces FDI flows in less corrupt and bureaucratic countries. Using corruption indicator, the marginal impact of the financial liberalization on FDI is expressed as follows: [ / =3.10+(-5.78*Corruption)] corresponding to threshold level equal to 0.53 (3.10/5.78). Paradoxically, the empirical results show that financial liberalization policies in MENA countries are favorable to foster FDI, as the corruption index (the average value of corruption index in MENA countries is 0.43) is less than the threshold (0.43<0.53).8 The total effect of a one-unit increase in KAOPEN in MENA region is calculated to be 0.61 [3.10+ (-5.78*0.43) =0.61] percentage point. As a specific example, Jordan represents the least corrupt country among MENA countries and Lebanon represents the most corrupt country, a one-unit increase in KAOPEN in Jordan decreases FDI by about 0.021 percentage points [3.10-5.87*0.54=-0.021] and increases FDI in Lebanon by about 1.42 percentage points [3.10-5.87*0.29=1.42]. We infer that financial liberalization policies are favorable to promote FDI in more corrupt countries in the region. Of course, our results should not be interpreted as support for corruption level or bureaucracy regimes in the MENA region. Rather, the results should be seen as an indication of the importance of the quality of institutions. We can suggest that foreign investors value the quality of institutions more than the level of corruption in the location choice.
8 See Figure A1 in Appendix.
MOUNA GAMMOUDI AND MONDHER CHERIF 66
Table 2. Arellano-Bond GMM Estimation: Capital Openness, Institutions and FDI (1985-2009)
Dependent variable:
FDI/GDP
Government
Stability
Socio Economic
Conditions
Investment
Profile
Internal
Conflict
External
Conflict
Military
in Politics
(1) (2) (3) (4) (5) (6)
1-tFDIa 0.875
(0.000)***
0.856
(0.000) ***
0.822
(0.000) ***
0.956
(0.000) ***
0.895
(0.000)***
0.985
(0.000)***
KAOPENb -2.72
(0.017)**
-1.37
(0.033)**
-3.31
(0.049)**
-2.33
(0.074)*
-2.62
(0.062)*
-1.96
(0.027)**
GDPGR 0.009
(0.525)
-0.004
(0.697)
0.006
(0.728)
-0.004
(0.776)
-0.002
(0.847)
0.008
(0.737)
TO 0.016
(0.001)***
0.010
(0.013)**
0.009
(0.139)
0.015
(0.026)**
0.011
(0.001)***
-0.001
(0.719)
INF -0.020
(0.261)
-0.006
(0.487)
-0.017
(0.383)
-0.009
(0.629)
-0.010
(0.282)
-0.006
(0.223)
FUEL -0.006
(0.220)
0.00
(0.926)
-0.015
(0.013)**
-0.006
(0.407)
-0.005
(0.218)
-0.004
(0.457)
PC -0.001
(0.813)
0.004
(0.490)
-0.003
(0.685)
0.014
(0.084)*
0.010
(0.040)**
0.017
(0.029)**
Kc -0.791
(0.747)
-2.04
(0.351)
-2.50
(0.404)
-1.52
(0.525)
-2.62
(0.225)
1.31
(0.303)
K*KAOPEN 3.45
(0.019)**
2.393
(0.069)*
5.14
(0.054)*
2.71
(0.088)*
3.19
(0.055)*
3.14
(0.025)**
CONSTANT 0.269
(0.905)
0.079
(0.938)
2.03
(0.315)
0.061
(0.975)
1.53
(0.340)
-1.22
(0.175) Arellano-Bond AR
(2) testd
P=0.37 P=0.36 P=0.37 P=0.35 P=0.31 P=0.36
J-teste P=0.46 P=0.16 P=0.21 P=0.19 P=0.35 P=0.41
Observations 230 229 230 230 229 230
Mean 0.69 0.49 0.58 0.70 0.75 0.58
Threshold Level 0.79 0.58 0.65 0.86 0.83 0.63
Dependent variable:
FDI/GDP
Religious
Tensions Law and Order
Ethnic
Tensions
Democratic
Accountability
Bureaucracy
Quality Corruption
(7) (8) (9) (10) (11) (12)
1-tFDIa 0.62
(0.000)***
0.549
(0.000)***
0.876
(0.000)***
0.841
(0.000)***
0.937
(0.000)***
0.971
(0.000)***
KAOPENb -2.76
(0.079)*
-2.01
(0.044)**
-2.50
(0.012)**
-2.55
(0.033)**
3.72
(0.050)**
3.10
(0.061)*
GDPGR 0.009
(0.776)
0.002
(0.761)
-0.010
(0.541)
0.007
(0.713)
-0.018
(0.384)
-0.021
(0.316)
TO 0.008
(0.521)
0.19
(0.000)***
0.013
(0.002)***
0.022
(0.022)**
0.025
(0.000)***
0.001
(0.873)
INF -0.015
(0.456)
-0.008
(0.297)
-0.008
(0.688)
0.003
(0.663)
-0.27
(0.299)
0.001
(0.824)

CAPITAL ACCOUNT OPENNESS, POLITICAL INSTITUTIONS AND FDI 67
FUEL -0.012
(0.312)
-0.013
(0.042)**
-0.000
(0.946)
-0.00
(0.960)
-0.008
(0.281)
-0.009
(0.274)
PC 0.037
(0.120)
0.007
(0.314)
-0.01
(0.402)
0.020
(0.208)
-0.012
(0.036)
-0.037
(0.018)**
Kc 1.98
(0.526)
2.09
(0.090)*
0.781
(0.746)
3.30
(0.075)*
-0.91
(0.884)
0.90
(0.707)
K*KAOPEN 4.48
(0.077)
2.54
(0.080)*
3.21
(0.006)***
4.8
(0.011)*
-7.03
(0.041)**
-5.78
(0.092)*
CONSTANT -1.42
(0.523)
-1.59
(0.234)
-1.43
(0.416)
-3.38
(0.044)*
1.05
(0.378)
0.57
(0.638) Arellano-Bond AR
(2) testd
P=0.34 P=0.37 P=0.37 P=0.36 P=0.32 P=0.40
J-teste P=0.51 P=0.28 P=0.45 P=0.32 P=0.30 P=0.49
Observations 230 230 230 230 230 230
Mean 0.54 0.62 0.70 0.45 0.47 0.43
Threshold Level 0.62 0.8 0.8 0.54 0.52 0.53
Notes: ***, **, * refer to the 1, 5 and 10% levels of significance respectively. The model is estimated with
the two-step Arellano-Bond GMM dynamic panel methodology which is asymptotically efficient and robust
for all kinds of heteroscedasticity. a FDI t-1 is considered to be a predetermined variable and it is instrumented
by their lagged values of at least one period. b KAOPEN is supposed to be endogenous, therefore we use
lagged values of at least two periods as an instrument (Arellano and Bover, 1995). The explanatory variables
such as control variables and political indicators are considered as exogenous thus, we use their current
values as instruments. To ensure comparability among the components and easier interpretation of the results,
we rescaled the sub-components from 0 to1. c K is one among 12 indicators of institutional quality. d AR (2) is
a test of second-order residual serial correlation. e J-test is the Hansen overidentification test.
4.3. Robustness Check
Table 3 reports the results of the alternative database of six governance indicators developed by Kaufman et al., (2010). Given the availability of data, we consider only the period from 1996 to 2008. Our main findings are that in terms of significance the results are consistent with those when we consider the ICRG database for FDI inflows. In columns (1) to (5), where Voice and accountability, political stability, government effectiveness, regulatory quality, rule of law are included, the interaction term between financial openness and institutional quality has a significant positive effect on FDI. However, in the specification containing control of corruption, the coefficient of the interaction term is statistically significant at the 5% level, and is negative. This suggests the importance of a strong institutional environment in mitigating the negative effect of financial openness on FDI inflows. Indeed, in order to benefit from the positive effect of capital openness on FDI inflows, MENA countries must reach a certain level of institutional quality.

MOUNA GAMMOUDI AND MONDHER CHERIF 68
Table 3. Arellano-Bond GMM Estimation: Capital Openness, Institutions and FDI (Robustness check, 1996-2008)
Dependent variable:
FDI/GDP
Voice and
Accountability
Political Stability
and Absence of
Violence
Government
Effectiveness
Regulatory
Quality
Rule of
Law
Control of
Corruption
(1) (2) (3) (4) (5) (6)
1-tFDIa 0.866
(0.000)***
0.91
(0.000)***
0.956
(0.000)***
0.854
(0.000)***
0.984
(0.000)***
0.895
(0.000)***
KAOPENb -3.07
(0.032)**
-4.406
(0.008)***
-5.77
(0.018)**
-5.36
(0.034)
-3.02
(0.066)*
6.05
(0.036)**
GDPGR 0.058
(0.302)
-0.084
(0.154)
0.065
(0.093)*
0.062
(0.11)
0.019
(0.394)
-0.001
(0.969)
TO -0.028
(0.118)
-0.013
(0.522)
-0.028
(0.078)*
-0.031
(0.039)**
-0.012
(0.388)
0.047
(0.002)***
INF 0.071
(0.208)
-0.089
(0.069)*
0.014
(0.401)
0.005
(0.787)
0.010
(0.607)
0.019
(0.073)*
FUEL -0.003
(0.890)
-0.019
(0.343)
-0.027
(0.060)*
-0.024
(0.077)*
-0.031
(0.051)*
0.016
(0.026)**
PC 0.03
(0.610)
0.103
(0.154)
0.012
(0.616)
0.003
(0.904)
0.013
(0.624)
-0.015
(0.581)
Kc -1.14
(0.941)
-4.27
(0.541)
-2.78
(0.670)
1.39
(0.645)
-5.81
(0.205)
6.63
(0.340)
K*KAOPEN 9.76
(0.028)**
9.18
(0.004)***
12.81
(0.011)**
11.69
(0.027)**
6.40
(0.057)*
-12.96
(0.035)**
CONSTANT 0.25
(0.973)
7.9
(0.156)
2.86
(0.450)
1.40
(0.649)
8.58
(0.193)
-5.96
(0.056) Arellano-Bond AR
(2) testd
P=0.86 P=0.77 P=0.49 P=0.51 P=0.81 P=0.63
J-teste P=0.49 P=0.76 P=0.41 P=0.39 P=0.48 P=0.50
Observations 128 128 128 128 128 128
Mean -0.93 -0.3 -0.11 -0.19 -0.13 -0.13
Threshold Level 0.32 0.48 0.46 0.46 0.47 0.46
Notes: ***, **, * refer to the 1, 5 and 10% levels of significance respectively. The model is estimated with
the two-step Arellano-Bond GMM dynamic panel methodology which is asymptotically efficient and robust
for all kinds of heteroskedasticity. a FDI t-1 is considered to be a predetermined variable and it is instrumented
by their lagged values of at least one period. b KAOPEN is supposed to be endogenous, therefore we use
lagged values of at least two periods as an instrument (Arellano and Bover, 1995). The explanatory variables
such as control variables and political indicators are considered as exogenous thus, we use their current
values as instruments. To ensure comparability among the components and easier interpretation of the results,
we rescaled the sub-components from 0 to1. c K is one among 12 indicators of institutional quality. d AR (2)
is a test of second-order residual serial correlation. e J-test is the Hansen overidentification test.
CAPITAL ACCOUNT OPENNESS, POLITICAL INSTITUTIONS AND FDI 69
5. CONCLUSION This paper sought to investigate the nexus between CAL and FDI inflow and to test
whether the results are affected by political risk and institution qualities, by focusing on the MENA region. We use two-step system GMM estimator developed for the dynamic panel model which is asymptotically efficient and robust for all kinds of heteroscedasticity.
There are three important findings: first, the effect of financial openness on FDI is increasing in the level of political risk index. In other words, capital inflows in countries with political stability benefit more from financial openness than those in countries with high political risk. More precisely, we demonstrate that institutional quality in MENA countries seems crucial to whether or not there is a positive effect of capital openness policy in the region. Second, we determine a threshold level of political risk and institutional quality indicators beyond which capital openness promotes FDI inflows in the MENA region. More precisely, Results reveal that 35 percent of MENA countries which are Algeria, Egypt, Iran, Jordan, Lebanon, Libya, Morocco, Syria, Saudi Arabia, Turkey and Yemen lie below the lower threshold of political risk index and have a negative financial openness coefficient. This finding is consistent with (Noy and Vu, 2007) who assert that “Liberalized capital account is only efficient in generating more inflows in an environment of low political risk”. Furthermore, results indicate that some institutional aspects matter more than others. Among institutional factors, law and order, democratic accountability, religious tension and investment profile play an important role in promoting FDI. Last, results show that foreign investors value the quality of institutions more than the level of corruption or bureaucracy quality in the location selection. Our results have some policy implications for the institutional reform approach to be adopted. They suggest that financial openness and higher institutional qualities coupled together can enhance FDI inflows that are considered to be one of the important sources of economic development. The MENA countries must improve institutional quality, especially by developing strong property rights protections and enhancing democratic institutions.
APPENDIX
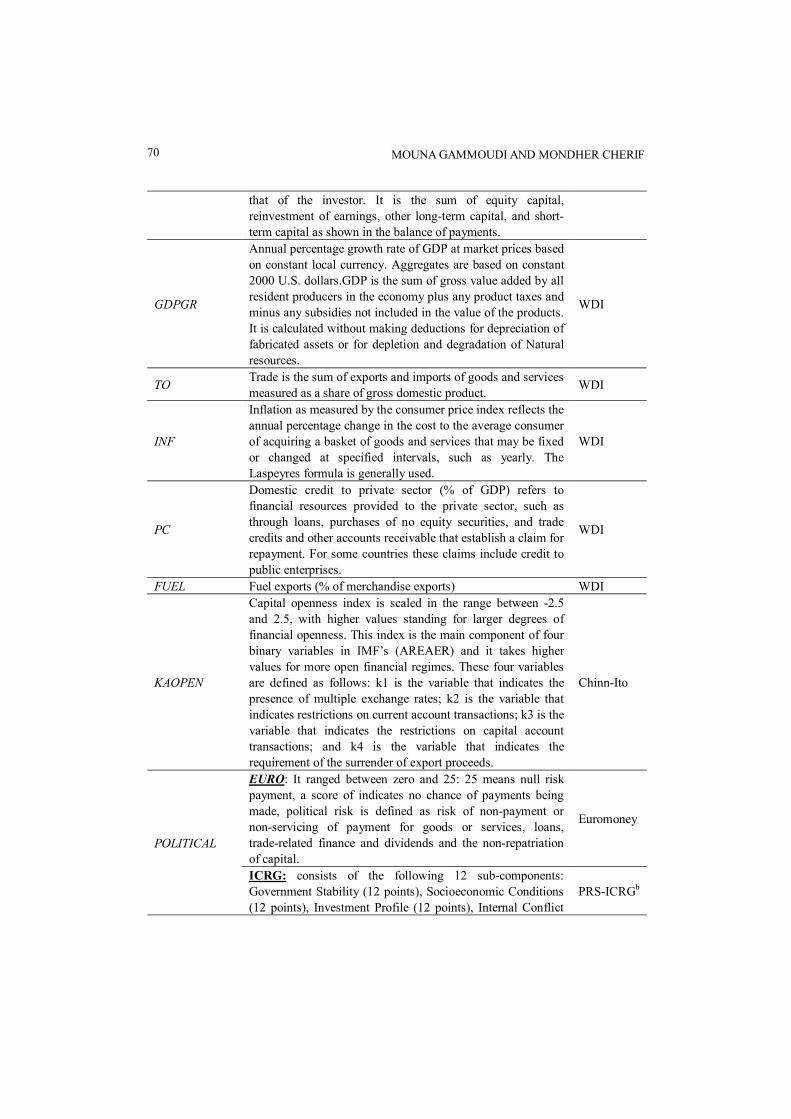
Table A1. Data Definitions and Sources Label Description Data sources
FDI
Foreign direct investment, net inflows (% of GDP): Foreign direct investment are the net inflows of investment to acquire a lasting management interest (10 percent or more of voting stock) in an enterprise operating in an economy other than
WDIa
MOUNA GAMMOUDI AND MONDHER CHERIF 70
that of the investor. It is the sum of equity capital, reinvestment of earnings, other long-term capital, and short- term capital as shown in the balance of payments.
GDPGR
Annual percentage growth rate of GDP at market prices based on constant local currency. Aggregates are based on constant 2000 U.S. dollars.GDP is the sum of gross value added by all resident producers in the economy plus any product taxes and minus any subsidies not included in the value of the products. It is calculated without making deductions for depreciation of fabricated assets or for depletion and degradation of Natural resources.
WDI
TO Trade is the sum of exports and imports of goods and services measured as a share of gross domestic product.
WDI
INF
Inflation as measured by the consumer price index reflects the annual percentage change in the cost to the average consumer of acquiring a basket of goods and services that may be fixed or changed at specified intervals, such as yearly. The Laspeyres formula is generally used.
WDI
PC
Domestic credit to private sector (% of GDP) refers to financial resources provided to the private sector, such as through loans, purchases of no equity securities, and trade credits and other accounts receivable that establish a claim for repayment. For some countries these claims include credit to public enterprises.
WDI
FUEL Fuel exports (% of merchandise exports) WDI
KAOPEN
Capital openness index is scaled in the range between -2.5 and 2.5, with higher values standing for larger degrees of financial openness. This index is the main component of four binary variables in IMF’s (AREAER) and it takes higher values for more open financial regimes. These four variables are defined as follows: k1 is the variable that indicates the presence of multiple exchange rates; k2 is the variable that indicates restrictions on current account transactions; k3 is the variable that indicates the restrictions on capital account transactions; and k4 is the variable that indicates the requirement of the surrender of export proceeds.
Chinn-Ito
POLITICAL
EURO: It ranged between zero and 25: 25 means null risk payment, a score of indicates no chance of payments being made, political risk is defined as risk of non-payment or non-servicing of payment for goods or services, loans, trade-related finance and dividends and the non-repatriation of capital.
Euromoney
ICRG: consists of the following 12 sub-components: Government Stability (12 points), Socioeconomic Conditions (12 points), Investment Profile (12 points), Internal Conflict
PRS-ICRGb

CAPITAL ACCOUNT OPENNESS, POLITICAL INSTITUTIONS AND FDI 71
(12 points), External Conflict (12 points), Corruption (6 points), Military in Politics (6 points), Religious Tensions (6 points), Law and Order (6 points), Ethnic Tensions (6 points), Democratic Accountability (6 points), Bureaucracy Quality (4 points). The resulting index ranges between zero and 100 and a larger value means lower political risk.
Government Stability
Measures the government stability to carry out its policies and to stay in office.
PRS-ICRG
Socioeconomic conditions
Captures socioeconomic pressures at work in society that might restrain government action or elevate social dissatisfaction and thus destabilize the political regime.
PRS-ICRG
Investment Profile
Assess the investment profile, that is, factors related to the risk of investment that are not covered by other (financial and economic) risk components, such as contract viability (expropriation), profits repatriation or payment delays.
PRS-ICRG
Internal Conflict
Stands for internal conflict, measuring political violence within the country and its actual or potential impact on governance by focusing on, for instance, civil war, terrorism, political violence or civil disorder.
PRS-ICRG
External Conflict
Weight external conflict, namely the risk to the incumbent government from foreign action, ranging from non-violent external pressure, such as diplomatic pressure, withholding aid or trade sanctions, to violent external pressures, ranging from cross-border conflicts to all-out war.
PRS-ICRG
Military in politics
Represents the influence of the military in politics, which could signal that the government is unable to function effectively, therefore, the country might have unfavorable environment for business.
PRS-ICRG
Religious Tension
Measures religious tensions, stemming from the domination of society and/or governance by a single religious group seeking, for instance, to replace civil by religious law or to exclude other religious from the political and social press.
PRS-ICRG
Law and Order Quantifies law and order, that is, the strength and impartiality of the legal system.
PRS-ICRG
Ethnic Tensions
Assesses the degree of tensions among ethnic groups attributable to racial, nationality or languages divisions.
PRS-ICRG
Democratic accountability
Relates the democratic accountability of the government, that is, the responsiveness of the government to its citizens, but also to fundamental civil liberties and political rights.
PRS-ICRG
Bureaucracy Quality
Stands for the institutional strength and quality of the bureaucracy, which might act as a shock absorber tending to reduce policy revisions if governments change.
PRS-ICRG
Corruption It evaluates the degree of corruption within the political system.
PRS-ICRG
Rule of law Captures perceptions of the extent to which agents have WGIc

MOUNA GAMMOUDI AND MONDHER CHERIF 72
confidence in and abide by the rules of society, and in particular the quality of contract enforcement, property rights, the police, and the courts, as well as the likelihood of crime and violence.
Voice and accountability
Captures perceptions of the extent to which a country’s citizens are able to participate in selecting their government, as well as freedom of expression, freedom of association, and a free media.
WGI
Political stability and absence of violence
Measures perceptions of the likelihood that the government will be destabilized or overthrown by unconstitutional or violent means, including politically-motivated violence and terrorism.
WGI
Government effectiveness
Captures perceptions of the quality of public services, the quality of the civil service and the degree of its independence from political pressures, the quality of policy formulation and implementation, and the credibility of the government’s commitment to such policies.
WGI
Regulatory quality
Captures perceptions of the ability of the government to formulate and implement sound policies and regulations that permit and promote private sector development.
WGI
Control of corruption
Captures perceptions of the extent to which public power is exercised for private gain, including both petty and grand forms of corruption, as well as “capture” of the state by elites
and private interests.
WGI
Notes: a World Development Indicator. b The PRS Group’s International Country Risk Guides. c Worldwide
Governance Indicators
Table A2. Summary Statistics
Variable Obs Mean Std.Dev Min Max
FDI 393 2.14 3.83 -5.28 33.56
KAOPEN 397 0.565 1.753 -1.831 2.50
GDPGR 381 4.460 5.794 -42.45 38.20
TO 365 80.896 37.066 5.39 210.16
INF 360 12.821 32.389 -9.9 99.8
FUEL 337 50.370 40.00 0.0005 98.64
PC 403 37.66 22.404 3.01 93.545
Political risk (ICRG)a 420 0.61 0.119 0.1 0.79
Political risk (EURO)b 249 0.50 0.151 0.144 0.859
Notes: a,b The political risk indexes are given from ICRG and Euromoney. The data are normalized to lie
between zero and one, such that a higher number implies more political stability.

CAPITAL ACCOUNT OPENNESS, POLITICAL INSTITUTIONS AND FDI 73
Sources: Authors’ calculations based on data from World Development Indicator and the PRS Group’s
International Country Risk Guides by using STATA.
Figure 1. Threshold Level of Political Risk in MENA Region
Sources: Authors’ calculations based on data from World Development Indicator and the PRS Group’s
International Country Risk Guides by using STATA.
Figure 2. Total Effect of a One-unit Increase in Capital Account Openness (KAOPEN) on the Ratio of FDI to GDP

MOUNA GAMMOUDI AND MONDHER CHERIF 74
Sources: Authors’ calculations based on data from World Development Indicator and the PRS Group’s
International Country Risk Guides by using STATA.
Figure A1. Threshold Level of Corruption in MENA Region
REFERENCES
Aizenman, J., and I. Noy (2004), “Endogenous Financial and Trade Openness,” Review of Development Economics, 13(2), 175-189.
Alfaro, L., S. Kalemli-Ozcan, and V. Volosovych (2008), “Why Doesn’t Capital Flow from Rich to Poor Countries? An Empirical Investigation,” The Review of Economics and Statistics, 90, 347-368.
Arellano, M., and S. Bond (1991), “Some Tests of Specification for Panel Data: Monte Carlo Evidence and an Application to Employment Equations,” The Review of Economic Studies, 58(2), 277-297.
Arellano, M., and O. Bover (1995), “Another Look at the Instrumental Variable Estimation of Error-Components Models,” Journal of Econometrics, 68(1), 29-51.
Asiedu, E., and D. Lien (2004), “Capital Controls and Foreign Direct Investment,” World Development, 32(3), 479-490.
_____ (2011), “Democracy, Foreign Direct Investment and Natural Resources,” Journal of International Economics, 84(1), 99-111.
Baltagi, B. (2008), Econometric Analysis of Panel Data, John Wiley & Sons. Baltagi, B.H., P.O. Demetriades, and S.H. Law (2009), “Financial Development and
Openness: Evidence from Panel Data,” Journal of Development Economics, 89(2),

CAPITAL ACCOUNT OPENNESS, POLITICAL INSTITUTIONS AND FDI 75
285-296. Bhagwati, J.N. (1978), Anatomy and Consequences of Exchange Control Regimes,
National Bureau of Economic Research, NBER Books. Blundell, R., and S. Bond (1998), “Initial Conditions and Moment Restrictions in
Dynamic Panel Data Models,” Journal of Econometrics, 87(1), 115-143. Brafu-Insaidoo, W.G., and N. Biekpe (2014), “Determinants of Foreign Capital Flows:
The Experience of Selected Sub-Saharan African Countries,” Journal of Applied Economics, 17, 63-88.
Butkiewicz, J.L., and H. Yanikkaya (2008), “Capital Account Openness, International Trade, and Economic Growth: A Cross-Country Empirical Investigation,” Emerging Markets Finance and Trade, 44(2), 15-38.
Campion, M.K., and R.M. Neumann (2004), “Compositional Effects of Capital Controls: Evidence from Latin America,” The North American Journal of Economics and Finance, 15, 161-178.
Caprio, G., J.A. Hanson, and P. Honohan (2001), “Introduction and Overview: The Case for Liberalization and Some Drawbacks,” in Financial Liberalization, Cambridge University Press.
Chan, K.K., and E.R. Gemayel (2004), Risk Instability and the Pattern of Foreign Direct Investment in the Middle East and North Africa Region, International Monetary Fund.
Cherif, M., S. Ben Naceur, M. Goaied, and B. Kamer (2011), Does Capital Account Liberalization Spur Economic and Financial Performance? New Investigation for MENA Countries, FEM33-06. FEMISE.
Chinn, M.D., and H. Ito (2008), “A New Measure of Financial Openness,” Journal of Comparative Policy Analysis: Research and Practice, 10(3), 309-322.
Daniele, V., and U. Marani (2006), “Do Institutions Matter for FDI? A Comparative Analysis for the MENA Countries,” Munich Personal RePEc Archive.
Elo, K.Z. (2007), “The Effect of Capital Controls on Foreign Direct Investment Decisions under Country Risk with Intangible Assets,” IMF Working Paper, 07/79.
Fratzscher, M., and M. Bussiere (2008), “Financial Openness and Growth: Short-run Gain, Long-run Pain?” Review of International Economics, 16(1), 69-95.
Gastanaga, V.M., J.B. Nugent, and B. Pashamova (1998), “Host Country Reforms and FDI Inflows: How Much Difference Do They Make?” World Development, 26(7), 1299-1314.
Kaminsky, G., and S. Schmukler (2003), “Short-Run Pain, Long-Run Gain: The Effects of Financial Liberalization,” NBER Working Paper, 9787, National Bureau of Economic Research.
Kaufmann, D., A. Kraay, and M. Mastruzzi (2010), “The Worldwide Governance Indicators: Methodology and Analytical Issues,” Policy Research Working Paper, 5430, Washington, D.C.: The World Bank.
Kose, A., E. Prasad, K. Rogoff, and S.-J. Wei (2003), “The Effects of Financial Globalization on Developing Countries: Some Empirical Evidence,” IMF Occasional

MOUNA GAMMOUDI AND MONDHER CHERIF 76
Paper, 220. Kyaw, S. (2006), “Foreign Direct Investment to Developing Countries in the Globalised
World,” Working Papers, eSocial Sciences. Noy, I., and T.B. Vu (2007), “Capital Account Liberalization and Foreign Direct
Investment,” The North American Journal of Economics and Finance, 18(2), 175-194.
Okada, K. (2013), “The Interaction Effects of Financial Openness and Institutions on International Capital Flows,” Journal of Macroeconomics, 35(0), 131-143.
Onyeiwu, S. (2003), “Analysis of FDI Flows to Developing Countries: Is the MENA Region Different?” in ERF 10th Annual Conference, December, Marrakech, Morocco.
Rachdi, H., and H. Saidi (2011), “The Impact of Foreign Direct Investment and Portfolio Investment on Economic Growth in Developing and Developed Economies,” Interdisciplinary Journal of Research in Business, 1(6), 10-17.
Wasseem, M. (2012), “The Institutional Reforms Debate and FDI Flows to the MENA Region: The ‘Best’ Ensemble,” World Development, 40(9), 1798-1809.
Mailing Address: Mouna Gammoudi, Labratoire REGARDS, Université de Reims Champagne Ardenne, France. E-mail: [email protected].
Received January 23, 2015, Revised October 21, 2015, Accepted March 10, 2016.