open borehole well-test methods for co2 storage site
TRANSCRIPT

1
Open Borehole Well-Test Methods for CO2 Storage Site Characterization Advanced Techniques for Site Characterisation: ENOS WP6 Workshop
23 April 2018
Mark Kelley (Battelle)
In conjunction with: C02GeoNet Open Forum 201824-25 April 2018San Servolo Island, Venice, Italy
Outline
Borehole Test Objectives
•Hydraulic Test Methods
•Composite Borehole (Reconnaissance)
•Discrete Interval Hydraulic Tests for low k and high k rocks
•Discrete Interval Geomechanic Tests - Mini-frac (HF), HTPF
•Equipment Considerations
Selected Open Borehole Tests
•AEP Mountaineer BA-02 Test Borehole (West Virginia)
•FutureGen Well (Illinois)
•Ohio Geol. Survey CO2 Well
•MRCSP CO2-EOR (Michigan)
Examples
2

Borehole Hydraulic and
GeomechanicalCharacterization
Objectives
• Identify candidate intervals for CO2 injection/storage
• Quantify hydraulic properties of composite borehole
• Quantify hydraulic and geomechanicalproperties of discrete intervals (reservoir, caprock) for use in dynamic modeling
• Static formation fluid pressure (hydraulic head)
• Transmissivity, Kh
• Storativity, Ssh
• Skin, sk
• Min and Max Horizontal stress, Shmin, SHmax
Composite borehole reconnaissance
Discrete Intervaltesting

Timing of Borehole Hydraulic-Geomechanical Testing
• Usually done after borehole is drilled to TD (“drill-then test”) – but can also be done during drilling (“drill-and-test”)
• Consecutive Drill-then-test Pros/Cons
• (+) Less costly – test after drilling rig is moved off hole, often with support of service (workover) rig
• (-) possibility of pressure perturbations due to drilling
• Drill-and-test Pros/Cons
• (+) potentially shorter test times and better quality of the characterization data
• (-) more costly - standby drilling rig and test equipment costs that are incurred when either activity is not taking place.
4

Composite Borehole Hydraulic Reconnaissance Methods
• Identify hydraulically conductive (inflow/outflow) intervals
• Quantify volume of inflow/outflow – indicator of interval kh
• Quantify hydraulic properties (kh) of composite borehole
Uses
• Mechanical flow meter (spinner) survey
• Hydrophysical (Fluid EC/temp) Logging
Example Methods
5

Open Borehole (mechanical) Flowmeter Survey
• While pumping, flowmeter (run on wireline) is lowered/raised across the open borehole sections
• Tool string includes flowmeter, pressure, temperature probes and caliper
• Constant logging speed while logging
• Constant injection/withdrawal rate
• Repeat test for different injection/withdrawal rates
• Run baseline log before injection/withdrawal
• Record pressure recovery after injection/withdrawal
• Log temperature profile after pressure recovers
6

Open Borehole (mechanical) Flowmeter Survey (cont’d)
• Provides vertical profile of volumetric inflow/outflow from the borehole
• Pressure recovery data can be analyzed for kh of composite borehole
• Relative kh of Individual flow intervals can be determined from observed change in logging speed across interval
• Repeat temperature log(s) provide qualitative information about location of hydraulically conductive intervals to corroborate flowmeter results.
7
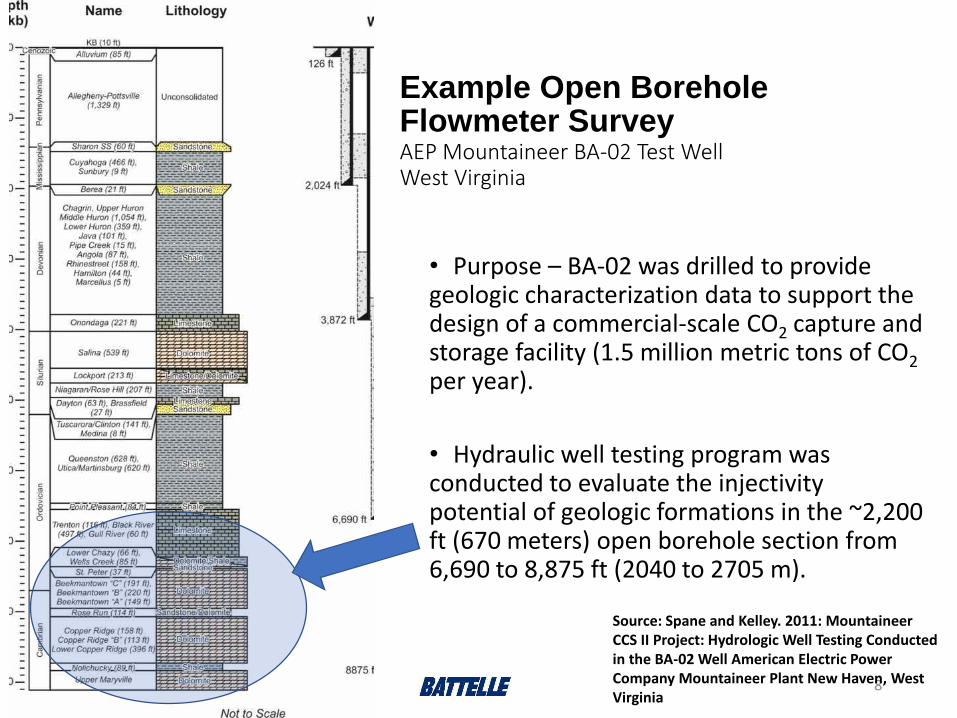
Example Open Borehole Flowmeter Survey AEP Mountaineer BA-02 Test WellWest Virginia
8
• Purpose – BA-02 was drilled to provide geologic characterization data to support the design of a commercial-scale CO2 capture and storage facility (1.5 million metric tons of CO2
per year).
• Hydraulic well testing program was conducted to evaluate the injectivity potential of geologic formations in the ~2,200 ft (670 meters) open borehole section from 6,690 to 8,875 ft (2040 to 2705 m).
Source: Spane and Kelley. 2011: Mountaineer CCS II Project: Hydrologic Well Testing Conducted in the BA-02 Well American Electric Power Company Mountaineer Plant New Haven, West Virginia

Example Open Borehole Flowmeter Survey (cont’d)AEP Mountaineer BA-02 Test WellFlowmeter Data for 2, 4 and 6 BPM Surveys and Temp Logs
9
6400
6900
7400
7900
8400
8900
0 2 4 6
De
pth
(ft
bk
)
Downward Flow Rate Past Depth (BPM)
BA-02 2, 4 and 6 BPM FlowMeter Surveys (Up Direction) ResultsApril 5-6 2011
6 BPM
4 BPM
2 BPM
Beekmantown C
Beekmantown B
Beekmantown A
Copper Ridge
Copper Ridge B Zone
Copper Ridge
Rose Run
Nolichucky
Wells Creek
Bottom of Casing
St. Peter
Black River
Gull RiverLower Chazy
6400
6900
7400
7900
8400
8900
113 118 123 128 133 138 143 148
De
pth
(B
K)
Temp (F)
BA-02 Well Final Temp SurveyApril 7, 2011
pre injection temp
17 hrs after injection temp
Beekmantown C
Beekmantown B
Beekmantown A
Copper Ridge
Copper Ridge B Zone
Copper Ridge
Rose Run
Nolichucky
Wells CreekSt. Peter
Bottom of Casing
Lower ChazyGull River
Black River

Hydraulic Reconnaissance Survey of Cambrian-
Ordovician Strata in Coshocton and Tuscarawas
Counties Ohio
10
35 miles (56 km)
Typical brine injection interval with open borehole completion
Transect showing location of 5 brine injection wells
Flowmeter survey
conducted in 6 wells

Three hydraulically conductive Intervals could be correlated across the region.
11
35 miles (56 km)
Flow zone 1
Flow zone 2
Flow zone 3

Different test types used for hydraulic testing depending on transmissivity
12
Source: Solexperts (Ursula Rӧsli)
Discrete Interval (Packer) Hydraulic Tests
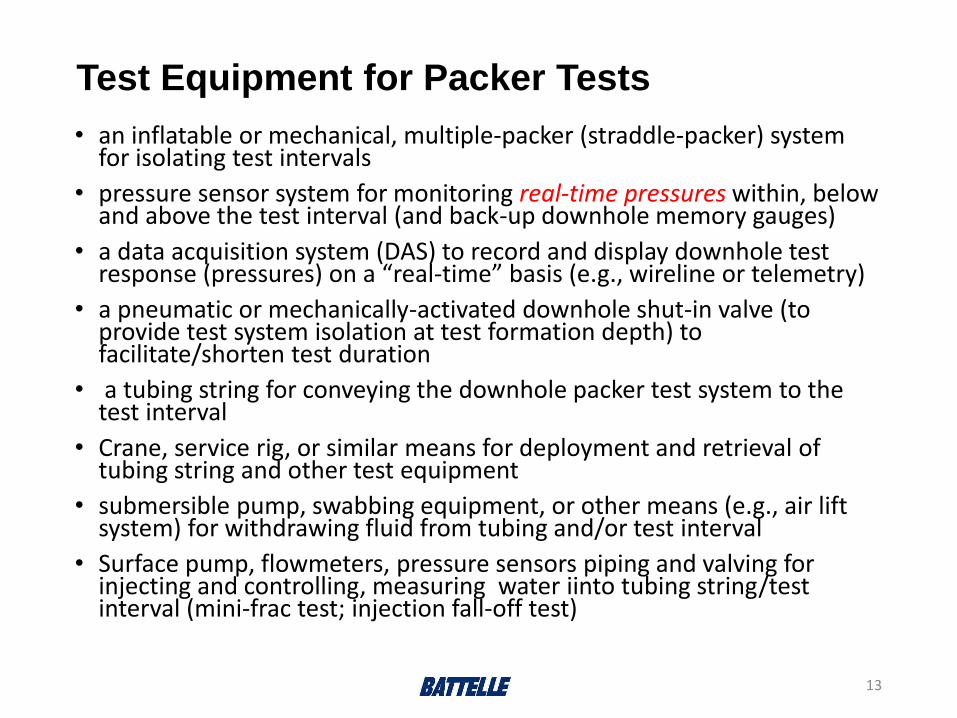
Test Equipment for Packer Tests
• an inflatable or mechanical, multiple-packer (straddle-packer) system for isolating test intervals
• pressure sensor system for monitoring real-time pressures within, below and above the test interval (and back-up downhole memory gauges)
• a data acquisition system (DAS) to record and display downhole test response (pressures) on a “real-time” basis (e.g., wireline or telemetry)
• a pneumatic or mechanically-activated downhole shut-in valve (to provide test system isolation at test formation depth) to facilitate/shorten test duration
• a tubing string for conveying the downhole packer test system to the test interval
• Crane, service rig, or similar means for deployment and retrieval of tubing string and other test equipment
• submersible pump, swabbing equipment, or other means (e.g., air lift system) for withdrawing fluid from tubing and/or test interval
• Surface pump, flowmeters, pressure sensors piping and valving for injecting and controlling, measuring water iinto tubing string/test interval (mini-frac test; injection fall-off test)
13

Examples of Test Equipment
14
Water tanks
Swabbing Tool
Straddle Packer
Service Rig andTubing String
Misc connections
PressurizedInjection fitting
Generator
Pressure SensorsReal-Time Analysis
Packer Tool/Shut-in Valve
Injection Truck
High pressure injection pump trailer

Examples of Test Equipment (cont’d)
15
Straddle Packer
Service Rig andTubing String
wireline deployable straddle packer test tool
• Drawdown- build-up tests• Vertical interference tests• Mini-frac tests• Water sampling• Fixed packer spacing• Pump-rate limitations
Injection TruckBaker RCX Tool
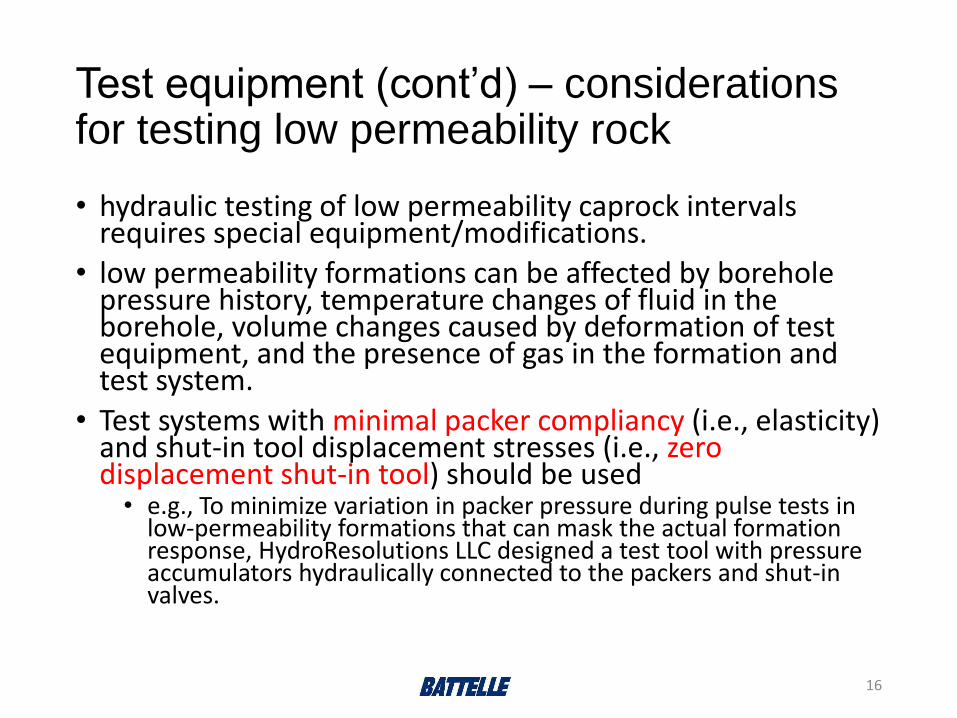
Test equipment (cont’d) – considerations for testing low permeability rock
• hydraulic testing of low permeability caprock intervals requires special equipment/modifications.
• low permeability formations can be affected by borehole pressure history, temperature changes of fluid in the borehole, volume changes caused by deformation of test equipment, and the presence of gas in the formation and test system.
• Test systems with minimal packer compliancy (i.e., elasticity) and shut-in tool displacement stresses (i.e., zero displacement shut-in tool) should be used
• e.g., To minimize variation in packer pressure during pulse tests in low-permeability formations that can mask the actual formation response, HydroResolutions LLC designed a test tool with pressure accumulators hydraulically connected to the packers and shut-in valves.
16

Example Straddle Packer Test Tool (configured for pulse testing)
17
Source: Technical Report: Analysis of Straddle-Packer Tests in DGR Boreholes Revision 0 Doc ID: TR-08-32 (Geofirma Engineering)
- two inflatable packers, - a downhole shut-in valve, - a piston-pulse tool, - a slotted section, - a sediment trap, - sensor carriers, and - miscellaneous subs and
feedthroughs to connect the various pieces
The length of the test zone (packer spacing) can be varied
HydroResolutions Pulse-Test Tool

Test #1 – Slug Test and
Drill Stem Tests (DST)
• Induce instantaneous pressure increase/decrease in the test zone followed by recovery back toward static pressure conditions. The rate of pressure decay is used to infer the hydraulic properties of the test interval.
• Most commonly implemented by removing (e.g., swabbing) [slug withdrawal] test] or adding water to [slug injection test] the test tubing-string with shut-in valve closed, and then opening the valve.
• Slug test: the shut-in valve remains open during a slug test and fluid flowing into or out of the formation results in changing water levels within the tubing.
• DST test: (if recovery is slow), shut-in valve is closed after ~50% recovery; reduces wellbore accelerates recovery
• Radius of investigation = near wellbore
18
Slug injection test
Straddle packer
with shut-in valve
Bottom of cased
borehole
Tubing string

Slug-DST Tests – Analysis
• Analysis of the slug test recovery response provides an estimate of the test-interval transmissivity (kh), average hydraulic conductivity (K) and storativity (S)
• Butler (1997)
• Peres et al. (1989)
• Analysis of DST recovery data provide estimates of T, K, S, sK, and (if pre-test trend conditions accounted for) static formation pressure conditions.
• Earlougher (1977) – for DST recovery analysis.
• Correa and Ramey (1987)
• Karasaki (1990)
• Radius of investigation = near wellbore
• can be greatly expanded by utilizing an observation well to monitor the surrounding pressure interference
19
Test system forces > formation
Formation forces > test system
Transitional

Slug/DST Tests – Analysis
• Provides transmissivity (kh), average hydraulic conductivity (K) and storativity (S)
• Test has low sensitivity for S
• The slug-test responses are commonly analyzed with type-curve and deconvolution procedures discussed in Butler (1997) and Peres et al. (1989), respectively.
• Analysis of DST recovery data provide estimates of T, K, S, sK, and (if pre-test trend conditions accounted for) static formation pressure conditions.
• DST recovery analysis by standard straight-line semi-log procedures in Earlougher (1977)
20

21
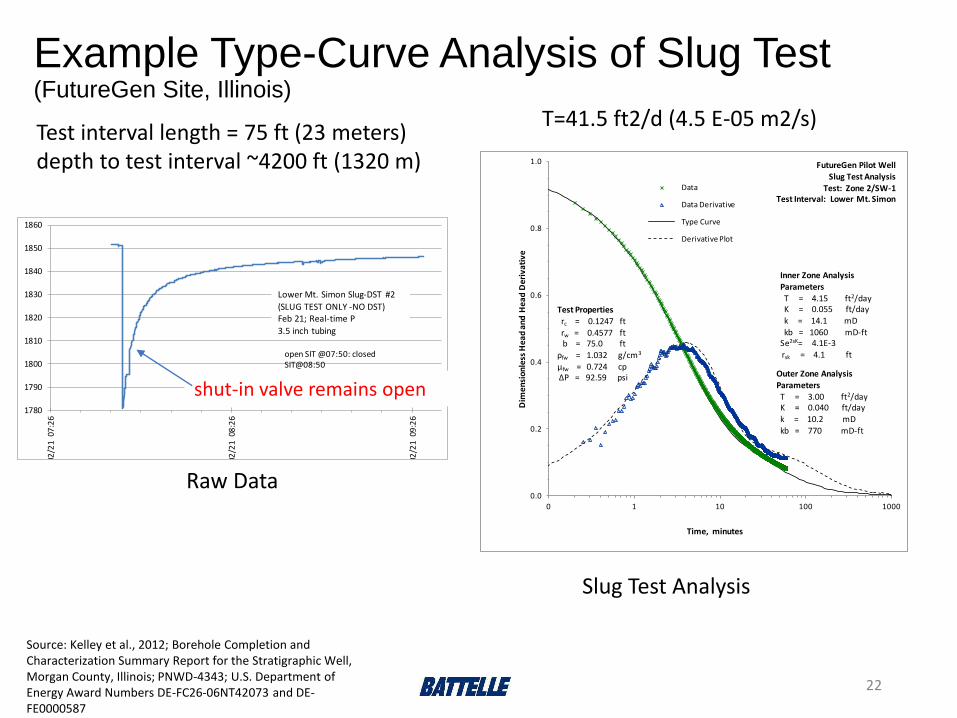
Example Type-Curve Analysis of Slug Test (FutureGen Site, Illinois)
22
Slug Test Analysis
0.0
0.2
0.4
0.6
0.8
1.0
0 1 10 100 1000
Dim
ensi
onle
ss H
ead
and
Hea
d D
eriv
ativ
eTime, minutes
Data
Data Derivative
Type Curve
Derivative Plot
FutureGen Pilot Well
Slug Test Analysis
Test: Zone 2/SW-1Test Interval: Lower Mt. Simon
Inner Zone Analysis
Parameters
T = 4.15 ft2/dayK = 0.055 ft/dayk = 14.1 mDkb = 1060 mD-ft
Se2sK= 4.1E-3
rsk = 4.1 ft
Test Propertiesrc = 0.1247 ftrw = 0.4577 ft b = 75.0 ft
ρfw = 1.032 g/cm3
μfw = 0.724 cpΔP = 92.59 psi Outer Zone Analysis
ParametersT = 3.00 ft2/dayK = 0.040 ft/day
k = 10.2 mDkb = 770 mD-ft
Source: Kelley et al., 2012; Borehole Completion and Characterization Summary Report for the Stratigraphic Well, Morgan County, Illinois; PNWD-4343; U.S. Department of Energy Award Numbers DE-FC26-06NT42073 and DE-FE0000587
1780
1790
1800
1810
1820
1830
1840
1850
1860
02/2
1 0
7:2
6
02/2
1 0
8:2
6
02/2
1 0
9:2
6
Lower Mt. Simon Slug-DST #2
(SLUG TEST ONLY -NO DST)Feb 21; Real-time P
3.5 inch tubing
open SIT @07:50: closed SIT@08:50
Raw Data
Test interval length = 75 ft (23 meters)depth to test interval ~4200 ft (1320 m)
shut-in valve remains open
T=41.5 ft2/d (4.5 E-05 m2/s)

Example Type-Curve and Straight-Line Analysis of DST (FutureGen Site, Illinois)
23
1700
1705
1710
1715
1720
1725
1730
1 10 100
Do
wn
ho
le P
ress
ure
, p
sia
Horner Time, (t + t')/t'
De-Trended Recovery
Analysis Regression Line
FutureGen Pilot WellDST Recovery Horner Semi-Log Analysis
Test: Zone 3A/DST-1Test Interval: Upper Mt. Simon
Analysis ParametersT = 37.2 ft2/dayK = 0.20 ft/dayk = 52.0 mD
kb = 9,620 mD-ft
S = 4.3E-4CD = 0.46
CDe2sK= 7.2sK = +1.38
Test Properties
rc = 0.258 ft
rw = 0.467 ftreqv = 9.3E-3 ft
b = 185 ftρw = 1.032 g/cm3
Qc* = 0.603 bpm
Δs = -10.70 psi/log cycle
0.1
1.0
10.0
100.0
1000.0
0.1 1.0 10.0 100.0
Rec
ove
ry a
nd
Rec
ove
ry D
eriv
ativ
e, Δ
P,
psi
Agarwal Equivalent Time, min
De-Trended Recovery
Detrended Recovery Derivative
Type Curve
Derivative Plot
FutureGen Pilot WellDST Recovery Type-Curve Analysis
Test: Zone 3A/DST 1Test Interval: Upper Mt. Simon
Analysis ParametersT = 37.2 ft2/dayK = 0.20 ft/dayk = 52.0 mD
kb = 9,620 mD-ftS = 4.3E-4
CD = 0.46
CDe2sK= 7.3
sK = +1.38
Test Properties
rc = 0.258 ft
rw = 0.467 ftreqv = 9.3E-3 ft
b = 185 ftρw = 1.032 g/cm3
Qc* = 0.512 bpmtcp* = 22.71 min
Type-Curve Analysis Upper Mount Simon
Straight-Line (Horner) Analysis Upper Mount Simon
1620
1630
1640
1650
1660
1670
1680
1690
1700
1710
1720
02/2
3 0
8:3
8
02/2
3 0
8:5
2
02/2
3 0
9:0
7
02/2
3 0
9:2
1
02/2
3 0
9:3
6
02/2
3 0
9:5
0
02/2
3 1
0:0
4
02/2
3 1
0:1
9
02/2
3 1
0:3
3
02/2
3 1
0:4
8
Upper Mt. Simon Slug-DST#1
Feb. 23; Real-time data
open SIT@8:54; closed SIT@9:14
Raw Data
Close shut-in valve
Test interval length = 185 ft (56 meters)depth to test interval ~4200 ft (1320 m)
Source: Kelley et al., 2012; Borehole Completion and Characterization Summary Report for the Stratigraphic Well, Morgan County, Illinois; PNWD-4343; U.S. Department of Energy Award Numbers DE-FC26-06NT42073 and DE-FE0000587
T=37.2 ft2/d (4.0e-05 m2/s)
Test #2 – Pulse Test
• Applicable to low permeability rocks (i.e., 10-9 m/s)
• Similar to slug test except that the test zone is shut-in (by closing the shut-in valve) during entire recovery period.
• Withdrawal (PW) or Injection (PI) mode
• volumes of fluid are smaller during pulse tests (i.e., per unit pressure change) in comparison to slug tests, therefore, the radius-of-investigation is accordingly smaller.
• pulse tests more susceptible to near well formation heterogeneities and skin effects
24

Pulse Test Analysis
• same analytical equations used for analysis of slug tests (e.g., Cooper et al., 1967)
• The equations, however, must be modified to account for the closed-system wellbore storage test conditions
• Kh, k, S
25
0.00
0.10
0.20
0.30
0.40
0.50
0.60
0.70
0.80
0.90
1.00
10 100 1000 10000 100000 1000000 10000000
Time, min
Dim
ensio
nle
ss H
ead,
H
Test Properties
Kh = 3.3E-11 ft/s
S = 1E-5
KD = 10.0
rw = 0.333 ft
b = 65 ft
Predicted Caprock
Test Comparison
Slug Test
Pulse Test
Comparison for Pulse (closed) and Slug Test (open) Responses (adapted from Reidel et al., 2002)
Recovery time
17 hours 19 years

Test #3 - Constant-Rate Pumping Test
• Water is withdrawn from (or injected into) a borehole at a uniform rate for an extended period of time (e.g., 8 hours to 48 hours).
• Pressure is monitored during the active pumping phase and the recovery phase following pumping.
• Radius of investigation potentially very large if pumping period is extended
• Observation wells, if available, can be monitored to extend radius of investigation
26
Submersible pump
200
250
300
350
400
450
500
550
600
650
700
02
/07
12
:00
02
/07
16
:00
02
/07
20
:00
02
/08
00
:00
02
/08
04
:00
02
/08
08
:00
02
/08
12
:00
02
/08
16
:00
02
/08
20
:00
02
/09
00
:00
02
/09
04
:00
02
/09
08
:00
02
/09
12
:00
Pre
ssu
re A
bo
ve P
um
p I
nta
ke (
psi
a)
Pump Intake Pressure (psia)
Pumped from 12:52 to 17:17 (4.4 hrs) on 2-7-12; recovered overnight. Estimated volume pumped 34,680 gals; average pumping rate = 131 gpm.
Pumped from 8:06 to 16:45 ( 8.65 hrs) on 2-8-12;
recovered overnight. Estimated volume pumped 57,600 = gals; average pumping rate = 110 gpm.
Example constant rate pumping test

Constant-rate Pumping Test – Analysis
• Standard analytical methods include type-curve matching (observation wells) and straight-line methods (pumped well)
• Type-curve-matching methods include: Theis(1935), Hantush (1964), and Neuman (1975)
• Straight-line methods: Cooper and Jacob (1946)(for buildup analysis) or Horner (1951) (for recovery analysis).
• provides kh, skin, radius of investigation, presence of boundaries
27

Example Constant-Rate Pumping TestAEP Mountaineer, West Va.Test Interval 8,320 to 8,875 ft (2536 to 2706 meters)
28
3400
3600
3800
4000
4200
4400
4600
4800
5000
05
/02
12
:00
05
/02
15
:00
05
/02
18
:00
05
/02
21
:00
05
/03
00
:00
05
/03
03
:00
05
/03
06
:00
05
/03
09
:00
05
/03
12
:00
05
/03
15
:00
05
/03
18
:00
05
/03
21
:00
05
/04
00
:00
05
/04
03
:00
05
/04
06
:00
05
/04
09
:00
05
/04
12
:00
05
/04
15
:00
05
/04
18
:00
Pre
ssu
re (p
si)
constant rate injection test
withdrawal slugtest #2
1 -minute Injection Slug test
withdrawal slugtest #1
Packer inflation followed by initial injection slug test
(not analyzable)
releasepacker
@17:30Tested SIV
BA-02Lower CopperRidge (>8320 ft)
5-2-11 to 5-4-11
Raw Data
8-hour injection
6400
6900
7400
7900
8400
8900
0 2 4 6
De
pth
(ft
bk
)
Downward Flow Rate Past Depth (BPM)
BA-02 2, 4 and 6 BPM FlowMeter Surveys (Up Direction) ResultsApril 5-6 2011
6 BPM
4 BPM
2 BPM
Beekmantown C
Beekmantown B
Beekmantown A
Copper Ridge
Copper Ridge B Zone
Copper Ridge
Rose Run
Nolichucky
Wells Creek
Bottom of Casing
St. Peter
Black River
Gull RiverLower Chazy
Test Interval

Example Constant-Rate Pumping TestAEP Mountaineer, West Va.Test Interval 8320 to 8875 ft (2536 to 2706 meters)
29
Type Curve and Derivative Plot Analysis of the Recovery Phase
250
300
350
400
450
500
550
1 10
Do
wn
ho
le P
ress
ure
Re
cove
ry,
ΔP
, p
si
Agarwal Equivalent Time, minutes
Recovery Data
Linear Regression
AEP-BA-02Lower Copper Ridge/Zone 2Depth: 8,320 - 8,875 ftInjection Recovery Fall-Off Test
Inner Zone: Semi-Log Straight-Line Analysis
ΔP = 277.2 psi/log
Inner-Zone Analysis ParametersT = 5.78 ft2/dayK = 0.19 ft/dayk = 71.6 mDS = 8.9E-5 (calculated)
Se2sk = 7.56e-03sK = -2.2 ρfw = 1.19 g/cm3
μfw = 1.212 cprc = 0.102 ftrw = 0.354 ftb = 30.0 ftQavg = 2.1 bpm
Straight-Line Analysis of the Recovery Phase
T inner zone =5.78 ft2/d (6.2 E-06 m2/s) T outer zone = 254 ft2/d (2.7 E-04 m2/s)

Test #4 – Constant-Pressure Injection (Fall-Off) Test
• Applicable to low permeability rocks (i.e., 10-9 m/s)
• Maintain constant pressure; record flow rate
• At the end of injection, shut-in and record pressure recovery (pressure fall-off)
• radius-of-investigation is greater than pulse tests, but still localized
• E.G., 8 ft for tests of 5 hours or less, conducted within dense caprock with hydraulic conductivity of 10-
11 m/s.
30
Source: DEEP BOREHOLE FIELD TEST:
DESIGN REPORT
Forward simulation
Author: Ursula Rösli
Report V2A-2469, 1 April 2016
Solexperts AG
CH-8617 Mönchaltorf (Switzerland)

Example Constant-Pressure Injection TestOhio Geol. Survey CO2 #1 WellTuscarawas County, OhioTest Interval Rose Run Formation7,377 to 7,396 ft (2248 to 2255 meters)
31
Raw Data
Type-Curve Analysis
Straight-Line Analysis
T=0.019 ft2/d (2.2 E-07 m2/s)
Test-History Match
• When a series of tests are conducted in a sequence, the entire test sequence can be simulated
• Decreases uncertainty compared to individual tests
• Software (models) for simulating test sequences• KGS model (Liu and Butler 1995) for slug testing
• WTAQ model (Moench 1997) for constant-rate injection/pumping tests
• nSIGHTS Software (all types of tests)
32

Hydraulic Test sequencing – low perm rocks
• PSR phase – pressure recover towards static conditions.
• Pulse withdrawal test –gives a rough approximation of the borehole near formation properties.
• HI test and the related pressure recovery –provide more quantitative information on the formation properties (with/without skin) and heterogeneities, and possible presence of hydrologic boundaries. 33
Source:DEEP BOREHOLE FIELD TEST:DESIGN REPORTForward simulationAuthor: Ursula RösliS o l e x p e r t s A G03 May 2016
PSR (pressure shut-in recovery) ->Pulse (withdrawal) ->HI (constant head injection)->HIS (recovery)

Hydraulic Test sequencing – low perm rocks
Examples:
• Shut In -> PW->PI
• Shut In -> DST->PI
• Shut In -> PW1 ->PW2->PW3
34
source: Analysis of Straddle-Packer Tests in DGR Boreholes Document ID: TR-08-32 Authors: Randall Roberts and David Chace, HydroResolutions LLC, Richard Beauheim, and John Avis, Geofirma Engineering Ltd. ; Revision: 0; Date: April 12, 2011

Hydraulic Test sequencing – higher perm rocks
• PSR phase - pressure recover to static conditions after system installation and packer inflation phase.
• The slug withdrawal test (SW) -rough approximation of the formation properties and the feasibility of a pumping test.
• The shut-in phase after the slug test (SWS) – helps to achieve static formation pressure in rather short time before the start of the following test sequence.
• Pumping test (RW) - and the related pressure recovery should provide more quantitative information on the formation properties (with skin) and heterogeneities, and possible presence of hydrologic boundaries.
35
Source:DEEP BOREHOLE FIELD TEST:DESIGN REPORTForward simulationAuthor: Ursula RösliS o l e x p e r t s A G03 May 2016
PSR (pressure shut-in recovery) ->Slug (withdrawal) ->recovery->RW (constant rate withdrawal) -> RWS (recovery)

Example Test History Match of a sequence of hydraulic tests using nSIGHTS SoftwareFutureGen Site
36Analysis by R. Roberts, HydroResolutions Data from FutureGen site: F.
Spane; M. Kelley
T=5.5 E-05 m2/s) from all tests
T from slug withdrawal test shown previously was 4.5 E-05 m2/s

Transmissivity Profile PlotBA-02 Test Well: AEP Mountaineer, West Va
37
• Summarizes results
of Packer Tests
conducted in a
borehole
• useful for illustrating
intervals most
suitable for CO2 injection
Geomechanical (Stress)Tests
• Hydraulic Fracture (HF) tests (aka mini-frac)
• these tests create new fractures
• HF tests provide estimates for σH direction and for σhmagnitude
• Hydraulic Tests on Preexisting Fractures (HTPF)(Cornet, 1993; Haimson and Cornet, 2003).
• measure the pressure required to reopen preexisting fractures (i.e. the normal stress acting on the fracture)
• provide a means for determining the magnitude of σH, which cannot be precisely constrained using HF tests alone..
38

Example Geomechanical(Stress)Tests(FutureGen Site, Illinois)
39
FMI Log Image of Fracture Created in HF Test Zone GM-13; Fracture is Vertical and Oriented NE-SW.
4130 ft kb (4116 ft bgs)
4140 ft kb (4126 ft bgs)
❑ maximum horizontal principal stress, H, is oriented N 51±4°E
❑ magnitude of h in the Mount Simon from 2 HF tests:
❑ h = 3,240 ± 330 psi at 4,156 ft ❑ h = 2,800 ± 100 psi at 4,236 ft
❑ Maintaining injection pressures lower than 2,800 psi at a depth of 4,236 ft should avoid hydraulic fracturing within either the Mount Simon reservoir or the overlying Eau Claire shale caprock.
❑ The magnitude of H is the largest principal stress (i.e., h<v<H); this implies a regional strike-slip tectonic stress regime.
Source: Cornet, F.H., 2014. Results from the In Situ Stress Characterization Program, Phase 1: Hydraulic Tests Conducted in the FutureGen Stratigraphic Pilot Well. February 2014.

Summary/Review• Flowmeter logging is one type of open borehole reconnaissance method for
identifying hydraulically conductive intervals that may be candidates for CO2 storage.
• Examples were presented from AEP Mountaineer (West Virginia) and Central Ohio, both Cambrian-Ordovician strata
• Five types of discrete interval (packer) hydraulic tests were discussed, including, slug tests, DST tests, pulse tests, constant rate tests, and constant pressure tests
• Examples were presented from FutureGen (Illinois), AEP Mountaineer (West Virginia), Ohio Geological Survey CO2 Well #1 (Central Ohio)
• Two types of discrete interval (packer) geomechanical (stress) tests were discussed, including, HF and HTPF tests
• Example presented from FutureGen (Illinois)
• Equipment requirements for conducting discrete interval hydraulic and geomechanical tests were discussed.
• Wireline deployable test tools can be attractive option in some cases
40

41
Information included in this presentation came from several Battelle projects plus information provided by the following individuals and organizations: - Frank Spane (Pacific Northwest National Laboratory, Richland Washington)- Ursula Rӧsli (Solexperts AG of Mönchaltorf-Zurich, Switzerland-- Randall Roberts (HydroResolutions, LLC, Carlsbad, New Mexico)
Acknowledgments