online submission id - program of computer graphics
TRANSCRIPT
Online Submission ID:
A Field Guide to BRDF Models∗
Stephen H. Westin Hongsong Li Kenneth E. Torrance
PCG-04-1 January, 2004
We present a principled approach to selecting a surface reflectance model and setting its parameters.
The approach is based on fundamental physical principles, comparisons between different models, and
practical insight into the characteristics of real surfaces. Four models of surface reflectance were evaluated
by comparing them with physical measurements on five different sample surfaces. Conclusions are drawn
about which of the models are best to represent different surfaces, since no one model was a clear winner
in all cases. Principles and visual checks are derived to help practitioners model a variety of surfaces with
good accuracy.
∗This report was submitted for publication at SIGGRAPH 2004.
1

Online Submission ID:
A Field Guide to BRDF Models
Category:
Abstract
We present a principled approach to selecting a surface reflectance model and setting its parameters.
The approach is based on fundamental physical principles, comparisons between different models, and
practical insight into the characteristics of real surfaces. Four models of surface reflectance were eval-
uated by comparing them with physical measurements on five different sample surfaces. Conclusions
are drawn about which of the models are best to represent different surfaces, since no one model was a
clear winner in all cases. Principles and visual checks are derived to help practitioners model a variety
of surfaces with good accuracy.
1 Introduction
In reproducing the appearance of real-world surfaces in computer renderings, practitioners have been
forced to depend on a combination of experience, intuition, and cut-and-try experimentation. To avoid this
process, [Borshukov 2003] used detailed reflectance measurements, but this is only practical if the user
has access to specialized measurement equipment. This paper seeks to provide a third way by providing a
few guidelines, based on detailed physical measurement and comparisons, which can be applied based on
visual observations of a surface.
Historically, there has been a gulf between theory and practice in modeling surface reflectance for
computer rendering. Models of surface reflectance range from empirical models that “look right” under
the proper conditions to elaborate models of the optical processes involved. Researchers have continued
to develop and refine models, while practitioners still face the problem of selecting a model and tuning its
parameters empirically.
This paper is a start toward bridging that gap between theory and practice. Rather than proposing a new
model or representation, this paper provides new insights into how to use models that already exist.
1
Online Submission ID:
There are two new insights in this paper: the relative performance of several well-known models on
a number of different surfaces, and guidelines on setting model parameters based on visual observations
of a surface. To do the first, we chose several well known models and a number of test cases that show
where each model is most applicable. We use physical measurements to provide a standard by which
to judge the ability of each model to reproduce real-world surfaces, making test renderings to show the
visual significance of the differences between models and then interpreting the results based on a basic
understanding of the physics of surface reflection. For the second, we use an understanding of the physical
processes involved to provide guidelines for converting simple visual observations to approximate model
parameters.
Our approach is to measure the BRDF of several carefully-chosen samples in the plane of incidence,
fitting four different well-known models to each set of data. We then explain the phenomena found in
each dataset in light of the physical processes involved, assess each model on its fidelity to the original
data, and relate these phenomena and modeling differences to their visual effect in a rendered image. This
approach combines the generality of a theoretical, technical approach with the concrete applicability of
the empirical approach.
We feel this is a more robust method than either the measurements or the renderings alone, as we take a
wide range of incidence and reflection angles into account. A test image, no matter how carefully designed,
cannot show all possible incidence/reflection combinations, and so could potentially miss effects that will
be visible in some other image.
We will start by reviewing the history of reflectance modeling for computer rendering, elucidate some
relevant principles of surface optics, then present five sample surfaces, comparing how four different
models capture the reflectance behavior of each. Finally we will draw some simple guidelines, based on
these principles and examples, to aid in the selection of a suitable reflectance model for a given surface.
2 Background
Researchers have taken three main approaches to modeling reflectance for computer renderings: simple
empirical models, physically-based models, and general mathematical fitting representations.
2

Online Submission ID:
The earliest realistic computer renderings used a simple Lambertian model, limiting environments to
purely diffuse surfaces. Phong [1975] introduced an empirical model that dramatically improved the
richness and realism of rendered images. His model was designed to reproduce a glossy effect with
minimal computation, and provided three simple parameters to control the appearance visually. Since then,
Ward created a model almost as simple and efficient[Ward 1992], but designed to fit measured reflectance
data and to incorporate effects of surface anisotropy. The Phong model itself has been modified to obey
certain physical laws to allow use in simulations of global illumination[Lewis 1993]. More recently,
Westlund and Meyer [2001] developed an empirical model based on traditional gloss and appearance
measurements.
These models are compact and computationally efficient, and most offer a small number of parameters
that can be manipulated interactively to achieve a desired appearance. They may fall short in reproducing
the exact reflectance of a surface, but there is controversy as to how visually important such errors may
be.
Physically-based models were introduced to computer rendering by Blinn[1977] and Cook and Tor-
rance[1982]. This was followed by several partial models of physical scattering processes including the
anisotropic models of Kajiya[Kajiya 1985] and Poulin and Fournier[1990]. Oren and Nayar[1994] pre-
sented a model for extremely rough surfaces such as unglazed ceramics. Finally, there are models of
complete wave optics for certain classes of surfaces[He et al. 1991; Stam 1999].
These models offer the hope of very accurate modeling of surface reflectance, but how is one to set the
physical parameters needed by these models? These parameters often have no direct intuitive meaning
and require special equipment to measure. This means that the models are unsuited to interactive use.
The final class of reflectance models is that of general mathematical fitting representations. Since the
reflectance is a function of 3 or 4 geometric variables, it is possible to construct a representation for
fitting based on orthographic basis functions. Sillion et al.[1991] and Westin et al. [1992] used spherical
harmonics as a basis set on the unit sphere; Koenderink and van Doorn[1998] used the Zernike polynomials
in a similar fashion. Schroder and Sweldens[1995] and Lalonde and Fournier[1997] used wavelets. Kautz
and McCool[1999] have represented the BRDF as a sum of separable functions. These representations
share two features: each is theoretically capable of representing any BRDF exactly, and they require many
3

Online Submission ID:
coefficients (dozens, hundreds, or even thousands) to achieve a good approximation of a typical BRDF, as
compared to 3-4 coefficients for models in the other two categories. Lafortune et al.[1997] struck a middle
ground by generalizing the Phong model with multiple steerable lobes. This model sacrifices the complete
generality of other models in this category, but is much simpler and more compact (≤ 10 coefficients). A
different approach was used by Matusik et al.[2003], attempting to enumerate the entire space of BRDFs
occurring in the real world and extracting a relatively small number (15-30) of basis functions to span the
space.
Practically speaking, these general representations must be fit to data from another source: either a
physical model or measured data. It is telling that each of these papers either includes its own set of
measurements or relies on some of the few BRDF datasets publicly available[Dana et al. 1997; Cornell
University Program of Computer Graphics 1999]. Not only are the parameters too numerous, but they lack
any intuitive meaning. The empirical models such as Phong are designed to be controlled interactively, and
even the physically-based models can be worked with, as they are controlled by a few physically-based
parameters.
All this work, it seems, has benefited us little; current commercial rendering systems seem to offer little
that was invented after 1980. Publication of a new model is generally accompanied by impressive render-
ings, but little comparison with the growing number of alternative models. Many models are evaluated
for their physical accuracy, without establishing whether this results in visible improvement in the final
image. Practitioners are forced to make a choice based on intuition, experience, and the limitations of a
particular renderer.
3 Making Surface Optics Comprehensible
Reflection of light from surfaces is a very complex subject, but we can gain much understanding by
restricting our domain and introducing a few simple principles. We can use these principles to characterize
many surfaces, as we will demonstrate in Section 4.
4

Online Submission ID:
3.1 Domain of Application
This paper deals only with a certain class of surfaces, those that
• can be treated as opaque
• can be described well by pure height fields
• are rough in a random way
• are isotropic in roughness
• range from perfectly smooth to quite rough
• display only certain types of subsurface scattering
By “opaque”, we mean that a surface displays no visible translucence. This means that any light scat-
tered beneath the surface must be absorbed or reemitted within a region of the surface small with respect
to the scale of depiction.
A surface that can be described as a pure height field has a well-defined interface, unlike, say, hair or
velvet.
Random roughness means that the features on the surface are distributed with no regular structure. A
diffraction grating is rough, but not random. A sandblasted surface has random roughness.
An isotropic surface displays reflectance invariant with respect to rotation about the surface normal.
Most paints and papers, most plastics, and metal that has been sandblasted or shot-blasted are usually
isotropic. Anisotropic surfaces include wood and brushed metal.
The range of surface roughness we deal with is quite wide, ranging from mirrors to uncoated paper and
other rougher surfaces.
We restrict the types of subsurface scattering because good models for subsurface scattering are rare.
Most of our examples show subsurface scattering that can be treated as Lambertian, but we include a more
interesting metallic paint sample.
These limitations may seem to be quite restrictive, but they actually embrace a broad array of surfaces
encountered in normal life. The examples in this paper include plastic and painted surfaces, metal surfaces,
5
Online Submission ID:
and even high-gloss metallic automotive paint.
3.2 A Few Basic Principles
Real-world surfaces, even within our chosen domain, display a wide variety of reflectance phenomena,
but most can be described in terms of a few processes and phenomena. This section explains the most
important for our domain.
3.2.1 Metals vs. Dielectrics
0 10 20 30 40 50 60 70 80 900
0.5
1
Dielectrics
Metals
Angle of incidence θi
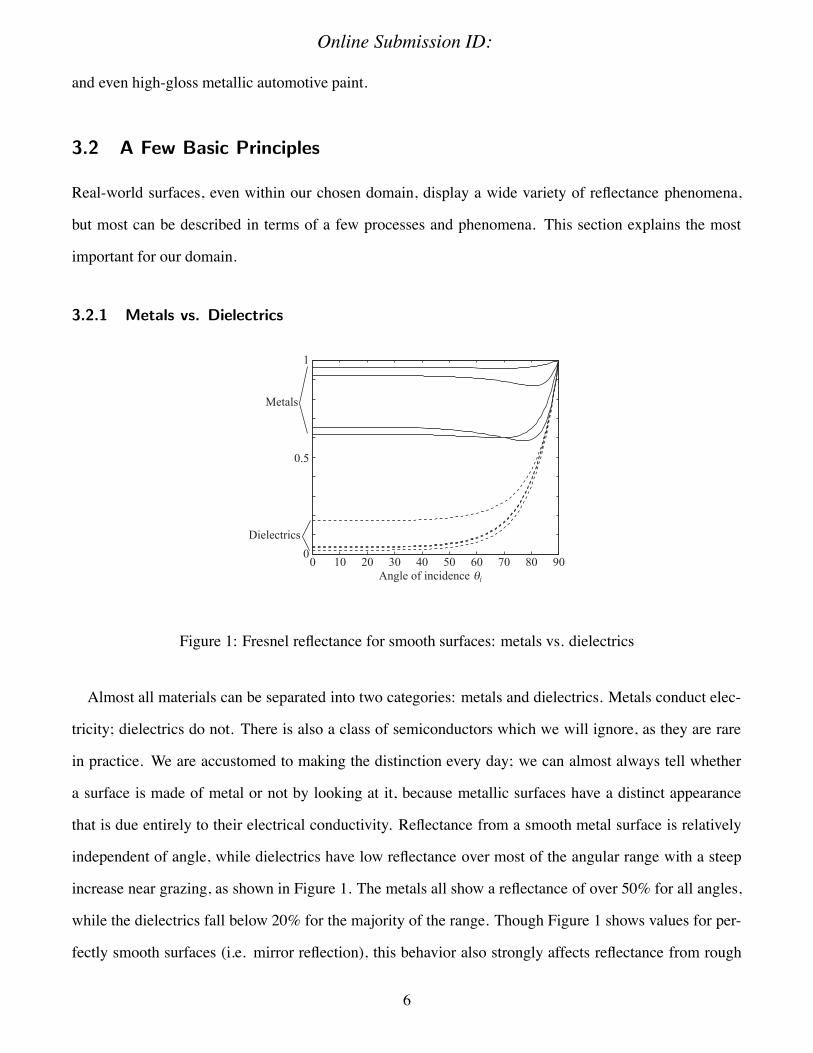
Figure 1: Fresnel reflectance for smooth surfaces: metals vs. dielectrics
Almost all materials can be separated into two categories: metals and dielectrics. Metals conduct elec-
tricity; dielectrics do not. There is also a class of semiconductors which we will ignore, as they are rare
in practice. We are accustomed to making the distinction every day; we can almost always tell whether
a surface is made of metal or not by looking at it, because metallic surfaces have a distinct appearance
that is due entirely to their electrical conductivity. Reflectance from a smooth metal surface is relatively
independent of angle, while dielectrics have low reflectance over most of the angular range with a steep
increase near grazing, as shown in Figure 1. The metals all show a reflectance of over 50% for all angles,
while the dielectrics fall below 20% for the majority of the range. Though Figure 1 shows values for per-
fectly smooth surfaces (i.e. mirror reflection), this behavior also strongly affects reflectance from rough
6

Online Submission ID:
surfaces of the same materials.
3.2.2 Surface Scattering
The second important principle is the interaction with the wave nature of light. This is most obvious in
diffraction gratings: features regularly spaced at intervals close to that of the light they reflect will actually
diffract light in specific different directions. But random surfaces follow the same laws.
The simplest case is that of a perfectly smooth surface, which exhibits ideal specular or mirror-like
reflection. Light reflected from such a surface retains its angular distribution, so such surfaces are used
as mirrors. The only reason a “perfect” mirror is possible is the wave nature of light. If a surface has
only roughness features significantly smaller than the wavelength, it appears smooth to those waves. This
makes optical polishing possible: by grinding with successively finer grit, it is possible to reduce roughness
to smaller than the wavelengths of interest. For visible light, roughness less than about 0.02µm can be
considered perfectly smooth. But for ultraviolet or X-rays, the same surface may be “rough”. Likewise,
a surface that appears rough in the visible spectrum may be a smooth surface to infrared or microwave
radiation.
Reflection from such a smooth surface was described by Fresnel in the 18th century. His equations
predict that the reflectance of a smooth surface depends only on the incidence angle and the refractive
index n of the material. The distinction between metals and dielectrics is maintained here in the value of
n, which is a real number for dielectrics and a complex number for metals. Figure 1 shows the Fresnel
reflectance as a function of angle for several typical metals and typical dielectrics. Some models ignore
this angular variation of Fresnel reflectance, using a fixed value for all angles; we can anticipate that such
models are better suited to modeling metals than dielectrics.
Surfaces with very small roughness are similar in behavior to perfectly smooth surfaces, but their spec-
ular reflectance is attenuated by a well-known relationship[Davies 1954]:
ρ ≈ Fe−(4π σλ cosθi)
2
(1)
where ρ is the resulting specular reflectance, F is the Fresnel reflectance, σ is the RMS roughness height,
λ is the wavelength of incident light, and θi is the angle of incidence of that light. The fraction of light not
7

Online Submission ID:
reflected into the mirror direction, F−ρ, is essentially scattered to the rest of the hemisphere above the
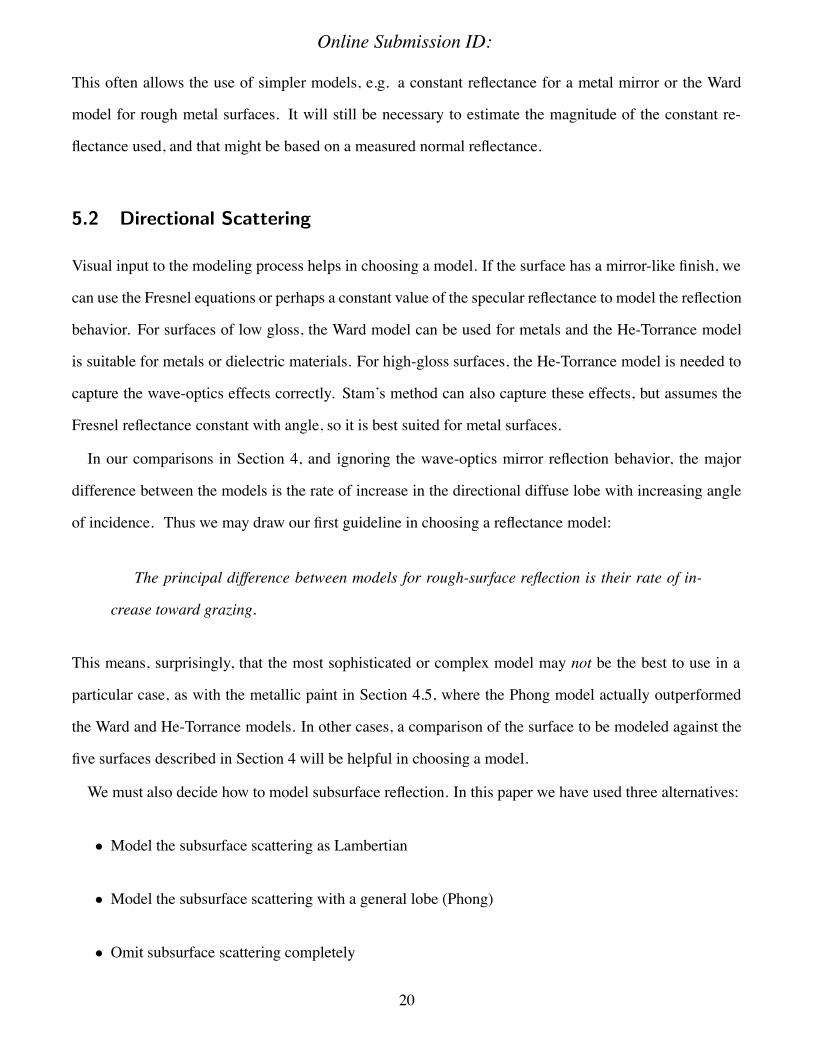
surface. It is clear from Equation 1 that such slightly rough surfaces resemble perfectly-smooth surfaces
in two cases: as σλ decreases, and as the angle of incidence approaches grazing at 90◦. In either case,
the term σλ cosθi approaches zero, feeding all energy into the ideal specular (mirror-like) reflection. The
product σ cosθi is sometimes colled the apparent or effective roughness, as sketched in Figure 2.
Effective roughness
Rough surface
Incident light
θi
Bas
e ro
ughn
ess
Figure 2: Effective roughness decreases according to σ cosθi as in Equation 1.
At the opposite extreme from smooth and slightly rough surfaces is the case where the roughness is
much greater than the wavelength. Most reflectance models in computer graphics have been intended
to operate in this regime, starting with Phong[1975] and including those of Ward[1992] and Cook and
Torrance[1982]. For such surfaces, surface scattering takes the form of a smooth lobe at or near the
specular direction; since σλ is large, specular (or mirror-like) reflection from the surface is neglected.
Extremely rough surfaces such as sandpaper are not matched well by these rough-surface models, since
they violate the assumptions of these models by having a large mean surface slope. Surfaces like unglazed
ceramic and flat house paint show similar large-slope effects, and Oren and Nayar[1994] developed a
model for these cases. This paper will not deal with large-slope surfaces.
A more complex case is that where the size of surface roughness approaches that of the wavelength, a
case intermediate between the slightly rough and very rough extremes. The reflection behavior of such
surfaces, surprisingly, is not a smooth transition of a rough-surface model to that of the smooth-surface
model, but instead a superposition of the two separate cases. Such surfaces can only be handled by a full
physical-optics model like that of He et al.[1991] or Stam[1999].
All rough surfaces, from slightly rough to very rough, actually behave as though their roughness varies
8

Online Submission ID:
with the angles of illumination and reflection. When a surface is illuminated or viewed from extreme
angles, the surface behaves as though it were smoother (see Figure 2). Further, if the roughness slopes are
large enough, part of the roughness valleys can be occluded for both illumination and viewing, making the
surface appear even smoother. Such behavior is visible in the real world. For example, rough pavement
shows significant glare from headlights at night, since the incidence and viewing angles approach grazing.
Rough paper, though normally highly diffuse, shows a sheen as viewing angles approach grazing. Because
of this effect, certain surfaces can behave as either rough or smooth, depending on the angles of incidence
and reflection. This effect is accounted for in the He-Torrance model, but is ignored in most other models.
3.2.3 Subsurface Scattering
Even the best model of surface scattering is insufficient to reproduce the appearance of most surfaces,
since much of the appearance (e.g. color) comes from scattering beneath the surface, within the body of
the material. The only exceptions are metallic surfaces and black dielectrics. A metallic surface prevents
subsurface scattering, since energy is absorbed within a fraction of one wavelength of the surface. A black
dielectric also absorbs all energy that enters, but over a longer length scale. All other dielectric surfaces
reflect significant energy via subsurface scattering.
Fortunately, two large classes of subsurface scattering can be modeled simply. Surfaces in the first
class show diffuse subsurface scattering: the amount of subsurface scattering is practically independent of
angle. Strictly speaking, the surface scattering will modify this pure behavior, as pointed out by Shirley et
al.[1997], but often this can be neglected, as we will see in Section 4. The second class is metallic paints,
which display a subsurface lobe much like that seen from rough surfaces. For such surfaces, we can press
a rough-surface model into service.
4 Model Comparisons
In this section we take several examples of surfaces that fit within our domain and fit four different models
to reflectance measurements of each, applying the principles of Section 3 to explain the differences in
performance.
9

Online Submission ID:
Reflectance from a surface can be completely described by the BRDF, which is a 3D function for these
surfaces, but we will examinine the function only the plane of incidence, as this simplifies the process
while still showing major differences between the models. The profile in the incidence plane defines the
size, brightness, and position of the highlight from a small light source. The third dimension, the azimuth
angle, determines the shape of the highlight, which is also important, but secondary.
We chose to plot data for three angles of incidence: 10◦,45◦, and 75◦. This shows both the “typical”
behavior at near-normal angles, the effects near grazing, and the transition between the two. Many eval-
uations of BRDF models and data omit angles near grazing, as both measurement and modeling become
more difficult there, but this is the regime that shows the greatest differences between models.
The range of values of the BRDF is large, and a linear scale would completely obliterate the effects seen
at low angles of incidence, so we have chosen to plot the data on a logarithmic scale. In addition, human
perception of luminance is nonlinear, and the logarithmic scale follows Weber’s law[Wyszecki and Stiles
1982], a well-known approximation to this nonlinearity. This means that a given vertical distance on these
graphs corresponds roughly to a similar perceptual difference.
We chose four models from the computer graphics literature for this comparision: the empirical models
of Phong[1975] and Ward[1992], the physical model of He, Torrance, et al. and, as an example of the
mathematical fitting approach,the representation of Lafortune et al. The measured BRDF comparison
data were obtained with one calibrated gonioreflectometer, except for the surface of Section 4.4, which
was measured by Marx and Vorberger[1990]. Renderings were generated by a Monte Carlo path tracer,
including full global illumination for all transport paths. We present the five example surfaces in order of
increasing complexity.
4.1 Rough Metal
Our first sample is a rough aluminum surface, created by coating a sheet of anti-glare picture frame glass
with pure aluminum; its visual appearance is typical for a rough metal surface, as shown in Figure 3. The
measured BRDF data are shown in Figure 4; they show a directional diffuse lobe with a small ideal spec-
ular (mirror-like) component emerging at an incidence angle of θi = 75◦. This ideal specular component
corresponds approximately to the mirror reflection relation, Equation 1, but its magnitude is relatively
10

Online Submission ID:
Figure 3: Renderings of rough aluminum surface at two viewing angles
0.1
10
Phong Lafortune
-30 0 30 60 90
Ward
-30 0 30 60 90
He-Torrance
-60 -30 0 30 60 90 -30 0 30 60 90
1
100
Figure 4: Fitting results for rough aluminum surface: BRDF vs. angle of reflection for three incidence
angles, λ = 550nm.
small. Some mirror reflection is suggested in the right-hand rendering at the larger viewing angle in Fig-
ure 3. In Figure 4, three of the models seem to model only the narrower part of the directional diffuse
lobe, while the He-Torrance model provides a better fit to the lobe and also predicts the emerging specular
peak.
There is no striking difference in the performance of the four models for the directional diffuse lobes
for this surface. The Phong model shows the least increase toward grazing incidence, but not much less
than the other three models. It may be surprising to see any increase at all in the Phong model; the model
was originally formulated in terms of radiance, but the BRDF is scaled by irradiance, which includes an
extra term cosθi. Dividing by this term gives the increase shown in the directional diffuse lobe.
11

Online Submission ID:
Phong Lafortune
-30 0 30 60 90
Ward
-30 0 30 60 90
He-Torrance
-60 -30 0 30 60 90 -30 0 30 60 90
0.1
10
1
Figure 5: Fitting results for rough plastic surface: BRDF vs. angle of reflection for three incidence angles,
λ = 550nm.
Phong Lafortune
Figure 6: Comparison of rendered images of off-white rough plastic for two reflectance models.
4.2 Rough Plastic
We now move from a metallic surface to a dielectric: a section of an off-white computer case, which
shows a finish with a slight sheen. An example rendering appears in Figure 6. The BRDF data are shown
in Figure 5. Both this surface and the rough metal in Figure 4 show a directional diffuse lobe, but several
differences are apparent. First, the minimum BRDF value in Figure 5 is much higher than in Figure 4; this
is a constant Lambertian component due to subsurface scattering, and results in the off-white color of the
surface. Second, the magnitude of the directional diffuse lobe varies much more with incidence angle for
the dielectric surface, since it is a dielectric material and its Fresnel reflectance varies dramatically with
angle, as shown in Figure 1. Third, the magnitude of the directional diffuse lobe is roughly a full order
12

Online Submission ID:
Phong Lafortune
-30 0 30 60 90
Ward
-30 0 30 60 90
He-Torrance
-60 -30 0 30 60 90 -30 0 30 60 90
0.1
10
1
Figure 7: Fitting results for plain white paper: BRDF vs. angle of reflection for three incidence angles,
λ = 550nm.
of magnitude less for the dielectric surface. The two surfaces show similar brightness, however, since the
wider directional diffuse lobe and the constant Lambertian subsurface component of the plastic surface
spread a similar amount of energy over a broader angular range. Finally, the wider directional diffuse lobe
indicates a greater mean roughness slope on the plastic surface. This surface also shows no emergence of
an ideal specular peak, indicating that the surface roughness σ is larger than that for the metal surface.
This material shows dramatic differences between the four models. The He-Torrance model fits well,
but the Phong model cannot model the increase in the directional diffuse lobe. The Ward model also shows
an inadequate increase toward grazing. The rate of increase toward grazing is fixed in the Ward model,
whereas the He-Torrance model includes an explicit factor for the Fresnel reflectance and so models the
increase. The Lafortune fitting model, as we might expect, has sufficient flexibility to reproduce the effect
accurately. To see the visual effects of this difference, we have rendered a simple environment using two
of the models and show the results in Figure 6. Notice how the Phong model is slightly brighter than the
Lafortune model at viewing angles near normal, but much dimmer near grazing, where both the Fresnel
reflectance and the reduced effective roughness increase the directional reflectance.
4.3 White Paper
This example is an ordinary sheet of office paper. It has a Lambertian subsurface scattering component,
much like the rough plastic surface. The reflectance is shown in Figure 7. Unlike the plastic, there is no
significant directional diffuse lobe at incidence angles near normal. Because of this, this surface might
normally be modeled as purely Lambertian. However, its reflectance in Figure 7 varies dramatically
13

Online Submission ID:
LafortunePhong
Figure 8: Comparison of rendered images of paper for two reflectance models
near grazing angles due partly to the decrease in effective roughness predicted by Equation 1. The He-
Torrance model includes an effective roughness term, and models this increase well. The best fit, however,
is offered by the Lafortune fitting model. The Phong and Ward models show dramatic departures from
the true behavior. This is borne out in the renderings shown in Figure 8; near-normal viewing shows
virtually no difference between the models, but viewing from near grazing shows a dramatic difference,
with the Lafortune model looking much more natural. The golden color in the images is introduced by the
illumination, which simulates a sunset sky.
4.4 Smoother Metal
Our next example is a metal surface in the transition region between rough and smooth surface behavior.
The surface, made of stainless steel and hand-lapped to near-mirror smoothness, was studied, and its
reflectance measured, by Marx and Vorberger[1990]. We used the surface roughness statistics given in the
paper: RMS roughness σ = 0.08µm, horizontal roughness τ = 1.52µm. Since we were unable to obtain
refractive index information for the stainless steel, we used the index for iron, the major component, but
the behavior is relatively insensitive to this approximation. We have normalized both the measurement
data from the paper and our BRDF results, as the data in the paper were not absolute; the result is shown
in Figure 9. The specular peak is prominent even at the near-normal incidence angle of 4◦, in contrast to
14

Online Submission ID:
-60 -30 0 30 60 90
.01
1
norm
aliz
ed B
RD
F
θr
=54˚θi= 4˚θi
Figure 9: Fitting results for nearly-smooth metal surface: data from Marx et al., He-Torrance model,
λ = 633nm.
the surface in Section 4.1, where it emerged only at large angles. θi = 54◦ is the largest incidence angle
measured by Marx et al., but Equation 1 makes it clear that the specular component will grow still farther
at greater incidence angles. We show only the results from the He-Torrance model, as none of the other
models is capable of reproducing the ideal specular component. While the He-Torrance model does not
exactly match the measurements, there is qualitative agreement, with the directional diffuse lobes similar
in width and position over a range of two orders of magnitude.
Since the specular peak is so strong, it is tempting to model this material as a mirror, either by using
the Fresnel reflectance or with a single reflectance value for all angles. This would, of course, save
the computational complexity of the He-Torrance model. Figure 10 shows the result of this approach,
compared to a rendering with the He-Torrance model. The most dramatic deficiency in the ideal mirror
reflectance is the lack of the dramatic highlight from the sun, since its brightness is limited to a few pixels
whose values are severely clipped. Traditionally this is handled by a non-physical model that provides a
directional diffuse lobe such as Phong for light sources, as did Whitted[1980]. Unfortunately, there are
subtler effects that would still be missing. Notice how the horizon is blurred on the front of the teapot
in the right-hand image, but becomes perfectly distinct at the edge of the teapot, where angles approach
grazing. Similarly, the reflection of the spout in the body of the teapot on the right is blurred in a way that
is distinctive of slightly rough metal, such as the outside of an unpainted airliner.
15

Online Submission ID:
Simple Mirror He-Torrance Model
Figure 10: Renderings of nearly-smooth metal teapot
4.5 Metallic Paint
Phong Lafortune
-30 0 30 60 90
Ward
-30 0 30 60 90
He-Torrance
-60 -30 0 30 60 90 -30 0 30 60 90
0.1
10
1
Figure 11: Fitting results for metallic paint with clearcoat: BRDF vs. angle of reflection for three incidence
angles, λ = 550nm.
Our final example is an automotive metallic paint, showing how a more complex surface can be modeled
with commonly-available models. In terms of the mechanisms of Section 3, this is most like the plastic
surface of Section 4.2: it is a dielectric and shows important subsurface scattering. There are major differ-
ences, however. While the plastic surface is very rough, this paint has a very smooth, mirror-like surface.
In addition, the subsurface scattering is very different from Lambertian. We show BRDF measurements
of this paint in Figure 11. We have excluded the ideal specular reflection so as to observe the subsurface
scattering; for rendering, the specular reflection can be modeled simply via the Fresnel equation.
The most interesting result is that the paint has a “metallic” visual appearance, but its reflectance is quite
16

Online Submission ID:
Figure 12: Rendering using Lafortune model of metallic paint
different from that of a real metal. We see here a directional diffuse lobe that resembles the lobe from our
rough aluminum sample, but shows very little variation with angle of incidence. This demonstrates a
difficulty faced by the makers of the ill-fated Delorean automobile: it was impossible to paint the plastic
body parts to match the stainless-steel body panels, since there is no paint that will match from all angles.
The Phong model reproduces this behavior well due its lack of variation with incidence angle. The
Lafortune fitting model again shows the flexibility to match this performance, and the more sophisticated
Ward and He-Torrance models are actually less accurate because this surface violates one of their assump-
tions. These models are intended to deal with a single material-air interface, not subsurface scattering
modified by a mirror-like clear overcoat.
Figure 12 shows a car model rendered using the Lafortune model, with a Fresnel term added to describe
the specular reflection from the clearcoat.
5 Application
These results are interesting from an academic viewpoint, but they also can be applied in the real world
when detailed measurements are not available. Since we have emphasized features that make a visible
difference, we can make a reasonable choice of models for many surfaces based on direct visual observa-
tion of a surface. In many cases, this amounts to noting the amount of mirror reflection (if any) and the
apparent surface finish, smooth or rough. Often the index of refraction n of the surface will be needed, and
17

Online Submission ID:
in some cases, vertical and horizontal roughness lengths. To help achieve these objectives, the following
guidelines are suggested.
The first guideline is simple:
Use whatever data are available.
If a diffuse reflectance measurement device is available, it can help to set diffuse parameters, especially
the color effects, which vary with wavelength. If a photometer is available, it can be used to compare re-
flectance with a known reference. If a glossmeter is available, it can provide some directional information.
5.1 Estimating the Index of Refraction
When using a physically-based model such as Fresnel, He-Torrance or Cook-Torrance, it is necessary to
choose a value for n, the index of refraction. If the composition of your surface is known, refractive index
information may be available (e.g. Table 1); Palik’s compilations[1985; 1998] are particularly useful.
The variation of the index of refraction across the visible spectrum is small for the metals in Table 1,
and even smaller for the dielectrics. This means that we can start by setting a constant index n, and that the
mirror reflection and any directional diffuse lobe from surface scattering will retain the color of the light
source. The value of n can often be estimated from a single measurement, suggesting our next guideline:
Some simple measurements may help.
If a smooth sample of the material is available (e.g. a sheet of glass), a simple measurement of specular
reflectance near normal incidence allows us to estimate n, as in Cook et al.[1982]:
n=1+
√F0
1−√F0
(2)
where F0 is the Fresnel (ideal specular) reflectance at or near normal incidence. While this is only exact
for dielectrics, we can, as did Cook, use this equation to estimate an equivalent real-valued n for metals
by using the measured normal reflectance of the metals. The estimated Fresnel reflectance curve for the
metals is then similar in shape to that of the dielectrics shown in Figure 1, but it is shifted to higher
reflectance values at all angles of incidence.
18

Online Submission ID:
If there are no reflectance data or physical parameters available for the surface being modeled, some
rough estimates may suffice for both dielectrics and metals. We need not try all possible values since the
index n is not totally arbitrary. This leads to our next guideline:
Make intelligent guesses
0.0
0.2
0.4
0.6
0.8
1.0
Nor
mal
Ref
lect
ance
Silv
er
Alu
min
um
Chr
omiu
m
Nic
kel
Dia
mon
d
Gla
ss (
max
)
Gla
ss (
min
)
Poly
ethy
lene
Acr
ylic
Fuse
d si
lica
Wat
er
Figure 13: Specular reflectance at normal incidence for various materials
To help the reader estimate n for a dielectric surface, we have listed several common materials in the
first section of Table 1. Most common dielectrics cluster around the value n ≈ 1.5, leading to a normal
reflectance of around 0.04. Diamond is included as a practical boundary for dielectrics. Its high index of
refraction results in the bright glitter that makes it a valuable gemstone, but even this outlying case shows
a normal reflectance in Figure 13 that is far below that of metals. This leads us to suggest:
For most dielectrics, 1.5 is an adequate approximation to n.
For water and ice, and many liquids, n will be less, reducing the normal reflectance; for gemstones or
high-quality crystal, it will be higher, increasing reflectance at most angles.
For metals, the estimate of n is harder; a single reflectance measurement is inadequate for obtaining
both components of the complex index. Fortunately, the Fresnel reflectance function is simpler in shape
for metals, as seen in Figure 1: the reflectance remains within a small range over most of the angular
domain. This leads us to suggest:
For most metals, it is permissible to ignore the angular variation in Fresnel reflectance.
19
Online Submission ID:
This often allows the use of simpler models, e.g. a constant reflectance for a metal mirror or the Ward
model for rough metal surfaces. It will still be necessary to estimate the magnitude of the constant re-
flectance used, and that might be based on a measured normal reflectance.
5.2 Directional Scattering
Visual input to the modeling process helps in choosing a model. If the surface has a mirror-like finish, we
can use the Fresnel equations or perhaps a constant value of the specular reflectance to model the reflection
behavior. For surfaces of low gloss, the Ward model can be used for metals and the He-Torrance model
is suitable for metals or dielectric materials. For high-gloss surfaces, the He-Torrance model is needed to
capture the wave-optics effects correctly. Stam’s method can also capture these effects, but assumes the
Fresnel reflectance constant with angle, so it is best suited for metal surfaces.
In our comparisons in Section 4, and ignoring the wave-optics mirror reflection behavior, the major
difference between the models is the rate of increase in the directional diffuse lobe with increasing angle
of incidence. Thus we may draw our first guideline in choosing a reflectance model:
The principal difference between models for rough-surface reflection is their rate of in-
crease toward grazing.
This means, surprisingly, that the most sophisticated or complex model may not be the best to use in a
particular case, as with the metallic paint in Section 4.5, where the Phong model actually outperformed
the Ward and He-Torrance models. In other cases, a comparison of the surface to be modeled against the
five surfaces described in Section 4 will be helpful in choosing a model.
We must also decide how to model subsurface reflection. In this paper we have used three alternatives:
• Model the subsurface scattering as Lambertian
• Model the subsurface scattering with a general lobe (Phong)
• Omit subsurface scattering completely
20

Online Submission ID:
The first option is valid for many paints and plastics: all those that show a solid color. The second option
is valid for paints and plastics with a “metallic” look, as with many automotive finishes. The last option is
valid both for metals and for surfaces whose base color is black.
When modeling Lambertian subsurface scattering, we need to estimate its magnitude. Perceived bright-
ness is deceptive, as it is nonlinear with reflectance. The photographic standard for medium gray, for
example, is 18%. A reflectance of 30% is actually a medium or light gray. Our white paper sample
has a measured total reflectance of only about 75%. While accurate estimates of absolute magnitude are
difficult, we can
Estimate any Lambertian scattering by comparison with a scale of known diffuse re-
flectances.
We have used the neutral patches of the Macbeth ColorCheckerTM test chart, giving 5 patches with re-
flectance ranging from about 3.2% to about 89%. This allows us to estimate the diffuse reflectance of
many surfaces by visual comparison. Of course, if a diffuse reflectometer is available, the reflectance can
be measured almost directly.
τ(µm)
σ (µ
m)
1
0.1
0.01
1 0.1 0.01
0.1
5
1 10 100
mean roughness slopeστ
Ang
le o
f sp
ecul
ar e
mer
genc
e
85∞
80∞
75∞
60∞45∞15∞
Figure 14: Specular transition vs. model parameters
We also need to adjust model parameters for surface roughness. Fortunately,
Surface roughness parameters can often be estimated visually.
21

Online Submission ID:
Simpler models, such as the Ward, Phong, and Cook-Torrance models, require only a single parameter to
control the directional-diffuse lobe width; this can be set visually with trial-and-error renderings. Wave-
optics models, however, require some knowledge of the physical scale of surface roughness to control the
emergence of mirror-like ideal specular behavior, but the model itself can help us turn visual observations
into estimated parameters.
The surface roughness is usually described by the RMS vertical roughness σ and a horizontal roughness
scale τ. A simple measurement may be feasible; compact instruments are available that measure surface
roughness using a mechanical stylus.
When no direct measurement of roughness is available, we can use a wave-optics model directly to
estimate the roughness parameters. This requires that the specular emergence be visible. Figure 14 gives
some guidance on how to set the parameters. The ordinate is the surface RMS roughness σ and the
abscissa is the horizontal roughness τ. Each colored curve shows the surface parameters at emergence of
the specular component for a particular angle of emergence, as labeled along the left. Our criterion for
this emergence was the point at which specular reflectance equals the directional diffuse reflectance in the
specular direction, at a wavelength of 550nm, and with a viewing solid angle corresponding to the human
eye at an arm’s length distance from the surface to be modeled.
To use this diagram, we first observe the surface and measure the reflection angle at which the ideal
specular component becomes visible to the eye. For example, suppose this angle is about 80◦. We look
along the left side of Figure 14 and find the red contour line corresponding to this angle. If we start by
assuming a mean slope of 0.1, we follow this red contour to the point where it crosses the dashed line for
στ = 0.1, which is at σ = 0.5µm,τ = 5µm. This will serve as a starting point for visual experimentation,
varying σ and τ while remaining on the red contour. We have shaded the area where στ > 1.0, since this
is beyond the regime where the He-Torrance model’s assumptions hold. Most surfaces for which this
model is applicable lie in the regime 0.01 ≤ στ ≤ 1. For convenience, the relationship between σ and τ in
Figure 14 can be estimated by the empirical formula
σ =C
τ0.7 +6, (3)
where C depends on the angle of observed specular emergence and σ and τ are in micrometers. Values of
22

Online Submission ID:
C are tabulated in Table 2. The dotted lines in Figure 14 show the results of this estimate for each of the
specular-emergence angles.
6 Conclusion
We have outlined a principled, yet practical, approach to visual modeling for many surfaces. Though based
on physical measurements, the approach can be used even when no such measurements are available. We
have demonstrated several principles that are vital to modeling the reflectance of a surface well, including:
• There are visible differences between various reflectance models
• No one model performs well on every surface
• Sometimes the most sophisticated model is not the best choice
• We can use guiding principles and rules of thumb to model surfaces better, even when specialized
instrumentation is unavailable.
We have presented some guidelines to aid the practitioner in selecting a reflectance model for certain
types of surfaces. Since these guidelines are based on physical measurements, they are more reliable than
intuition based on individual renderings.
6.1 Further Work
The work should be continued in two ways: rigor and generality.
We have judged different models by visually comparing graphs with measured data and drawing gross
distinctions that we feel are valid. We have not yet addressed the question of measurable perceptual
differences in renderings: some of the differences seen in the graphs may not be detectable in a rendered
image, or some of the the residual differences between the “good” models, or between them and the true
data, may be perceptible.
We have also chosen to deal with only one class of surfaces: those that exhibit a smooth directional-
diffuse reflectance lobe at or near the specular direction, giving the classic computer graphics highlight,
23

Online Submission ID:
with possibly an additional mirror-like component. It will be a worthwhile challenge to apply a similar
approach to surfaces that display retroreflection, anisotropy, and other phenomena.
This paper is intended only as a next step; much remains to be done, including:
• Evaluating the performance of these models out of the plane of incidence
• Extending the classes of surfaces studied: e.g. retroreflective paints, rough ceramics, velvet
• Evaluating more models, e.g. Oren-Nayar
• Using the insights to design new models that combine the intuitive interaction of Phong with better
reproduction of visual effects
References
BLINN, J. F. 1977. Models of light reflection for computer synthesized pictures. vol. 11, 192–198.
BORSHUKOV, G. 2003. Measured BRDF in film production: Realistic cloth appearance for ”the matrix reloaded”. In SIG-
GRAPH 2003 Sketches and Applications.
BROWN, G. A. 1985. Factors affecting the refractive index distribution of window glass. Journal of Forensic Sciences 30, 3
(July), 806–813.
COOK, R. L., AND TORRANCE, K. E. 1982. A reflectance model for computer graphics. ACM Transactions on Graphics 1,
1 (Jan.), 7–24.
CORNELL UNIVERSITY PROGRAM OF COMPUTER GRAPHICS, 1999. Measurement data.
http://www.graphics.cornell.edu/online/measurements/.
DANA, K. J., GINNEKEN, B. V., NAYAR, S. K., AND KOENDERINK, J. J., 1997. Columbia-utrecht reflectance and texture
database. http://www1.cs.columbia.edu/CAVE/curet/.
DAVIES, H. 1954. The reflection of electromagnetic waves from a rough surface. Proc. IEE 101, 209–214.
HE, X. D., TORRANCE, K. E., SILLION, F. X., AND GREENBERG, D. P. 1991. A comprehensive physical model for light
reflection. In Computer Graphics (Proceedings of SIGGRAPH 91), vol. 25, 175–186.
KAJIYA, J. T. 1985. Anisotropic reflection models. In Computer Graphics (Proceedings of SIGGRAPH 85), vol. 19, 15–21.
KAUTZ, J., AND MCCOOL, M. D. 1999. Interactive rendering with arbitrary BRDFs using separable approximations. In
Eurographics Rendering Workshop 1999.
24

Online Submission ID:
KOENDERINK, J., AND VAN DOORN, A. 1998. Phenomenological description of bidirectional surface reflection. J. Opt. Soc.
Am. A 15, 11 (Nov.), 2903–2912.
LAFORTUNE, E. P. F., FOO, S.-C., TORRANCE, K. E., AND GREENBERG, D. P. 1997. Non-linear approximation of
reflectance functions. In Proceedings of SIGGRAPH 97, Computer Graphics Proceedings, Annual Conference Series, 117–
126.
LALONDE, P., AND FOURNIER, A. 1997. A wavelet representation of reflectance functions. IEEE Transactions on Visualiza-
tion and Computer Graphics 3, 4 (October–December), 329–336.
LEWIS, R. 1993. Making shaders more physically plausible. In Fourth Eurographics Workshop on Rendering, 47–62.
MARX, E., AND VORBERGER, T. V. 1990. Direct and inverse problems for light scattered by rough surfaces. Applied Optics
29, 25 (Sept.), 3613–3626.
MATUSIK, W., PFISTER, H., BRAND, M., AND MCMILLAN, L. 2003. A data-driven reflectance model. ACM Transactions
on Graphics 22, 3 (July), 759–769.
OREN, M., AND NAYAR, S. K. 1994. Generalization of lambert’s reflectance model. In Proceedings of SIGGRAPH 94,
Computer Graphics Proceedings, Annual Conference Series, 239–246.
PALIK, E. D., Ed. 1985. Handbook of Physical Constants of Solids. Academic Press.
PALIK, E. D., Ed. 1998. Handbook of Physical Constants of Solids. Academic Press.
PHONG, B.-T. 1975. Illumination for computer generated pictures. Communications of the ACM 18, 6 (June), 311–317.
POULIN, P., AND FOURNIER, A. 1990. A model for anisotropic reflection. InComputer Graphics (Proceedings of SIGGRAPH
90), vol. 24, 273–282.
SCHRODER, P., AND SWELDENS, W. 1995. Spherical wavelets: Efficiently representing functions on the sphere. In Proceed-
ings of SIGGRAPH 95, Computer Graphics Proceedings, Annual Conference Series, 161–172.
SEGELSTEIN, D. J. 1981. The complex refractive index of water. Master’s thesis, University of Missouri-Kansas City.
SHIRLEY, P., HU, H., SMITS, B., AND LAFORTUNE, E. P. 1997. A practitioners’ assessment of light reflection models. In
Pacific Graphics ’97.
SILLION, F. X., ARVO, J. R., WESTIN, S. H., AND GREENBERG, D. P. 1991. A global illumination solution for general
reflectance distributions. In Computer Graphics (Proceedings of SIGGRAPH 91), vol. 25, 187–196.
STAM, J. 1999. Diffraction shaders. In Proceedings of SIGGRAPH 99, Computer Graphics Proceedings, Annual Conference
Series, 101–110.
25

Online Submission ID:
WARD, G. J. 1992. Measuring and modeling anisotropic reflection. Computer Graphics 26, 2 (July), 265–272. Proceedings
of SIGGRAPH ’92.
WESTIN, S. H., ARVO, J. R., AND TORRANCE, K. E. 1992. Predicting reflectance functions from complex surfaces. In
Computer Graphics (Proceedings of SIGGRAPH 92), vol. 26, 255–264.
WESTLUND, H. B., AND MEYER, G. W. 2001. Applying appearance standards to light reflection models. In Proceedings of
ACM SIGGRAPH 2001, Computer Graphics Proceedings, Annual Conference Series, 501–510.
WHITTED, T. 1980. An improved illumination model for shaded display. Communications of the ACM 23, 6 (June), 343–349.
WYSZECKI, G., AND STILES, W. S. 1982. Color Science: Concepts and Methods, Quantitative Data and Formulae, second
edition ed. John Wiley and Sons, ch. 6, 490.
26

Online Submission ID:
Material n Normal
Re-
flectance
Source
Water ≈ 1.34 0.0211 [Segelstein
1981]
Fused
silica
(pure
glass)
1.460
(at
546.074nm)
0.0350 [Palik 1985]
Lucite R©acrylic
≈ 1.48 0.0375 Our
measurement
Polyethylene
1.490
(at
551.1nm)
0.0387 [Palik 1985]
Window glass 1.51-1.54 0.0413-
0.0452
[Brown 1985]
Diamond 2.4203 0.1724 [Palik 1985]
Nickel
1.80+
3.33i
(at
563.6nm)
0.6196 [Palik 1985]
Chromium
3.18+
4.41i
(at
558.5nm)
0.6555 [Palik 1998]
Aluminum 0.958+6.69i 0.9211 [Palik 1985]
Silver 0.120+3.45i 0.9635 [Palik 1985]
Table 1: Refractive indices of a few common materials, λ = 550nm
27

Online Submission ID:
Angle 15◦ 45◦ 60◦ 75◦ 80◦ 85◦
C 1.1 1.6 2.4 5.5 9 20
Table 2: Values of Empirical ConstantC
28