one hundred and ten - titan integrated report 2012€¦ · maria alexiou, csr senior manager...
TRANSCRIPT
one hundred and ten100 years listed on the Athens Exchange
10 years of commitment to the U.N. Global Compact
years from the establishment of the ΤΙΤΑΝ Cement Company
1st Integrated ANNUAL REPORT 2012

TITAN ANNUAL REPORT 2012
How to read our 1st Integrated Annual Report
Following a tradition of 30 years of reporting annually our social and environmental performance, in a standalone document, along with our financial performance, this year we moved further towards a fully integrated Report. This evolution intends to provide shareholders and other key stakeholders with a full and detailed review of TITAN Group business strategy, policies, activities and results.
The 2012 Report covers all TITAN Group activities in thirteen countries and highlights the main developments in 2012.
This year, for the first time, an integrated reporting approach is used, aiming at a concise communication about how TITAN’s strategy, governance, performance and prospects lead to the creation of value over the short, medium and long term. The Integrated Reporting Framework (Consultation Draft of the International Reporting Framework), was used as guidance to develop the new form of the Report.
Moreover, TITAN Group has incorporated the following international standards:• AA1000SES,forstakeholderengagement
• WBCSD/CSIProtocolsformeasuringandassessingSafetyperformanceandCO2 emissions
• GlobalReportingInitiativeGuidelines(GRIG3.1)
• GlobalCompactcriteriaforCommunicatingonProgressregardingtheintegrationandapplicationofthe10principles
The printed version of the 2012 TITAN Group Integrated Report is the summary version of the independently assured fully detailed online Report, which is available through the following address: www.titan-cement.com
Accordingly, the online Report has been rated A+ for GRI G3.1 assurance level, and has been deemed to meet the “advanced”levelfortheU.N.GlobalCompactCommunicationonProgress.TheAuditors’Reportprovidesastatementonhow this Report meets the above standards and makes recommendations for further improvement.
StakeholdersmayrequesttheprintedsummaryoftheReportatthefollowingcontacts:MariaAlexiou,CSRSeniorManager([email protected])AfroditiSylla,InvestorRelationsOfficer([email protected]).
Wethankyouforyourattentionandwelcomeyourfeedbackinordertohelpusfurtherimproveourperformance.

Contents
MESSAGE FROM THE CEO .................................................................................. 4
ABOUT TITAN GROUP ......................................................................................... 6
> Geographical presence ........................................................................................................................... 6
> Governing objective and values ............................................................................................................ 8
> Five-year key figures ............................................................................................................................... 9
OUR INDUSTRY AND OUR FOOTPRINT ............................................................. 10
OUR BUSINESS MODEL AND STRATEGY ........................................................... 12 > Our strategy to enhance sustainable growth .....................................................................................12
> Stakeholder engagement and collaborative action ...................................................................................13
CORPORATE GOVERNANCE AND RISK MANAGEMENT ..................................... 14 > Board of Directors, composition and committees ............................................................................14
> Managing risks and opportunities: the case of “GAEA” .....................................................................16
GROUP PERFORMANCE REVIEW ...................................................................... 18 > Financial ..................................................................................................................................................18
> Social ......................................................................................................................................................22
> Environmental ........................................................................................................................................26
> Performance review by region and country ...............................................................................30
NOTABLE INFORMATION .................................................................................. 38 > Recognitions and 2012 Awards ...........................................................................................................38
> Summary financial statements and certified auditor’s accountant’s report ..................................40
> Titan Group cement plants WBCSD/CSI progress review .................................................................46

Message from the CEO
FACING ANOTHERCHALLENGING YEAROverallmarketconditionsremainedchallenging in most of our markets in2012.InSoutheasternEurope,thestate of local economies, affected bytheEurozonecrisis,deteriorated,driving demand for our products lower. InEgypt,demandprovedresilient,butsignificantly increased input costs and new production capacities combined to adversely affect operating margins. In Greece, in the context of an economic depression, demand for building materials is estimated to have declined byafurther35%,tobelowonequarterofitslevelin2006.Onamorepositivenote, sales remained high in Turkey and startedtorecoverintheU.S.A.,albeitfrom a very low base.
Withinthiscontext,wetookappropriateinitiatives: we implemented a restructuring plan to reduce costs, yielding over €25 million of annual savings; we generated free cash-flow from operating activities of €140 million; we reduced net debt by €112 million, with the help of disposals.
Despiteourefforts,EBITDAdeclinedby 19.8% to €196 million. The Group posted a net loss of €24.5 million. This is the first time since 1951, that TITAN recordsaloss.TheBoardofDirectorshas decided to propose to the AGM of shareholders that no dividend be distributed for fiscal year 2012.
ADAPTING OUR STRATEGYAs we enter the sixth year of a long and severe crisis, the time is opportune to make a critical assessment of the past, as well as to plan for the future. During the decade prior to 2008, TITAN profited from attractive market and growthconditions.Werodethewaveto transform the Group from a Greek producerwithastakeinaU.S.plantanda total capacity of a little over 6 million tons to a 25 million ton multi-regional, vertically integrated producer, with a diversified geographical footprint across four continents. In the process, we maintained a return on capital employed well in excess of our cost of capital, creatingvalueforourshareholders.Weachieved this while living by our values of respect for people, society and the environment. And we did so proactively, going above and beyond what was
requiredofus:wenotonlytriedto“doless harm”, but pursued opportunities to “do more good”.
Startingin2008,weshiftedprioritiesinorder to adjust to new realities. For the past five years we have been single-mindedly and consistently focused on a few key priorities: generating free cash-flow to increase financial flexibility, reducing costs to adjust to lower demand, and pursuing bolt-on growth initiatives, mostly to grow our presence in emerging markets.
Since2008,anddespitethecollapseof our two most important markets, GreeceandtheU.S.A.,wehavereduceddebt by almost 50% to just €596 million attheendof2012.Wehaveexpandedcapacity by almost 20%, mostly in emergingmarkets.Wehavereducedfixedcostsby16%,SG&Aby22%,andmore than that on a like-for-like basis; and we achieved this without making a capital call on our shareholders.
As importantly, throughout this crisis, we have also retained our focus on the triple bottom line: we have accelerated our efforts to improve our safety culture; we have invested to reduce our carbon footprint with, to date, more limited success than we would have wished, but doing a lot of the groundwork for future improvements; we have taken a number of - often innovative - initiatives to engage our stakeholders at the local level; and we have intensified our engagement at the global level, in particular through our own commitment totheCementSustainabilityInitiativewithintheWBCSDandtotheU.N.GlobalCompact.
INTRODUCING INTEGRATED REPORTINGCorporateSocialResponsibilityisdeeply embedded in our Values and our way of doing business, as has become apparent throughout our history and duringthistimeofcrisis.Wehavethusbeen encouraged to change the way we report this year: 30 years after TITAN became one of the first companies in GreecetoissueaseparateSocialReport,in addition to the Annual Report, we have taken the next step forward in merging the two traditional Reports intooneintegratedReport.Webelievethis approach, in line with what is today increasingly viewed as best practice,
4 Message from the CEO4 About
TITAN Group6 OurIndustryandour Footprint10 OurBusinessModel
andStrategy12

Dimitri PapalexopoulosChief Executive Officer
betterreflectsthefactthatCSRisnotancillary to our business, but forms an integral part of it.
POSITIONED FOR THE FUTURE2013 is expected to be another demanding year for TITAN. MarketsinSoutheasternEuropewillcontinue to be adversely impacted bytheEurozonecrisis.Demandfor building materials is not expected to recover soon.The economy in Greece will contract forthesixthconsecutiveyear.Bothhousing and infrastructure spending face significant headwinds. It is therefore anticipated that there is scope for further decline in demand for building materials from current low levels, at least for the first half of 2013. InEgypt,politicalandeconomicwoesappear to be escalating in recent months and uncertainty is high. Against such a backdrop, the smooth operation of the plants is challenging and production costs have been increasing. Although current estimates suggest cement demand will remain resilient in 2013, the increase in the cost of production and theweakeningoftheEgyptianpoundareexpected to negatively affect results.Onthepositiveside,marketconditionsremain positive in Turkey. Also importantly for TITAN, the residential market is now clearly recovering in the U.S.A.,therebybenefitingthemarketforbuilding materials. Given the considerable uncertainties of today’s outlook, we remain cautious, choosing not to change our conservative stanceofthelastfewyears.Whenconfidence and broader growth in our markets return, we will be well positionedtocapturetheupside.Wehave good assets in good markets; we have a healthy balance sheet and a lean structure; we have significant operating leverage out of existing assets; and, most of all, we have committed and motivated people. Pleasejoinmeinthankingthemfortheircontribution and their continuing efforts.
1997 2008 2012 4-year Change
Cement Capacity, million tons (1) 6 21 25 +19%
% Cement CapacityinEmergingMarkets 0% 45% 53% +8 percentage
points
CementSales,milliontons(2) 17.2 16.1 -6%
EBITDA,€million 380 196 -48%
%EBITDAinEmergingMarkets 45% 81% +36 percentage
points
FixedCostincl.SG&A,€million 400 334 -16%
Employees(like-for-like)(3) -28%
Net Debt, € million 1,114 596 -47%
TotalEquity,€ million 1,434 1,660 +16%
Total Assets, € million 3,194 3,032 -5%(1) Cement capacity includes cementitious materials(2) Cement sales include clinker and cementitious materials(3) For plants in existence in 2008
31 Dec’08 31 Dec’12 Change
SharePrice(TITK) 13.90 13.96 0%
ATHEXGeneralIndex 1,787 908 -49%
ShareCapital(Number of shares excl. treasury stock) 81,353,158 81,514,912
February 22, 2012100th anniversary of TITAN’s listing on the Athens Exchange
5Corporate Governanceand Risk Management14 GroupPerformanceReview18 Notable
Information38
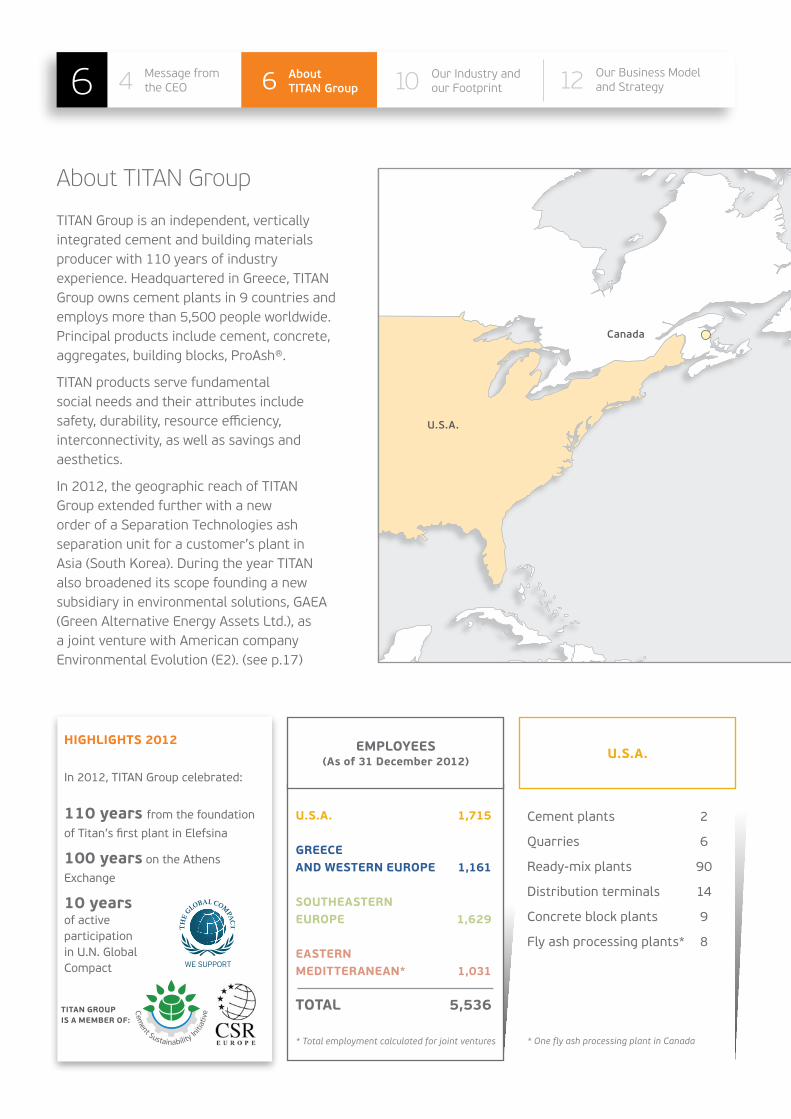
Cement plants 2
Quarries 6
Ready-mix plants 90
Distribution terminals 14
Concrete block plants 9
Fly ash processing plants* 8
* One fly ash processing plant in Canada
U.S.A.EMPLOYEES(As of 31 December 2012)
TITAN Group is an independent, vertically integrated cement and building materials producer with 110 years of industry experience.HeadquarteredinGreece,TITANGroup owns cement plants in 9 countries and employs more than 5,500 people worldwide. Principalproductsincludecement,concrete,aggregates,buildingblocks,ProAsh®.
TITAN products serve fundamental social needs and their attributes include safety, durability, resource efficiency, interconnectivity, as well as savings and aesthetics.
In 2012, the geographic reach of TITAN Group extended further with a new orderofaSeparationTechnologiesashseparation unit for a customer’s plant in Asia(SouthKorea).DuringtheyearTITANalso broadened its scope founding a new subsidiaryinenvironmentalsolutions,GAEA(GreenAlternativeEnergyAssetsLtd.),asa joint venture with American company EnvironmentalEvolution(E2).(seep.17)
HIGHLIGHTS 2012
In 2012, TITAN Group celebrated:
110 years from the foundation
of Titan’s first plant in Elefsina
100 years on the Athens
Exchange
10 yearsof activeparticipationin U.N. GlobalCompact
U.S.A. 1,715
GREECEAND WESTERN EUROPE 1,161
SOUTHEASTERNEUROPE 1,629
EASTERNMEDITTERANEAN* 1,031
TOTAL 5,536
* Total employment calculated for joint ventures
U.S.A.
Canada
TITAN GROUPIS A MEMBER OF:
About TITAN Group
OurIndustryandour Footprint106 Message from
the CEO4 AboutTITAN Group6 Our Industry and
our Footprint10 OurBusinessModelandStrategy12
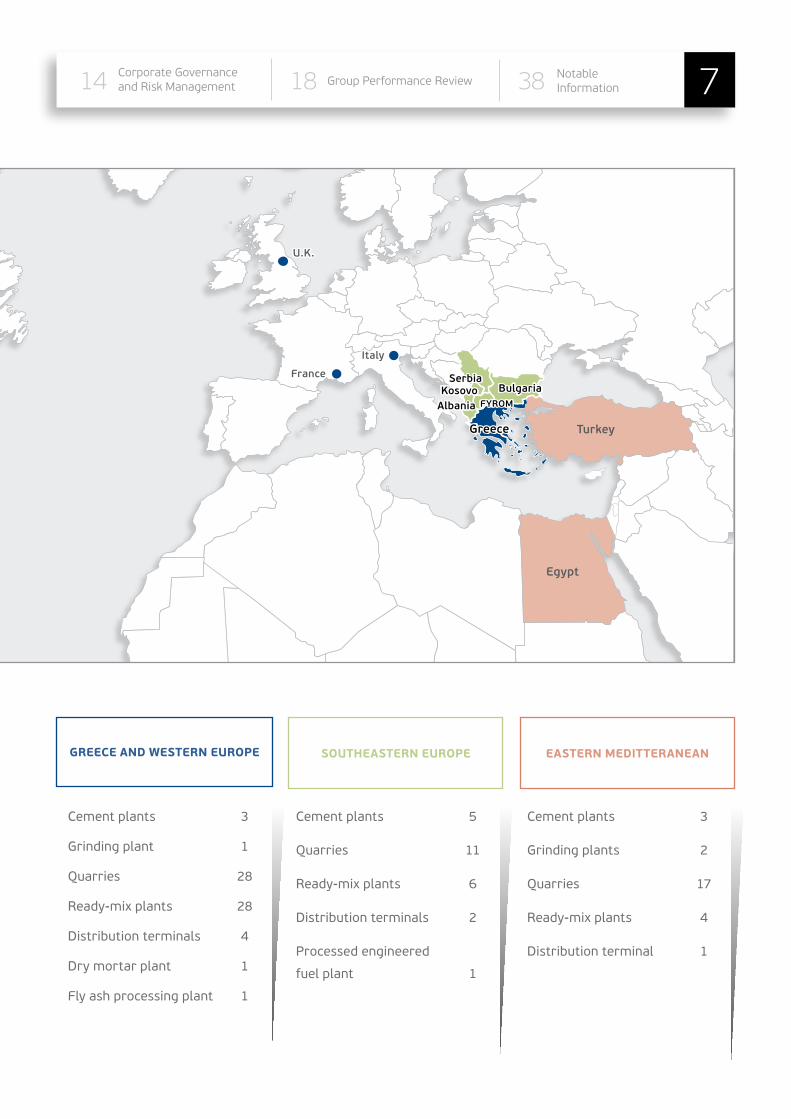
Cement plants 3
Grinding plants 2
Quarries 17
Ready-mix plants 4
Distribution terminal 1
SOUTHEASTERN EUROPE
Cement plants 3
Grinding plant 1
Quarries 28
Ready-mix plants 28
Distribution terminals 4
Dry mortar plant 1
Fly ash processing plant 1
Cement plants 5
Quarries 11
Ready-mix plants 6
Distribution terminals 2
Processed engineered
fuel plant 1
EASTERN MEDITTERANEANGREECE AND WESTERN EUROPE
Turkey
Egypt
BulgariaSerbia
U.K.
France
Italy
KosovoAlbania FYROM
Greece
Corporate Governanceand Risk Management14 GroupPerformanceReview18 Tables38 7Corporate Governanceand Risk Management14 GroupPerformanceReview18 38 Notable
Information
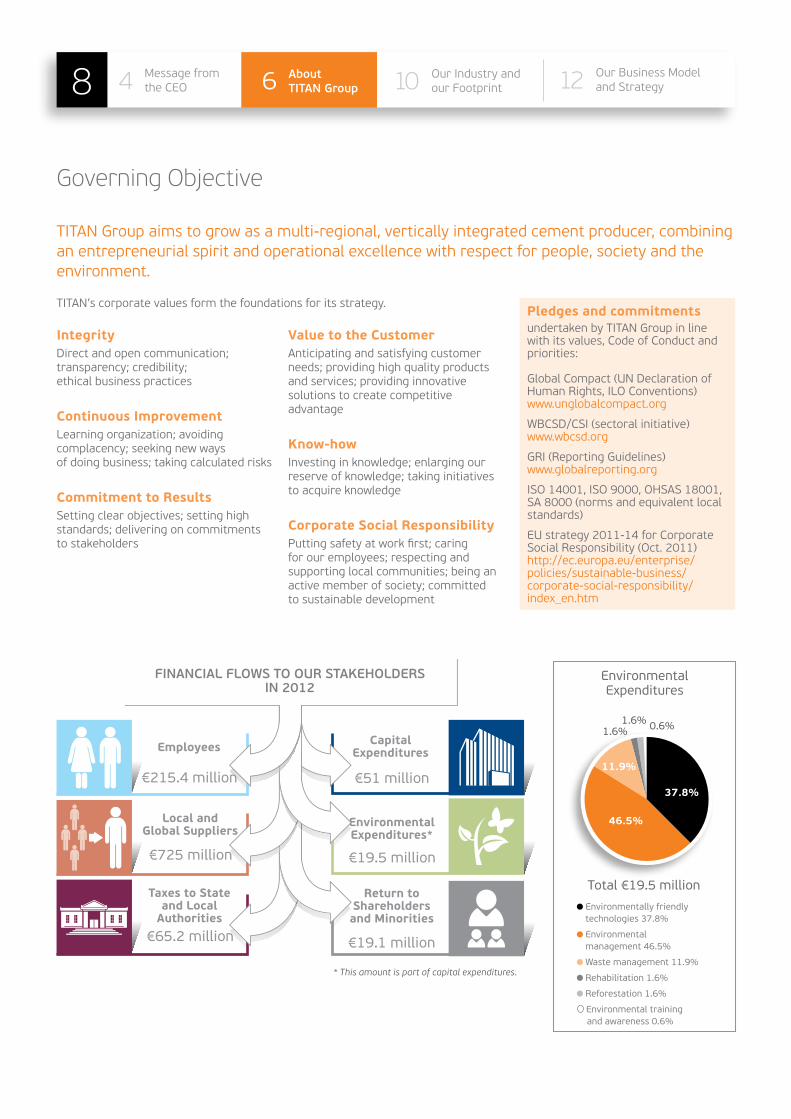
Governing Objective
TITAN Group aims to grow as a multi-regional, vertically integrated cement producer, combining an entrepreneurial spirit and operational excellence with respect for people, society and the environment.
IntegrityDirect and open communication; transparency; credibility;ethical business practices
Continuous ImprovementLearningorganization;avoidingcomplacency; seeking new waysof doing business; taking calculated risks
Commitment to ResultsSettingclearobjectives;settinghighstandards; delivering on commitmentsto stakeholders
Value to the CustomerAnticipating and satisfying customer needs;providinghighqualityproductsand services; providing innovative solutions to create competitive advantage
Know-howInvesting in knowledge; enlarging our reserve of knowledge; taking initiatives toacquireknowledge
Corporate Social ResponsibilityPuttingsafetyatworkfirst;caringfor our employees; respecting and supporting local communities; being an active member of society; committedto sustainable development
CapitalExpenditures
€51 million
Return to Shareholdersand Minorities
€19.1 million
Environmental Εxpenditures*
€19.5 million
Employees
€215.4 million
€65.2 million
€725 million
Local andGlobal Suppliers
Taxes to Stateand Local
Authorities
FINANCIAL FLOWS TO OUR STAKEHOLDERSIN 2012
EnvironmentalExpenditures
0.6%1.6%1.6%
46.5%
11.9%
37.8%
Total €19.5 million
Environmentally friendly technologies 37.8%
Environmental management 46.5%
Waste management 11.9%
Rehabilitation 1.6%
Reforestation 1.6%
Environmental training and awareness 0.6%
Pledges and commitmentsundertaken by TITAN Group in line with its values, Code of Conduct and priorities:
Global Compact (UN Declaration of HumanRights,ILOConventions)www.unglobalcompact.org
WBCSD/CSI(sectoralinitiative)www.wbcsd.org
GRI (Reporting Guidelines)www.globalreporting.org
ISO14001,ISO9000,OHSAS18001,SA8000(normsandequivalentlocalstandards)
EUstrategy2011-14forCorporateSocialResponsibility(Oct.2011)http://ec.europa.eu/enterprise/policies/sustainable-business/corporate-social-responsibility/index_en.htm
* This amount is part of capital expenditures.
TITAN’s corporate values form the foundations for its strategy.
OurIndustryandour Footprint108 Message from
the CEO4 AboutTITAN Group6 Our Industry and
our Footprint10 OurBusinessModelandStrategy12

F I N A N C I A L 2008 2009 2010(3) 2011 2012 (€ thousand)
Total Assets 3,194,090 3,005,620 3,082,910 3,269,007 3,032,042
Invested Capital 2,509,873 2,420,127 2,344,921 2,265,190 2,130,054
Shareholders Equity 1,434,134 1,460,188 1,710,824 1,700,448 1,659,941
Turnover 1,578,458 1,360,571 1,350,488 1,091,404 1,130,660
EBITDA 380,052 332,695 315,085 244,058 195,838
Earnings before Tax and Minority Interest 210,016 158,139 130,032 37,739 -1,302
Earnings after Tax and Minority Interest 208,224 123,393 103,075 11,011 -24,516
Basic Earnings per Share 2.53 1.52 1.27 0.14 -0.30
Net Dividend (1) 35,510 15,224 6,565 0 0
Dividend per Share 0.42 0.18 0.08 0.00 0.00
Number of Shares As At December 31st 84,546,774 84,576,118 84,613,840 84,632,528 84,632,528
Interest Coverage Ratio 5.07 4.67 3.97 1.98 1.04
Net Debt to EBITDA Ratio 2.93 2.92 2.46 2.90 3.04
Return on Invested Capital (2) 9.9% 4.9% 4.7% 0.9% -0.9%
(1) : In 2010 in addition to the dividend the Company distributed €8.7 million (€0.10/share) from special reserves which had already been taxed. (2) : Net Profit after taxes and before Minority interest divided by Average Invested Capital. (3) : Restated due to a change in accounting policy.
S O C I A L 2008 2009 2010 2011 2012
Total value distributed to stakeholders, € million 1,551.2 1,323.2 1,235.3 1,026.6 1,075.7
Total value distributed to employees (4), € million 267.3 235.1 239.1 218.1 215.4
Direct employment 6,504 5,903 6,161 5,640 5,536
Employee fatalities 1 0 0 0 1
Employee lost time injuries frequency rate (LTIFR) 3.42 2.64 2.33 1.49 1.38
Total value distributed to local & international suppliers, € million
936.6 768 801.8 642.9 725.0
Contribution to the communities, € million 1.7 2.0 2.2 1.6 1.3
(4) : To employees for salaries, pensions and local benefits, including additional benefits beyond those provided by law.
E N V I R O N M E N T 2008 2009 2010 2011 2012
Gross direct CO2 specific emissions (kg/tProduct) 649.4 633.8 654.2 623.8 658.7
Total heat consumption, TJ 42,924 37,257 43,155 36,828 41,152
Total alternative fuels, metric tons 21,160 30,570 32,290 30,630 68,050
Specific water consumption (lt/tCement) 569.3 447.8 362.3 340.1 300.0
Environmental expenditures, € million 26.6 22.5 27.1 36.6 19.5
Group Performance 5-year key figures
Corporate Governanceand Risk Management14 GroupPerformanceReview18 Tables38 9Corporate Governanceand Risk Management14 GroupPerformanceReview18 38 Notable
Information
C
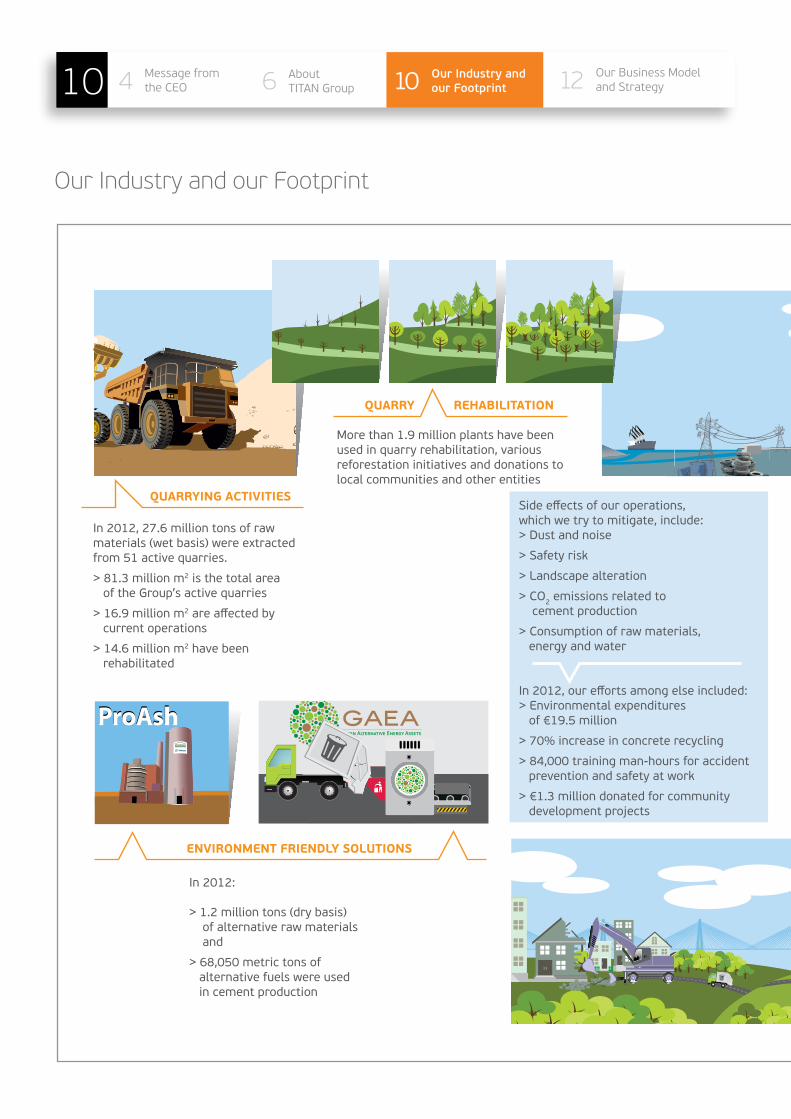
Our Industry and our Footprint
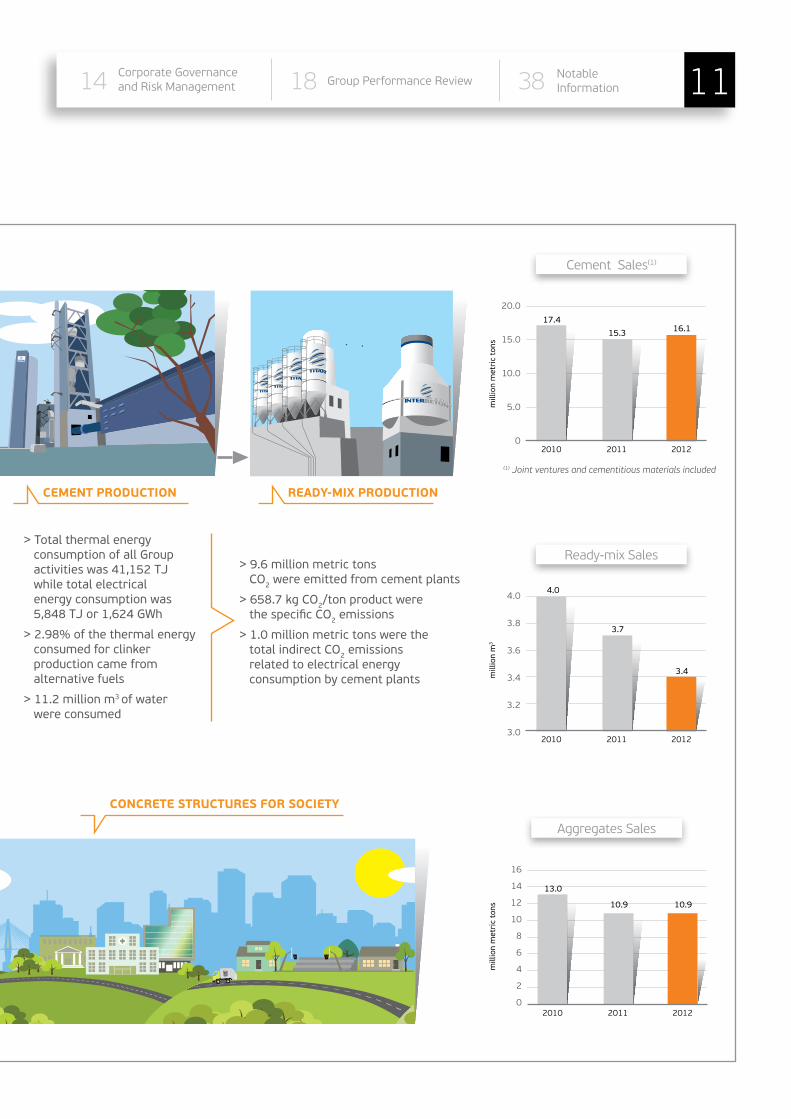
> Total thermal energy consumption of all Group activities was 41,152 TJ while total electrical energy consumption was 5,848 TJ or 1,624 GWh
> 2.98% of the thermal energy consumed for clinker production came from alternative fuels
> 11.2 million m3 of water were consumed
In 2012, 27.6 million tons of raw materials (wet basis) were extracted from 51 active quarries.
> 81.3 million m2 is the total area of the Group’s active quarries
> 16.9 million m2 are affected by current operations
> 14.6 million m2 have been rehabilitated
More than 1.9 million plants have been used in quarry rehabilitation, various reforestation initiatives and donations to local communities and other entities
Side effects of our operations,which we try to mitigate, include:> Dust and noise
> Safety risk
> Landscape alteration
> CO2 emissions related to cement production
> Consumption of raw materials, energy and water
In 2012, our efforts among else included: > Environmental expenditures of €19.5 million
> 70% increase in concrete recycling
> 84,000 training man-hours for accident prevention and safety at work
> €1.3 million donated for community development projects
> 9.6 million metric tons CO2 were emitted from cement plants
> 658.7 kg CO2/ton product were the specific CO2 emissions
> 1.0 million metric tons were the total indirect CO2 emissions related to electrical energy consumption by cement plants
QUARRYING ACTIVITIES
QUARRY REHABILITATION
CEMENT PRODUCTION READY-MIX PRODUCTION
In 2012:
> 1.2 million tons (dry basis) of alternative raw materials and
> 68,050 metric tons of alternative fuels were used in cement production
ENVIRONMENT FRIENDLY SOLUTIONS
CONCRETE STRUCTURES FOR SOCIETY
OurIndustryandour Footprint10Message from
theCEO4 AboutTITAN Group6 Our Industry and
our Footprint10 OurBusinessModelandStrategy121010
C
mill
ion
met
ric
tons
mill
ion
met
ric
tons
(1) Joint ventures and cementitious materials included
CementSales(1)
20.0
15.0
10.0
5.0
020122010 2011
AggregatesSales
16
14
12
10
8
6
4
2
020122010 2011
> Total thermal energy consumption of all Group activities was 41,152 TJ while total electrical energy consumption was 5,848 TJ or 1,624 GWh
> 2.98% of the thermal energy consumed for clinker production came from alternative fuels
> 11.2 million m3 of water were consumed
In 2012, 27.6 million tons of raw materials (wet basis) were extracted from 51 active quarries.
> 81.3 million m2 is the total area of the Group’s active quarries
> 16.9 million m2 are affected by current operations
> 14.6 million m2 have been rehabilitated
More than 1.9 million plants have been used in quarry rehabilitation, various reforestation initiatives and donations to local communities and other entities
Side effects of our operations,which we try to mitigate, include:> Dust and noise
> Safety risk
> Landscape alteration
> CO2 emissions related to cement production
> Consumption of raw materials, energy and water
In 2012, our efforts among else included: > Environmental expenditures of €19.5 million
> 70% increase in concrete recycling
> 84,000 training man-hours for accident prevention and safety at work
> €1.3 million donated for community development projects
> 9.6 million metric tons CO2 were emitted from cement plants
> 658.7 kg CO2/ton product were the specific CO2 emissions
> 1.0 million metric tons were the total indirect CO2 emissions related to electrical energy consumption by cement plants
QUARRYING ACTIVITIES
QUARRY REHABILITATION
CEMENT PRODUCTION READY-MIX PRODUCTION
In 2012:
> 1.2 million tons (dry basis) of alternative raw materials and
> 68,050 metric tons of alternative fuels were used in cement production
ENVIRONMENT FRIENDLY SOLUTIONS
CONCRETE STRUCTURES FOR SOCIETY
10.9 10.9
13.0
17.4
15.3
mill
ion
m3
Ready-mixSales
4.0
3.8
3.6
3.4
3.2
3.020122010 2011
4.0
3.7
3.4
16.1
Corporate Governanceand Risk Management14 GroupPerformanceReview18 Tables38 Notable
Information 11Corporate Governanceand Risk Management14 GroupPerformanceReview18 38 Notable
Information

ENHANCESUSTAINABLEGROWTH
Value-creation is at the center of what we do. Thus special emphasis is given on increasing value for all stakeholders through the concept of “reaching out and adding value” whereby we convey best practices, leveraging our expertise, and we add value beyond our Group’s financial capital, knowledge and human resources through the multiplier effect.
Strategy
Geographical DiversificationWe extend our business and strengthen our asset portfolio through acquisitions and greenfield development in attractive new markets.
Continuous Competitiveness ImprovementWe continuously strive to improve our cost structure and enhance our competitive position by investing in our asset base and by implementing new methods and processes throughout our business.
Vertical IntegrationWe extend our footprint into all products of the heavy building materials value chain, gaining greater diversification, accessing new business opportunities and addressing the needs of the end customer.
Focus on Human Capital and CSRWe develop and continuously improve our good relationships with all internal and external stakeholders based on mutual respect and understanding.
Weendeavortoachieveour governing objective by using the four axes of our CorporateStrategy,whichhas been developed and is continuallyrefinedinthecontext of the global and local markets in which we operate.
In 2012, TITAN remained focused on its strategy of fostering sustainability, balancing short and long-term impacts and opportunities and investing in efforts leading to continuous improve-ment.
Ourbusinessmodelrelieson local management, to best serve the needs of all key stakeholders and at the same time provides a coher-ent and robust management framework that empowers our people with the freedom to manage and make deci-sions aligned with TITAN val-ues and principles.
DO MORE GOODDO LESS HARM
CONTINUOUSIMPROVEMENT
FOCUS ON HUMANCAPITAL AND CSR
COMPETITIVENESSGEOGRAPHICAL DIVERSIFICATION
VERTICAL INTEGRATION
OurIndustryandour Footprint1012 Message from
the CEO4 AboutTITAN Group6 Our Industry and
our Footprint10 Our Business Modeland Strategy12

TITAN Group has acknowledged early on that stakeholder engagement and collaborative action are conditions for meeting sustainability challenges along with business objectives.
Since2007,amoresystematicandprinciples-based process has been followed, based on the international standardslikeAA1000SES,enablingthe inclusion of stakeholder dialogue and engagement in our strategy, so as to successfully translate it into actions that meet local needs.
Aiming at continuous improvement of our social and environmental perfor-mance, we seek feedback from stake-holdersmainlythroughorganizedforums, panels, and continuous commu-nication of our performance. Accord-ingly,theGroupReportaswellasCSRreporting at local level, is a critical tool to increase transparency while facilitat-ing dialogue with stakeholders.
Stakeholderengagementisafive-stepprocess as presented in the diagram below.
The outcome of this process is summa-rizedintheMatrixbelow,highlightingthe most relevant and significant issues for TITAN Group and its key stakehold-ers.
Commitment to stakeholder engagement and collaborative action
LO
W
ME
DIU
M
HIG
H
LE
VE
L O
F I
NT
ER
ES
T T
O S
TA
KE
HO
ILD
ER
S
L O W M E D I U M H I G H
I M P A C T O N T I T A N
LICENSE TO OPERATE
HUMANRIGHTS
WATER
UNEMPLOYMENT
INTEGRITYANDTRANSPARENCY
LABORRIGHTS
HEALTH
BRIBERYANDCORRUPTION
SAFETY
ACCESS TO RAW MATERIALS
ENERGYANDCLIMATECHANGE
PROMOTINGTITAN’SVALUES
RESPONDING TO THEECONOMIC CRISIS
EffortstoExpandCollaborative Action in 2012
Rio+20Summit(WBCSD/GlobalCompact Forum)
1stU.N.GlobalCompactSEERegionalNetworking Conference in Thessaloniki
U.N.HumanRights2012SummitinGeneva
GlobalStakeholders’consultationonWBCSD/CSIGuidelinesforQuarryRehabilitation
WBCSD/CSIWorkingGrouponSupplyChain
CSREurope’sCollaborativeVenturefor«Valuing non-financial performance»
1st voluntary public-private cooperation agreement between Cement Industry inGreeceandMinistryofEnvironment,EnergyandClimateChange
SafetyatWorkCollaborativeProgramwithBEST(StudentAssociation)
SafetyatHomeTrainingandAwarenessBuildingPrograminGreece
Participationincollaborativeeffortsarealso considered as an opportunity to engagewithcriticalstakeholders.BeingacorememberoftheCementSustain-abilityInitiative(CSI),launchedbytheWorldBusinessCouncilforSustainableDevelopment(WBCSD),TITANhasincor-poratedoverthelastdecadetheCSI’sguidelines and protocols into its opera-tions. At the same time as leveraging the learning opportunities provided by itsparticipationintheCSI,TITANhasgiven back through engaging its special-ist and managerial resources to this important initiative of industry peers.
In2012TITANbecametheCSIco-chairand assumed the responsibility to co-chairtheBiodiversityandLandStew-ardship Task Force.
The signature in 2012 of the 1st volun-tary public-private cooperation agree-ment between the Cement Industry in GreeceandMinistryofEnvironment,EnergyandClimateChange,isanindicative example of TITAN’s efforts to contribute both to broader public awareness and to win-win solutions for business and society.
StakeholderEngagementProcess
Materiality Assessment Matrix
Corporate Governanceand Risk Management14 GroupPerformanceReview18 Tables38 13Corporate Governanceand Risk Management14 GroupPerformanceReview18 38 Notable
Information

Governance
BOARDOFDIRECTORS
Chairman
ANDREASCANELLOPOULOS Non-executive Director since 1 March 2006.
ChairmanoftheBoardofDirectorssince 1996, Managing Director from 1983to1996andmemberoftheBoardof Directors since 1971.
Vice Chairman
EFSTRATIOS-GEORGIOS(TAKIS)ARAPOGLOU
SeniorIndependentNon-executiveDirector since 18 May 2010 (1st term in office).
Chief Executive Officer
DIMITRIPAPALEXOPOULOS ExecutiveDirectorsince1992,Managing Director since 1996 and an executive of the Company since 1989.
Members
NELLOSCANELLOPOULOS ExecutiveDirectorsince1992.
ExternalRelationsDirectorofTITANGroup since 1996.
TAKIS-PANAGIOTISCANELLOPOULOS ExecutiveDirectorsince2007.
Investor Relations Director of TITAN Group since 2001.
GEORGEDAVID Independent Non-executive Director since 2001 (4th term in office).
VASSILIOSFOURLIS Independent Non-executive Director since 2007 (2nd term in office).
PANAGIOTISMARINOPOULOS Independent Non-executive Director since 2004 (3rd term in office).
ALEXANDRAPAPALEXOPOULOU-BENOPOULOU ExecutiveDirectorsince1995.
StrategicPlanningDirectorofTITANGroup since 1997.
PETROSSABATACAKIS Independent Non-executive Director since 2010 (1st term in office).
MICHAILSIGALAS ExecutiveDirectorsince1998.
SoutheasternEuropeandEasternMediterranean Regions Director and International Trade Director of TITAN Group.
SPYRIDONTHEODOROPOULOS Independent Non-executive Director since 2001 (4th term in office).
EFTYCHIOSVASSILAKIS Independent, Non-executive Director since 10 May 2007 (2nd term in office).
EFTHYMIOSVIDALIS ExecutiveDirectorsinceJune2011.
FromMay2004untilJune2011heserved as an Independent Non-execu-tive director.
Company Secretary
ELENIPAPAPANOUAttorney at lawe-mail:[email protected]
BOARD OF DIRECTORS COMMITTEES
AuditCommittee
PetrosSabatacakis,independent,Non-executiveBoardmember
VassiliosFourlis,independentNon-executiveBoardmember
EftychiosVassilakis,independent,Non-executiveBoardmember
PanagiotisMarinopoulos,independent,Non-executiveBoardmember
SpyridonTheodoropoulos,independent,Non-executiveBoardmember
Chairman
Member
Member
Alternate Members
Alternate Members
RemunerationCommittee
GeorgeDavid,independent,Non-executiveBoardmember
PanagiotisMarinopoulos,independent,Non-executiveBoardmember
PetrosSabatacakis,independent,Non-executiveBoardmember
Chairman
Member
Member
Nomination & CorporateGovernance Committee
SpyridonTheodoropoulos,independent,Non-executiveBoardmember
Efstratios–Georgios(Takis)Arapoglou,independent,Non-executiveBoardmember
AndreasCanellopoulos,Non-executiveBoardmember
Chairman
Member
Member
OurIndustryandour Footprint1014 Message from
the CEO4 AboutTITAN Group6 Our Industry and
our Footprint10 Our Business Modeland Strategy12
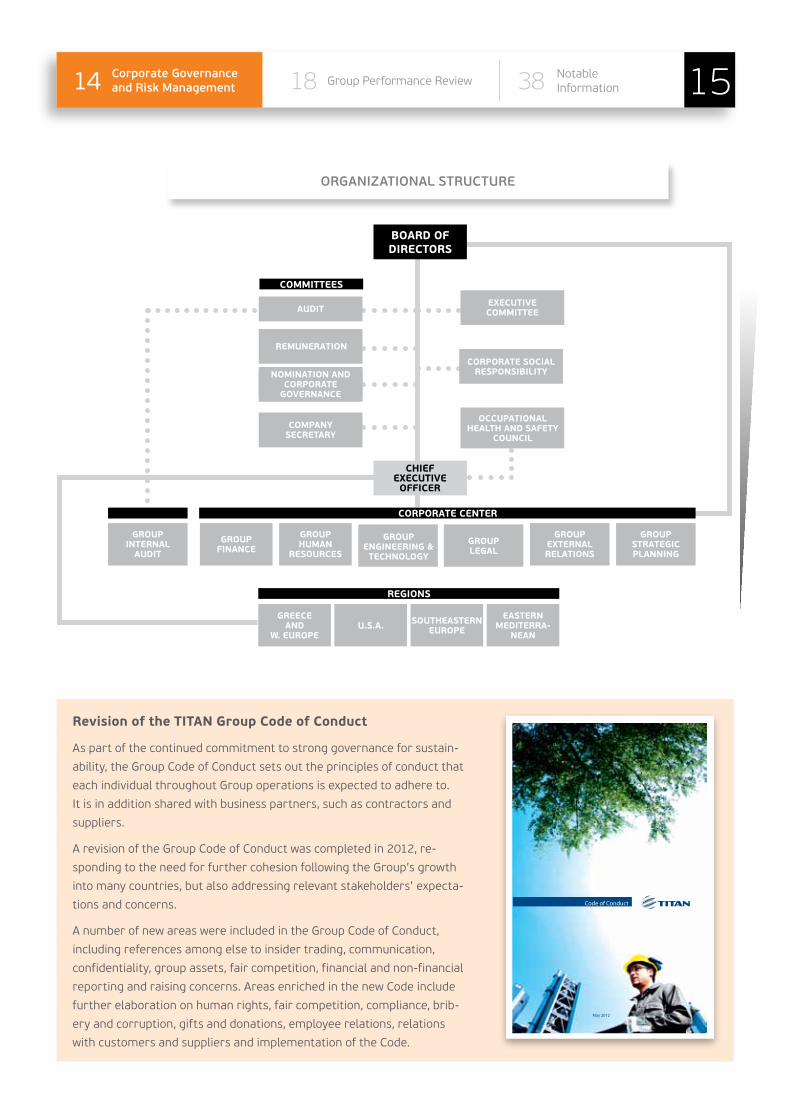
ORGANIZATIONAL STRUCTURE
As part of the continued commitment to strong governance for sustain-
ability, the Group Code of Conduct sets out the principles of conduct that
each individual throughout Group operations is expected to adhere to.
It is in addition shared with business partners, such as contractors and
suppliers.
A revision of the Group Code of Conduct was completed in 2012, re-
sponding to the need for further cohesion following the Group’s growth
into many countries, but also addressing relevant stakeholders’ expecta-
tions and concerns.
A number of new areas were included in the Group Code of Conduct,
including references among else to insider trading, communication,
confidentiality, group assets, fair competition, financial and non-financial
reporting and raising concerns. Areas enriched in the new Code include
further elaboration on human rights, fair competition, compliance, brib-
ery and corruption, gifts and donations, employee relations, relations
with customers and suppliers and implementation of the Code.
Revision of the TITAN Group Code of Conduct
Code of Conduct
May 2012
Corporate Governanceand Risk Management14 GroupPerformanceReview18 Tables38 Notable
Information 15Corporate Governanceand Risk Management14 Group Performance Review18 38
CHIEFEXECUTIVE
OFFICER
REMUNERATION
COMPANY SECRETARY
EXECUTIVE COMMITTEE
OCCUPATIONAL HEALTH AND SAFETY
COUNCIL
COMMITTEES
CORPORATE CENTER
REGIONS
CORPORATE SOCIAL RESPONSIBILITYNOMINATION AND
CORPORATE GOVERNANCE
BOARD OF DIRECTORS
GROUP FINANCE
GREECEAND
W. EUROPE
SOUTHEASTERNEUROPE
EASTERNMEDITERRA-
NEAN
GROUP HUMAN
RESOURCES
GROUP ENGINEERING &
TECHNOLOGY
GROUP LEGAL
GROUP EXTERNAL RELATIONS
GROUP STRATEGIC PLANNING
AUDIT
GROUP INTERNAL
AUDIT
U.S.A.
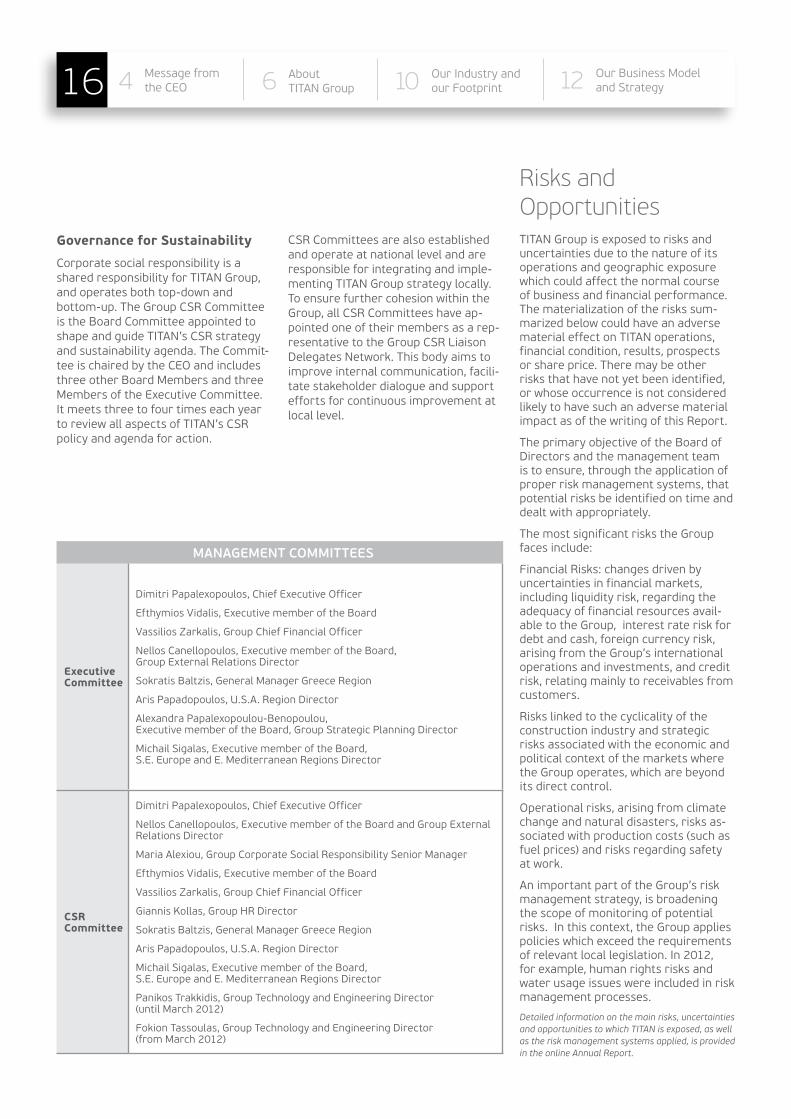
TITAN Group is exposed to risks and uncertainties due to the nature of its operations and geographic exposure which could affect the normal course of business and financial performance. Thematerializationoftheriskssum-marizedbelowcouldhaveanadversematerial effect on TITAN operations, financial condition, results, prospects or share price. There may be other risks that have not yet been identified, or whose occurrence is not considered likely to have such an adverse material impact as of the writing of this Report.
TheprimaryobjectiveoftheBoardofDirectors and the management team is to ensure, through the application of proper risk management systems, that potential risks be identified on time and dealt with appropriately.
The most significant risks the Group faces include:
Financial Risks: changes driven by uncertainties in financial markets, includingliquidityrisk,regardingtheadequacyoffinancialresourcesavail-able to the Group, interest rate risk for debt and cash, foreign currency risk, arising from the Group’s international operations and investments, and credit risk, relating mainly to receivables from customers.
Risks linked to the cyclicality of the construction industry and strategic risks associated with the economic and political context of the markets where the Group operates, which are beyond its direct control.
Operationalrisks,arisingfromclimatechange and natural disasters, risks as-sociated with production costs (such as fuel prices) and risks regarding safety at work.
An important part of the Group’s risk management strategy, is broadening the scope of monitoring of potential risks. In this context, the Group applies policieswhichexceedtherequirementsof relevant local legislation. In 2012, for example, human rights risks and water usage issues were included in risk management processes.
Detailed information on the main risks, uncertainties and opportunities to which TITAN is exposed, as well as the risk management systems applied, is provided in the online Annual Report.
Governance for Sustainability
Corporate social responsibility is a shared responsibility for TITAN Group, and operates both top-down and bottom-up.TheGroupCSRCommitteeistheBoardCommitteeappointedtoshapeandguideTITAN’sCSRstrategyand sustainability agenda. The Commit-teeischairedbytheCEOandincludesthreeotherBoardMembersandthreeMembersoftheExecutiveCommittee.It meets three to four times each year toreviewallaspectsofTITAN’sCSRpolicy and agenda for action.
MANAGEMENT COMMITTEES
Executive Committee
DimitriPapalexopoulos,ChiefExecutiveOfficer
EfthymiosVidalis,ExecutivememberoftheBoard
VassiliosZarkalis,GroupChiefFinancialOfficer
NellosCanellopoulos,ExecutivememberoftheBoard,GroupExternalRelationsDirector
SokratisBaltzis,GeneralManagerGreeceRegion
ArisPapadopoulos,U.S.A.RegionDirector
AlexandraPapalexopoulou-Benopoulou,ExecutivememberoftheBoard,GroupStrategicPlanningDirector
MichailSigalas,ExecutivememberoftheBoard,S.E.EuropeandE.MediterraneanRegionsDirector
CSRCommittee
DimitriPapalexopoulos,ChiefExecutiveOfficer
NellosCanellopoulos,ExecutivememberoftheBoardandGroupExternalRelations Director
MariaAlexiou,GroupCorporateSocialResponsibilitySeniorManager
EfthymiosVidalis,ExecutivememberoftheBoard
VassiliosZarkalis,GroupChiefFinancialOfficer
GiannisKollas,GroupHRDirector
SokratisBaltzis,GeneralManagerGreeceRegion
ArisPapadopoulos,U.S.A.RegionDirector
MichailSigalas,ExecutivememberoftheBoard,S.E.EuropeandE.MediterraneanRegionsDirector
PanikosTrakkidis,GroupTechnologyandEngineeringDirector(until March 2012)
FokionTassoulas,GroupTechnologyandEngineeringDirector(from March 2012)
Risks andOpportunities
CSRCommitteesarealsoestablishedand operate at national level and are responsible for integrating and imple-menting TITAN Group strategy locally. To ensure further cohesion within the Group,allCSRCommitteeshaveap-pointed one of their members as a rep-resentativetotheGroupCSRLiaisonDelegates Network. This body aims to improve internal communication, facili-tate stakeholder dialogue and support efforts for continuous improvement at local level.
OurIndustryandour Footprint1016 Message from
the CEO4 AboutTITAN Group6 Our Industry and
our Footprint10 Our Business Modeland Strategy12

Alternative fuels installation, GAEA Bulgaria
In2012TitanlaunchedanewinitiativecalledGAEA–GreenAlternativeEnergyAssetsLTDasajointventurewiththe
AmericanEnvironmentalEvolution(E2),acompanythatspecializesinthisdomain.TheaimofGAEAistobecomethe
alternativefuelssolutionproviderforTITANGroup.ThefirstoperationalsubsidiarywasestablishedinBulgariain
mid-2012 and provides solutions, removing and pre-treating household, commercial and industrial waste and replac-
ingconventionalfossilfuelsandrawmaterialsprimarilyinTITAN’sZlatnaPanegacementkilns,inBulgaria,aswellas
inotherindustrialfurnacesandutilitiesintheregion.GAEABulgariaoffersitswastesolutionsservicestobothpublic
andprivatelocalentitiesthroughaserviceagreementwithZlatnaPanega,allowingittooperateasanindependent
alternativefuelprocessingfacilityintheLovechregion.
ProcessingofwasteandproductionofPEF(ProcessedEngineeredFuel)takesplaceinthePEFinstallationwhichwas
commissionedattheendof2011andisthefirstofitskindinTITANGroup.PEFisafuelofuniformqualitymadefrom
variousnon-recyclablewastematerialsvaryingqualityandcomposition.ItsmainfeedmaterialcomesfromtheMunici-
palSolidWastedepositedintheSofialandfill,andduringprocessing,itismixedwithothercarefullyselectedhighheat
value industrial, commercial or biomass by-products.
ThestrategyofGAEABulgariaistobealowcost,flexiblewastemanagementandalternativefuelssolutionsprovider
thatwillcombineTITANandE2’sresourcestodevelopAlternativeFuelsforZlatnainasafe,efficientandsustainable
fashion,whileprovidingaservicetothewidercommunityandmaximizingsynergies.
Investing in a more sustainable and inclusive future
Corporate Governanceand Risk Management14 GroupPerformanceReview18 Tables38 Notable
Information 17Corporate Governanceand Risk Management14 Group Performance Review18 38

Group Financial Review 2012
In 2012, Group Turnover reached €1,131 million, posting a 3.6% increase comparedto2011.EarningsBeforeIn-terest,Tax,DepreciationandAmortiza-tion(EBITDA)declinedby19.8%,reach-ing €196 million. The Group posted a net loss, after minority interests and the provision for taxes, of €24.5 million compared to a net profit of €11 million in 2011.
For comparison purposes, it should be notedthat2011EBITDAincludeda€25 million gain relating to the refund oftheclaytaxfeeinEgypt.
The deterioration in Group results is due to the collapse of building activity in Greece, as well as the slowdown in SoutheasternEurope,whichsufferedthespillovereffectsoftheEurozonecrisis.Ontheotherhand,theEasternMediterranean markets once again made a significant positive contribu-tion,inparticularEgypt,wheredespitethe challenging backdrop, construction activity remained robust. Also on a positivenote,intheUnitedStatessignsof improvement progressively became evident during the course of the year.
Additional detail on the performance of each of TITAN’s four reporting regions can be found in the performance review chapters p.30-37
The Group’s focus on cash flow genera-tion continued to bear fruit. Free cash flow from operating activities in 2012 reached €140 million. Net debt was reduced by €112 million in 2012, closing the year at €596 million.
Additional detail on the Group’s borrowing structure and liquidity can be found in p.20
The Group is in a robust financial posi-tion with €284 million in cash and cash equivalentstogetherwith€479millionof undrawn committed bank facilities at year-end.
InJune2012,aspartofitsstrategyof forging strategic alliances, TITAN broadened its cooperation with the International Finance Corporation (IFC)intheBalkans.Specifically,theIFC invested €50 million in the Group’s subsidiariesoperatingintheF.Y.R.ofMacedonia,SerbiaandKosovoandacquiredthroughitsparticipationinTITAN Group subsidiary Cement Cyprus Limited,an11.49%minoritystakein
EBITDA
300
250
200
150
100
50
0
1.5%244.1
195.8
3.8 (52.1)
EBITDA2011
EBITDA2012
OrganicGrowth
TranslationImpact
-21.3%
€ million
2012 2011 2010
PerformancebyRegion2010-2012
Turnover ΕΒΙΤDA€ million
-30 0 30 60 90 120 150
Greece
U.S.A.
S.E.E.
E.Med.
32.1
35.3
86.8
86.7
137.9
127.7
5.8
(5.7)
3.6
€ million
0 100 200 300 400 500
Greece
U.S.A.
S.E.E.
E.Med.
Turnover
1,200
1,100
1,000
900
800
700Turnover
2011Turnover
2012OrganicGrowth
TranslationImpact
1,091.4 1,130.7
€ million
3.7%-0.1%(0.8)40.1
2012GroupNetProfitAfterTaxesandMinorities
20
10
0
-10
-20
-30
-40
-50
€ million
NPAT2012
(24.5)
Μinority Interest
5.0
Depreciation
7.9
Τaxes
(1.5)
Οther
(2.0)
NPAT2011
11.0
Ιnterest
(10.1)
FXGains/Losses
13.4
EBITDAVariance
(48.2)
240.2
369.5
225.1
296.0
268.7
303.7
241.2
277.8
437.2
316.9
236.3
360.6
86.8
63.9
94.0
OurIndustryandour Footprint1018 Message from
the CEO4 AboutTITAN Group6 Our Industry and
our Footprint10 Our Business Modeland Strategy12
the Group’s activities in the aforemen-tioned countries.
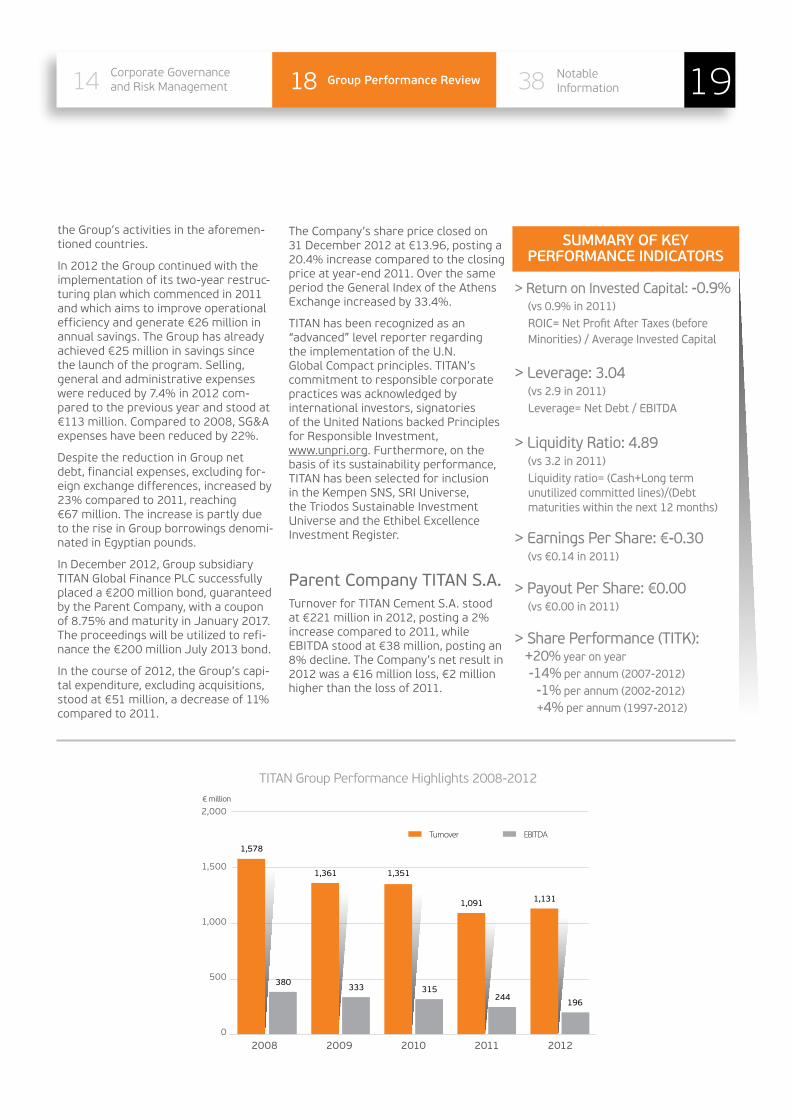
In 2012 the Group continued with the implementation of its two-year restruc-turing plan which commenced in 2011 and which aims to improve operational efficiency and generate €26 million in annual savings. The Group has already achieved €25 million in savings since thelaunchoftheprogram.Selling,general and administrative expenses were reduced by 7.4% in 2012 com-pared to the previous year and stood at €113million.Comparedto2008,SG&Aexpenses have been reduced by 22%.
Despite the reduction in Group net debt, financial expenses, excluding for-eign exchange differences, increased by 23% compared to 2011, reaching€67 million. The increase is partly due to the rise in Group borrowings denomi-natedinEgyptianpounds.
In December 2012, Group subsidiary TITANGlobalFinancePLCsuccessfullyplaced a €200 million bond, guaranteed bytheParentCompany,withacouponof8.75%andmaturityinJanuary2017.Theproceedingswillbeutilizedtorefi-nancethe€200millionJuly2013bond.
In the course of 2012, the Group’s capi-talexpenditure,excludingacquisitions,stood at €51 million, a decrease of 11% compared to 2011.
The Company’s share price closed on 31 December 2012 at €13.96, posting a 20.4% increase compared to the closing priceatyear-end2011.Overthesameperiod the General Index of the Athens Exchangeincreasedby33.4%.
TITANhasbeenrecognizedasan“advanced” level reporter regarding the implementation of the U.N. Global Compact principles. TITAN’s commitment to responsible corporate practices was acknowledged by international investors, signatoriesoftheUnitedNationsbackedPrinciplesfor Responsible Investment,www.unpri.org. Furthermore, on the basis of its sustainability performance, TITAN has been selected for inclusion intheKempenSNS,SRIUniverse,theTriodosSustainableInvestmentUniverseandtheEthibelExcellenceInvestment Register.
Parent Company TITAN S.A.TurnoverforTITANCementS.A.stoodat €221 million in 2012, posting a 2% increase compared to 2011, while EBITDAstoodat€38million,postingan8% decline. The Company’s net result in 2012 was a €16 million loss, €2 million higher than the loss of 2011.
SUMMARY OF KEYPERFORMANCE INDICATORS
> Return on Invested Capital: -0.9% (vs 0.9% in 2011) ROIC= Net Profit After Taxes (before Minorities) / Average Invested Capital
> Leverage: 3.04 (vs 2.9 in 2011) Leverage= Net Debt / EBITDA
> Liquidity Ratio: 4.89 (vs 3.2 in 2011) Liquidity ratio= (Cash+Long term unutilized committed lines)/(Debt maturities within the next 12 months)
> Earnings Per Share: €-0.30 (vs €0.14 in 2011)
> Payout Per Share: €0.00 (vs €0.00 in 2011)
> Share Performance (TITK): +20% year on year -14% per annum (2007-2012) -1% per annum (2002-2012) +4% per annum (1997-2012)
TITANGroupPerformanceHighlights2008-2012€ million
Turnover EBITDA
2008 2009 2010 2011 2012
2,000
1,500
1,000
500
0
380333 315
244196
1,578
1,361 1,351
1,091 1,131
Corporate Governanceand Risk Management14 GroupPerformanceReview18 Tables38 Notable
Information 19Corporate Governanceand Risk Management14 Group Performance Review18 19Corporate Governanceand Risk Management14 Group Performance Review 38 19Corporate Governance
and Risk Management14 Group Performance Review18 NotableInformation

Borrowings and Liquidity
Dynamic management through the business cycle
Active Portfolio Management Securing Robust Liquidity(As of 31 December 2012)
Extension of Debt Maturityand Diversification of Funding
LiquidityRatio(2): 4.89x
CashandCashEquivalents:€284 million
CommittedandUn-utilizedlines:€479 million
(2) Committed long term un-utilized facilities and available cash over short term debt.
€200millionBonddueJuly2013refinancedtoJanuary2017
39% of total credit facilities with international banks
20% non bank debt (debentures)
41% with Greek banks
TITAN has a conservative financial policyaimingtoalwaysretainadequateliquidity.Focusremainsonmaximiz-ing cash flow generation through cost savings programs, working capital management, limited capital invest-mentsandoptimizationofthebusinessportfolio.
These efforts continued to bear fruit in 2012, with free cash flow from operat-ing activities reaching €140 million.
Net debt was reduced by €112 million in 2012, closing the year at €596 million. Overthelastfouryears,andamidsta severe recession in the building and construction sectors in TITAN’s most important markets, the Group has almost halved its net debt, a reduction of over €500 million since the end of 2008.WithinthesametimeperiodtheGroup expanded its cement produc-tion capacity by almost 20%. This was achieved with no capital increase.
The Group ensures there are always committedun-utilizedcreditfacilitiesinplaceandadequatecashbalancestocover working capital needs. At the end of2012theGrouphadutilized56%oftotal €1.58 billion credit facilities and had approximately €700 million of un-utilizedavailablecreditlines.
Group Net Debt 2009-2012
1,154
1,028
1,029
971
988873
777
777 768
708
788
640
667
596
745
1,400
1,200
1,000
800
600
400
200
0
2009 2010 2011 2012Q1 Q2 Q3 Q4 Q1 Q2 Q3 Q4 Q1 Q2 Q3 Q4 Q1 Q2 Q3 Q4
€ million
917
Facilities by Tenor(1)
2,000
1,800
1,600
1,400
1,200
1,000
800
600
400
200
0Short Term
(1) Including capital leases
Long Term
133
564
705
175
Un-utilized Utilized
€ million
MaturityProfile
350
300
250
200
150
100
50
0<Dec’13 <Dec’14 <Dec’15 <Dec’16 >Dec’16
Bonds BankDebt
€ million
27498
77 80
23
128
200
Disposals(1): non-core assets
Partnerships:IFCasaminority partner in: >Albania-togetherwithEBRD >Egypt >Serbia,F.Y.R.O.M.andKosovo
Expansion: Albania (“greenfield”), Egypt
Acquisition:Kosovo(1) Disposals included: Greek porcelain busi-
ness, land holdings, U.S. quarry, shipping unit.
OurIndustryandour Footprint1020 Message from
the CEO4 AboutTITAN Group6 Our Industry and
our Footprint10 Our Business Modeland Strategy12

Equity Market Information
TITAN’s common shares have been traded ontheAthensExchangesinceFebru-ary 1912 and preference shares since November,1990.On22February2012TITAN celebrated the 100th anniversary ofitslistingontheAthensExchange.
InadditiontotheATHEXCompositeIndex,TITAN’s shares are components of the FTSE/ATHEXLargeCapand,asofDecem-ber2012,thenewFTSE/ATHEXGlobalTradersIndexPlus.
At 31 December 2012, the share capital ofTITANCementS.A.was€338,530,112consisting of 84,632,528 shares with a par value of €4.00 each, of which 77,063,568 were ordinary shares and 7,568,960 preference shares.
Comprehensive information to investors, aswellasequityandcreditanalysts,isavailable on our website: http://ir.titan.gr/
SymbolsTITANCommon
TITAN Preference
OASIS TITK TITP
Reuters Ticker TTNr.AT TTNa.AT
BloombergTicker TITKGA TITPGA
2001 2002 2003 2004 2005 2006 2007 2008 2009 2010 2011 2012
250
200
150
100
50
0
Index
TITAN S&PEurope350 AΤΗΕΧ Source:Bloomberg
Source:Bloomberg
PerformanceofTITANCommonSharesvstheS&PEurope350IndexandtheATHEXGeneralIndex (31.12.2000=100)
2012DailyVolumeofTransactionsandPriceofTITANCommonandPreferenceShares
200,000
150,000
100,000
50,000
0
20
15
10
5
0
VolumeTITK PriceTITK PriceTITP
JFMAMJJASOND
Shares €/Share
TITANCommonShareson31/12/2012
4.0%
29.4%
10.4%29.8%
26.4%
TITANPreferenceShareson31/12/2012
Private Investors 31.1% Treasury Stock 0.1% Greek Institutional Investors 10.6% Foreign Institutional Investors 0.5% Other Legal Entities 57.7%
31.1%
0.1%
0.5%
57.7%
10.6%
Private Investors 29.4% Treasury Stock 4.0% Greek Institutional Investors 10.4% Foreign Institutional Investors 29.8% Other Legal Entities 26.4%
Corporate Governanceand Risk Management14 GroupPerformanceReview18 Tables38 Notable
Information 21Corporate Governanceand Risk Management14 Group Performance Review18 21Corporate Governanceand Risk Management14 Group Performance Review 38 21Corporate Governance
and Risk Management14 Group Performance Review18 NotableInformation
Group Social and Environmental Performance Review 2012
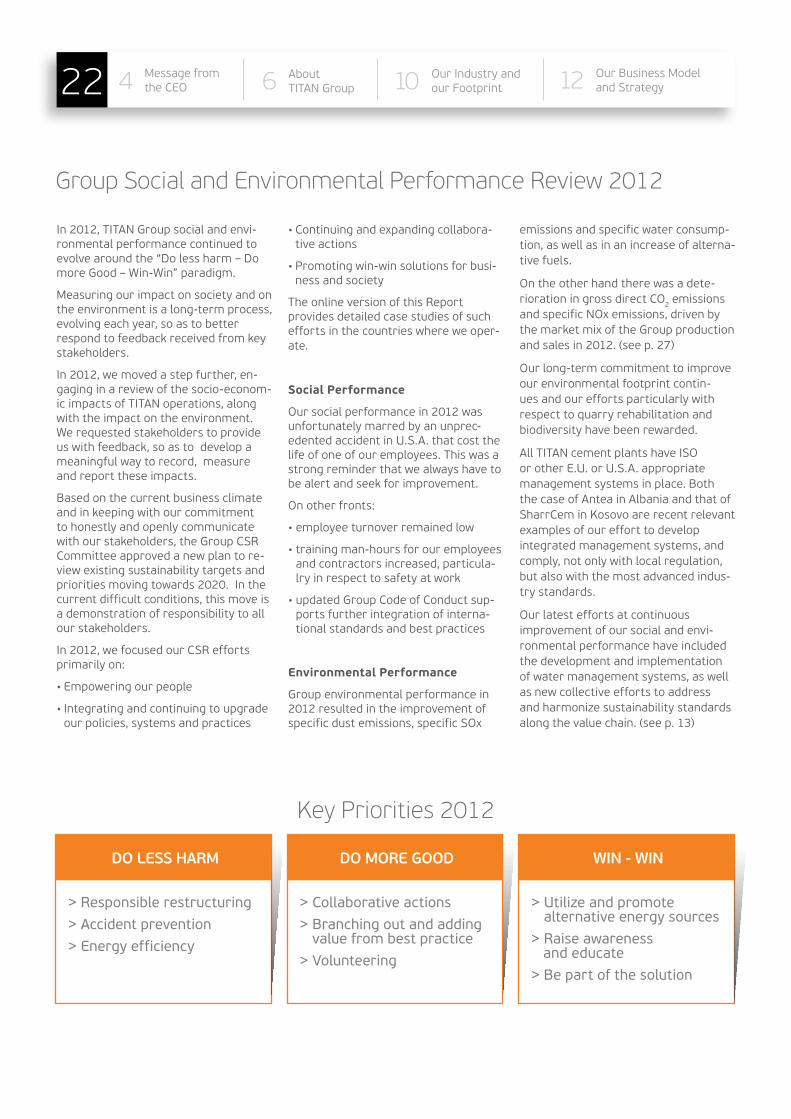
In 2012, TITAN Group social and envi-ronmental performance continued to evolvearoundthe“Dolessharm–DomoreGood–Win-Win”paradigm.
Measuring our impact on society and on the environment is a long-term process, evolving each year, so as to better respond to feedback received from key stakeholders.
In 2012, we moved a step further, en-gaging in a review of the socio-econom-ic impacts of TITAN operations, along with the impact on the environment. Werequestedstakeholderstoprovideus with feedback, so as to develop a meaningful way to record, measure and report these impacts.
Basedonthecurrentbusinessclimateand in keeping with our commitment to honestly and openly communicate withourstakeholders,theGroupCSRCommittee approved a new plan to re-view existing sustainability targets and priorities moving towards 2020. In the current difficult conditions, this move is a demonstration of responsibility to all our stakeholders.
In2012,wefocusedourCSReffortsprimarily on:
•Empoweringourpeople
•Integratingandcontinuingtoupgradeour policies, systems and practices
•Continuingandexpandingcollabora-tive actions
•Promotingwin-winsolutionsforbusi-ness and society
The online version of this Report provides detailed case studies of such efforts in the countries where we oper-ate.
Social Performance
Oursocialperformancein2012wasunfortunately marred by an unprec-edentedaccidentinU.S.A.thatcostthelife of one of our employees. This was a strong reminder that we always have to be alert and seek for improvement.
Onotherfronts:
•employeeturnoverremainedlow
•trainingman-hoursforouremployeesand contractors increased, particula-lry in respect to safety at work
•updatedGroupCodeofConductsup-ports further integration of interna-tional standards and best practices
Environmental Performance
Group environmental performance in 2012 resulted in the improvement of specificdustemissions,specificSOx
Key Priorities 2012
DO LESS HARM DO MORE GOOD WIN - WIN
> Responsible restructuring
> Accident prevention
> Energy efficiency
> Collaborative actions
> Branching out and adding value from best practice
> Volunteering
> Utilize and promote alternative energy sources
> Raise awareness and educate
> Be part of the solution
emissions and specific water consump-tion, as well as in an increase of alterna-tive fuels.
Ontheotherhandtherewasadete-riorationingrossdirectCO2 emissions andspecificNOxemissions,drivenbythe market mix of the Group production and sales in 2012. (see p. 27)
Ourlong-termcommitmenttoimproveour environmental footprint contin-ues and our efforts particularly with respecttoquarryrehabilitationandbiodiversity have been rewarded.
AllTITANcementplantshaveISOorotherE.U.orU.S.A.appropriatemanagementsystemsinplace.Boththe case of Antea in Albania and that of SharrCeminKosovoarerecentrelevantexamples of our effort to develop integrated management systems, and comply, not only with local regulation, but also with the most advanced indus-try standards.
Ourlatesteffortsatcontinuousimprovement of our social and envi-ronmental performance have included the development and implementation of water management systems, as well as new collective efforts to address andharmonizesustainabilitystandardsalong the value chain. (see p. 13)
OurIndustryandour Footprint1022 Message from
the CEO4 AboutTITAN Group6 Our Industry and
our Footprint10 Our Business Modeland Strategy12
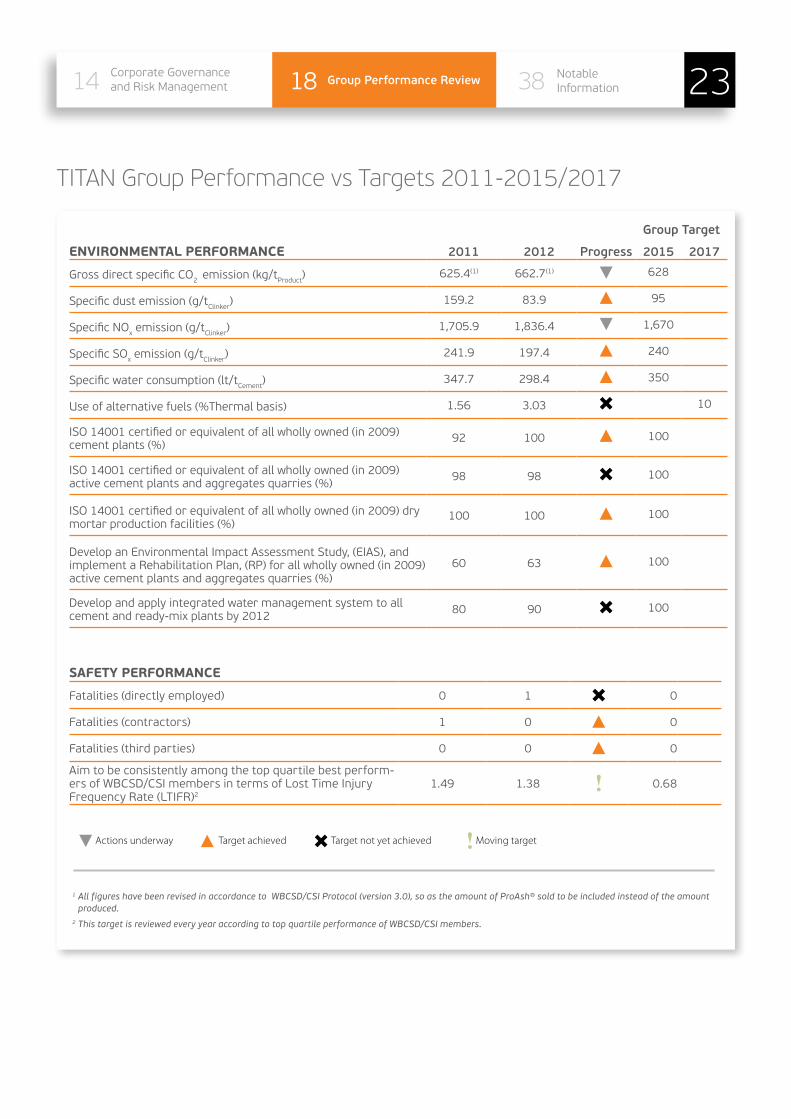
TITAN Group Performance vs Targets 2011-2015/2017
ENVIRONMENTAL PERFORMANCE 2011 2012 Progress
Group Target
2015 2017
GrossdirectspecificCO2 emission(kg/tProduct) 625.4(1) 662.7(1) 628
Specificdustemission(g/tClinker) 159.2 83.9 95
SpecificNOxemission(g/tClinker) 1,705.9 1,836.4 1,670
SpecificSOxemission(g/tClinker) 241.9 197.4 240
Specificwaterconsumption(lt/tCement) 347.7 298.4 350
Use of alternative fuels (%Thermal basis) 1.56 3.03 10
ISO14001certifiedorequivalentofallwhollyowned(in2009)cement plants (%)
92 100 100
ISO14001certifiedorequivalentofallwhollyowned(in2009)activecementplantsandaggregatesquarries(%)
98 98 100
ISO14001certifiedorequivalentofallwhollyowned(in2009)drymortar production facilities (%)
100 100 100
DevelopanEnvironmentalImpactAssessmentStudy,(EIAS),andimplementaRehabilitationPlan,(RP)forallwhollyowned(in2009)activecementplantsandaggregatesquarries(%)
60 63 100
Develop and apply integrated water management system to all cement and ready-mix plants by 2012 80 90 100
1 All figures have been revised in accordance to WBCSD/CSI Protocol (version 3.0), so as the amount of ProAsh® sold to be included instead of the amount produced.
2 This target is reviewed every year according to top quartile performance of WBCSD/CSI members.
Actions underway Target achieved Moving targetTarget not yet achieved
SAFETY PERFORMANCE
Fatalities (directly employed) 0 1 0
Fatalities (contractors) 1 0 0
Fatalities (third parties) 0 0 0
Aimtobeconsistentlyamongthetopquartilebestperform-ersofWBCSD/CSImembersintermsofLostTimeInjuryFrequencyRate(LTIFR)2
1.49 1.38 0.68
Corporate Governanceand Risk Management14 GroupPerformanceReview18 Tables38 Notable
Information 23Corporate Governanceand Risk Management14 Group Performance Review18 23Corporate Governanceand Risk Management14 Group Performance Review 38 23Corporate Governance
and Risk Management14 Group Performance Review18 NotableInformation

Health and Safety
TITAN Safety Summary for 2012
LTI(directemployees)decreasedcomparedto2011 12.5%
LTIFR(directemployees)decreasedcomparedto2011 7.4%
Reported near missesInvestigated near misses
1,38096%
Training man-hours (direct and indirect) 83,991
Safetyexcellenceperformancerecognitions
Patras,GRBeniSuef,EGRoanoke,U.S.A.
ZlatnaPanega,BU
Safety
The Group has always placed safety at work at the top of its priorities. Not-withstanding our intensive efforts, in 2012 our safety performance has not improved, marked by the loss of one of ouremployeesintheU.S.A.(seep.31)
Wehavefurtherintensifiedouref-forts focused particulalry on improving the safety culture of our employees and our contractors. For this reason, training man-hours for our employees and contractors increased in total by 35%comparedto2011.Weinvestedalmost 53,000 training man-hours for our employees training, an increase of 17.8% compared to 2011. For contrac-tors we reached a record number of 31,037 training man-hours compared to 16,960 in 2011 (amounting to an increase of 83%)
Reported near misses, although fewer than last year (1,380 versus 1,888 in 2011), helped us improve our under-standing of potential safety risks, given that 96% of them were investigated and the lessons learnt were dissemi-nated throughout the whole Group.
ThetotalnumberofLostTimeInjuriesincreased, due to the increase of con-tractors’LTIsby33.3%(16LTIsin2012
comparedto12LTIsin2011).Thisisone of the main reasons for intensifying the contractor training hours in 2012. ThenumberofLTIsforouremployeesdecreased by 14.3% compared to 2011 (14LTIsin2012comparedto16LTIsin2011).TheseverityratefortheLTIsofour employees also improved by 5.8%.
Health
In addition to the focus on safety, in 2012 we continued to increase our endeavors in the area of occupa-tional health, in conjunction with our participation in the working groups establishedbyCembureauandCSItomanage related issues.
Health is identified as a decisive factor for the well-being of our employees and the communities around our operations.Exposuretodust,heights,noise and contact with allergenic substances are among the issues that are systematically monitored, assessed and controlled through health and safety risk assessments and programsaimingtominimizepotentialimpacts of TITAN plants on the health of our employees and all relevant
NumberofLostTimeInjuries-All activities
TITAN Group and Contractors TITAN Employees Contractors
2005 2006 2007 2008 2009 2010 2011 2012
100
80
60
40
20
0
Health and safety remain top priorities
stakeholders.Significantinvestmentshave been made, particularly in the prevention of dust emissions, one of the drivers for TITAN’s outstanding level of performance in this area. Further reduction of noise was among else pursued through an improvement plan, especially designed for the Thessaloniki plant, in 2012.
The development of healthy habits is actively encouraged throughout the Group by occupational physicians, aim-ing at improving personal health both at work and at home.
TITAN Group provides medical care pro-grams,abovethoserequiredbylocallaw. Health care lectures are organ-izedbyallGroupcompaniesandmorefocused well-being initiatives have alreadybeenlaunchedintheU.S.A.,EgyptandAlbania.
LTIs
OurIndustryandour Footprint1024 Message from
the CEO4 AboutTITAN Group6 Our Industry and
our Footprint10 Our Business Modeland Strategy12

Employment and human resources development
Despite the challenges we have faced in most of our markets, employment at TI-TAN Group declined in total by only 1.6% compared to 2011. The Group continued to provide significant employment at its many locations worldwide and at the same time to commit significant resourc-es to training and developing employees’ knowledge and skills throughout the organization.Itisourfirmbeliefthatthisis essential to future success.
The effort to maintain our core business in all countries is reflected in direct em-ployment as recorded at the end of year. In 2012, Group employment turnover was1,84%comparedto2011.Employeeengagement is monitored at the operat-ingcompanylevel.Lowturnoverandab-senteeism rates as well as other metrics point to a high level of employee satisfac-tion throughout the Group.
The restructuring plan that was launched in response to the continuous downturn in key markets, took into consideration the business needs in each country of operations, as well as sustainability and social factors. Accordingly, the frame-work that was followed provided for:
•Noplannedovertimework
•Veryselectivehiringandlimitedre-placements of retiring employees
•Supportforredeploymentorself-em-ployment
•Voluntaryearly-leaveplansforthoseclose to retirement
•Additionalsocialsupportandcompen-sation schemes beyond legal obligations
This has enabled safeguarding most jobs in cement plants as well as the level of wages and salaries. Additional benefits that support employees and particularly our blue-collar workers have not been altered. These benefits vary from country to country but, as aminimum,providesubsidizedorfreemeals and transportation, additional medical care and insurance coverage programs, financial and in kind support for families and children’s education.
Diversity and equal opportunitiesRespect for diversity allows for the development of a business culture which reflects the social structure and dynamics in the regions of our opera-tions while also mirroring the Group’s long-term engagement with employees and its respect for human rights and equalopportunities.
The percentage of women in man-agement is considered relevant to a heavy industry, even though in certain countriesitisquitehigh.AllTITANGroupmanagershaveequalopportunitiestoadvance their skills and career perspec-tives.
2000
1500
1000
500
0
Alba
nia
Bulga
riaEg
ypt
F.Y.R
.O.M
.Gre
ece
Kosov
oSe
rbia
Turk
eyTO
TAL
Under 30
30-50
Over 50
TrainedEmployeesper Age Group
PercentageofTrainingMan-hoursrelatedtoCSR
PercentageofWomenin Management per country 2012
Environment 4.75% Health and Safety 31.41% Management 16.41% Human Rights 0.66% Group Code of Conduct 0.11%
4.75%0.66%
0.11%
31.41%
16.41%
Withrespecttoagedistribution,theGroup continues to invest in all em-ployees through vocational training, job rotation and new professional opportunties. This is also reflected in the proportionate implementation of training man-hours per age group in all countries last year. Although age is a parameter examined as a social factor within a restructuring process, it is not considered as a barrier when market conditions allow re-hiring.
Human resources developmentTraining and investing in the continuous development of employees remains a high priority for TITAN Group. Aiming at life-long learning and continuous enhancement of professional skills and competencies necessary to anticipate future challenges, vocational training and human resources development continued systematically in 2012.
Compared to 2011, the total number of training man-hours increased from 90,658 to 122,243, an overall increase of 34%. New programs were launched in 2012 for the communication of the updated Code of Conduct and the new guidelines on biodiversity, while pro-grams that have been successful like the “C-Mentors”,the“StepChange” and the “StakeholderEngagementDevelopmentandTrainingProgram”continuedandexpanded.
Albania 11.43% Bulgaria36.36% Egypt0.0% F.Y.R.O.M.32.14% Greece 17.78%
11.43%
Total 15.80%
36.36%
32.14%17.78%
19.23%
16.67%
15.70%
Kosovo0.0% Serbia19.23% Turkey 16.67% U.S.A.15.70%
Corporate Governanceand Risk Management14 GroupPerformanceReview18 Tables38 Notable
Information 25Corporate Governanceand Risk Management14 Group Performance Review18 25Corporate Governanceand Risk Management14 Group Performance Review 38 25Corporate Governance
and Risk Management14 Group Performance Review18 NotableInformation

TITAN Group - All activities
Description 2010 2011 2012
Raw material extracted, metric tons (wet) 31.0 million 24.3 million 27.6 million
For cement production, metric tons (wet) 19.2 million 16.0 million 18.6 million
For aggregates, metric tons (wet) 11.8 million 8.3 million 9.0 million
Raw material consumed
For cement production, metric tons (dry) 21.3 million 18.6 million 19.1 million
For ready-mix, dry mortar and block production, metric tons (wet) 7.7 million 6.7 million 7.1 million
Total thermal energy consumption, TJ 43,155 36,828 41,773
Total electrical energy consumption, TJ 6,252 5,511 5,839
Total direct CO2 emissions (gross), metric tons 10.4 million 8.6 million 9.6 million
Total water consumption, m3 16.7 million 9.9 million 11.2 million
Recycled (externally) waste material, metric tons 145,032 167,830 267,800
As part of TITAN’s commit-ment to “do less harm and do more good”, managing and improving our environmental performance is a key to foster sustainability, even during ex-ceptionally difficult economic circumstances.
Group environmental perfor-mance was variable in 2012, with improvement in some indicators (dust emissions, water consumption and al-ternative fuels) and decline inothers(likeCO2 emissions), due to increase of the clinker to cement ratio.
In the coming year, we will revisit our long-term envi-ronmental targets and based on our current performance, environmental strategy, obli-gations towards stakeholders and the anticipated business environment, we will once again set the benchmarks for our future development.
Environmental Management Systems
The certification of Antea in Albania accordingtoISO14001in2012hashelped us achieve our 2009 target of certifying all of our wholly owned ce-ment plants according to that standard. Inaddition,anEnvironmentalImpactAssessmentStudy(EIAS)andaRehabili-tationPlan(RP)wasdevelopedfortheSuvoVrelolimestonequarryinSerbia,thus increasing the relevant Group-wide coverage indicator to 63%.
Finally, the development of a water management system has almost been completed, covering by now all of our cement plants and most of our ready-mix plants. Another 1-2 years are re-quiredforitsfullimplementation,giventhe large number and wide dispersion of ready-mix concrete plants.
It should be noted that at all cement plantsandadjacentquarries,internalaudits are performed in accordance withtheISO14001requirements.These audits fully cover environmental compliance in accordance with permits, airemissions-includingCO2 emissions-, water, raw materials, fuels and wastes. Inaddition,CO2 emissions audits are also performed each year by external verifiersatourGreekandBulgariancementplants,asrequiredbyEU/ETSlegislation.
Climate Change and Energy Efficiency
Climate change is strongly affected by human activity. For the cement and construction industries, energy and raw materials are fundamental elements. For many years, these industries have invested in Research and Development, creating new methods and practices to offer more efficient and reliable solu-tions for society and the environment.
At TITAN, energy efficiency and the conservative use of raw materials that is aligned with a waste management system, as per the Reduce, Reuse and Recycle principle, are priorities. Relevant examples of such practices are given in our online annual Report by region and country.
The largest source of thermal energy (97% on a calorific basis) came from conventional fuels such as coal, pet coke, fuel oil and natural gas. Alterna-tive fuels make up the remainder.
As in the case of thermal energy consumption, the observed increase in absolute amount of electrical energy consumption is due to increased pro-duction.
Environmental performance
OurIndustryandour Footprint1026 Message from
the CEO4 AboutTITAN Group6 Our Industry and
our Footprint10 Our Business Modeland Strategy12
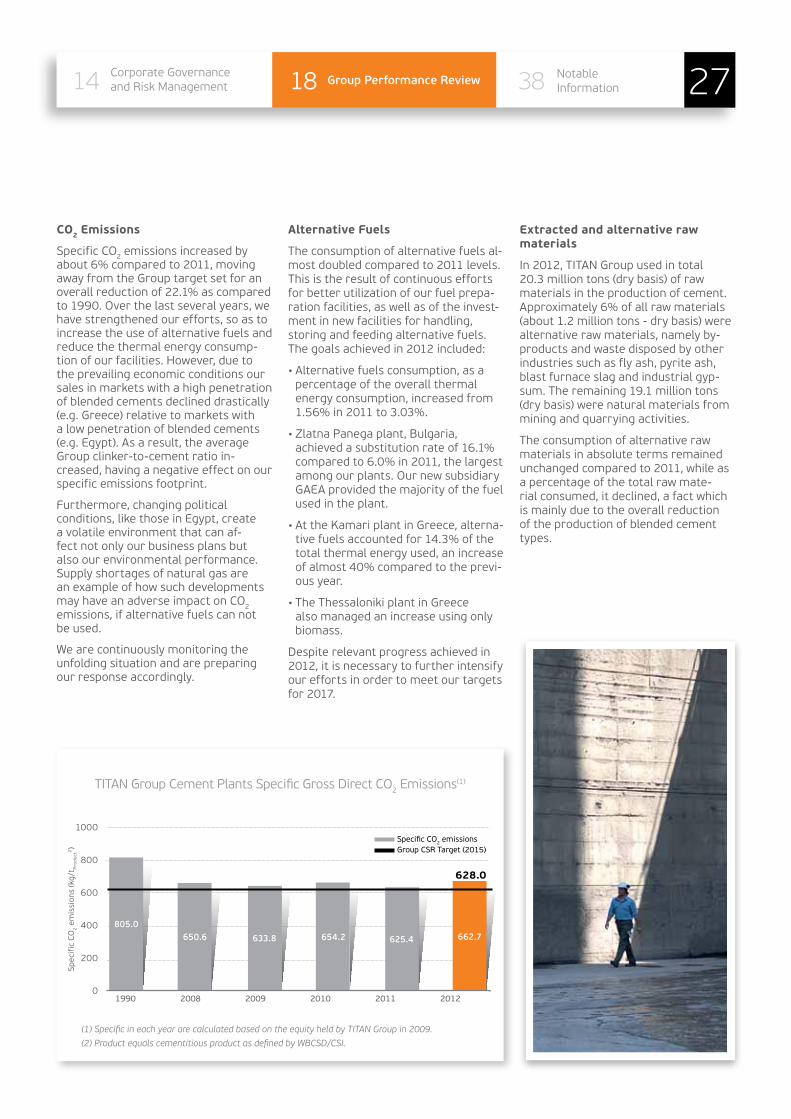
CO2 Emissions
SpecificCO2 emissions increased by about 6% compared to 2011, moving away from the Group target set for an overall reduction of 22.1% as compared to1990.Overthelastseveralyears,wehave strengthened our efforts, so as to increase the use of alternative fuels and reduce the thermal energy consump-tion of our facilities. However, due to the prevailing economic conditions our sales in markets with a high penetration of blended cements declined drastically (e.g. Greece) relative to markets with a low penetration of blended cements (e.g.Egypt).Asaresult,theaverageGroup clinker-to-cement ratio in-creased, having a negative effect on our specific emissions footprint.
Furthermore, changing political conditions,likethoseinEgypt,createa volatile environment that can af-fect not only our business plans but also our environmental performance. Supplyshortagesofnaturalgasarean example of how such developments mayhaveanadverseimpactonCO
2 emissions, if alternative fuels can not be used.
Wearecontinuouslymonitoringtheunfolding situation and are preparing our response accordingly.
TITANGroupCementPlantsSpecificGrossDirectCO2Emissions(1)
(1) Specific in each year are calculated based on the equity held by TITAN Group in 2009.
(2) Product equals cementitious product as defined by WBCSD/CSI.
1000
800
600
400
200
01990 2008 2009 2010 2011 2012
628.0
650.6 633.8 654.2 625.4 662.7
Specific CO2 emissionsGroup CSR Target (2015)
SpecificCO
2em
issions(kg/t P
roduct
2)
805.0
Alternative Fuels
The consumption of alternative fuels al-most doubled compared to 2011 levels. This is the result of continuous efforts forbetterutilizationofourfuelprepa-ration facilities, as well as of the invest-ment in new facilities for handling, storing and feeding alternative fuels.The goals achieved in 2012 included:
•Alternative fuels consumption, as a percentage of the overall thermal energy consumption, increased from 1.56% in 2011 to 3.03%.
•ZlatnaPanegaplant,Bulgaria,achieved a substitution rate of 16.1% compared to 6.0% in 2011, the largest amongourplants.OurnewsubsidiaryGAEAprovidedthemajorityofthefuelused in the plant.
•AttheKamariplantinGreece,alterna-tive fuels accounted for 14.3% of the total thermal energy used, an increase of almost 40% compared to the previ-ous year.
•The Thessaloniki plant in Greece also managed an increase using only biomass.
Despite relevant progress achieved in 2012, it is necessary to further intensify our efforts in order to meet our targets for 2017.
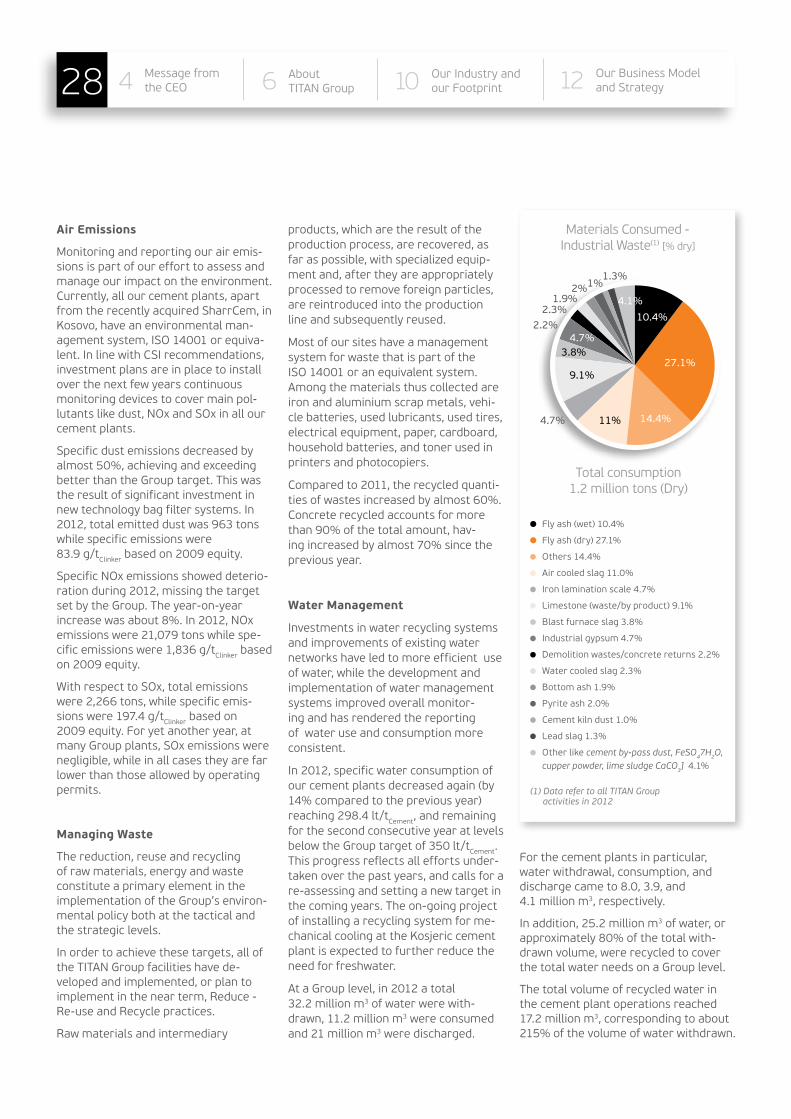
Extracted and alternative raw materials
In 2012, TITAN Group used in total 20.3 million tons (dry basis) of raw materials in the production of cement. Approximately 6% of all raw materials (about 1.2 million tons - dry basis) were alternative raw materials, namely by-products and waste disposed by other industries such as fly ash, pyrite ash, blast furnace slag and industrial gyp-sum. The remaining 19.1 million tons (dry basis) were natural materials from miningandquarryingactivities.
The consumption of alternative raw materials in absolute terms remained unchanged compared to 2011, while as a percentage of the total raw mate-rial consumed, it declined, a fact which is mainly due to the overall reduction of the production of blended cement types.
Corporate Governanceand Risk Management14 GroupPerformanceReview18 Tables38 Notable
Information 27Corporate Governanceand Risk Management14 Group Performance Review18 27Corporate Governanceand Risk Management14 Group Performance Review 38 27Corporate Governance
and Risk Management14 Group Performance Review18 NotableInformation
Air Emissions
Monitoring and reporting our air emis-sions is part of our effort to assess and manage our impact on the environment. Currently, all our cement plants, apart fromtherecentlyacquiredSharrCem,inKosovo,haveanenvironmentalman-agementsystem,ISO14001orequiva-lent.InlinewithCSIrecommendations,investment plans are in place to install over the next few years continuous monitoring devices to cover main pol-lutantslikedust,NOxandSOxinallourcement plants.
Specificdustemissionsdecreasedbyalmost 50%, achieving and exceeding better than the Group target. This was the result of significant investment in new technology bag filter systems. In 2012, total emitted dust was 963 tons while specific emissions were83.9g/tClinkerbasedon2009equity.
SpecificNOxemissionsshoweddeterio-ration during 2012, missing the target set by the Group. The year-on-year increasewasabout8%.In2012,ΝOxemissions were 21,079 tons while spe-cificemissionswere1,836g/tClinker based on2009equity.
WithrespecttoSOx,totalemissionswere 2,266 tons, while specific emis-sionswere197.4g/tClinker based on 2009equity.Foryetanotheryear,atmanyGroupplants,SOxemissionswerenegligible, while in all cases they are far lower than those allowed by operating permits.
Managing Waste
The reduction, reuse and recycling of raw materials, energy and waste constitute a primary element in the implementation of the Group’s environ-mental policy both at the tactical and the strategic levels.
In order to achieve these targets, all of the TITAN Group facilities have de-veloped and implemented, or plan to implement in the near term, Reduce - Re-use and Recycle practices.
Raw materials and intermediary
products, which are the result of the production process, are recovered, as faraspossible,withspecializedequip-ment and, after they are appropriately processed to remove foreign particles, are reintroduced into the production lineandsubsequentlyreused.
Most of our sites have a management system for waste that is part of theISO14001oranequivalentsystem.Among the materials thus collected are iron and aluminium scrap metals, vehi-cle batteries, used lubricants, used tires, electricalequipment,paper,cardboard,household batteries, and toner used in printers and photocopiers.
Comparedto2011,therecycledquanti-ties of wastes increased by almost 60%. Concrete recycled accounts for more than 90% of the total amount, hav-ing increased by almost 70% since the previous year.
Water Management
Investments in water recycling systems and improvements of existing water networks have led to more efficient use of water, while the development and implementation of water management systems improved overall monitor-ing and has rendered the reporting of water use and consumption more consistent.
In 2012, specific water consumption of our cement plants decreased again (by 14% compared to the previous year) reaching298.4lt/t
Cement, and remaining for the second consecutive year at levels belowtheGrouptargetof350lt/tCement. This progress reflects all efforts under-taken over the past years, and calls for a re-assessing and setting a new target in the coming years. The on-going project of installing a recycling system for me-chanicalcoolingattheKosjericcementplant is expected to further reduce the need for freshwater.
At a Group level, in 2012 a total32.2 million m3 of water were with-drawn, 11.2 million m3 were consumed and 21 million m3 were discharged.
For the cement plants in particular, water withdrawal, consumption, and discharge came to 8.0, 3.9, and4.1 million m3, respectively.
In addition, 25.2 million m3 of water, or approximately 80% of the total with-drawn volume, were recycled to cover the total water needs on a Group level.
The total volume of recycled water in the cement plant operations reached 17.2 million m3, corresponding to about 215% of the volume of water withdrawn.
Materials Consumed - IndustrialWaste(1) [% dry]
Fly ash (wet) 10.4%
Fly ash (dry) 27.1%
Others14.4%
Air cooled slag 11.0%
Iron lamination scale 4.7%
Limestone(waste/byproduct)9.1%
Blastfurnaceslag3.8%
Industrial gypsum 4.7%
Demolitionwastes/concretereturns2.2%
Watercooledslag2.3%
Bottomash1.9%
Pyriteash2.0%
Cement kiln dust 1.0%
Leadslag1.3%
Otherlikecement by-pass dust, FeSO47H2O, cupper powder, lime sludge CaCO3] 4.1%
27.1%
14.4%
10.4%
4.7%
4.7%2.2%
2.3%1.9%
2%1%1.3%
4.1%
3.8%
9.1%
11%
Total consumption1.2 million tons (Dry)
(1) Data refer to all TITAN Group activities in 2012
OurIndustryandour Footprint1028 Message from
the CEO4 AboutTITAN Group6 Our Industry and
our Footprint10 Our Business Modeland Strategy12

TotalNumberofTrees/PlantsPlantedorDonatedtoThirdPartiesby TITAN (cumulative)
2,000,000
1,800,000
1,600,000
1,400,000
1,200,000
1,000,000
800,000
600,000
400,000
200,000
01974 1976 1978 1980 1982 1984 1986 1988 1990 1992 1994 1996 1998 2000 2002 2004 2006 2008 2010 2012
Totalplantedtrees/plants
Specificwaterconsumption(lt/t
Cem
ent)
TITANGroupCementProductionandGrindingPlantsWaterConsumption(1,2)
600
500
400
300
200
100
02003 2008 2009 2010 2011 2012
350.0
(1) Specific consumption of each year is calculated based on the equity held by TITAN Group in 2009.(2) Group target is calculated based on the equity held by TITAN Group in 2009.
Specific water consumtionGroup CSR Target (2015)
447.2 447.8
362.2 347.7298.4
561.8
Managing our Impact on Land - Quarry Rehabilitation and Biodiversity
Quarryrehabilitationandbiodiversitymanagement are a key focus area for TITAN. Accordingly, rehabilitation plans have been developed and systematically implementedintheGroup’squarryop-erations. TITAN has also been active in assessingbiodiversityatitsquarrysites,aiming at developing specific manage-ment plans for the preservation and the enhancement of biodiversity.
As a commitment for application by company members, the new Guidelines onQuarryRehabilitationreleasedin2012byWBCSD/CSI,wereincludedintheupdatedCSICharter.Theyarealready communicated within TITAN business units, as a tool for supporting new rehabilitation plans or improving existingonesateachcompany’squarryoperations.
•WithrespecttotheenvironmentalperformancetargetsofGroupquar-ries almost all of our wholly owned activequarries(asof2009)havebeencertifiedwithISO14001orequivalentsystems,andfor63%ofthemanEIAShas been developed and a Rehabilita-tionPlanisinplaceandimplemented.
•In2012,thetotalareaofactivequar-ries was 81.3 million m2, out of which 16.9 million m2 are “affected”,
14.6 million m2 have been rehabili-tated or restored to date (cumulative) and 49.8 million m2 are still “green” (untouched).
1,962,0001,882,000
Corporate Governanceand Risk Management14 GroupPerformanceReview18 Tables38 Notable
Information 29Corporate Governanceand Risk Management14 Group Performance Review18 29Corporate Governanceand Risk Management14 Group Performance Review 38 29Corporate Governance
and Risk Management14 Group Performance Review18 NotableInformation

U.S.A. OPERATIONS
TheSouthAtlanticregion(whichincludes Virginia, the Carolinas, and Florida)faredbetterthantheU.S.asa whole with cement consumption increasing9.8%over2011levels.Whilethe positive trend in volumes (albeit from a very low base) provided some relief,ourU.S.businessremainedaffected by a weak pricing environment. Despitethechallenges,U.S.operationsregistered improvements in cost structure that permitted a positive (althoughverylow)contribution.Whencompared to the asset base, the results show the operating leverage upside, once the region returns to growth. GroupturnoverintheU.S.in2012stood at €369 million, posting a 22% increaseineurotermswhile,EBITDAimproved to a positive €6 million reversing the trend of a €6 million operating loss in 2011.
FLORIDA
AccordingtotheU.S.GeologicalSurvey,cement consumption in Florida was4.1 million tons in 2012, an increase of14%over2011.Whilebetterthanin 2011, market demand was not high enoughtokeeputilizationratesatsat-isfactory levels.
Aggregates and ready-mix concrete volumes of TITAN America also increased at rates commensurateto market trends.
MID-ATLANTIC
Cement consumption in Virginia increased by 11% to 1.7 million tons accordingtotheU.S.GeologicalSurvey.In North Carolina cement consumption improved by a more modest 5% to2.0 million tons.
NEW YORK / NEW JERSEY
AccordingtotheU.S.GeologicalSurvey,cementconsumptionintheNewYorkMetropolitan area was 1.2 million tons in 2012, an increase of 2% over 2011. TITANAmerica’sMetroNewYorkbusi-ness experienced meaningful increase in demand but a weak pricing environ-ment.
SEPARATION TECHNOLOGIES (ST)
TotalsalesofProAsh®,derivedfromtheCompany’s proprietary ash beneficia-tion process and ash from unprocessed sites increased, making 2012 a record yearofperformanceforST.Marketde-mand remained strong, but limited ash suppliesconstrainedST’soutputbelowits potential.
OutsidetheU.S.,ST’sproprietarytechnology is now in use in the ash and industrial minerals sectors in Canada andEurope.Attheendof2012,anothermilestone was reached with the sale of anashseparatortoautilityinSouthKorea,thefirstunittobeinstalledout-sideNorthAmericaandEurope.
U.S.A.
EBITDATurnover
400
350
300
250
200
150
100
50
0Turnover
2011Turnover
2012OrganicGrowth
TranslationImpact
303.7
(5.7)
5.8
369.5
€ million
9.4% 12.3%
37.3
28.4
€ million
12
10
8
6
4
2
0
-2
-4
-6EBITDA2012
OrganicGrowth
TranslationImpact
EBITDA2011
0.4
11.1
In 2012, breaking a five-year decliningtrend,combinedU.S.construction spending grew by 9.9% to $855 billion.
Supportedbypent-updemand,lower inventories, and a contin-ued accommodative monetary policy, residential construction gained strength throughout 2012 and entered 2013 as the bright spot in construction. The upsurge in private residential construction spending translated toa16.5%annualincrease–thefirst increase since 2006.
Privatenon-residentialconstruc-tion increased in 2012 by an estimated 17.6% to $303 billion having been driven higher by investments in the energy and powersectors.Ontheotherhand, public spending declined for the third consecutive year, falling 2.6% to $276 billion.
U.S.A.cementconsumptionincreased by an estimated 8.9% in2012to78.5milliontons–still more than 50 million tons lower than the record level set in 2005. A mix of temporary and permanent plant closures in the U.S.A.since2008hasreducedcapacitybututilizationratesareestimated to have remained be-low 65%, on average, in 2012.
OurIndustryandour Footprint1030 Message from
the CEO4 AboutTITAN Group6 Our Industry and
our Footprint10 Our Business Modeland Strategy12
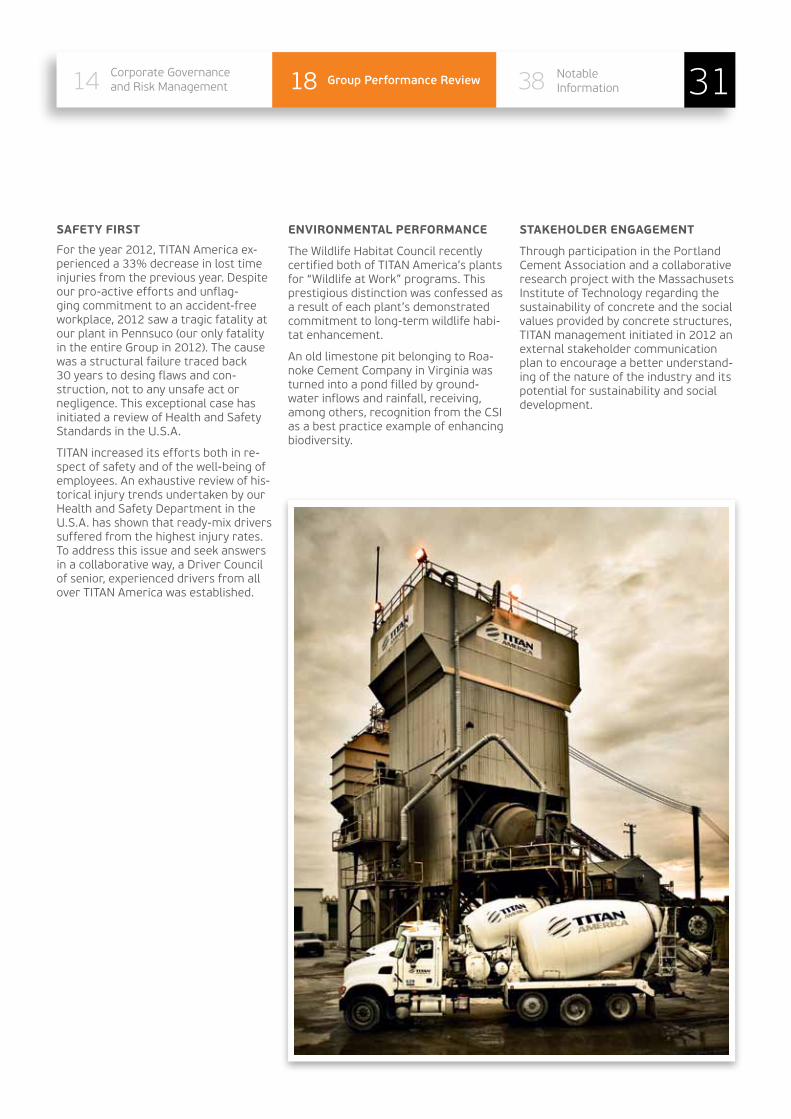
SAFETY FIRST
For the year 2012, TITAN America ex-perienced a 33% decrease in lost time injuries from the previous year. Despite our pro-active efforts and unflag-ging commitment to an accident-free workplace, 2012 saw a tragic fatality at ourplantinPennsuco(ouronlyfatalityin the entire Group in 2012). The cause was a structural failure traced back30 years to desing flaws and con-struction, not to any unsafe act or negligence. This exceptional case has initiatedareviewofHealthandSafetyStandardsintheU.S.A.
TITAN increased its efforts both in re-spect of safety and of the well-being of employees. An exhaustive review of his-torical injury trends undertaken by our HealthandSafetyDepartmentintheU.S.A.hasshownthatready-mixdriverssuffered from the highest injury rates. To address this issue and seek answers in a collaborative way, a Driver Council of senior, experienced drivers from all over TITAN America was established.
ENVIRONMENTAL PERFORMANCE
TheWildlifeHabitatCouncilrecentlycertified both of TITAN America’s plants for“WildlifeatWork”programs.Thisprestigious distinction was confessed as a result of each plant’s demonstrated commitment to long-term wildlife habi-tat enhancement.
An old limestone pit belonging to Roa-noke Cement Company in Virginia was turned into a pond filled by ground-water inflows and rainfall, receiving, amongothers,recognitionfromtheCSIas a best practice example of enhancing biodiversity.
STAKEHOLDER ENGAGEMENT
ThroughparticipationinthePortlandCement Association and a collaborative research project with the Massachusets Institute of Technology regarding the sustainability of concrete and the social values provided by concrete structures, TITAN management initiated in 2012 an external stakeholder communication plan to encourage a better understand-ing of the nature of the industry and its potential for sustainability and social development.
Corporate Governanceand Risk Management14 GroupPerformanceReview18 Tables38 Notable
Information 31Corporate Governanceand Risk Management14 Group Performance Review18 31Corporate Governanceand Risk Management14 Group Performance Review 38 31Corporate Governance
and Risk Management14 Group Performance Review18 NotableInformation
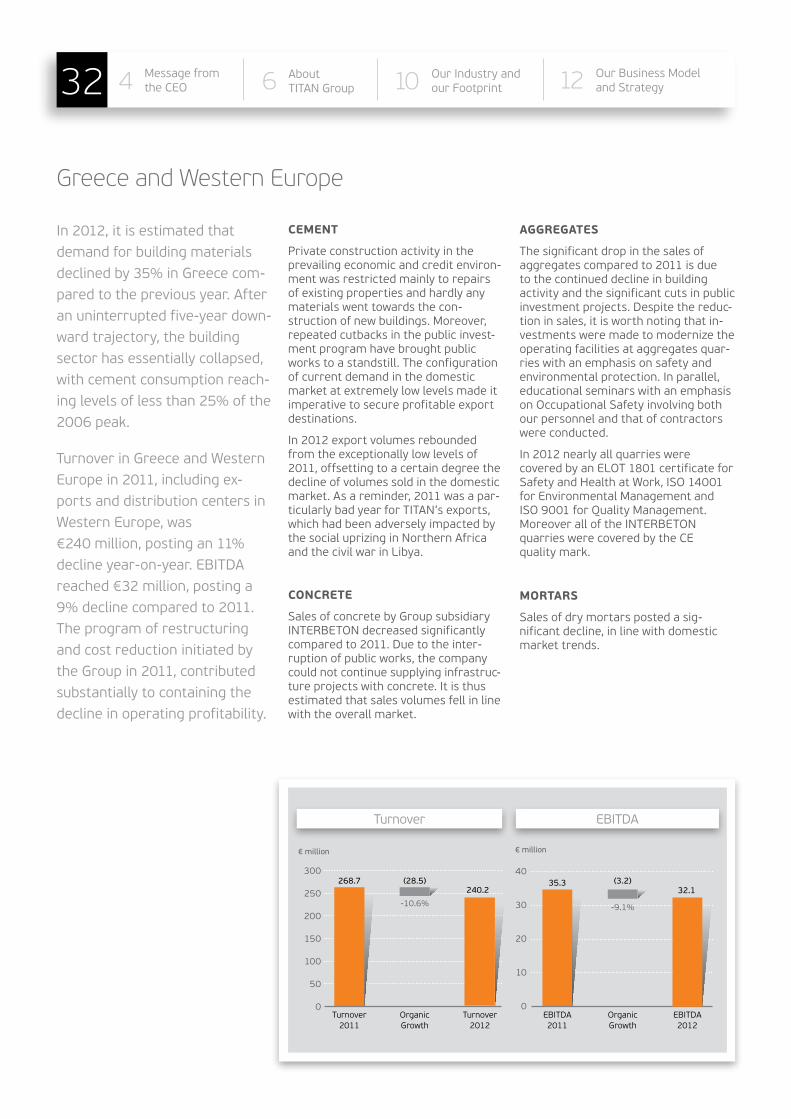
CEMENT
Privateconstructionactivityintheprevailing economic and credit environ-ment was restricted mainly to repairs of existing properties and hardly any materials went towards the con-struction of new buildings. Moreover, repeated cutbacks in the public invest-ment program have brought public works to a standstill. The configuration of current demand in the domestic market at extremely low levels made it imperative to secure profitable export destinations.
In 2012 export volumes rebounded from the exceptionally low levels of 2011, offsetting to a certain degree the decline of volumes sold in the domestic market. As a reminder, 2011 was a par-ticularly bad year for TITAN’s exports, which had been adversely impacted by thesocialuprizinginNorthernAfricaandthecivilwarinLibya.
CONCRETE
SalesofconcretebyGroupsubsidiaryINTERBETONdecreasedsignificantlycompared to 2011. Due to the inter-ruption of public works, the company could not continue supplying infrastruc-ture projects with concrete. It is thus estimated that sales volumes fell in line with the overall market.
AGGREGATES
The significant drop in the sales of aggregates compared to 2011 is due to the continued decline in building activity and the significant cuts in public investment projects. Despite the reduc-tion in sales, it is worth noting that in-vestmentsweremadetomodernizetheoperatingfacilitiesataggregatesquar-ries with an emphasis on safety and environmental protection. In parallel, educational seminars with an emphasis onOccupationalSafetyinvolvingbothour personnel and that of contractors were conducted.
In2012nearlyallquarrieswerecoveredbyanELOT1801certificateforSafetyandHealthatWork,ISO14001forEnvironmentalManagementandISO9001forQualityManagement.MoreoveralloftheINTERBETONquarrieswerecoveredbytheCEqualitymark.
MORTARS
Salesofdrymortarspostedasig-nificant decline, in line with domestic market trends.
Greece and Western Europe
€ million
EBITDA
(3.2)40
30
20
10
0EBITDA2012
EBITDA2011
OrganicGrowth
-9.1%
35.332.1
Turnover
300
250
200
150
100
50
0Turnover
2011Turnover
2012
€ million
OrganicGrowth
-10.6%
(28.5)
In 2012, it is estimated that demand for building materials declined by 35% in Greece com-pared to the previous year. After an uninterrupted five-year down-ward trajectory, the building sector has essentially collapsed, with cement consumption reach-ing levels of less than 25% of the 2006 peak.
TurnoverinGreeceandWesternEuropein2011,includingex-ports and distribution centers in WesternEurope,was€240 million, posting an 11% declineyear-on-year.EBITDAreached €32 million, posting a 9% decline compared to 2011. The program of restructuring and cost reduction initiated by the Group in 2011, contributed substantially to containing the decline in operating profitability.
268.7240.2
OurIndustryandour Footprint1032 Message from
the CEO4 AboutTITAN Group6 Our Industry and
our Footprint10 Our Business Modeland Strategy12
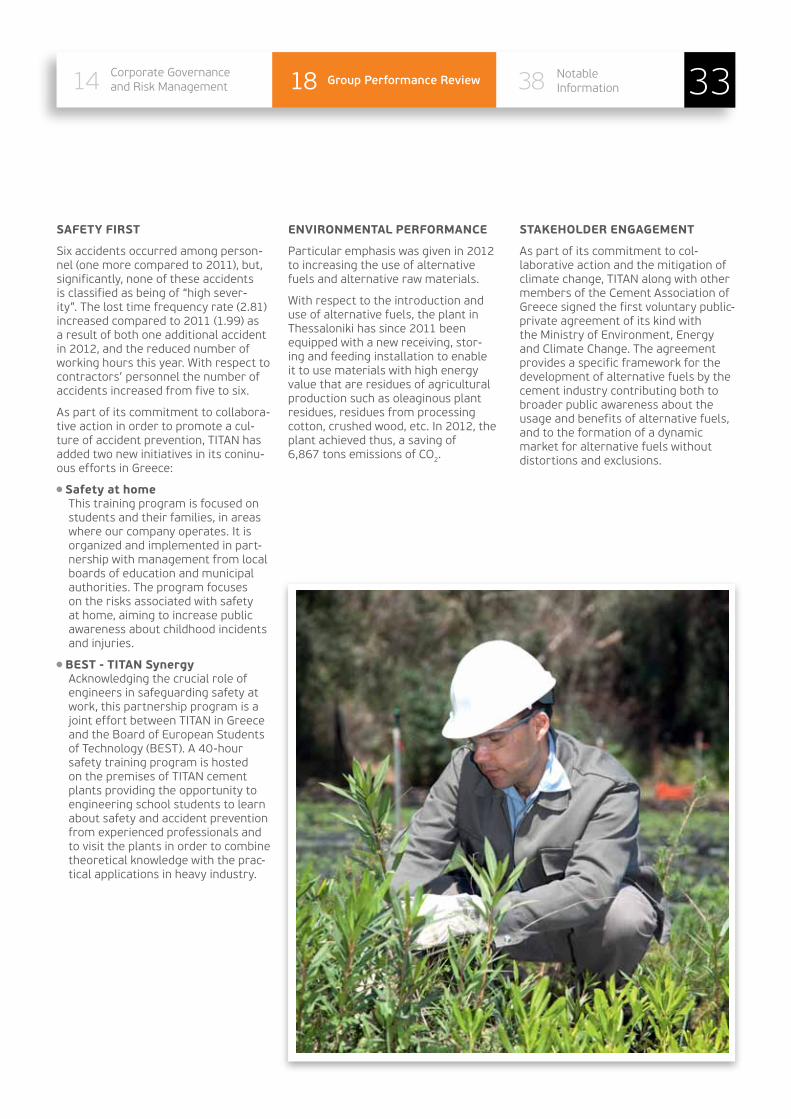
SAFETY FIRST
Sixaccidentsoccurredamongperson-nel (one more compared to 2011), but, significantly, none of these accidents is classified as being of “high sever-ity”.Thelosttimefrequencyrate(2.81)increased compared to 2011 (1.99) as a result of both one additional accident in 2012, and the reduced number of workinghoursthisyear.Withrespecttocontractors’ personnel the number of accidents increased from five to six.
As part of its commitment to collabora-tive action in order to promote a cul-ture of accident prevention, TITAN has added two new initiatives in its coninu-ous efforts in Greece:
Safety at home This training program is focused on
students and their families, in areas where our company operates. It is organizedandimplementedinpart-nership with management from local boards of education and municipal authorities. The program focuses on the risks associated with safety at home, aiming to increase public awareness about childhood incidents and injuries.
BEST - TITAN Synergy Acknowledging the crucial role of
engineers in safeguarding safety at work, this partnership program is a joint effort between TITAN in Greece andtheBoardofEuropeanStudentsofTechnology(BEST).A40-hoursafety training program is hosted on the premises of TITAN cement plants providing the opportunity to engineering school students to learn about safety and accident prevention from experienced professionals and to visit the plants in order to combine theoretical knowledge with the prac-tical applications in heavy industry.
ENVIRONMENTAL PERFORMANCE
Particularemphasiswasgivenin2012to increasing the use of alternative fuels and alternative raw materials.
Withrespecttotheintroductionanduse of alternative fuels, the plant in Thessaloniki has since 2011 been equippedwithanewreceiving,stor-ing and feeding installation to enable it to use materials with high energy value that are residues of agricultural production such as oleaginous plant residues, residues from processing cotton, crushed wood, etc. In 2012, the plant achieved thus, a saving of6,867tonsemissionsofCO2.
STAKEHOLDER ENGAGEMENT
As part of its commitment to col-laborative action and the mitigation of climate change, TITAN along with other members of the Cement Association of Greece signed the first voluntary public-private agreement of its kind with theMinistryofEnvironment,Energyand Climate Change. The agreement provides a specific framework for the development of alternative fuels by the cement industry contributing both to broader public awareness about the usage and benefits of alternative fuels, and to the formation of a dynamic market for alternative fuels without distortions and exclusions.
Corporate Governanceand Risk Management14 GroupPerformanceReview18 Tables38 Notable
Information 33Corporate Governanceand Risk Management14 Group Performance Review18 33Corporate Governanceand Risk Management14 Group Performance Review 38 33Corporate Governance
and Risk Management14 Group Performance Review18 NotableInformation
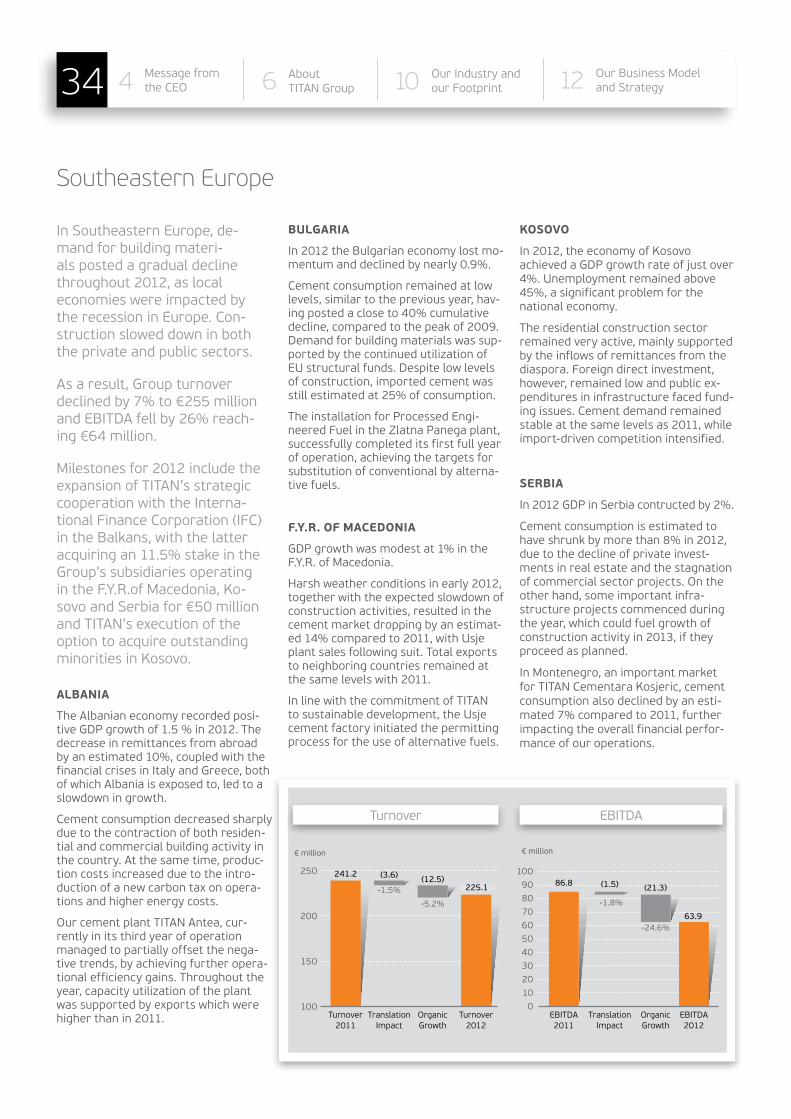
Southeastern Europe
Turnover EBITDA
250
200
150
100Turnover
2011Turnover
2012OrganicGrowth
TranslationImpact
TranslationImpact
241.2
225.1
€ million
-5.2%
(12.5)-1.5%
(3.6)
€ million
100908070605040302010
0EBITDA2012
EBITDA2011
OrganicGrowth
86.8
63.9
(21.3)(1.5)
-24.6%
-1.8%
InSoutheasternEurope,de-mand for building materi-als posted a gradual decline throughout 2012, as local economies were impacted by therecessioninEurope.Con-struction slowed down in both the private and public sectors.
As a result, Group turnover declined by 7% to €255 million andEBITDAfellby26%reach-ing €64 million.
Milestones for 2012 include the expansion of TITAN’s strategic cooperation with the Interna-tional Finance Corporation (IFC) intheBalkans,withthelatteracquiringan11.5%stakeintheGroup’s subsidiaries operating intheF.Y.R.ofMacedonia,Ko-sovoandSerbiafor€50millionand TITAN’s execution of the optiontoacquireoutstandingminoritiesinKosovo.
ALBANIA
The Albanian economy recorded posi-tiveGDPgrowthof1.5%in2012.Thedecrease in remittances from abroad by an estimated 10%, coupled with the financial crises in Italy and Greece, both of which Albania is exposed to, led to a slowdown in growth.
Cement consumption decreased sharply due to the contraction of both residen-tial and commercial building activity in the country. At the same time, produc-tion costs increased due to the intro-duction of a new carbon tax on opera-tions and higher energy costs.
OurcementplantTITANAntea,cur-rently in its third year of operation managed to partially offset the nega-tive trends, by achieving further opera-tional efficiency gains. Throughout the year,capacityutilizationoftheplantwas supported by exports which were higher than in 2011.
BULGARIA
In2012theBulgarianeconomylostmo-mentum and declined by nearly 0.9%.
Cement consumption remained at low levels, similar to the previous year, hav-ing posted a close to 40% cumulative decline, compared to the peak of 2009. Demand for building materials was sup-portedbythecontinuedutilizationofEUstructuralfunds.Despitelowlevelsof construction, imported cement was still estimated at 25% of consumption.
TheinstallationforProcessedEngi-neeredFuelintheZlatnaPanegaplant,successfully completed its first full year of operation, achieving the targets for substitution of conventional by alterna-tive fuels.
F.Y.R. OF MACEDONIA
GDPgrowthwasmodestat1%intheF.Y.R.ofMacedonia.
Harsh weather conditions in early 2012, together with the expected slowdown of construction activities, resulted in the cement market dropping by an estimat-ed 14% compared to 2011, with Usje plant sales following suit. Total exports to neighboring countries remained at the same levels with 2011.
In line with the commitment of TITAN to sustainable development, the Usje cement factory initiated the permitting process for the use of alternative fuels.
KOSOVO
In2012,theeconomyofKosovoachievedaGDPgrowthrateofjustover4%. Unemployment remained above 45%, a significant problem for the national economy.
The residential construction sector remained very active, mainly supported by the inflows of remittances from the diaspora. Foreign direct investment, however, remained low and public ex-penditures in infrastructure faced fund-ing issues. Cement demand remained stable at the same levels as 2011, while import-driven competition intensified.
SERBIA
In2012GDPinSerbiacontructedby2%.
Cement consumption is estimated to have shrunk by more than 8% in 2012, due to the decline of private invest-ments in real estate and the stagnation ofcommercialsectorprojects.Ontheother hand, some important infra-structure projects commenced during the year, which could fuel growth of construction activity in 2013, if they proceed as planned.
In Montenegro, an important market forTITANCementaraKosjeric,cementconsumption also declined by an esti-mated 7% compared to 2011, further impacting the overall financial perfor-mance of our operations.
OurIndustryandour Footprint1034 Message from
the CEO4 AboutTITAN Group6 Our Industry and
our Footprint10 Our Business Modeland Strategy12

SAFETY FIRST
2012 was a good year regarding health andsafetyintheSoutheasternEuroperegion. Although four out of the five plantsintheregionreportedsomeLTIs,those were minor injuries; the extensive training and implementation of the safetysystemspaidoff.InBulgaria,thewhole business unit (cement, concrete andaggregates)reportedoneLTIafterthree years without injuries. In total, eightLTIswerereportedintheregion,same as in 2011. The effort to increase the number of reported and investi-gated near misses continues, as it is considered one of the best practices to improve employee awareness.
OurplantinZlatnaPanega,Bulgariaagain received two awards by the Government and local authorities for its performance in health and safety.
Moreover, the newly developed system for health and safety in the Antea plant in Albania, is transferred and being installedinSharrCeminKosovo,takingadvantage of their common language and making the cross plant sharing of resources a success story.
ENVIRONMENTAL PERFORMANCE
In the spirit of raising awareness and promoting environmental protection, Antea supported the training of teachers fromtheThumanaandBorizanaschoolsontheuseoftheGreenPackdesignedbytheRegionalEnvironmentalCenter.
InZlatnaPanega,thecompletionofthe2-yearStudyonHydrology-Hydrogeolo-gyoftheregionandthesubsequentwa-ter risk assessment with the application oftheGEMILocalWaterTool(LWT)hashelped the development of a “road-map” for sustainable water management and improved performance, by mitigating impacts and risks.
InKosovo,theimplementationofa2-yearmodernizationprogramcon-tributed to the overall improvement of TITAN’s environmental footprint.
InSerbia,TITANinitiatedanAdvisoryBoard,comprisedofrepresentativesof local municipal authorities, medical institutions,media,NGOsandcompanyemployees with the objective to raise awareness and engage with key stake-holders in a process of further improv-ing the plant’s environmental perfor-mance.
STAKEHOLDER ENGAGEMENT
Engagingwithkeystakeholdersatboth local and national levels has con-tinued and expanded in all operations of TITAN Group in the region.
Among the highlights of this on-going effort that should be mentioned is the certification of Antea accordingtoSA8000standard,alongwithISO140001andOHSAS18001.Thiswasaccom-plished with the active involvement of both managers, workers, union representatives as well as customers and suppliers.
InBulgaria,TITANjoinedtheRedCross-managedcampaign“Bulgariaiswithyou”.Withthefundsraisedfromthe campaign and the additional dona-tionsmadebyseverallargeBulgariancompanies, 30 new family homes were built for the families hardest hit by the devastating floods of 6 February 2012, enabling them to spend the winter holidays in their new homes.
InF.Y.R.ofMacedoniastakeholderroundtableswereorganizedin2012to seek feedback from key stakehold-ers interested in learning about Usje’s sustainability strategy. Company representatives also participated in theU.N.BusinessandHumanRightsForum in Geneva, underlining TITAN’s commitment to apply and promote international standards.
InKosovo,oursubsidiarySharrcemsubmitted an official proposal to Municipal Authorities for the establish-mentofaLocalCommunityAdvisoryBoardtooperateasaliaisonbetweenthe Community and our Company in order to streamline our support activi-ties towards the local community. This Panelisamongthefirstofitskindinthe country and is in alignment with TITAN Group’s strategy of engaging with its stakeholders to ensure their needs are met.
Thefirstopenplantdaywasorganizeddrawing more than 5,000 visitors to celebrate the completion of the mo-dernizationoftheplant.
Antea cement plant, Albania
Corporate Governanceand Risk Management14 GroupPerformanceReview18 Tables38 Notable
Information 35Corporate Governanceand Risk Management14 Group Performance Review18 35Corporate Governanceand Risk Management14 Group Performance Review 38 35Corporate Governance
and Risk Management14 Group Performance Review18 NotableInformation

EGYPT
In 2012, the uncertain political situa-tion, compounded by the large govern-ment budget deficit, contributed to a challenging business environment.
Among the most important challenges faced by the cement industry this year, were the shortages in the gas and power supply, which negatively affected cement production volumes and cost. At the same time, steep increases in the price of natural gas and electricity, weighed heavily on cost structure.
Despite the political transition that the country is going through, demand for building materials has proven resilient. Domestic consumption in 2012 reached 51.2 million tons, up by 5.1% from 2011. Cement imports dropped sig-nificantly.Exports,ontheotherhand,increased to 2 million tons compared to 0.7 million in 2011, as local producers tried to regain their position in foreign markets. Total production of the ce-ment industry in 2012 reached53.05 million tons.
The increase of demand for building materials facilitated the absorption of new cement capacity that has come on stream over the last two years, bringing theEgyptianmarkettoanearbalanceof supply and demand. TITAN Cement Egypt,(T.C.E.)localdispatchesin2012reached 4.3 million tons compared to 4.5 million tons in 2011.
The new ready-mix concrete business in Egyptcontinueditsstronggrowth.Ournew plant, established in western Cairo, startedoperationsinSeptember2012,successfully addressing local demand.
Against a background of political uncer-tainty, continuous industrial unrest and numerous labor disputes in the country, T.C.E.employeesactivelysupportedthecompany to achieve its performance targets and overall objectives.
TURKEY
In 2012, Turkey posted healthy eco-nomic growth of approximately 2.2%. Driven by the positive momentum of the country’s economy, cement con-sumption increased by an estimated 4% year on year, reaching a new high of 58 million tons. At the same time, cement exports increased, on the back of market recovery in Russia and signs of improvement from other traditional export destinations in the Mediterrane-an. Despite increased production levels, however, the Turkish cement industry remains one of excess capacity.
Adocim, TITAN’s 50-50 joint-venture with the Ado Group in Turkey, benefited from strong demand both from private housing and public works. The compa-ny’s cement production posted yet an-other record year, while clinker produc-tion was maintained at the 2011 record level. Ready-mix concrete operations increased sales, thus enhancing verti-cal integration. During 2012 Adocim fulfilledsignificantcostoptimizationtargets and improved efficiency, while setting even higher goals for 2013.
Market prospects for 2013 remain posi-tive. Domestic demand is anticipated to continue growing. New housing and transportation projects are expected to continue translating population growth into a sustainable growth trajectory for the sector.
Eastern Mediterranean
Turnover EBITDA
300
280
260
240
220
200Turnover
2011Turnover
2012OrganicGrowth
TranslationImpact
TranslationImpact
€ million
1.1%3.0
5.5%
15.2
€ million
140
120
100
80
60
40
20
0EBITDA2012
EBITDA2011
OrganicGrowth
127.7
94.0
277.8
296.0(38.7)5.0
-30.3%
3.9%
In2012theEasternMediterra-
nean region was for another year
the strongest contributor to the
Group’sprofitability.InEgypt,
despite the backdrop of chal-
lenging conditions, construction
activity remained robust. In Tur-
key, economic growth supported
demand for building materials,
which remained at high levels.
TotalturnoverfortheEastern
Mediterranean region in 2012
increased by 7% versus 2011
reaching €296 million while
EBITDAdeclinedby26%to
€94 million. This decline, is due
for the most part to the ad-
ditional amount of €25 million
includedin2011EBITDAfrom
the refund of the clay tax fee in
Egypt.
OurIndustryandour Footprint1036 Message from
the CEO4 AboutTITAN Group6 Our Industry and
our Footprint10 Our Business Modeland Strategy12

SAFETY FIRST
2012 was a year of solid performance regardinghealthandsafetyintheEast-ern Mediterranean region: All plants achieved very good performance, im-proving on the success of the previous year.MostKPIsimprovedandBeniSuefhad achieved for the third consecu-tiveyearzeroaccidents,whileTokatinTurkeyalsoreducedLTIstozero.
The“SafetyPillars”projectcontinuedin2012.Withinthisframework,eachplantreceived an assignment to develop new or review existing safety rules, with a view to ultimately produce guidelines that will be shared within the region. All tasks were completed and are now under final review. The aim is that the guidelines be distributed for implemen-tationinthe3rdquarterof2013.
BeniSuefwontheTITANGroupBestSafetyPerformanceAwardin2012.
ENVIRONMENTAL PERFORMANCE
Compared to 2011, Group performance related to air emissions improved significantly.Overthelastfewyears,TITAN Group has invested heavily in new technologies to reduce air emissions.
Specificdustemissionshavebeenreduced by almost 50%, exceeding the target set by the Group. This was mainly the result of commissioning new de-dustingequipmentattheAlexan-driaplant,whereelectrostatic(ESP)filters were replaced by bag filters. In parallel, performance improvements were achieved in the existing bag filter systeminkilnline2attheBeniSuefplant, achieving a significant reduction of overall dust emissions.
STAKEHOLDER ENGAGEMENT
TITANEgyptintroducedTITANGroupCode of Conduct to all employees, so as to ensure the rigorous implementa-tion of clear operating principles. The Group Code of Conduct was distributed inEnglishandArabic,toall.Dissemina-tionactivitiesbeganinSeptember2012and more awareness workshops are planned for 2013.
During 2012, volunteer working groups fromtheAlexandriaandBeniSuefworkforce and management distributed dry food bags to poor families in the surrounding local communities.
This initiative took place during Rama-dan with the participation of local authorities,parties,andNGOs.Theobjective of the initiative was to ensure the Company’s support to the poorest areas of the neighboring communities, while also improving relationships with local stakeholders.
During the summer months of 2012, theAlexandriaandBeniSuefplantsof-fered internships to 145 university local students in order to help train them andtofamiliarizethemwiththecementindustry and the career opportunities it offers.
Award ceremony for the winners of TITAN’s Annual Scholarship Program, “Stamatis Douzinas” in Egypt
Corporate Governanceand Risk Management14 GroupPerformanceReview18 Tables38 Notable
Information 37Corporate Governanceand Risk Management14 Group Performance Review18 37Corporate Governanceand Risk Management14 Group Performance Review 38 37Corporate Governance
and Risk Management14 Group Performance Review18 NotableInformation
Awards and Recognitions 2012
Albania SA 8000 certification for Antea, the first company in Albania
Bulgaria Award by the Minister of labor and Social Policy in Bulgaria to Zlatna Panega
Bulgaria National award to Zlatna Panega for Health and Safety at Work
F.Y.R. of Macedonia National Award for "Relations with Employees" for Best Socially Responsible Practices for employee relations and a recognition for Ethical Governance and Stakeholder Engagement
F.Y.R. of Macedonia
The International Trade Fair "Ideas - Inventions - New products 2012" awarded TITAN Cementarnica Usje for the patent "New method for monitoring the equipment conditions of low-speed machines: Bronze medal from the International Jury, Diploma from the Hungarian Union of Inventors and Certificate for contribution from the Society of Women Inventors from Bosnia and Herzegovina
Greece Aegean University in Greece awarded TITAN Cement S.A., for the fifth consecutive year withthe 1st prize for the quality and completeness of its CSR and Sustainability Report
GreeceQuality Net Foundation, in the framework of "Bravo" Awards, awared TITAN Cement SA with a recognition for meeting stakeholder expectations in reporting social and environmental performance
Kosovo"Taxpayer of the year 2011" certificate: SharrCem was awarded based on the official data of the taxpayers and also as the company ogtaining the highest number of employees in the country giving their contribution in helping to preserve the welfare of the citizens of the country
Turkey Artova Municipality: Thank award for the Artova lake restoration
Turkey Social insurance office award for protecting labor rights and for timely payment of insurance fees
Turkey Tokat Environment Office awarded Adocim on Environment Day
U.S.A.
Carolina Ready-mix Concrete Association recognized S&W: Honorable mention for the CRMCA Environmental Excellence Award for the Goldsboro Plant, First Place CRMCA Environmental Improvement Award for the Holly Ridge Plant, Honorable mention for the CRMCA Environmental Improvement Award for the Jacksonville and Georgetown locations
U.S.A.
Environmental Protection Agency's Energy Star Challenge for Industry: Recognition to four Roanoke Cement distribution terminals (Castle Hayne, NC and in Richmond, Front Royal and Chesapeake, VA), as plants that demonstrate a commitment to the environment by achieving a 10% reduction in energy intensity within five or fewer years
U.S.A. NRMCA 1st Place Environmental Excellence Award in the 25.000 to 50.000 annual yardage category at the NRMCA Concrete Works Conference and Expo for the Clear Brook RM plant
U.S.A.
NRMCA Excellence in Quality Awards to TITAN America for excellence in quality and outstanding environmental practices (six plants: Tarmac America LLC, North Central Region, Port Orange, Tarmac America LLC, Southern Region, Daytona Beach, Tarmac America LLC, West Coast Region, Venice, TITAN Virginia R-M, Northern Region, Sterling, Powhatan Ready-Mix, Richmond, and TITAN Virginia Ready-mix, Southern Virginia Division, Norfolk
U.S.A. NRMCA Green Star Certification for the Southport, the Wlimington and the Clear Brook RM plants
U.S.A. PCA honored Roanoke Cement plant and Castle Hayne, North Carolina terminal for excellence in environmental outreach and terminal safety
U.S.A. PCA Recognition in the association's Sustainable Concrete Plant Certification program for the Clear Brook RM plant
U.S.A. WBCSD: "Trout pond" acknowledgement in the October release of the WBCSD Ecosystems document (2012 Jeju WCC, organized by the IUCN) for the RNK plants
U.S.A. Wildlife Habitat Council certification for both of TITAN America's cement plants for their "Wildlife at Work programs
OurIndustryandour Footprint1038 Message from
the CEO4 AboutTITAN Group6 Our Industry and
our Footprint10 Our Business Modeland Strategy12
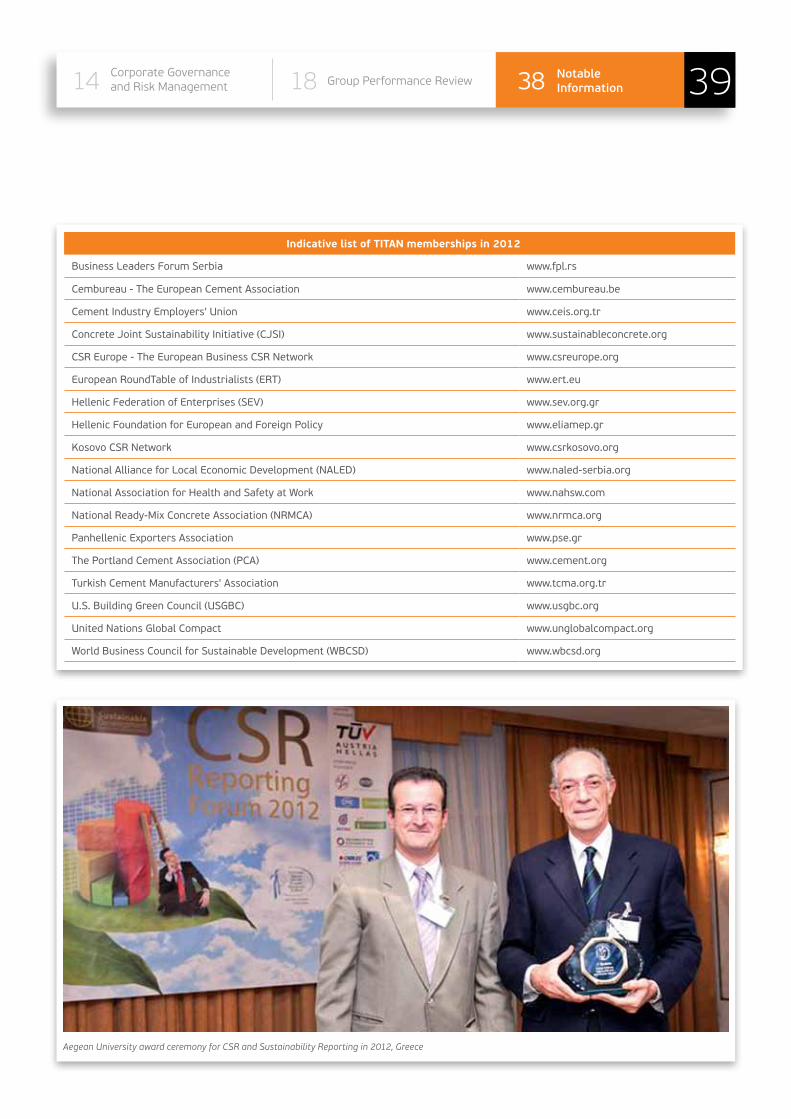
Indicative list of TITAN memberships in 2012
Business Leaders Forum Serbia www.fpl.rs
Cembureau - The European Cement Association www.cembureau.be
Cement Industry Employers' Union www.ceis.org.tr
Concrete Joint Sustainability Initiative (CJSI) www.sustainableconcrete.org
CSR Europe - The European Business CSR Network www.csreurope.org
European RoundTable of Industrialists (ERT) www.ert.eu
Hellenic Federation of Enterprises (SEV) www.sev.org.gr
Hellenic Foundation for European and Foreign Policy www.eliamep.gr
Kosovo CSR Network www.csrkosovo.org
National Alliance for Local Economic Development (NALED) www.naled-serbia.org
National Association for Health and Safety at Work www.nahsw.com
National Ready-Mix Concrete Association (NRMCA) www.nrmca.org
Panhellenic Exporters Association www.pse.gr
The Portland Cement Association (PCA) www.cement.org
Turkish Cement Manufacturers' Association www.tcma.org.tr
U.S. Building Green Council (USGBC) www.usgbc.org
United Nations Global Compact www.unglobalcompact.org
World Business Council for Sustainable Development (WBCSD) www.wbcsd.org
Aegean University award ceremony for CSR and Sustainability Reporting in 2012, Greece
Corporate Governanceand Risk Management14 GroupPerformanceReview18 Tables38 Notable
Information 39Corporate Governanceand Risk Management14 Group Performance Review18 39Corporate Governanceand Risk Management14 Group Performance Review 38 39Corporate Governance
and Risk Management14 Group Performance Review18 NotableInformation 39Group Performance Review18 38 NotableInformation
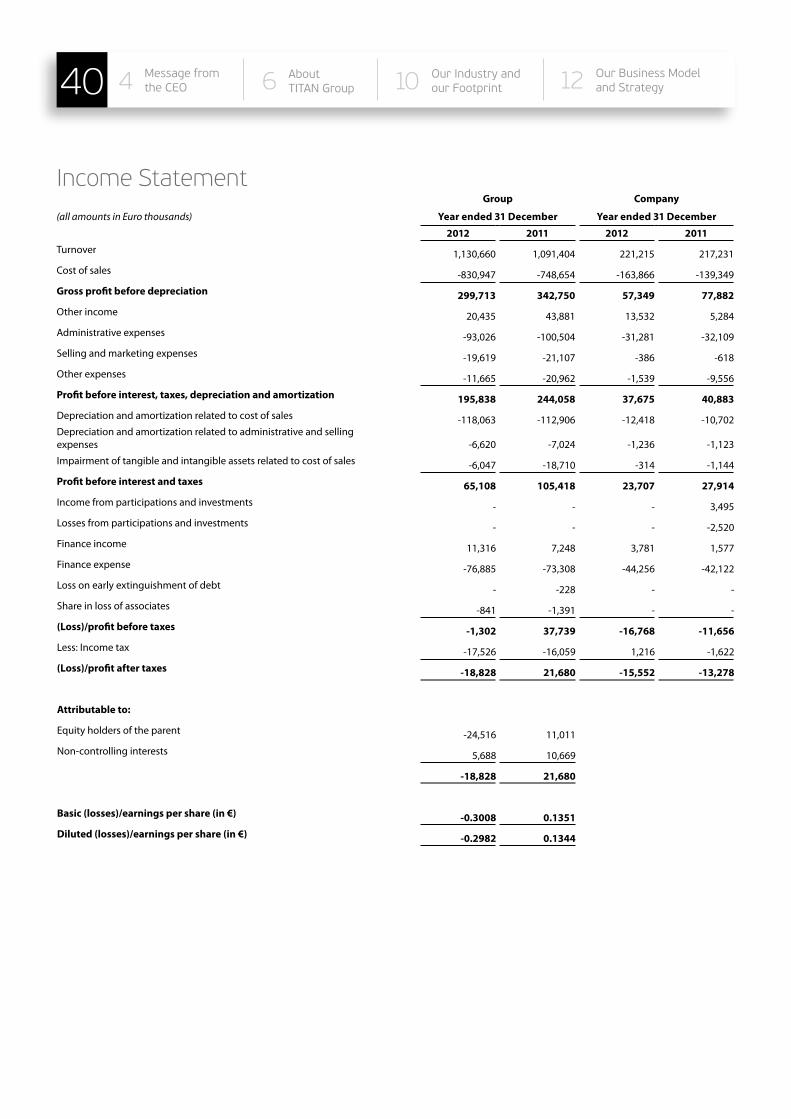
Income StatementGroup Company
(all amounts in Euro thousands) Year ended 31 December Year ended 31 December
2012 2011 2012 2011Turnover 1,130,660 1,091,404 221,215 217,231
Cost of sales -830,947 -748,654 -163,866 -139,349
Gross profit before depreciation 299,713 342,750 57,349 77,882Other income 20,435 43,881 13,532 5,284
Administrative expenses -93,026 -100,504 -31,281 -32,109
Selling and marketing expenses -19,619 -21,107 -386 -618
Other expenses -11,665 -20,962 -1,539 -9,556
Profit before interest, taxes, depreciation and amortization 195,838 244,058 37,675 40,883Depreciation and amortization related to cost of sales -118,063 -112,906 -12,418 -10,702Depreciation and amortization related to administrative and selling expenses -6,620 -7,024 -1,236 -1,123
Impairment of tangible and intangible assets related to cost of sales -6,047 -18,710 -314 -1,144
Profit before interest and taxes 65,108 105,418 23,707 27,914Income from participations and investments - - - 3,495
Losses from participations and investments - - - -2,520
Finance income 11,316 7,248 3,781 1,577
Finance expense -76,885 -73,308 -44,256 -42,122
Loss on early extinguishment of debt - -228 - -
Share in loss of associates -841 -1,391 - -
(Loss)/profit before taxes -1,302 37,739 -16,768 -11,656Less: Income tax -17,526 -16,059 1,216 -1,622
(Loss)/profit after taxes -18,828 21,680 -15,552 -13,278
Attributable to:
Equity holders of the parent -24,516 11,011
Non-controlling interests 5,688 10,669
-18,828 21,680
Basic (losses)/earnings per share (in €) -0.3008 0.1351Diluted (losses)/earnings per share (in €) -0.2982 0.1344
OurIndustryandour Footprint1040 Message from
the CEO4 AboutTITAN Group6 Our Industry and
our Footprint10 Our Business Modeland Strategy12

Statement of Financial Position(all amounts in Euro thousands) Group Company
Assets 31/12/2012 31/12/2011 31/12/2012 31/12/2011
Property, plant & equipment 1,759,036 1,887,488 237,672 251,111
Investment property 8,546 9,804 11,959 11,312
Intangible assets and goodwill 527,498 546,111 1,099 1,112
Investments in subsidiaries - - 1,213,365 1,182,854
Investments in associates 2,734 8,213 - -
Available-for-sale financial assets 1,877 2,143 108 108
Other non current assets 12,572 10,555 2,690 2,710
Deferred income tax asset 2,499 2,198 - -
Non-current assets 2,314,762 2,466,512 1,466,893 1,449,207
Inventories 233,765 242,765 69,080 68,761
Receivables and prepayments 199,180 224,960 57,299 63,869
Derivative financial instruments - 772 - -
Available-for-sale financial assets 63 63 61 61
Cash and cash equivalents 284,272 333,935 35,601 29,478
Current assets 717,280 802,495 162,041 162,169
Total Assets 3,032,042 3,269,007 1,628,934 1,611,376
Equity and Liabilities
Share capital ( 84,632,528 shares of € 4.00) 338,530 338,530 338,530 338,530
Share premium 22,826 22,826 22,826 22,826
Share options 2,891 1,358 2,891 1,358
Treasury shares -89,446 -89,446 -89,446 -89,446
Other reserves 381,027 427,028 508,380 511,301
Retained earnings 878,635 857,170 -6,518 4,861
Equity attributable to equity holders of the parent 1,534,463 1,557,466 776,663 789,430
Non-controlling interests 125,478 142,982 - -
Total equity (a) 1,659,941 1,700,448 776,663 789,430
Long-term borrowings 705,227 815,095 741,950 620,360
Derivative financial instruments 16,784 17,826 5,875 5,824
Deferred income tax liability 178,786 191,863 17,972 19,990
Retirement benefit obligations 26,908 29,721 11,299 14,442
Provisions 17,317 16,553 1,736 1,558
Other non-current liabilities 30,632 26,590 5,043 6,399
Non-current liabilities 975,654 1,097,648 783,875 668,573
Short-term borrowings 174,636 226,564 24,468 104,692
Trade and other payables 207,009 220,086 42,586 47,017
Derivative financial instruments 1,294 - - -
Income tax payable 11,899 22,202 - -
Provisions 1,609 2,059 1,342 1,664
Current liabilities 396,447 470,911 68,396 153,373
Total liabilities (b) 1,372,101 1,568,559 852,271 821,946
Total Equity and Liabilities (a+b) 3,032,042 3,269,007 1,628,934 1,611,376
Corporate Governanceand Risk Management14 GroupPerformanceReview18 Tables38 Notable
Information 41Corporate Governanceand Risk Management14 Group Performance Review18 41Corporate Governanceand Risk Management14 Group Performance Review 38 41Corporate Governance
and Risk Management14 Group Performance Review18 NotableInformation 41Group Performance Review18 38 NotableInformation
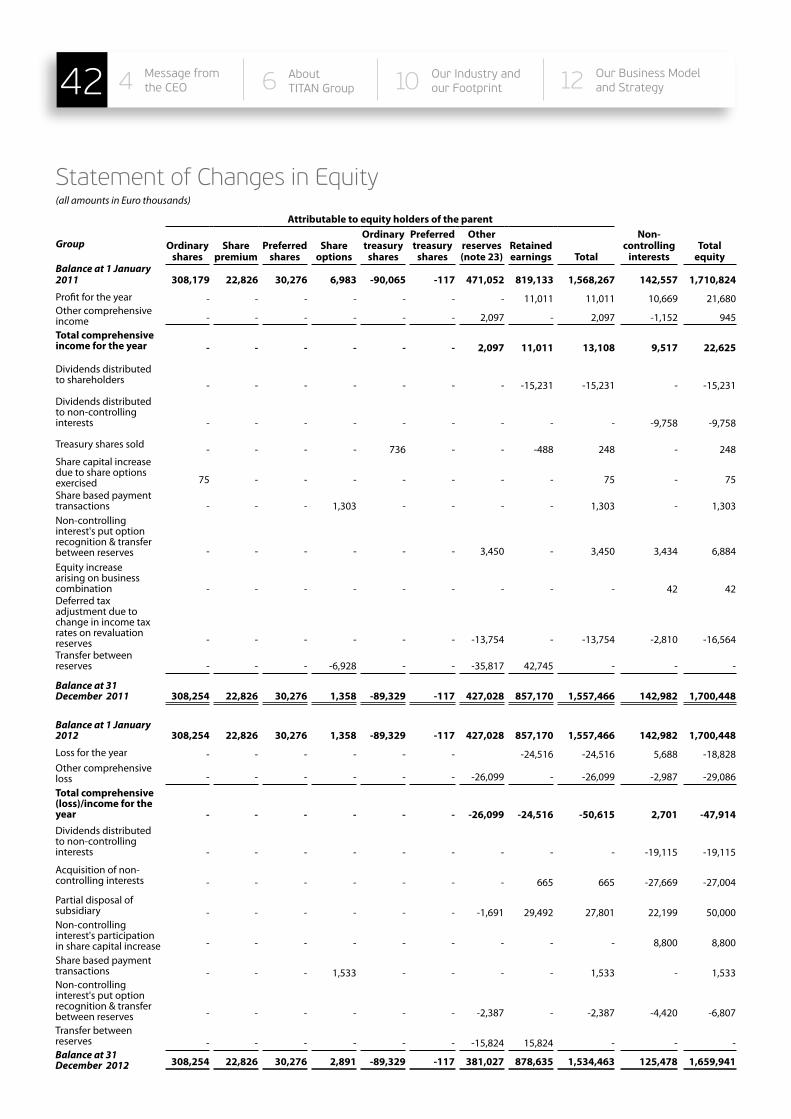
Statement of Changes in Equity(all amounts in Euro thousands)
Attributable to equity holders of the parent
Group Ordinary shares
Share premium
Preferred shares
Share options
Ordinary treasury
shares
Preferred treasury
shares
Other reserves (note 23)
Retained earnings Total
Non-controlling
interestsTotal
equityBalance at 1 January 2011 308,179 22,826 30,276 6,983 -90,065 -117 471,052 819,133 1,568,267 142,557 1,710,824
Profit for the year - - - - - - - 11,011 11,011 10,669 21,680Other comprehensive income - - - - - - 2,097 - 2,097 -1,152 945
Total comprehensive income for the year - - - - - - 2,097 11,011 13,108 9,517 22,625
Dividends distributed to shareholders - - - - - - - -15,231 -15,231 - -15,231Dividends distributed to non-controlling interests - - - - - - - - - -9,758 -9,758
Treasury shares sold - - - - 736 - - -488 248 - 248Share capital increase due to share options exercised 75 - - - - - - - 75 - 75Share based payment transactions - - - 1,303 - - - - 1,303 - 1,303Non-controlling interest's put option recognition & transfer between reserves - - - - - - 3,450 - 3,450 3,434 6,884Equity increase arising on business combination - - - - - - - - - 42 42Deferred tax adjustment due to change in income tax rates on revaluation reserves - - - - - - -13,754 - -13,754 -2,810 -16,564Transfer between reserves - - - -6,928 - - -35,817 42,745 - - -
Balance at 31 December 2011 308,254 22,826 30,276 1,358 -89,329 -117 427,028 857,170 1,557,466 142,982 1,700,448
Balance at 1 January 2012 308,254 22,826 30,276 1,358 -89,329 -117 427,028 857,170 1,557,466 142,982 1,700,448
Loss for the year - - - - - - -24,516 -24,516 5,688 -18,828Other comprehensive loss - - - - - - -26,099 - -26,099 -2,987 -29,086Total comprehensive (loss)/income for the year - - - - - - -26,099 -24,516 -50,615 2,701 -47,914Dividends distributed to non-controlling interests - - - - - - - - - -19,115 -19,115
Acquisition of non-controlling interests - - - - - - - 665 665 -27,669 -27,004
Partial disposal of subsidiary - - - - - - -1,691 29,492 27,801 22,199 50,000Non-controlling interest's participation in share capital increase - - - - - - - - - 8,800 8,800
Share based payment transactions - - - 1,533 - - - - 1,533 - 1,533Non-controlling interest's put option recognition & transfer between reserves - - - - - - -2,387 - -2,387 -4,420 -6,807
Transfer between reserves - - - - - - -15,824 15,824 - - -Balance at 31 December 2012 308,254 22,826 30,276 2,891 -89,329 -117 381,027 878,635 1,534,463 125,478 1,659,941
OurIndustryandour Footprint1042 Message from
the CEO4 AboutTITAN Group6 Our Industry and
our Footprint10 Our Business Modeland Strategy12
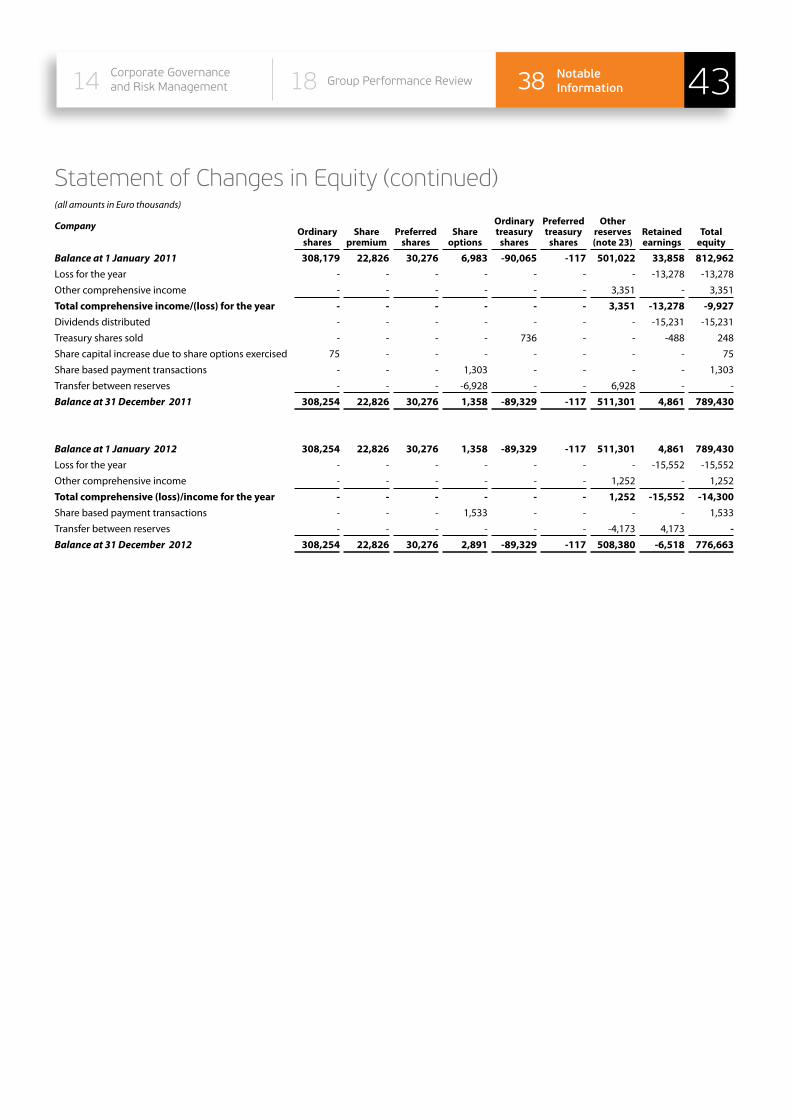
Statement of Changes in Equity (continued)(all amounts in Euro thousands)
Company Ordinary shares
Share premium
Preferred shares
Share options
Ordinary treasury
shares
Preferred treasury
shares
Other reserves (note 23)
Retained earnings
Total equity
Balance at 1 January 2011 308,179 22,826 30,276 6,983 -90,065 -117 501,022 33,858 812,962Loss for the year - - - - - - - -13,278 -13,278Other comprehensive income - - - - - - 3,351 - 3,351Total comprehensive income/(loss) for the year - - - - - - 3,351 -13,278 -9,927Dividends distributed - - - - - - - -15,231 -15,231Treasury shares sold - - - - 736 - - -488 248Share capital increase due to share options exercised 75 - - - - - - - 75Share based payment transactions - - - 1,303 - - - - 1,303Transfer between reserves - - - -6,928 - - 6,928 - -Balance at 31 December 2011 308,254 22,826 30,276 1,358 -89,329 -117 511,301 4,861 789,430
Balance at 1 January 2012 308,254 22,826 30,276 1,358 -89,329 -117 511,301 4,861 789,430Loss for the year - - - - - - - -15,552 -15,552Other comprehensive income - - - - - - 1,252 - 1,252Total comprehensive (loss)/income for the year - - - - - - 1,252 -15,552 -14,300Share based payment transactions - - - 1,533 - - - - 1,533Transfer between reserves - - - - - - -4,173 4,173 -Balance at 31 December 2012 308,254 22,826 30,276 2,891 -89,329 -117 508,380 -6,518 776,663
Corporate Governanceand Risk Management14 GroupPerformanceReview18 Tables38 Notable
Information 43Corporate Governanceand Risk Management14 Group Performance Review18 43Corporate Governanceand Risk Management14 Group Performance Review 38 43Corporate Governance
and Risk Management14 Group Performance Review18 NotableInformation 43Group Performance Review18 38 NotableInformation

Cash Flow StatementGroup Company
(all amounts in Euro thousands) Group Company
Year ended 31 December Year ended 31 December
2012 2011 2012 2011
Cash flows from operating activities
Cash generated from operations 186,404 240,548 38,700 45,890Income tax paid -21,374 -36,988 -2,711 -18,670
Net cash generated from operating activities (a) 165,030 203,560 35,989 27,220
Cash flows from investing activities
Purchase of property, plant and equipment -44,761 -56,150 -5,669 -6,314
Purchase of intangible assets -6,208 -1,917 -1,717 -139
Proceeds from sale of property, plant and equipment 28,637 15,484 6,439 286
Proceeds from dividends 39 7 - 269
Acquisition of subsidiaries, net of cash acquired -100 -111 - -
Share capital increase in subsidiaries - - -30,511 -6,139
Acquisition of non controlling interests -19,004 - - -Proceeds/(payments) from the disposal/acquisition of available-for-sale financial assets 37 -44 - -1
Interest received 4,235 4,355 950 204
Net cash flows used in investing activities (b) -37,125 -38,376 -30,508 -11,834
Net cash flows after investing activities (a)+(b) 127,905 165,184 5,481 15,386Cash flows from financing activitiesProceeds from non-controlling interest's participation in subsidiary's share capital increase 8,800 - - -
Proceeds from partial disposal of subsidiary's ownership 50,000 - - -
Proceeds from issuance of ordinary shares - 75 - 75
Sale of treasury shares - 248 - 248
Proceeds from government grants 8 88 8 88
Interest paid -73,351 -54,918 -38,180 -37,898
Dividends paid to shareholders -31 -15,270 -31 -15,270
Dividends paid to non-controlling interests -19,115 -9,665 - -
Proceeds from borrowings 788,746 628,301 214,449 156,984
Payments of borrowings -936,978 -446,923 -175,635 -93,078
Net cash flows (used in)/from financing activities (c) -181,921 101,936 611 11,149
Net (decrease)/increase in cash and cash equivalents (a)+(b)+(c) -54,016 267,120 6,092 26,535Cash and cash equivalents at beginning of the year 333,935 67,070 29,478 2,943
Effects of exchange rate changes 4,353 -255 31 -
Cash and cash equivalents at end of the year 284,272 333,935 35,601 29,478
OurIndustryandour Footprint1044 Message from
the CEO4 AboutTITAN Group6 Our Industry and
our Footprint10 Our Business Modeland Strategy12
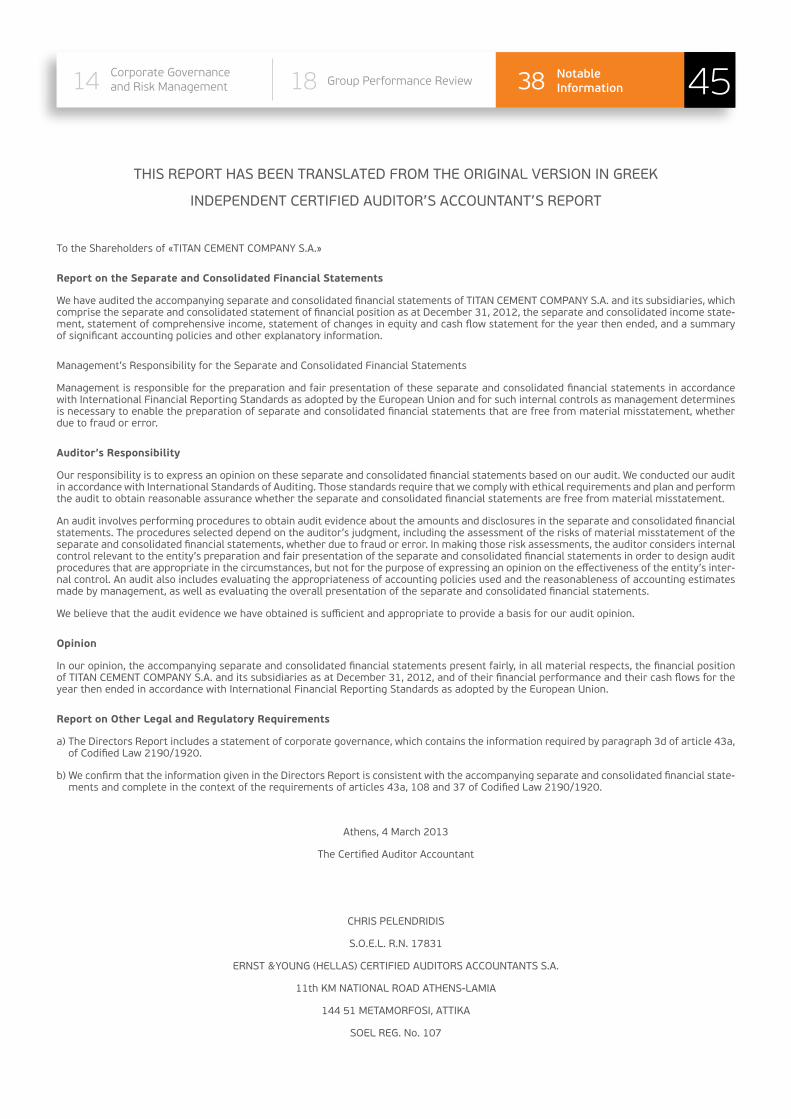
THIS REPORT HAS BEEN TRANSLATED FROM THE ORIGINAL VERSION IN GREEK
INDEPENDENT CERTIFIED AUDITOR’S ACCOUNTANT’S REPORT
To the Shareholders of «TITAN CEMENT COMPANY S.A.»
Report on the Separate and Consolidated Financial Statements
We have audited the accompanying separate and consolidated financial statements of TITAN CEMENT COMPANY S.A. and its subsidiaries, which comprise the separate and consolidated statement of financial position as at December 31, 2012, the separate and consolidated income state-ment, statement of comprehensive income, statement of changes in equity and cash flow statement for the year then ended, and a summary of significant accounting policies and other explanatory information.
Management’s Responsibility for the Separate and Consolidated Financial Statements
Management is responsible for the preparation and fair presentation of these separate and consolidated financial statements in accordance with International Financial Reporting Standards as adopted by the European Union and for such internal controls as management determines is necessary to enable the preparation of separate and consolidated financial statements that are free from material misstatement, whether due to fraud or error.
Auditor’s Responsibility
Our responsibility is to express an opinion on these separate and consolidated financial statements based on our audit. We conducted our audit in accordance with International Standards of Auditing. Those standards require that we comply with ethical requirements and plan and perform the audit to obtain reasonable assurance whether the separate and consolidated financial statements are free from material misstatement.
An audit involves performing procedures to obtain audit evidence about the amounts and disclosures in the separate and consolidated financial statements. The procedures selected depend on the auditor’s judgment, including the assessment of the risks of material misstatement of the separate and consolidated financial statements, whether due to fraud or error. In making those risk assessments, the auditor considers internal control relevant to the entity’s preparation and fair presentation of the separate and consolidated financial statements in order to design audit procedures that are appropriate in the circumstances, but not for the purpose of expressing an opinion on the effectiveness of the entity’s inter-nal control. An audit also includes evaluating the appropriateness of accounting policies used and the reasonableness of accounting estimates made by management, as well as evaluating the overall presentation of the separate and consolidated financial statements.
We believe that the audit evidence we have obtained is sufficient and appropriate to provide a basis for our audit opinion.
Opinion
In our opinion, the accompanying separate and consolidated financial statements present fairly, in all material respects, the financial position of TITAN CEMENT COMPANY S.A. and its subsidiaries as at December 31, 2012, and of their financial performance and their cash flows for the year then ended in accordance with International Financial Reporting Standards as adopted by the European Union.
Report on Other Legal and Regulatory Requirements
a) The Directors Report includes a statement of corporate governance, which contains the information required by paragraph 3d of article 43a, of Codified Law 2190/1920.
b) We confirm that the information given in the Directors Report is consistent with the accompanying separate and consolidated financial state-ments and complete in the context of the requirements of articles 43a, 108 and 37 of Codified Law 2190/1920.
Athens, 4 March 2013
The Certified Auditor Accountant
CHRIS PELENDRIDIS
S.O.E.L. R.N. 17831
ERNST &YOUNG (HELLAS) CERTIFIED AUDITORS ACCOUNTANTS S.A.
11th KM NATIONAL ROAD ATHENS-LAMIA
144 51 METAMORFOSI, ATTIKA
SOEL REG. No. 107
Corporate Governanceand Risk Management14 GroupPerformanceReview18 Tables38 Notable
Information 45Corporate Governanceand Risk Management14 Group Performance Review18 45Corporate Governanceand Risk Management14 Group Performance Review 38 45Corporate Governance
and Risk Management14 Group Performance Review18 NotableInformation 45Group Performance Review18 38 NotableInformation

TITAN Group - Cement Plants, Attached and Related Quarries Performance
WBCSD/CSI Description 2010 2011 2012
Climate Change
Total direct CO2 emissions (gross), metric tons
based on specific year equity 10.4 million 8.6 million 9.6 million
based on 2009 equity 10.1 million 8.2 million 9.4 million
Direct CO2 emissions (gross), kg /tProduct(1)
based on specific year equity 654.2 623.8 658.7
based on 2009 equity 654.2 625.4 662.7
Alternative fuels and material
Energy efficiency, kcal/kgClinker 843.9 839.0 836.1
Alternative fuel substitution for conventional fuels, %
based on specific year equity 1.43 1.50 2.98
based on 2009 equity 1.43 1.56 3.03
Biomass in kiln fuel, %
based on specific year equity 0.87 1.13 1.86
based on 2009 equity 0.87 1.17 1.89
Total alternative raw materials consumption, metric tons 1.1 million 1.2 million 1.2 million
Alternative raw materials (clinker and cement), % 5.3 6.6 6.0
Clinker to cement ratio 0.84 0.83 0.85
Emissions
Total dust particulates, metric tons
based on specific year equity 1,866 1,693 972
based on 2009 equity 1,866 1,601 963
Dust particulates, g/tClinker
based on specific year equity 153.6 162.6 83.5
based on 2009 equity 153.6 159.2 83.9
Total NOx, metric tons
based on specific year equity 22,561 17,523 21,361
based on 2009 equity 22,561 17,152 21,079
NOx, g/tClinker
based on specific year equity 1,857 1,683 1,835
based on 2009 equity 1,857 1,706 1,836
Total SOx, metric tons
based on specific year equity 2,567 2,468 2,277
based on 2009 equity 2,567 2,433 2,266
SOx, g/tClinker
based on specific year equity 211.3 237.1 195.6
based on 2009 equity 211.3 241.9 197.4
Clinker produced with monitoring of major and minor emissions, % 100 100 100
OurIndustryandour Footprint1046 Message from
the CEO4 AboutTITAN Group6 Our Industry and
our Footprint10 Our Business Modeland Strategy12

WBCSD/CSI Description 2010 2011 2012
All activities/Additional indicators
Total heat consumption, TJ
Cement plants and attached quarries 42,912 36,559 40,765
Cement plants, attached and related quarries 42,919 36,562 40,771
Total alternative fuels, metric tons 32,290 30,630 68,050
Total electrical energy consumption, GWh
Cement plants and attached quarries 1,639 1,437 1,536
Cement plants, attached and related quarries 1,639 1,437 1,536
Total indirect(2) CO2 emissions, metric tons
based on specific year equity 1.1 million 0.9 million 1.0 million
based on 2009 equity 1.1 million 0.9 million 1.0 million
Total water consumption, m3 5.3 million 4.4 million 3.9 million
Total water consumption, lt/tCement
based on specific year equity 362.3 340.1 300.0
based on 2009 equity 362.3 347.7 298.4
(1) In accordance to latest version of the WBCSD protocol (ver.3.0), figure was revised to take into account the amount of Pro-Ash® sold, not produced.(2) Indirect CO2 emissions are related to emissions released for the production of the electrical energy consumed at our facilities. For their calculation we use emission
factors provided by the supplier of the electrical energy or other publicly available data. If no such data are available, the most recent data provided by CSI are used. In 2013, data for 2010 and 2011 were recalculated to take into account more accurate information regarding emissions factors for Greece and Kosovo.
WBCSD/CSI Description 2010 2011 2012
Localimpacts
Active quarry sites with biodiversity issues(1,3) 5 9 8
Active quarry sites with biodiversity management plans(2,3) 2 3 3
Active quarry sites with biodiversity management plans(2,3), % 40 33 38
Sites with community engagement plans, % 100.0 100.0 100.0
Sites with quarry rehabilitation plans(3), % 48 63 65
(1) Active quarries within, containing or adjacent to areas designated for their high biodiversity value.(2) Sites with high biodiversity value where biodiversity management plans are actively implemented.(3) Since 2012, coverage of wholly owned active quarries has expanded, to include both quarries attached to our cement plants and quarries for aggregates production.
WBCSD/CSI Description 2010 2011 2012
Healthand Safety
Employee fatalities 0 0 1
Employee fatality rate 0 0 2.69
Contractor fatalities 0 1 0
Third-party fatalities 0 0 0
Employee Lost Time Injury (LTI) 18 11 8
Employee Lost Time Injury Frequency Rate (LTIFR) 2.49 1.54 1.13
Employee lost working days 1,234 850 905
Employee Lost Time Injury Severity Rate 171 119 128
Contractor Lost Time Injury (LTI) 11 8 12
Corporate Governanceand Risk Management14 GroupPerformanceReview18 Tables38 Notable
Information 47Corporate Governanceand Risk Management14 Group Performance Review18 47Corporate Governanceand Risk Management14 Group Performance Review 38 47Corporate Governance
and Risk Management14 Group Performance Review18 NotableInformation 47Group Performance Review18 38 NotableInformation
