accident and emergency department survey 2014 - jersey and... · josi breeden andrew cameron...
TRANSCRIPT
Accident and Emergency Department Survey 2014
STATES OF JERSEY HEALTH & SOCIAL SERVICES
FINAL REPORT
SEPTEMBER 2014 Trust ID: R25 UKEME2014/29

................................................................................................................................................................................................... Accident and Emergency Department Survey 2014 States of Jersey Health & Social Services Copyright 2014 Picker Institute Europe. All rights reserved. Page 1
Contacting Picker Institute Europe
How to contact us: Picker Institute Europe Survey Team: Grace Baker Stephen Bough Josi Breeden Andrew Cameron Giuseppe Capristo Vincent Coole Lucas Daly Jaana Kosunen Tim Markham Ida Monfared Afroditi Pekou Alex Rawet Dominic Shaw Lisa Yorke Picker Institute Europe Buxton Court 3 West Way Oxford OX2 0JB Tel: 01865 208 100 Fax: 01865 208 101 Email: [email protected] Website: www.pickereurope.org Results website: www.picker-results.org Charity Registration No: 1081688 Quality Assurance and Information Security Management: Picker Institute Europe has UKAS accredited certification for ISO20252:2012 (cert. no. GB08/74322) and ISO27001:2005 (cert. no. GB10/80275). Picker Institute Europe is registered under the Data Protection Act 1998 (Z4942556).

................................................................................................................................................................................................... Accident and Emergency Department Survey 2014 States of Jersey Health & Social Services Copyright 2014 Picker Institute Europe. All rights reserved. Page 2
Section 1 Introduction
Section 2 Survey Response survey activity
Section 3 Problem Score Summary overview of results by section
Section 4 Ranked Problem Scores where most patients report room for improvement
Section 5 Historical Comparisons comparing results with previous years
Section 6 External Benchmarks comparing results with other trusts
Section 7 Internal Benchmarks comparing results within the trust
Appendix 1 Frequency Tables a detailed breakdown of your results
Appendix 2 Questionnaire

................................................................................................................................................................................................... Accident and Emergency Department Survey 2014 States of Jersey Health & Social Services Copyright 2014 Picker Institute Europe. All rights reserved. Page 4
SECTION 1
Introduction


................................................................................................................................................................................................... Accident and Emergency Department Survey 2014 States of Jersey Health & Social Services Copyright 2014 Picker Institute Europe. All rights reserved. Page 6
Accident and Emergency Department Survey 2014
States of Jersey Health & Social Services
Background to the survey The results presented here are from the Accident and Emergency Department Survey 2014, carried out by Picker Institute Europe on behalf of States of Jersey Health & Social Services. The survey is based on a random selection of A&E attendees in January, February or March 2014. Please note that the word “Trust” is referring to your Hospital. The purpose of the survey is to understand what patients think of healthcare services provided by the Trust. All trusts used a standard survey methodology and standard questions, as specified by the NHS Patient Survey Co-ordination Centre, based at Picker Institute Europe. The questionnaire reflects the priorities and concerns of patients and is based upon what is most important from the patient's perspective. The questionnaire was developed through consultation with patients, clinicians and trusts. The questionnaires used for the Accident and Emergency Department Survey 2014 were developed by the NHS Patient Survey Co-ordination Centre. Further information about how the questionnaire for this survey was developed can be found on the NHS Surveys website www.nhssurveys.org.uk.
Survey methodology The survey was undertaken by a postal questionnaire, sent to patients’ home addresses. Patients were sent a questionnaire, a covering letter from the Trust's Chief Executive, a multiple language sheet offering help with the survey, and a freepost envelope. Patients wishing to complete the survey filled it in and returned it to the Picker Institute in the freepost envelope. Non-responders were sent a reminder card after 2-3 weeks and another questionnaire after a further 2-3 weeks. The Picker Institute ran a freephone helpline for patients who had any queries or concerns about the survey. This included links to Languageline with immediate access to interpreters in over 100 languages. For a detailed description of the survey methodology, see the published guidance for this survey:
About your respondents A total of 850 patients from your Trust were sent a questionnaire. 827 were eligible for the survey, of which 391 returned a completed questionnaire, giving a response rate of 47%. The average response rate for the 2012 National Survey was 34%. Key facts about the 391 patients who responded to the survey: • 20% of patients have previously been to A&E for the same condition or something related. • 47% of patients say they have a long-standing condition. • 15% of patients arrived at the trust by Ambulance. • 85% of patients went home at the end of their A&E visit. • 89% of patients spent less than 4 hours in A&E during their last visit. • 50% were male; 50% were female. • 27% were aged 16-39; 37% were aged 40-59; 15% were aged 60-69 and 20% were aged 70+

................................................................................................................................................................................................... Accident and Emergency Department Survey 2014 States of Jersey Health & Social Services Copyright 2014 Picker Institute Europe. All rights reserved. Page 7
Your results This survey has highlighted the many positive aspects of the patient experience. • The new overall rating question which is a scale from 0-10, 86% of patients scored 7 or better. The average score is 8 which compares with an average of 8 for all ‘Picker’ trusts. • The Accident and Emergency Department was fairly clean/very clean, 99%. • Received test results before leaving the trust, 91%. • They did not feel threatened by other patients, 96%. • Overall patients felt treated with respect and dignity, 84%. Most patients are highly appreciative of the care they receive. However, it is evident that there is also room for improving the patient experience. Picker Institute Europe uses a simple summary score to show you where your patients think there is a problem or room for improvement regarding a specific aspect of care.
Problem scores At the Picker Institute, we use the concept of ‘problem scores’ as a summary measure, to help monitor your results over time and to show how your Trust compares to the average score for all 'Picker' trusts. We hope that you will find problem scores a helpful way of targeting areas in need of attention within your Trust – this in turn can help you to bring about real quality improvement for your patients. What is a problem score? The problem score shows the percentage of patients for each question who, by their response, indicated that a particular aspect of their care could have been improved. We have found this to be the simplest summary measure that focuses on quality improvement. How are problem scores calculated? We calculate the problem scores by combining response categories. For example, for the following question ‘Were you involved as much as you wanted to be in decisions about your care and treatment?’ we have combined the responses ‘Yes, to some extent’ and ‘No’, to create a single problem score. Asterisks indicate which response categories have been combined to create the problem score.

................................................................................................................................................................................................... Accident and Emergency Department Survey 2014 States of Jersey Health & Social Services Copyright 2014 Picker Institute Europe. All rights reserved. Page 8
How should we use problem scores? As the name suggests, problem scores indicate where there may be a problem within the trust, and may need further investigation. It is useful to keep in mind, that lower scores reflect better performance. Where there are high problem scores, or scores that are high in comparison with other trusts, this area should be highlighted as a potential problem area that needs to be looked at further. By targeting these areas, you can hopefully start to bring about real quality improvement for your patients. Problem scores are an interpretation of the data made by the Picker Institute. Any comparisons made within the Trust (internal benchmarks, historic comparisons) or between trusts (external benchmarks) are made using these scores. When data is provided to the Care Quality Commission, only the raw data is provided, not the problem scores.
Targeted questions In response to client feedback and in the interests of accuracy we use derived questions to produce more meaningful scores for questions that may not be applicable to all respondents, but are not preceded by a filter question – in other words, all those that have a response code such as I was not distressed, or I did not see a doctor or a nurse. The purpose is to produce more precise indicators of where the problems lie within the Trust. For each question of this nature we have therefore re-calculated the scores, excluding those respondents to whom the question does not apply. The new calculation will be illustrated in an additional question (e.g. Q10+).
Low numbers of respondents The questionnaire used includes some filter questions, whereby only relevant questions are asked of patients. So, for example, patients that have reported not having tests would not be asked subsequent questions about tests, and patients reporting not being given new medications would not be asked subsequent questions about their medicines. This means that fewer patients will answer some of the questions in the questionnaire. Where fewer than 50 patients have answered a particular question, the problem score will be shown within square brackets [43%]. If this is the case, the result should be treated with caution, as the number of patients answering is relatively small.
Confidence intervals The survey undertaken was with a sample of patients. As the survey was not of all patients, the results may not be totally accurate. However, we can estimate the level of confidence we should have in the results. The table below shows the level of confidence we would have for various numbers of respondents.
Number of respondents
Confidence Interval (+/-)
50 12.0% 100 8.5% 200 6.0% 300 4.9% 400 4.2% 500 3.8% 600 3.5%
Example: For a particular question, 300 patients responded, of which 25% answered ‘yes’. From the table above, we can see that for 300 respondents the confidence interval would be +/- 4.9%. We would therefore estimate that the true results could be between 20.1% and

................................................................................................................................................................................................... Accident and Emergency Department Survey 2014 States of Jersey Health & Social Services Copyright 2014 Picker Institute Europe. All rights reserved. Page 9
29.9%. However, if only 50 patients responded, and 25% answered ‘yes’, the confidence intervals would be +/- 12% so the true result could be between 13% and 37%.

................................................................................................................................................................................................... Accident and Emergency Department Survey 2014 States of Jersey Health & Social Services Copyright 2014 Picker Institute Europe. All rights reserved. Page 10
Significant differences In the report we have identified questions where there are significant differences between your Trust and the ‘Picker’ average, or between your Trust this year and the previous survey. By 'significant' difference, we mean that the finding is statistically reliable and that the difference is 'real'. The calculation used to test the statistical significance of scores was the two-sample t-test.
The report This report has been designed to be used alongside our on-line results system: https://www.picker-results.org We aim to help you to identify the key issues for improvement from the patient's perspective. We have presented the results in a number of ways to help you answer important questions about the survey results. Patients had the option of adding additional comments at the end of the questionnaire. These verbatim comments can be found on the results website under Respondent Comments.
How to use this report When deciding which areas to act upon, we suggest you address each section of the questionnaire. A useful approach is to look at a particular section and follow these steps: • Identify any questions where you consider the results to be unacceptable for your trust. The problem score summary is the first step to pick out any questions where the results are significantly better/worse than the ‘Picker’ average. The next step is to go to the frequency tables for that question to get the detailed response from your patients. You may also wish to feed back on the issues where your trust is above average. • Address the issues where you have worsened over time. Are there particular issues that are getting worse over time? Our report highlights significant changes from your previous survey. Our Online results system also presents these changes in graphical form. • Are there issues of higher importance to your patients? Which issues are of high, medium or low importance to your patients? You may find our Discussion paper: the core domains of inpatient experience useful in identifying important issues, and results from the most important questions are set out in your Executive Summary. Please contact the survey team to request a copy of the discussion paper; it can also be found on our website: http://www.pickereurope.org/. • Is there scope to improve on this issue? Look at the benchmarking charts to see the range of scores. This will give you an indication as to what is a realistic ambition. • Identify departments, specialties or sites within the trust that are worse than others and areas of good practice that others can learn from. Go to the Internal benchmark section of the report, or the benchmarking sections of the online results system to see where this is the case. Visit www.pickereurope.org to access our educational resources and for more information on how we can help you to use your survey results to improve services. Our Quality Improvement team can be commissioned to run workshops or deliver presentations and practical sessions that are tailored specifically to your Trust’s needs. To

................................................................................................................................................................................................... Accident and Emergency Department Survey 2014 States of Jersey Health & Social Services Copyright 2014 Picker Institute Europe. All rights reserved. Page 11
contact a member of our Quality Improvement, email [email protected], or telephone 01865 208100.

................................................................................................................................................................................................... Accident and Emergency Department Survey 2014 States of Jersey Health & Social Services Copyright 2014 Picker Institute Europe. All rights reserved. Page 12


................................................................................................................................................................................................... Accident and Emergency Department Survey 2014 States of Jersey Health & Social Services Copyright 2014 Picker Institute Europe. All rights reserved. Page 14
SECTION 2
Survey Response
survey activity


................................................................................................................................................................................................... Accident and Emergency Department Survey 2014 States of Jersey Health & Social Services Copyright 2014 Picker Institute Europe. All rights reserved. Page 16
Survey Response This section of the report shows the activity recorded for the survey, including: • mailing dates • response rates • freephone calls Survey: Accident and Emergency Department
Survey 2014 NHS Trust: States of Jersey Health & Social Services Dates of Fieldwork: Initial Mailing 22 May 2014 First Reminder 06 June 2014 Final Reminder 20 June 2014 Response Rate: Initial Mailing 850 Completed questionnaire - Hardcopy 391 Ineligible - returned undelivered 21 Ineligible - deceased 0 Too ill/Opt out 22 Ineligible - other 2 Total Eligible 827 Returned completed 391 Overall Response Rate 47.3% (total returned as a percentage of total eligible) Average Response Rate 32.0% (based on all Picker Trusts) The Picker Institute runs a Freephone Helpline for patients. The lines are open from 8am-8pm Monday to Friday and Saturdays from 9am to midday. Your Trust received a total of 19 calls to the Freephone helpline, which included 0 LanguageLine calls.


................................................................................................................................................................................................... Accident and Emergency Department Survey 2014 States of Jersey Health & Social Services Copyright 2014 Picker Institute Europe. All rights reserved. Page 18
SECTION 3
Problem Score Summary
overview of results by section


................................................................................................................................................................................................... Accident and Emergency Department Survey 2014 States of Jersey Health & Social Services Copyright 2014 Picker Institute Europe. All rights reserved. Page 20
Problem Score Summary This section shows your problem score* for each question and a comparison against the average score for all Picker Institute Europe trusts. The Picker Institute worked with 73 trusts on this survey. Your results have been compared with the others that we worked with, to identify areas where your results are better or worse than the average. They help you to focus on areas where your performance is poor compared to others and where there is plenty of scope for improvement. Significant differences* between your Trust and the average are indicated as follows:
scores significantly better than average Trust The problem score for your Trust
scores significantly worse than average Average Average score for all 'Picker' trusts * For an explanation of problem scores and significant differences please see Section 1. Note that lower scores indicate better performance. Lower scores are better
ARRIVAL AT THE EMERGENCY DEPARTMENT Trust Average4 Ambulance: waited more than 30 minutes for care to be handed over to A&E staff 3 % 10 %
5+ Arrival: not enough privacy when discussing condition with receptionist 53 % 48 %
WAITING Trust Average6 Waiting: waited more than 15 minutes before speaking to doctor or nurse 44 % 57 %
7+ Waiting: had to wait more than 2 hours to be examined 5 % 12 %
8 Waiting: not told how long would have to wait to be examined 53 % 60 %
9+ Waiting: overall, visit to emergency department more than 4 hours 9 % 36 %
DOCTORS AND NURSES Trust Average10+ Doctors/nurses: not enough time to discuss health or medical problems 20 % 28 %
11+ Doctors/nurses: did not fully explain condition and treatment 24 % 32 %
12 Doctors/nurses: did not fully listen to patient 19 % 23 %
13+ Doctors/nurses: did not fully discuss patient anxieties or fears 40 % 45 %
14 Doctors/nurses: did not have complete confidence and trust 21 % 26 %
15 Doctors/nurses: talked in front of patient as if not there 12 % 16 %
16+ Doctors/nurses: did not have an opportunity to talk to a doctor 38 % 40 %
YOUR CARE AND TREATMENT Trust Average17 Care: not enough information given on condition or treatment 17 % 22 %
18 Care: not enough privacy when being examined or treated 21 % 19 %
19+ Care: not always able to get help from staff when needed 27 % 40 %
20 Care: staff contradict each other 12 % 17 %
21+ Care: wanted to be more involved in decisions 34 % 37 %
22+ Care: not reassured by staff if distressed 37 % 47 %
................................................................................................................................................................................................... Accident and Emergency Department Survey 2014 States of Jersey Health & Social Services Copyright 2014 Picker Institute Europe. All rights reserved. Page 21
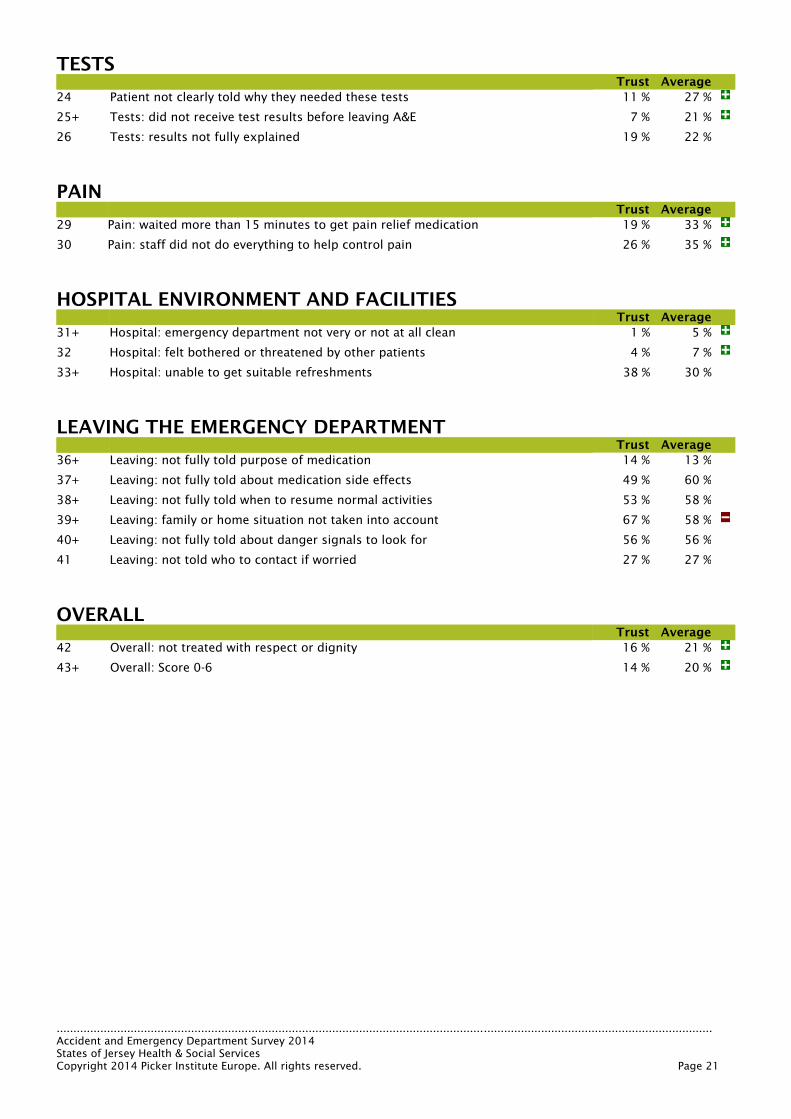
TESTS Trust Average24 Patient not clearly told why they needed these tests 11 % 27 %
25+ Tests: did not receive test results before leaving A&E 7 % 21 %
26 Tests: results not fully explained 19 % 22 %
PAIN Trust Average29 Pain: waited more than 15 minutes to get pain relief medication 19 % 33 %
30 Pain: staff did not do everything to help control pain 26 % 35 %
HOSPITAL ENVIRONMENT AND FACILITIES Trust Average31+ Hospital: emergency department not very or not at all clean 1 % 5 %
32 Hospital: felt bothered or threatened by other patients 4 % 7 %
33+ Hospital: unable to get suitable refreshments 38 % 30 %
LEAVING THE EMERGENCY DEPARTMENT Trust Average36+ Leaving: not fully told purpose of medication 14 % 13 %
37+ Leaving: not fully told about medication side effects 49 % 60 %
38+ Leaving: not fully told when to resume normal activities 53 % 58 %
39+ Leaving: family or home situation not taken into account 67 % 58 %
40+ Leaving: not fully told about danger signals to look for 56 % 56 %
41 Leaving: not told who to contact if worried 27 % 27 %
OVERALL Trust Average42 Overall: not treated with respect or dignity 16 % 21 %
43+ Overall: Score 0-6 14 % 20 %
................................................................................................................................................................................................... Accident and Emergency Department Survey 2014 States of Jersey Health & Social Services Copyright 2014 Picker Institute Europe. All rights reserved. Page 22
SECTION 4
Ranked Problem Scores
where most patients report room for improvement


................................................................................................................................................................................................... Accident and Emergency Department Survey 2014 States of Jersey Health & Social Services Copyright 2014 Picker Institute Europe. All rights reserved. Page 24
Ranked Problem Scores This section ranks the scores from the highest problem score (most respondents reporting room for improvement) to lowest problem score (fewest respondents reporting room for improvement). Focusing on areas with high problem scores could potentially improve the patient experience for a large proportion of your patients. Significant differences between your Trust and the average are indicated as follows:
scores significantly better than average Trust The problem score for your Trust
scores significantly worse than average Average Average score for all Picker trusts Lower scores are better
Problem scores 50%+ Trust Average39+ Leaving: family or home situation not taken into account 67 % 58 %
40+ Leaving: not fully told about danger signals to look for 56 % 56 %
38+ Leaving: not fully told when to resume normal activities 53 % 58 %
8 Waiting: not told how long would have to wait to be examined 53 % 60 %
5+ Arrival: not enough privacy when discussing condition with receptionist 53 % 48 %
Problem scores 40% - 49% Trust Average37+ Leaving: not fully told about medication side effects 49 % 60 %
6 Waiting: waited more than 15 minutes before speaking to doctor or nurse 44 % 57 %
13+ Doctors/nurses: did not fully discuss patient anxieties or fears 40 % 45 %
Problem scores 30% - 39% Trust Average33+ Hospital: unable to get suitable refreshments 38 % 30 %
16+ Doctors/nurses: did not have an opportunity to talk to a doctor 38 % 40 %
22+ Care: not reassured by staff if distressed 37 % 47 %
21+ Care: wanted to be more involved in decisions 34 % 37 %
Problem scores 20% - 29% Trust Average19+ Care: not always able to get help from staff when needed 27 % 40 %
41 Leaving: not told who to contact if worried 27 % 27 %
30 Pain: staff did not do everything to help control pain 26 % 35 %
11+ Doctors/nurses: did not fully explain condition and treatment 24 % 32 %
14 Doctors/nurses: did not have complete confidence and trust 21 % 26 %
18 Care: not enough privacy when being examined or treated 21 % 19 %
10+ Doctors/nurses: not enough time to discuss health or medical problems 20 % 28 %

................................................................................................................................................................................................... Accident and Emergency Department Survey 2014 States of Jersey Health & Social Services Copyright 2014 Picker Institute Europe. All rights reserved. Page 25
Problem scores 10% - 19% Trust Average12 Doctors/nurses: did not fully listen to patient 19 % 23 %
26 Tests: results not fully explained 19 % 22 %
29 Pain: waited more than 15 minutes to get pain relief medication 19 % 33 %
17 Care: not enough information given on condition or treatment 17 % 22 %
42 Overall: not treated with respect or dignity 16 % 21 %
43+ Overall: Score 0-6 14 % 20 %
36+ Leaving: not fully told purpose of medication 14 % 13 %
20 Care: staff contradict each other 12 % 17 %
15 Doctors/nurses: talked in front of patient as if not there 12 % 16 %
24 Patient not clearly told why they needed these tests 11 % 27 %
Problem scores 0% - 9% Trust Average9+ Waiting: overall, visit to emergency department more than 4 hours 9 % 36 %
25+ Tests: did not receive test results before leaving A&E 7 % 21 %
7+ Waiting: had to wait more than 2 hours to be examined 5 % 12 %
32 Hospital: felt bothered or threatened by other patients 4 % 7 %
4 Ambulance: waited more than 30 minutes for care to be handed over to A&E staff 3 % 10 %
31+ Hospital: emergency department not very or not at all clean 1 % 5 %
................................................................................................................................................................................................... Accident and Emergency Department Survey 2014 States of Jersey Health & Social Services Copyright 2014 Picker Institute Europe. All rights reserved. Page 26
SECTION 5
Historical Comparisons
comparing results with previous years


................................................................................................................................................................................................... Accident and Emergency Department Survey 2014 States of Jersey Health & Social Services Copyright 2014 Picker Institute Europe. All rights reserved. Page 28
Historical Comparisons The National Accident and Emergency Department survey was last conducted in 2012 – by looking at changes in results over time it is possible to focus on those areas where performance might be slipping. Examining areas where performance has improved will help you to measure the effects of any service improvements that have been put in place. This section shows the problem scores for this year’s survey and a comparison against the average scores from the previous National survey in 2012. Significant differences are indicated as follows:
scores significantly better than previous survey 2012 The problem score for 2012
scores significantly worse than previous survey 2013 The problem score for 2013 2014 The problem score for 2014 Lower scores are better
ARRIVAL AT THE EMERGENCY DEPARTMENT 2012 2013 2014 4 Ambulance: waited more than 30 minutes for care to be handed over to
A&E staff 10 % - 3 %
5+ Arrival: not enough privacy when discussing condition with receptionist 52 % - 53 %
WAITING 2012 2013 2014 6 Waiting: waited more than 15 minutes before speaking to doctor or nurse 59 % - 44 % 7+ Waiting: had to wait more than 2 hours to be examined 13 % - 5 % 8 Waiting: not told how long would have to wait to be examined 61 % - 53 % 9+ Waiting: overall, visit to emergency department more than 4 hours 33 % - 9 %
DOCTORS AND NURSES 2012 2013 2014 10+ Doctors/nurses: not enough time to discuss health or medical problems 30 % - 20 % 11+ Doctors/nurses: did not fully explain condition and treatment 34 % - 24 % 12 Doctors/nurses: did not fully listen to patient 25 % - 19 % 13+ Doctors/nurses: did not fully discuss patient anxieties or fears 48 % - 40 % 14 Doctors/nurses: did not have complete confidence and trust 27 % - 21 % 15 Doctors/nurses: talked in front of patient as if not there - - 12 % 16+ Doctors/nurses: did not have an opportunity to talk to a doctor 40 % - 38 %
YOUR CARE AND TREATMENT 2012 2013 2014 17 Care: not enough information given on condition or treatment 22 % - 17 % 18 Care: not enough privacy when being examined or treated 19 % - 21 % 19+ Care: not always able to get help from staff when needed 41 % - 27 % 20 Care: staff contradict each other 17 % - 12 % 21+ Care: wanted to be more involved in decisions 38 % - 34 % 22+ Care: not reassured by staff if distressed - - 37 %
TESTS 2012 2013 2014 24 Patient not clearly told why they needed these tests 27 % - 11 % 25+ Tests: did not receive test results before leaving A&E 21 % - 7 % 26 Tests: results not fully explained 23 % - 19 %

................................................................................................................................................................................................... Accident and Emergency Department Survey 2014 States of Jersey Health & Social Services Copyright 2014 Picker Institute Europe. All rights reserved. Page 29
PAIN 2012 2013 2014 29 Pain: waited more than 15 minutes to get pain relief medication - - 19 % 30 Pain: staff did not do everything to help control pain 42 % - 26 %
HOSPITAL ENVIRONMENT AND FACILITIES 2012 2013 2014 31+ Hospital: emergency department not very or not at all clean 5 % - 1 % 32 Hospital: felt bothered or threatened by other patients 7 % - 4 % 33+ Hospital: unable to get suitable refreshments 32 % - 38 %
LEAVING THE EMERGENCY DEPARTMENT 2012 2013 2014 36+ Leaving: not fully told purpose of medication 16 % - 14 % 37+ Leaving: not fully told about medication side effects 61 % - 49 % 38+ Leaving: not fully told when to resume normal activities 61 % - 53 % 39+ Leaving: family or home situation not taken into account 60 % - 67 % 40+ Leaving: not fully told about danger signals to look for 60 % - 56 % 41 Leaving: not told who to contact if worried 28 % - 27 %
OVERALL 2012 2013 2014 42 Overall: not treated with respect or dignity 22 % - 16 % 43+ Overall: Score 0-6 23 % - 14 %

................................................................................................................................................................................................... Accident and Emergency Department Survey 2014 States of Jersey Health & Social Services Copyright 2014 Picker Institute Europe. All rights reserved. Page 30
SECTION 6
External Benchmarks
comparing results with other trusts


................................................................................................................................................................................................... Accident and Emergency Department Survey 2014 States of Jersey Health & Social Services Copyright 2014 Picker Institute Europe. All rights reserved. Page 32
External Benchmarks This section shows how your Trust compared to all trusts who commissioned Picker Institute Europe for this survey (73 trusts). The range of scores are shown as a blue bar from the best score (to the left), to the worst (to the right). The average is the black line. Your Trust is shown as the yellow triangle.
ARRIVAL AT THE EMERGENCY DEPARTMENT
Ambulance: waited more than 30 minutes for care to be handed over to A&E staff
Arrival: not enough privacy when discussing condition with receptionist
UK Picker Average
States of Jersey Health & Social Services

................................................................................................................................................................................................... Accident and Emergency Department Survey 2014 States of Jersey Health & Social Services Copyright 2014 Picker Institute Europe. All rights reserved. Page 33
WAITING
Waiting: waited more than 15 minutes before speaking to doctor or nurse
Waiting: had to wait more than 2 hours to be examined
Waiting: not told how long would have to wait to be examined
Waiting: overall, visit to emergency department more than 4 hours
UK Picker Average
States of Jersey Health & Social Services

................................................................................................................................................................................................... Accident and Emergency Department Survey 2014 States of Jersey Health & Social Services Copyright 2014 Picker Institute Europe. All rights reserved. Page 34
DOCTORS AND NURSES
Doctors/nurses: not enough time to discuss health or medical problems
Doctors/nurses: did not fully explain condition and treatment
Doctors/nurses: did not fully listen to patient
Doctors/nurses: did not fully discuss patient anxieties or fears
Doctors/nurses: did not have complete confidence and trust
Doctors/nurses: talked in front of patient as if not there
Doctors/nurses: did not have an opportunity to talk to a doctor
UK Picker Average
States of Jersey Health & Social Services

................................................................................................................................................................................................... Accident and Emergency Department Survey 2014 States of Jersey Health & Social Services Copyright 2014 Picker Institute Europe. All rights reserved. Page 35
YOUR CARE AND TREATMENT
Care: not enough information given on condition or treatment
Care: not enough privacy when being examined or treated
Care: not always able to get help from staff when needed
Care: staff contradict each other
Care: wanted to be more involved in decisions
Care: not reassured by staff if distressed
UK Picker Average
States of Jersey Health & Social Services

................................................................................................................................................................................................... Accident and Emergency Department Survey 2014 States of Jersey Health & Social Services Copyright 2014 Picker Institute Europe. All rights reserved. Page 36
TESTS
Patient not clearly told why they needed these tests
Tests: did not receive test results before leaving A&E
Tests: results not fully explained
UK Picker Average
States of Jersey Health & Social Services

................................................................................................................................................................................................... Accident and Emergency Department Survey 2014 States of Jersey Health & Social Services Copyright 2014 Picker Institute Europe. All rights reserved. Page 37
PAIN
Pain: waited more than 15 minutes to get pain relief medication
Pain: staff did not do everything to help control pain
UK Picker Average
States of Jersey Health & Social Services

................................................................................................................................................................................................... Accident and Emergency Department Survey 2014 States of Jersey Health & Social Services Copyright 2014 Picker Institute Europe. All rights reserved. Page 38
HOSPITAL ENVIRONMENT AND FACILITIES
Hospital: emergency department not very or not at all clean
Hospital: felt bothered or threatened by other patients
Hospital: unable to get suitable refreshments
UK Picker Average
States of Jersey Health & Social Services

................................................................................................................................................................................................... Accident and Emergency Department Survey 2014 States of Jersey Health & Social Services Copyright 2014 Picker Institute Europe. All rights reserved. Page 39
LEAVING THE EMERGENCY DEPARTMENT
Leaving: not fully told purpose of medication
Leaving: not fully told about medication side effects
Leaving: not fully told when to resume normal activities
Leaving: family or home situation not taken into account
Leaving: not fully told about danger signals to look for
Leaving: not told who to contact if worried
UK Picker Average
States of Jersey Health & Social Services

................................................................................................................................................................................................... Accident and Emergency Department Survey 2014 States of Jersey Health & Social Services Copyright 2014 Picker Institute Europe. All rights reserved. Page 40
OVERALL
Overall: not treated with respect or dignity
Overall: Score 0-6
UK Picker Average
States of Jersey Health & Social Services


................................................................................................................................................................................................... Accident and Emergency Department Survey 2014 States of Jersey Health & Social Services Copyright 2014 Picker Institute Europe. All rights reserved. Page 42
SECTION 7
Internal Benchmarks
comparing results within the trust


................................................................................................................................................................................................... Accident and Emergency Department Survey 2014 States of Jersey Health & Social Services Copyright 2014 Picker Institute Europe. All rights reserved. Page 44
Internal Benchmarks This type of information can help to focus quality improvement initiatives. Tel: 01865 208100 Fax: 01865 208101 Email: [email protected]


................................................................................................................................................................................................... Accident and Emergency Department Survey 2014 States of Jersey Health & Social Services Copyright 2014 Picker Institute Europe. All rights reserved. Page 46
Appendix 1
Frequency Tables
a detailed breakdown of your results


................................................................................................................................................................................................... Accident and Emergency Department Survey 2014 States of Jersey Health & Social Services Copyright 2014 Picker Institute Europe. All rights reserved. Page 48
Frequency Tables This section shows a breakdown of responses for each question. It also shows which groups of patients responded to each question and how the problem score was calculated. The response categories that have been combined to calculate the problem score are indicated with an asterisk.
ARRIVAL AT THE EMERGENCY DEPARTMENT 1 - Before your most recent visit to A&E, had you previously been to
this A&E about the same condition or something related to it? This Trust All trusts All Patients n % n %
Yes, within the previous week 13 3.4 982 4.9
Yes, between one week and one month earlier 20 5.2 1639 8.2
Yes, more than a month earlier 46 11.9 3651 18.4
No 299 77.3 12879 64.8
Don't know / can't remember 9 2.3 736 3.7
387 19887
2 - Who advised you to go to the A&E Department? This Trust All trusts All Patients n % n %
The ambulance service 42 10.8 4989 28.4
A GP out of hours service 6 1.5 684 3.9
A GP from my local surgery 20 5.1 2786 15.9
Some other health professional (e.g. pharmacist) 22 5.7 790 4.5
Somebody else (e.g. friend, relative, colleague) 104 26.7 2767 15.8
No-one, I decided that I needed to go 193 49.6 5378 30.6
Don’t know / can’t remember 2 0.5 165 0.9
389 17559
3 - Were you taken to the hospital in an ambulance? This Trust All trusts All Patients n % n %
Yes 58 14.9 8083 40.5
No 331 85.1 11887 59.5
389 19970

................................................................................................................................................................................................... Accident and Emergency Department Survey 2014 States of Jersey Health & Social Services Copyright 2014 Picker Institute Europe. All rights reserved. Page 49
4 - Once you arrived at hospital, how long did you wait with the ambulance crew before your care was handed over to the A&E staff?
This Trust All trusts Patients who were taken to hospital by ambulance n % n %
I did not have to wait 42 72.4 3497 44.0
Up to 15 minutes 8 13.8 2040 25.7
16 – 30 minutes 3 5.2 1135 14.3
* 31 – 60 minutes 2 3.4 415 5.2
* More than 1 hour but no more than 2 hours 0 0.0 203 2.6
* More than 2 hours 0 0.0 163 2.1
Don't know / can't remember 3 5.2 490 6.2
Problem score - This Trust 3.4% 58 7943 Problem score - All trusts 9.8%
5 - Were you given enough privacy when discussing your condition
with the receptionist? This Trust All trusts All Patients n % n %
Yes, definitely 164 42.2 8205 41.2
Yes, to some extent 132 33.9 5696 28.6
No 49 12.6 1748 8.8
I did not discuss my condition with a receptionist 44 11.3 4282 21.5
389 19931
5+ - Were you given enough privacy when discussing your condition
with the receptionist? This Trust All trusts Patients who discussed condition with receptionist n % n %
Yes, definitely 164 47.5 8205 52.4
*Yes, to some extent 132 38.3 5696 36.4
*No 49 14.2 1748 11.2
Problem score - This Trust 52.5% 345 15649Problem score - All trusts 47.6%

................................................................................................................................................................................................... Accident and Emergency Department Survey 2014 States of Jersey Health & Social Services Copyright 2014 Picker Institute Europe. All rights reserved. Page 50
WAITING 6 - How long did you wait before you first spoke to a nurse or doctor? This Trust All trusts All Patients n % n %
0-15 minutes 211 54.5 7605 37.7
*16-30 minutes 98 25.3 5588 27.7
*31-60 minutes 51 13.2 3372 16.7
*More than 60 minutes 20 5.2 2539 12.6
Don't know / can't remember 7 1.8 1073 5.3
Problem score - This Trust 43.7% 387 20177Problem score - All trusts 57.0%
7 - From the time you first arrived at the A&E Department, how long
did you wait before being examined by a doctor or nurse? This Trust All trusts All Patients n % n %
I did not have to wait 53 13.7 2549 12.8
1-30 minutes 180 46.5 6962 34.9
31-60 minutes 83 21.4 4250 21.3
More than 1 hour but no more than 2 hours 46 11.9 2856 14.3
More than 2 hours but no more than 4 hours 16 4.1 1928 9.7
More than 4 hours 2 0.5 511 2.6
Can't remember 7 1.8 801 4.0
I did not see a doctor or a nurse 0 0.0 87 0.4
387 19944
7+ - From the time you first arrived at the A&E Department, how long
did you wait before being examined by a doctor or nurse? This Trust All trusts Patients who saw a doctor or nurse n % n %
I did not have to wait 53 13.7 2549 12.8
1-30 minutes 180 46.5 6962 35.1
31-60 minutes 83 21.4 4250 21.4
More than 1 hour but no more than 2 hours 46 11.9 2856 14.4
*More than 2 hours but no more than 4 hours 16 4.1 1928 9.7
*More than 4 hours 2 0.5 511 2.6
Can't remember 7 1.8 801 4.0
Problem score - This Trust 4.7% 387 19857Problem score - All trusts 12.3%

................................................................................................................................................................................................... Accident and Emergency Department Survey 2014 States of Jersey Health & Social Services Copyright 2014 Picker Institute Europe. All rights reserved. Page 51
8 - Were you told how long you would have to wait to be examined? This Trust All trusts Patients who waited to see doctor or nurse n % n %
Yes, but the wait was shorter 54 16.3 2139 12.7
Yes, and I had to wait about as long as I was told 58 17.5 2570 15.2
*Yes, but the wait was longer 19 5.7 1390 8.2
*No, I was not told 156 47.0 8700 51.5
Don't know / can't remember 45 13.6 2105 12.5
Problem score - This Trust 52.7% 332 16904Problem score - All trusts 59.7%
9 - Overall, how long did your visit to the A&E Department last? This Trust All trusts All Patients n % n %
Up to 1 hour 124 32.0 2241 11.2
More than 1 hour but no more than 2 hours 117 30.2 3737 18.7
More than 2 hours but no more than 4 hours 104 26.8 6315 31.6
More than 4 hours but no more than 6 hours 23 5.9 3577 17.9
More than 6 hours but no more than 8 hours 5 1.3 1396 7.0
More than 8 hours but no more than 12 hours 3 0.8 676 3.4
More than 12 hours but no more than 24 hours 0 0.0 493 2.5
More than 24 hours 4 1.0 636 3.2
Can't remember 8 2.1 939 4.7
388 20010
9+ - Overall, how long did your visit to the A&E Department last? This Trust All trusts All Patients n % n %
Up to 1 hour 124 32.6 2241 11.8
More than 1 hour but no more than 2 hours 117 30.8 3737 19.6
More than 2 hours but no more than 4 hours 104 27.4 6315 33.1
*More than 4 hours but no more than 6 hours 23 6.1 3577 18.8
*More than 6 hours but no more than 8 hours 5 1.3 1396 7.3
*More than 8 hours but no more than 12 hours 3 0.8 676 3.5
*More than 12 hours but no more than 24 hours 0 0.0 493 2.6
*More than 24 hours 4 1.1 636 3.3
Problem score - This Trust 9.2% 380 19071Problem score - All trusts 35.5%

................................................................................................................................................................................................... Accident and Emergency Department Survey 2014 States of Jersey Health & Social Services Copyright 2014 Picker Institute Europe. All rights reserved. Page 52
DOCTORS AND NURSES 10 - Did you have enough time to discuss your health or medical
problem with the doctor or nurse? This Trust All trusts All Patients n % n %
Yes, definitely 312 80.0 14287 71.2
Yes, to some extent 65 16.7 4688 23.4
No 11 2.8 940 4.7
I did not see a doctor or nurse 2 0.5 151 0.8
390 20066
10+ - Did you have enough time to discuss your health or medical
problem with the doctor or nurse? This Trust All trusts Patients who saw a doctor or nurse n % n %
Yes, definitely 312 80.4 14287 71.7
*Yes, to some extent 65 16.8 4688 23.5
*No 11 2.8 940 4.7
Problem score - This Trust 19.6% 388 19915Problem score - All trusts 28.3%
11 - While you were in the A&E Department, did a doctor or nurse
explain your condition and treatment in a way you could understand? This Trust All trusts Patients who saw a doctor or nurse n % n %
Yes, completely 284 73.6 12729 64.5
Yes, to some extent 70 18.1 4711 23.9
No 17 4.4 1361 6.9
I did not need an explanation 15 3.9 929 4.7
386 19730
11+ - While you were in the A&E Department, did a doctor or nurse
explain your condition and treatment in a way you could understand? This Trust All trusts Patients needing an explanation who saw a doctor or nurse n % n %
Yes, completely 284 76.5 12729 67.7
*Yes, to some extent 70 18.9 4711 25.1
*No 17 4.6 1361 7.2
Problem score - This Trust 23.5% 371 18801Problem score - All trusts 32.3%

................................................................................................................................................................................................... Accident and Emergency Department Survey 2014 States of Jersey Health & Social Services Copyright 2014 Picker Institute Europe. All rights reserved. Page 53
12 - Did the doctors and nurses listen to what you had to say? This Trust All trusts Patients who saw a doctor or nurse n % n %
Yes, definitely 312 80.8 15200 77.3
*Yes, to some extent 63 16.3 3859 19.6
*No 11 2.8 605 3.1
Problem score - This Trust 19.2% 386 19664Problem score - All trusts 22.7%
13 - If you had any anxieties or fears about your condition or
treatment, did a doctor or nurse discuss them with you? This Trust All trusts Patients who saw a doctor or nurse n % n %
Yes, completely 140 36.4 7775 39.5
Yes, to some extent 55 14.3 4155 21.1
No 40 10.4 2118 10.8
I did not have any anxieties or fears 150 39.0 5649 28.7
385 19697
13+ - If you had any anxieties or fears about your condition or
treatment, did a doctor or nurse discuss them with you? This Trust All trusts Patients with anxieties or fears who saw a doctor or nurse n % n %
Yes, completely 140 59.6 7775 55.3
*Yes, to some extent 55 23.4 4155 29.6
*No 40 17.0 2118 15.1
Problem score - This Trust 40.4% 235 14048Problem score - All trusts 44.7%
14 - Did you have confidence and trust in the doctors and nurses
examining and treating you? This Trust All trusts Patients who saw a doctor or nurse n % n %
Yes, definitely 304 78.8 14646 74.4
*Yes, to some extent 62 16.1 4058 20.6
*No 20 5.2 978 5.0
Problem score - This Trust 21.2% 386 19682Problem score - All trusts 25.6%
15 - Did doctors or nurses talk to each other about you as if you
weren't there? This Trust All trusts Patients who saw a doctor or nurse n % n %
*Yes, definitely 14 3.6 1048 5.3
*Yes, to some extent 30 7.8 2129 10.9
No 340 88.5 16421 83.8
Problem score - This Trust 11.5% 384 19598Problem score - All trusts 16.2%

................................................................................................................................................................................................... Accident and Emergency Department Survey 2014 States of Jersey Health & Social Services Copyright 2014 Picker Institute Europe. All rights reserved. Page 54
16 - If your family or someone else close to you wanted to talk to a doctor, did they have enough opportunity to do so?
This Trust All trusts Patients who saw a doctor or nurse n % n %
Yes, definitely 110 28.6 7438 38.2
Yes, to some extent 48 12.5 3463 17.8
No 19 4.9 1434 7.4
No family or friends were involved 149 38.8 4827 24.8
My family or friends did not want or need information 44 11.5 1790 9.2
I did not want my family or friends to talk to a doctor 14 3.6 538 2.8
384 19490
16+ - If your family or someone else close to you wanted to talk to a
doctor, did they have enough opportunity to do so? This Trust All trusts Patients who wanted to talk to a doctor and saw a doctor or nurse n % n %
Yes, definitely 110 62.1 7438 60.3
*Yes, to some extent 48 27.1 3463 28.1
*No 19 10.7 1434 11.6
Problem score - This Trust 37.9% 177 12335Problem score - All trusts 39.7%

................................................................................................................................................................................................... Accident and Emergency Department Survey 2014 States of Jersey Health & Social Services Copyright 2014 Picker Institute Europe. All rights reserved. Page 55
YOUR CARE AND TREATMENT 17 - While you were in the A&E Department, how much information
about your condition or treatment was given to you? This Trust All trusts All Patients n % n %
*Not Enough 44 11.4 2990 14.9
Right amount 320 82.7 15581 77.8
Too much 1 0.3 97 0.5
*I was not given any information about my condition or treatment 22 5.7 1364 6.8
Problem score - This Trust 17.1% 387 20032Problem score - All trusts 21.7%
18 - Were you given enough privacy when being examined or treated? This Trust All trusts All Patients n % n %
Yes, definitely 307 78.9 16351 81.3
*Yes, to some extent 78 20.1 3241 16.1
*No 4 1.0 518 2.6
Problem score - This Trust 21.1% 389 20110Problem score - All trusts 18.7%
19 - If you needed attention, were you able to get a member of
medical or nursing staff to help you? This Trust All trusts All Patients n % n %
Yes, always 165 42.6 8244 41.3
Yes, sometimes 56 14.5 4601 23.0
No, I could not find a member of staff to help me 10 2.6 1050 5.3
A member of staff was with me all the time 12 3.1 362 1.8
I did not need attention 144 37.2 5705 28.6
387 19962
19+ - If you needed attention, were you able to get a member of
medical or nursing staff to help you? This Trust All trusts Patients who needed help from staff n % n %
Yes, always 165 67.9 8244 57.8
*Yes, sometimes 56 23.0 4601 32.3
*No, I could not find a member of staff to help me 10 4.1 1050 7.4
A member of staff was with me all the time 12 4.9 362 2.5
Problem score - This Trust 27.2% 243 14257Problem score - All trusts 39.6%

................................................................................................................................................................................................... Accident and Emergency Department Survey 2014 States of Jersey Health & Social Services Copyright 2014 Picker Institute Europe. All rights reserved. Page 56
20 - Sometimes in a hospital, a member of staff will say one thing and another will say something quite different. Did this happen to you in the A&E Department?
This Trust All trusts All Patients n % n %
*Yes, definitely 18 4.6 1327 6.6
*Yes, to some extent 27 6.9 2103 10.5
No 344 88.4 16605 82.9
Problem score - This Trust 11.6% 389 20035Problem score - All trusts 17.1%
21 - Were you involved as much as you wanted to be in decisions
about your care and treatment? This Trust All trusts All Patients n % n %
Yes, definitely 252 64.9 11663 58.5
Yes, to some extent 101 26.0 5164 25.9
No 28 7.2 1814 9.1
I was not well enough to be involved in decisions about my care 7 1.8 1302 6.5
388 19943
21+ - Were you involved as much as you wanted to be in decisions
about your care and treatment? This Trust All trusts Patients well enough to be involved n % n %
Yes, definitely 252 66.1 11663 62.6
*Yes, to some extent 101 26.5 5164 27.7
*No 28 7.3 1814 9.7
Problem score - This Trust 33.9% 381 18641Problem score - All trusts 37.4%
22 - If you were feeling distressed while you were in the A&E
Department, did a member of staff help to reassure you? This Trust All trusts All Patients n % n %
Yes, definitely 81 20.9 4315 21.5
Yes, to some extent 25 6.4 2491 12.4
No 26 6.7 1972 9.8
I was not distressed 249 64.2 10488 52.3
Not sure / can’t remember 7 1.8 803 4.0
388 20069

................................................................................................................................................................................................... Accident and Emergency Department Survey 2014 States of Jersey Health & Social Services Copyright 2014 Picker Institute Europe. All rights reserved. Page 57
22+ - If you were feeling distressed while you were in the A&E Department, did a member of staff help to reassure you?
This Trust All trusts Patients distressed while at A&E n % n %
Yes, definitely 81 58.3 4315 45.0
*Yes, to some extent 25 18.0 2491 26.0
*No 26 18.7 1972 20.6
Not sure / can’t remember 7 5.0 803 8.4
Problem score - This Trust 36.7% 139 9581Problem score - All trusts 46.6%

................................................................................................................................................................................................... Accident and Emergency Department Survey 2014 States of Jersey Health & Social Services Copyright 2014 Picker Institute Europe. All rights reserved. Page 58
TESTS 23 - Did you have any tests (such as x-rays, scans or blood tests) when
you visited the A&E Department? This Trust All trusts All Patients n % n %
Yes 207 53.6 14701 73.6
No 179 46.4 5280 26.4
386 19981
24 - Did a member of staff explain why you needed these test(s) in a
way you could understand? This Trust All trusts Patients who had tests n % n %
Yes, completely 180 88.7 10570 73.1
*Yes, to some extent 14 6.9 2712 18.8
*No 9 4.4 1181 8.2
Problem score - This Trust 11.3% 203 14463Problem score - All trusts 26.9%
25 - Before you left the A&E Department, did you get the results of
your tests? This Trust All trusts Patients who had tests n % n %
Yes 173 87.8 9754 68.4
No 14 7.1 2727 19.1
I was told that the results of the tests would be given to me at a later date 6 3.0 986 6.9
Don't know / can't remember 4 2.0 783 5.5
197 14250
25+ - Before you left the A&E Department, did you get the results of
your tests? This Trust All trusts Patients who were not told they would receive their test results at a later date n % n %
Yes 173 90.6 9754 73.5
*No 14 7.3 2727 20.6
Don't know / can't remember 4 2.1 783 5.9
Problem score - This Trust 7.3% 191 13264Problem score - All trusts 20.6%
................................................................................................................................................................................................... Accident and Emergency Department Survey 2014 States of Jersey Health & Social Services Copyright 2014 Picker Institute Europe. All rights reserved. Page 59
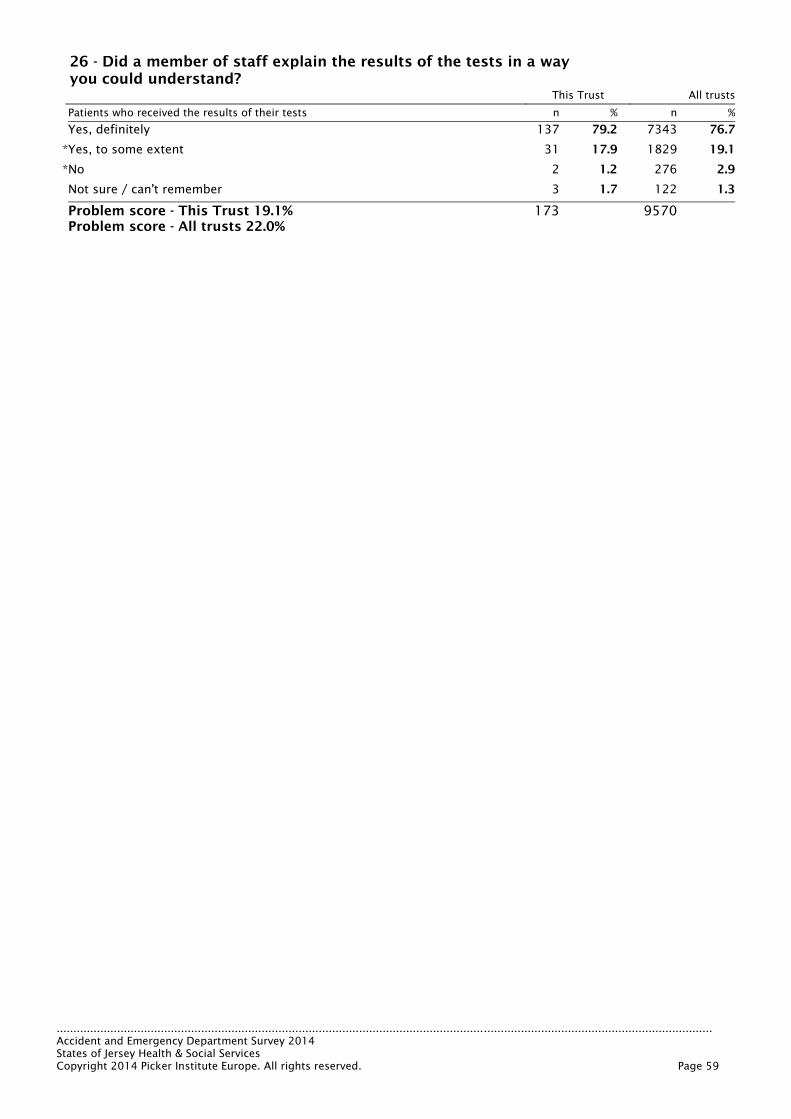
26 - Did a member of staff explain the results of the tests in a way you could understand?
This Trust All trusts Patients who received the results of their tests n % n %
Yes, definitely 137 79.2 7343 76.7
*Yes, to some extent 31 17.9 1829 19.1
*No 2 1.2 276 2.9
Not sure / can't remember 3 1.7 122 1.3
Problem score - This Trust 19.1% 173 9570Problem score - All trusts 22.0%

................................................................................................................................................................................................... Accident and Emergency Department Survey 2014 States of Jersey Health & Social Services Copyright 2014 Picker Institute Europe. All rights reserved. Page 60
PAIN 27 - Were you in any pain while you were in the A&E Department? This Trust All trusts All Patients n % n %
Yes 267 69.4 12129 60.8
No 118 30.6 7835 39.2
385 19964
28 - Did you request pain relief medication? This Trust All trusts Patients who experienced pain n % n %
Yes 67 26.0 3770 32.4
No 91 35.3 4785 41.1
I was offered or given pain relief medication without asking 100 38.8 3074 26.4
258 11629
29 - How many minutes after you requested pain relief medication did
it take before you got it? This Trust All trusts Patients who requested pain relief medication n % n %
0 minutes / right away 19 29.2 562 15.5
1 - 5 minutes 19 29.2 813 22.4
6 - 10 minutes 8 12.3 622 17.1
11 - 15 minutes 7 10.8 453 12.5
* 16 - 30 minutes 4 6.2 434 11.9
* More than 30 minutes 2 3.1 463 12.7
* I asked for pain relief medication but wasn't given any 6 9.2 289 7.9
Problem score - This Trust 18.5% 65 3636 Problem score - All trusts 32.6%
30 - Do you think the hospital staff did everything they could to help
control your pain? This Trust All trusts Patients who experienced pain n % n %
Yes, definitely 182 69.5 6722 57.4
*Yes, to some extent 46 17.6 2590 22.1
*No 21 8.0 1453 12.4
Can't say / don't know 13 5.0 941 8.0
Problem score - This Trust 25.6% 262 11706Problem score - All trusts 34.5%

................................................................................................................................................................................................... Accident and Emergency Department Survey 2014 States of Jersey Health & Social Services Copyright 2014 Picker Institute Europe. All rights reserved. Page 61
HOSPITAL ENVIRONMENT AND FACILITIES 31 - In your opinion, how clean was the A&E Department? This Trust All trusts All Patients n % n %
Very clean 293 75.3 11515 56.9
Fairly clean 86 22.1 7069 34.9
Not very clean 4 1.0 726 3.6
Not at all clean 0 0.0 161 0.8
Can't say 6 1.5 763 3.8
389 20234
31+ - In your opinion, how clean was the A&E Department This Trust All trusts Patients who were able to comment on cleanliness n % n %
Very clean 293 76.5 11515 59.1
Fairly clean 86 22.5 7069 36.3
*Not very clean 4 1.0 726 3.7
*Not at all clean 0 0.0 161 0.8
Problem score - This Trust 1.0% 383 19471Problem score - All trusts 4.6%
32 - While you were in the A&E Department, did you feel threatened by
other patients or visitors? This Trust All trusts All Patients n % n %
*Yes, definitely 5 1.3 366 1.8
*Yes, to some extent 12 3.1 1010 5.0
No 373 95.6 18822 93.2
Problem score - This Trust 4.4% 390 20198Problem score - All trusts 6.8%
33 - Were you able to get suitable food or drinks when you were in the
A&E Department? This Trust All trusts All Patients n % n %
Yes 76 19.8 6560 32.9
No 47 12.3 2851 14.3
I was told not to eat or drink 11 2.9 1058 5.3
I did not know if I was allowed to eat or drink 25 6.5 1185 5.9
I did not want anything to eat or drink 224 58.5 8301 41.6
383 19955

................................................................................................................................................................................................... Accident and Emergency Department Survey 2014 States of Jersey Health & Social Services Copyright 2014 Picker Institute Europe. All rights reserved. Page 62
33+ - Were you able to get suitable food or drinks when you were in the A&E Department?
This Trust All trusts Patients who wanted refreshments n % n %
Yes 76 61.8 6560 69.7
*No 47 38.2 2851 30.3
Problem score - This Trust 38.2% 123 9411Problem score - All trusts 30.3%

................................................................................................................................................................................................... Accident and Emergency Department Survey 2014 States of Jersey Health & Social Services Copyright 2014 Picker Institute Europe. All rights reserved. Page 63
LEAVING THE EMERGENCY DEPARTMENT 34 - What happened at the end of your visit to the A&E Department? This Trust All trusts All Patients n % n %
I was admitted to the same hospital 34 8.7 6077 30.4
I was transferred to a different hospital or to a nursing home 2 0.5 537 2.7
I went home 331 84.9 12714 63.6
I went to stay with a friend or relative 13 3.3 444 2.2
I went to stay somewhere else 10 2.6 214 1.1
390 19986
35 - Before you left the A&E Department, were any new medications
prescribed for you? This Trust All trusts Patients discharged from care n % n %
Yes 107 30.4 4345 33.3
No 245 69.6 8708 66.7
352 13053
36 - Did a member of staff explain the purpose of the medications you
were to take at home in a way you could understand? This Trust All trusts Patients discharged from care with new medication n % n %
Yes, completely 88 83.0 3597 84.0
Yes, to some extent 12 11.3 466 10.9
No 2 1.9 89 2.1
I did not need an explanation 4 3.8 129 3.0
106 4281
36+ - Did a member of staff explain the purpose of the medications
you were to take at home in a way you could understand? This Trust All trusts Patients with new medication who needed an explanation n % n %
Yes, completely 88 86.3 3597 86.6
*Yes, to some extent 12 11.8 466 11.2
*No 2 2.0 89 2.1
Problem score - This Trust 13.7% 102 4152Problem score - All trusts 13.4%

................................................................................................................................................................................................... Accident and Emergency Department Survey 2014 States of Jersey Health & Social Services Copyright 2014 Picker Institute Europe. All rights reserved. Page 64
37 - Did a member of staff tell you about medication side effects to watch for?
This Trust All trusts Patients discharged from care with new medication n % n %
Yes, completely 42 39.3 1387 32.5
Yes, to some extent 7 6.5 574 13.4
No 34 31.8 1480 34.7
I did not need this type of information 24 22.4 828 19.4
107 4269
37+ - Did a member of staff tell you about medication side effects to
watch for? This Trust All trusts Patients with new medication who needed information n % n %
Yes, completely 42 50.6 1387 40.3
*Yes, to some extent 7 8.4 574 16.7
*No 34 41.0 1480 43.0
Problem score - This Trust 49.4% 83 3441Problem score - All trusts 59.7%
38 - Did a member of staff tell you when you could resume your usual
activities, such as when to go back to work or drive a car? This Trust All trusts Patients discharged from care n % n %
Yes, definitely 96 27.4 3106 23.8
Yes, to some extent 50 14.3 1479 11.3
No 58 16.6 2770 21.2
I did not need this type of information 146 41.7 5691 43.6
350 13046
38+ - Did a member of staff tell you when you could resume your
usual activities, such as when to go back to work or drive a car? This Trust All trusts Patients discharged from care who needed information n % n %
Yes, definitely 96 47.1 3106 42.2
*Yes, to some extent 50 24.5 1479 20.1
*No 58 28.4 2770 37.7
Problem score - This Trust 52.9% 204 7355Problem score - All trusts 57.8%

................................................................................................................................................................................................... Accident and Emergency Department Survey 2014 States of Jersey Health & Social Services Copyright 2014 Picker Institute Europe. All rights reserved. Page 65
39 - Did hospital staff take your family or home situation into account when you were leaving the A&E Department?
This Trust All trusts Patients discharged from care n % n %
Yes, completely 39 11.3 2075 15.9
Yes, to some extent 19 5.5 903 6.9
No 70 20.2 2499 19.1
It was not necessary 214 61.8 7186 55.0
Don't know / can't remember 4 1.2 412 3.2
346 13075
39+ - Did hospital staff take your family or home situation into
account when you were leaving the A&E Department? This Trust All trusts Patients discharged from care whose home situation was relevant n % n %
Yes, completely 39 29.5 2075 35.2
*Yes, to some extent 19 14.4 903 15.3
*No 70 53.0 2499 42.4
Don't know / can't remember 4 3.0 412 7.0
Problem score - This Trust 67.4% 132 5889Problem score - All trusts 57.8%
40 - Did a member of staff tell you about what danger signals
regarding your illness or treatment to watch for after you went home? This Trust All trusts Patients discharged from care n % n %
Yes, completely 79 22.8 3596 27.4
Yes, to some extent 52 15.0 1958 14.9
No 49 14.1 2658 20.3
I did not need this type of information 167 48.1 4891 37.3
347 13103
40+ - Did a member of staff tell you about what danger signals
regarding your illness or treatment to watch for after you went home? This Trust All trusts Patients discharged from care who needed information n % n %
Yes, completely 79 43.9 3596 43.8
*Yes, to some extent 52 28.9 1958 23.8
*No 49 27.2 2658 32.4
Problem score - This Trust 56.1% 180 8212Problem score - All trusts 56.2%

................................................................................................................................................................................................... Accident and Emergency Department Survey 2014 States of Jersey Health & Social Services Copyright 2014 Picker Institute Europe. All rights reserved. Page 66
41 - Did hospital staff tell you who to contact if you were worried about your condition or treatment after you left the A&E Department?
This Trust All trusts Patients discharged from care n % n %
Yes 215 61.4 8196 62.6
*No 94 26.9 3487 26.6
Don't know / can't remember 41 11.7 1411 10.8
Problem score - This Trust 26.9% 350 13094Problem score - All trusts 26.6%

................................................................................................................................................................................................... Accident and Emergency Department Survey 2014 States of Jersey Health & Social Services Copyright 2014 Picker Institute Europe. All rights reserved. Page 67
OVERALL 42 - Overall, did you feel you were treated with respect and dignity
while you were in the A&E Department? This Trust All trusts All Patients n % n %
Yes, all of the time 328 84.3 15882 79.2
*Yes, some of the time 44 11.3 3447 17.2
*No 17 4.4 734 3.7
Problem score - This Trust 15.7% 389 20063Problem score - All trusts 20.8%
43 - Overall... This Trust All trusts All Patients n % n %
0 - I had a very poor experience 3 0.8 215 1.1
1 4 1.1 222 1.1
2 3 0.8 267 1.4
3 6 1.6 420 2.2
4 3 0.8 510 2.6
5 20 5.3 1075 5.5
6 15 4.0 1149 5.9
7 36 9.5 2281 11.8
8 69 18.3 4248 21.9
9 103 27.2 3898 20.1
10 - I had a very good experience 115 30.4 4989 25.7
98 1 0.3 117 0.6
378 19391
43+ - Overall... This Trust All trusts All patients who answered the question n % n %
*0 - I had a very poor experience 3 0.8 215 1.1
*1 4 1.1 222 1.2
*2 3 0.8 267 1.4
*3 6 1.6 420 2.2
*4 3 0.8 510 2.6
*5 20 5.3 1075 5.6
*6 15 4.0 1149 6.0
7 36 9.5 2281 11.8
8 69 18.3 4248 22.0
9 103 27.3 3898 20.2
10 - I had a very good experience 115 30.5 4989 25.9
Problem score - This Trust 14.3% 377 19274Problem score - All trusts 20.0%

................................................................................................................................................................................................... Accident and Emergency Department Survey 2014 States of Jersey Health & Social Services Copyright 2014 Picker Institute Europe. All rights reserved. Page 68
ABOUT YOU 44 - Who was the main person or people that filled in this
questionnaire? This Trust All trusts All Patients n % n %
The patient (named on the front of the envelope) 341 88.6 16918 84.6
A friend or relative of the patient 17 4.4 1406 7.0
Both patient and friend/relative together 25 6.5 1576 7.9
The patient with the help of a health professional 2 0.5 101 0.5
385 20001
45 - Are you male or female? This Trust All trusts All Patients n % n %
Male 194 49.7 8972 44.6
Female 196 50.3 11146 55.4
390 20118
46 - What was your year of birth? This Trust All trusts All Patients n % n %
Under 20 26 6.7 607 3.0
20-29 35 9.0 1420 7.1
30-39 44 11.4 1800 9.0
40-49 75 19.4 2400 11.9
50-59 70 18.1 3175 15.8
60-69 58 15.0 3638 18.1
70-79 45 11.6 3537 17.6
80-89 27 7.0 2773 13.8
90+ 7 1.8 749 3.7
387 20099

................................................................................................................................................................................................... Accident and Emergency Department Survey 2014 States of Jersey Health & Social Services Copyright 2014 Picker Institute Europe. All rights reserved. Page 69
47 - What is your religion? This Trust All trusts All Patients n % n %
No religion 85 21.9 3532 17.7
Buddhist 4 1.0 101 0.5
Christian (including Church of England, Catholic, Protestant, and other Christian denominations)
281 72.4 14257 71.6
Hindu 1 0.3 272 1.4
Jewish 0 0.0 159 0.8
Muslim 1 0.3 719 3.6
Sikh 0 0.0 130 0.7
Other 5 1.3 280 1.4
I would prefer not to say 11 2.8 459 2.3
388 19909
48 - Which of the following best describes how you think of yourself? This Trust All trusts All Patients n % n %
Heterosexual / straight 361 96.3 17731 92.2
Gay / lesbian 1 0.3 234 1.2
Bisexual 1 0.3 126 0.7
Other 2 0.5 182 0.9
I would prefer not to say 10 2.7 955 5.0
375 19228
49 - Do you have any of the following long-standing conditions? This Trust All trusts All Patients n % n %
Deafness or severe hearing impairment 31 8.2 2214 11.5
Blindness or partially sighted 13 3.4 761 4.0
A long-standing physical condition 59 15.6 4300 22.4
A learning disability 10 2.6 405 2.1
A mental health condition 13 3.4 1184 6.2
Dementia 4 1.1 486 2.5
A long-standing illness, such as cancer, HIV, diabetes, chronic heart disease, or epilepsy
46 12.2 4157 21.6
No, I do not have a long-standing condition 246 65.1 9726 50.6
378 19235

................................................................................................................................................................................................... Accident and Emergency Department Survey 2014 States of Jersey Health & Social Services Copyright 2014 Picker Institute Europe. All rights reserved. Page 70
50 - Does this condition(s) cause you difficulty with any of the following? (TICK ALL THAT APPLY)
This Trust All trusts Patients with a long-standing condition n % n %
Everyday activities that people your age can usually do 52 41.6 5245 57.2
At work, in education, or training 22 17.6 1327 14.5
Access to buildings, streets, or vehicles 21 16.8 2314 25.2
Reading or writing 16 12.8 1386 15.1
People's attitudes to you because of your condition 19 15.2 1331 14.5
Communicating, mixing with others, or socialising 29 23.2 2167 23.6
Any other activity 14 11.2 1442 15.7
No difficulty with any of these 46 36.8 2646 28.9
125 9165
51 - To which of these ethnic groups would you say you belong to? This Trust All trusts All Patients n % n %
White: English / Welsh / Scottish / Northern Irish / British 320 89.1 16564 85.3
White: Irish 6 1.7 267 1.4
White: Gypsy or Irish Traveller 0 0.0 23 0.1
Any other White background 25 7.0 747 3.8
Mixed / Multiple Ethnic groups: White and Black Caribbean 1 0.3 62 0.3
Mixed / Multiple Ethnic groups: White and Black African 0 0.0 24 0.1
Mixed / Multiple Ethnic groups: White and Asian 2 0.6 68 0.4
Any other Mixed / multiple ethnic background 0 0.0 41 0.2
Asian / Asian British: Indian 2 0.6 419 2.2
Asian / Asian British: Pakistani 1 0.3 263 1.4
Asian / Asian British: Bangladeshi 0 0.0 84 0.4
Asian / Asian British: Chinese 0 0.0 82 0.4
Any other Asian background 1 0.3 164 0.8
Black / African / Caribbean / Black British: African 0 0.0 301 1.5
Black / African / Caribbean / Black British: Caribbean 0 0.0 190 1.0
Any other Black / African / Caribbean background 0 0.0 26 0.1
Other ethnic group: Arab 1 0.3 54 0.3
Any other ethnic group 0 0.0 41 0.2
359 19420


................................................................................................................................................................................................... Accident and Emergency Department Survey 2014 States of Jersey Health & Social Services Copyright 2014 Picker Institute Europe. All rights reserved. Page 72
Appendix 2
Questionnaire

Accident and Emergency Department Core Questionnaire 2014 AE2014 Questionnaire FINAL AGREED V3.0_15/04/2014
Accident and Emergency (A&E)Department Questionnaire
What is the survey about?
This survey is about your most recent visit to the Accident and Emergency Department at the Jersey General Hospital. This department may also be referred to as casualty, the emergency department or A&E. It does not include other wards or units that you might have been moved to whilst you were at the hospital.
Who should complete the questionnaire?
The questions should be answered by the person named on the front of the envelope. If that person needs help to complete the questionnaire, the answers should be given from his/her point of view – not the point of view of the person who is helping.
Completing the questionnaire
For each question please cross clearly inside one box using a black or blue pen. For some questions you will be instructed that you may cross more than one box.
Sometimes you will find the box you have crossed has an instruction to go to another question. By following the instructions carefully you will miss out questions that do not apply to you.
Don’t worry if you make a mistake; simply fill in the box and put a cross in the correct box.
Please do not write your name or address anywhere on the questionnaire.
Questions or help?
If you have any questions, please call the helpline number given in the letter enclosed with this questionnaire.
Taking part in this survey is voluntary. Your answers will be treated in confidence.
UKEME2014_R25

Accident and Emergency Department Core Questionnaire 2014 AE2014 Questionnaire FINAL AGREED V3.0_15/04/2014
ARRIVAL AT THE ACCIDENT & EMERGENCY DEPARTMENT
Please remember, this questionnaire is about your most recent visit to the Accident and Emergency Department (A&E) of the Jersey General Hospital.
1. Before your most recent visit to A&E, had you previously been to this A&E about the same condition or something related to it?
1 Yes, within the previous week
2 Yes, between one week and one month earlier
3 Yes, more than a month earlier
4 No
5 Don’t know / can’t remember
2. Who advised you to go to the A&E Department? (Cross ONE only – if more than one option applies, cross the MAIN source of advice)
1 The ambulance service
2 A GP out of hours service
3 A GP from my local surgery
4 Some other health professional (e.g. pharmacist)
5 Somebody else (e.g. friend, relative, colleague)
6 No-one, I decided that I needed to go
7 Don’t know / can’t remember
3. Were you taken to the hospital in an ambulance?
1 Yes Go to 4
2 No Go to 5
4. Once you arrived at the hospital, how long did you wait with the ambulance crew before your care was handed over to the A&E staff?
1 I did not have to wait
2 Up to 15 minutes
3 16 – 30 minutes
4 31 – 60 minutes
5 More than 1 hour but no more than 2 hours
6 More than 2 hours
7 Don’t know / can’t remember
5. Were you given enough privacy when discussing your condition with the receptionist?
1 Yes, definitely
2 Yes, to some extent
3 No
4 I did not discuss my condition with a receptionist
WAITING
6. How long did you wait before you first spoke to a nurse or doctor?
1 0 -15 minutes
2 16 - 30 minutes
3 31- 60 minutes
4 More than 60 minutes
5 Don’t know / can’t remember

Accident and Emergency Department Core Questionnaire 2014 AE2014 Questionnaire FINAL AGREED V3.0_15/04/2014
7. From the time you first arrived at the A&E Department, how long did you wait beforebeing examined by a doctor or nurse?
1 I did not have to wait Go to 9
2 1-30 minutes Go to 8
3 31-60 minutes Go to 8
4 More than 1 hour but no more than 2 hours Go to 8
5 More than 2 hours but no more than 4 hours Go to 8
6 More than 4 hours Go to 8
7 Can’t remember Go to 8
8 I did not see a doctor or a nurse Go to 9
8. Were you told how long you would have to wait to be examined?
1 Yes, but the wait was shorter
2 Yes, and I had to wait about as long as I was told
3 Yes, but the wait was longer
4 No, I was not told
5 Don’t know / can’t remember
9. Overall, how long did your visit to the A&E Department last?
1 Up to 1 hour
2 More than 1 hour but no more than 2 hours
3 More than 2 hours but no more than 4 hours
4 More than 4 hours but no more than 6 hours
5 More than 6 hours but no more than 8 hours
6 More than 8 hours but no more than 12 hours
7 More than 12 hours but no more than 24 hours
8 More than 24 hours
9 Can’t remember
DOCTORS AND NURSES
Thinking about your experience in the A&E Department only….
10. Did you have enough time to discuss your health or medical problem with the doctor or nurse?
1 Yes, definitely Go to 11
2 Yes, to some extent Go to 11
3 No Go to 11
4 I did not see a doctor or nurse Go to 17
11. While you were in the A&E Department, did a doctor or nurse explain your condition and treatment in a way you could understand?
1 Yes, completely
2 Yes, to some extent
3 No
4 I did not need an explanation
12. Did the doctors and nurses listen to what you had to say?
1 Yes, definitely
2 Yes, to some extent
3 No
13. If you had any anxieties or fears about your condition or treatment, did a doctor or nurse discuss them with you?
1 Yes, completely
2 Yes, to some extent
3 No
4 I did not have anxieties or fears
14. Did you have confidence and trust in the doctors and nurses examining and treating you?
1 Yes, definitely
2 Yes, to some extent
3 No

Accident and Emergency Department Core Questionnaire 2014 AE2014 Questionnaire FINAL AGREED V3.0_15/04/2014
15. Did doctors or nurses talk to each other about you as if you weren’t there?
1 Yes, definitely
2 Yes, to some extent
3 No
16. If your family or someone else close to you wanted to talk to a doctor, did they have enough opportunity to do so?
1 Yes, definitely
2 Yes, to some extent
3 No
4 No family or friends were involved
5 My family or friends did not want or need information
6 I did not want my family or friends to talk to a doctor
YOUR CARE AND TREATMENT
17. While you were in the A&E Department, how much information about your condition or treatment was given to you?
1 Not enough
2 Right amount
3 Too much
4 I was not given any information about my condition or treatment
18. Were you given enough privacy when beingexamined or treated?
1 Yes, definitely
2 Yes, to some extent
3 No
19. If you needed attention, were you able to get a member of medical or nursing staff to help you?
1 Yes, always
2 Yes, sometimes
3 No, I could not find a member of staff to help me
4 A member of staff was with me all the time
5 I did not need attention
20. Sometimes in a hospital, a member of staff will say one thing and another will say something quite different. Did this happen to you in the A&E Department?
1 Yes, definitely
2 Yes, to some extent
3 No
21. Were you involved as much as you wanted to be in decisions about your care and treatment?
1 Yes, definitely
2 Yes, to some extent
3 No
4 I was not well enough to be involved in decisions about my care
22. If you were feeling distressed while you were in the A&E Department, did a member of staff help to reassure you?
1 Yes, definitely
2 Yes, to some extent
3 No
4 I was not distressed
5 Not sure/ can’t remember
TESTS
23. Did you have any tests (such as x-rays, scans or blood tests) when you visited the A&E Department?
1 Yes Go to 24
2 No Go to 27
24. Did a member of staff explain why you neededthese test(s) in a way you could understand?
1 Yes, completely
2 Yes, to some extent
3 No

Accident and Emergency Department Core Questionnaire 2014 AE2014 Questionnaire FINAL AGREED V3.0_15/04/2014
25. Before you left the A&E Department, did you get the results of your tests?
1 Yes Go to 26
2 No Go to 27
3 I was told that the results of the tests would be given to me at a later date Go to 27
4 Don’t know / can’t remember Go to 27
26. Did a member of staff explain the results of the tests in a way you could understand?
1 Yes, definitely
2 Yes, to some extent
3 No
4 Not sure / can’t remember
PAIN
27. Were you in any pain while you were in the A&E Department?
1 Yes Go to 28
2 No Go to 31
28. Did you request pain relief medication?
1 Yes Go to 29
2 No Go to 30
3 I was offered or given pain relief medication without asking Go to 30
29. How many minutes after you requested pain relief medication did it take before you got it?
1 0 minutes / right away
2 1 – 5 minutes
3 6 – 10 minutes
4 11 – 15 minutes
5 16 – 30 minutes
6 More than 30 minutes
7 I asked for pain relief medication but wasn’t given any
30. Do you think the hospital staff did everything they could to help control your pain?
1 Yes, definitely
2 Yes, to some extent
3 No
4 Can’t say / don’t know
HOSPITAL ENVIRONMENT AND FACILITIES
31. In your opinion, how clean was the A&E Department?
1 Very clean
2 Fairly clean
3 Not very clean
4 Not at all clean
5 Can’t say
32. While you were in the A&E Department, did you feel threatened by other patients or visitors?
1 Yes, definitely
2 Yes, to some extent
3 No
33. Were you able to get suitable food or drinks when you were in the A&E Department?
1 Yes
2 No
3 I was told not to eat or drink
4 I did not know if I was allowed to eat or drink
5 I did not want anything to eat or drink

Accident and Emergency Department Core Questionnaire 2014 AE2014 Questionnaire FINAL AGREED V3.0_15/04/2014
LEAVING THE A&E DEPARTMENT
34. What happened at the end of your visit to the A&E Department?
1 I was admitted to the same hospital
Go to 42
2 I was transferred to a different hospital or a nursing home Go to 42
3 I went home Go to 35
4 I went to stay with a friend or relative
Go to 35
5 I went to stay somewhere else Go to 35
Medications (e.g. medicines, tablets, ointments)
35. Before you left the A&E Department, were any new medications prescribed for you?
1 Yes Go to 36
2 No Go to 38
36. Did a member of staff explain the purpose of the medications you were to take at home in a way you could understand?
1 Yes, completely
2 Yes, to some extent
3 No
4 I did not need an explanation
37. Did a member of staff tell you about medication side effects to watch for?
1 Yes, completely
2 Yes, to some extent
3 No
4 I did not need this type of information
Information38. Did a member of staff tell you when you could
resume your usual activities, such as when to go back to work or drive a car?
1 Yes, definitely
2 Yes, to some extent
3 No
4 I did not need this type of information
39. Did hospital staff take your family or home situation into account when you were leaving the A&E Department?
1 Yes, completely
2 Yes, to some extent
3 No
4 It was not necessary
5 Don’t know / can’t remember
40. Did a member of staff tell you about what danger signals regarding your illness or treatment to watch for after you went home?
1 Yes, completely
2 Yes, to some extent
3 No
4 I did not need this type of information
41. Did hospital staff tell you who to contact if you were worried about your condition or treatment after you left the A&E Department?
1 Yes
2 No
3 Don’t know / can’t remember
OVERALL42. Overall, did you feel you were treated with
respect and dignity while you were in the A&E Department?
1 Yes, all of the time
2 Yes, some of the time
3 No

Accident and Emergency Department Core Questionnaire 2014 AE2014 Questionnaire FINAL AGREED V3.0_15/04/2014
43. Overall... (please circle a number)
I had a very poor experience
I had a very good experience
0 1 2 3 4 5 6 7 8 9 10
ABOUT YOU 44. Who was the main person or people that filled
in this questionnaire?
1 The patient (named on the front of the envelope)
2 A friend or relative of the patient
3 Both patient and friend/relative together 4 The patient with the help of a health
professional
Reminder: All questions should be answered from the point of view of the person named on the envelope, including these background questions.
45. Are you male or female?
1 Male
2 Female
46. What was your year of birth?
(Please write in) e.g. 1 9 3 4
1 9
47. What is your religion?
1 No religion
2 Buddhist
3 Christian (including Church of England, Catholic, Protestant, and other Christian denominations)
4 Hindu
5 Jewish
6 Muslim
7 Sikh
8 Other
9 I would prefer not to say
48. Which of the following best describes how you think of yourself?
1 Heterosexual / straight
2 Gay / lesbian
3 Bisexual
4 Other
5 I would prefer not to say
49. Do you have any of the following long-standing conditions? (CROSS ALL THAT APPLY)
1 Deafness or severe hearing impairment Go to 50
2 Blindness or partially sighted Go to 50
3 A long-standing physical condition Go to 50
4 A learning disability Go to 50
5 A mental health condition Go to 50
6 Dementia Go to 50
7 A long-standing illness, such as cancer, HIV, diabetes, chronic heart disease, or epilepsy Go to 50
8 No, I do not have a long-standing condition Go to 51
50. Does this condition(s) cause you difficulty with any of the following? (CROSS ALL THAT APPLY)
1 Everyday activities that people your age can usually do
2 At work, in education or training
3 Access to buildings, streets or vehicles
4 Reading or writing
5 People’s attitudes to you because of your condition
6 Communicating, mixing with others or socialising
7 Any other activity
8 No difficulty with any of these

Accident and Emergency Department Core Questionnaire 2014 AE2014 Questionnaire FINAL AGREED V3.0_15/04/2014
51. To which of these ethnic groups would you say you belong? (Cross ONE only)
a. WHITE 1 English/Welsh/Scottish/Northern Irish/
British 2 Irish 3 Gypsy or Irish Traveller4 Any other White background,
write in...
b. MIXED / MULTIPLE ETHNIC GROUPS 5 White and Black Caribbean 6 White and Black African 7 White and Asian 8 Any other Mixed/multiple ethnic
background, write in...
c. ASIAN / ASIAN BRITISH 9 Indian 10 Pakistani 11 Bangladeshi 12 Chinese 13 Any other Asian background,
write in...
d. BLACK / AFRICAN / CARIBBEAN / BLACK BRITISH
14 African
15 Caribbean
16 Any other Black / African / Caribbean background, write in...
e. OTHER ETHNIC GROUP 17 Arab
18 Any other ethnic group, write in...
ANY OTHER COMMENTS
If there is anything else you would like to tell us about your experiences in the A&E Department, please do so here.
THANK YOU VERY MUCH FOR YOUR HELP Please check that you answered all the
questions that apply to you. Please post this questionnaire back in the
FREEPOST envelope provided.
No stamp is needed
UKEME2014_R25


Picker Institute EuropeBuxton Court3 West WayOxford OX2 0JB
Tel: +44 (0)1865 208100Fax: +44 (0)1865 [email protected]
Charity registered in England and Wales: 1081688 Company limited by guarantee registered in England and Wales: 03908160 Registered office: Buxton Court, 3 West Way, Oxford OX2 0JB
Picker A4 Report Template Covers (portrait) - Ciconi.indd 8 13/12/2011 10:57