on the effect of axial dispersion in the numerical ... · the effects of axial dispersion in the...
TRANSCRIPT

ON THE EFFECT OF AXIAL DISPERSION IN THE NUMERICAL SIMULATION 1
Jurnal Teknologi, 43(F) Dis. 2005: 1–13© Universiti Teknologi Malaysia
ON THE EFFECT OF AXIAL DISPERSION IN THE NUMERICALSIMULATION OF FAST CYCLING ADSORPTION PROCESSES
C. Y. SOO1, Y. L. LAI2, T. G. CHUAH3, S. MUSTAPHA4 & T. S. Y. CHOONG5*
Abstract. The effects of axial dispersion in the numerical simulation of fast cycling adsorptionprocesses were studied. The main objectives are: (1) to re-examine the observation of Alpay [1] onthe effect of axial dispersion on the oxygen purity for a 1.0 m column, and (2) to investigatenumerically the effect of axial dispersion on the oxygen purity and cycle-averaged feed flow rate ofan ultra rapid pressure swing adsorption (URPSA) process, which employed a column of 0.2 m inlength. The linear driving force (LDF) model was employed to model the mass transfer within theadsorbent particles. Numerical simulation was carried out by discretising the partial differentialequations (PDEs) in the space domain to a system of ordinary differential equations (ODEs), usingthe method of orthogonal collocation (OC). The ODEs were then integrated using a subroutinefrom IMSL FORTRAN Library, which is suitable for the integration of stiff ODEs. For Alpay’sexperimental conditions, unphysical numerical results were observed for an axial dispersioncoefficient predicted by Langer’s correlation. However, no such numerical difficulties wereencountered for an URPSA process. Our numerical simulations showed a reduction of up to 10percentage points when values of axial dispersions were increased. The axial dispersion was foundto have no effect on the cycle-averaged feed gas rate. Future works are deemed necessary to devicesuitable strategy to overcome the numerical difficulties encountered here.
Keywords: Rapid pressure swing adsorption, modelling, numerical simulation, air separation,axial dispersion
Abstrak. Kesan serakan paksi dalam penyelakuan perangkaan proses penjerapan berkitarpantas telah dikaji. Objektif kajian ini adalah untuk (1) mengkaji semula cerapan Alpay [1] dalamkesan serakan paksi ke atas ketulenan oksigen dalam turus yang panjangnya 1.0 m, dan (2) mengkajisecara perangkaan kesan serakan paksi ke atas ketulenan oksigen dan kadar aliran suapan purata-kitar bagi proses jerapan buaian tekanan ultracepat (URPSA) dalam turus yang panjangnya 0.2 m.Daya pacu linear telah digunakan untuk memodel pemindahan jisim di antara partikel bahan penjerap.Penyelakuan perangkaan telah dijalankan dengan menurunkan persamaan kebezaan separa (PDEs) kedalam persamaan kebezaan biasa (ODEs) dengan menggunakan kaedah ortogon penempatan bersama(OC). Sistem ODEs itu kemudian dikamil dengan menggunakan subrutin daripada PerpustakaanIMSL FORTRAN, di mana subrutin ini adalah sesuai untuk kamiran ODEs kaku. Untuk keadaaneksperimen Alpay, keputusan penyelakuan yang tidak fizikal telah dicerap untuk serakan paksi yangdijangka oleh kolerasi Langer. Walau bagaimanapun, tiada cerapan sebegini ditemui untuk prosesURPSA. Keputusan penyelakuan kami telah menunjukkan satu penurunan sebanyak 10 peratusapabila nilai serakan paksi bertambah. Serakan paksi didapati tiada kesan ke atas kadar aliran suapan
1,2,3,4&5Department of Chemical and Environmental Engineering, Universiti Putra Malaysia, 43400Serdang, Malaysia.
* Corresponding author: Fax: (603)-86567099; E-mail: [email protected]
JTDIS43F[01].pmd 02/15/2007, 16:381
C. Y. SOO, Y. L. LAI, T. G. CHUAH, S. MUSTAPHA & T. S. Y. CHOONG2
purata-kitar. Kerja masa depan adalah diperlukan untuk mencipta strategi yang sesuai untuk mengatasikesulitan perangkaan yang telah ditemui.
Kata kunci: Proses jerapan buaian tekanan, permodelan, penyelakuan perangkaan, permisahanudara, serakan paksi
1.0 INTRODUCTION
Rapid pressure swing adsorption (RPSA), originally developed by Turnock and Kadlec[2], employs only a single packed bed, with short cycle times (in the order of seconds)and small particle size (typically 200 to 700 µm in diameter). Compared withconventional pressure swing adsorption (PSA) systems, it has the advantage of processsimplicity and higher production rate at equal purity and recovery [3]. An applicationof RPSA is the enrichment of oxygen from air studied by Alpay [1]. The experimentalconditions of Alpay are given in Table 1.
Table 1 Experimental conditions of Alpay [1] and Murray [4]
Operating Description Unit Value
variable Alpay Murray
dc bed diameter m 0.05 0.05
L bed length m 1.0 0.2
Pf feed pressure bar 1.84 2.0
T temperature K 290 290
eb bed porosity 0.35 0.35
ep particle porosity 0.55 0.57
rb bed bulk density kg m–3 800 790
HA Henry’s law constant for oxygen m3 kg–1 3.5 × 10⁻³ 3.5 × 10⁻³
HB Henry’s law constant for nitrogen m3 kg–1 7.7 × 10⁻³ 7.7 × 10⁻³
dp particle diameter µm 200 300
Q–
p product delivery rate 1.0 × 10⁻⁵ m3 s–1 0.5 min–1 at@ Pam, Tam s.t.p.
A basic RPSA cycle consists of two steps: pressurisation and depressurisation, asillustrated in Figure 1. During pressurisation, air is fed to the column through athree-way valve. Pressure increases rapidly at the feed end of the column. As feedair flows down the column, nitrogen is preferentially adsorbed on the zeolite 5Aadsorbent, resulting in an oxygen-enriched gas phase.
JTDIS43F[01].pmd 02/15/2007, 16:382

ON THE EFFECT OF AXIAL DISPERSION IN THE NUMERICAL SIMULATION 3
In the depressurisation step, the feed valve is closed and the exhaust valve at thefeed end is opened to atmospheric pressure, resulting in a rapid pressure drop at thefeed end of the column, followed by desorption of the adsorbed nitrogen. The gasleaving the exhaust port is enriched with nitrogen. As there is a pressure maximumin the bed during depressurisation, a pressure gradient is always maintained betweenthis maximum and the product end of the bed, which results in a continuous productstream throughout the cycle.
Figure 1 Basic steps in RPSA [5]
Oxygen-richproduct
Oxygen-richproduct
Product gassurge tank
Product gassurge tank
Flowdirection
Flowdirection
Flowdirection
Exhaustpointclosed
Feed gassurge tank
Feed gassurge tank
Feed pointclosed
Depressurise toatmospheric pressure
Pressurise with air
(a) Pressurisation (b) Depressurisation
JTDIS43F[01].pmd 02/15/2007, 16:383

C. Y. SOO, Y. L. LAI, T. G. CHUAH, S. MUSTAPHA & T. S. Y. CHOONG4
The adsorbent productivity of a single column PSA can be further improved byreducing further the cycle time and using a shorter bed [4,6,7]. This process is referredhere as the ultra rapid pressure swing adsorption (URPSA). Murray [4] has conductedexperiments on URPSA using a short bed, L = 0.2 m, and very short cycle times,ct = 0.2 s – 2.0 s. The experimental conditions of Murray are given in Table 1.The axially dispersed plug flow (ADPF) model is often used to model the deviation
of the actual flow pattern from plug flow in PSA processes. Numerically, the inclusionof axial dispersion in PSA models helps to eliminate the predicted discontinuities ofconcentration due to shocks [3]. In RPSA, the effect of axial dispersion on CSSoxygen product purity was investigated numerically by Alpay [8]. Increasing thenumerical value of the axial dispersion coefficient significantly reduced thepredicted oxygen purity by up to 10 percentage points. However, as we haveestablished earlier, the model formulation of Alpay does not conserve mass andmay introduce substantial numerical error [5,9]. Therefore, the status of Alpayobservation is unclear.
The objectives of this work are: (1) to re-examine the observation of Alpay on theeffect of axial dispersion on the oxygen purity, and (2) to investigate numerically theeffect of axial dispersion on the oxygen product purity and the cycle-averaged feedflow rate of an URPSA process.
2.0 MATHEMATICAL MODELS
In this work, a cycle always starts at the start of pressurisation and is viewed as completeat the instant of finishing the depressurisation step. A linear driving force (LDF) modelwas employed to model the mass transfer within the adsorbent particles. We considereda rich, binary gas mixture consisting of oxygen (component A) and nitrogen(component B). The subscript i refers to component i, where i = A, B. The assumptionsmade are:
(1) The ideal gas law is obeyed.(2) The process is assumed to be isothermal.(3) The bed is packed uniformly with spherical particles.(4) The flow pattern is described by the axially dispersed plug flow (ADPF) model
with a constant axial dispersion coefficient.(5) Gas flow is described by Ergun equation.(6) Adsorption isotherms for both oxygen and nitrogen are given by Henry’s Law.(7) The radial temperature and concentration gradients are negligible.(8) A step change of pressure at the feed end occurs for both pressurisation and
depressurisation steps.(9) The product delivery rate is constant with time.(10)) The packed bed is initially in equilibrium with atmospheric air.
JTDIS43F[01].pmd 02/15/2007, 16:384
ON THE EFFECT OF AXIAL DISPERSION IN THE NUMERICAL SIMULATION 5
The governing equations are:
( )1 ib
ib
P uP dqRT
t z dtρ
ε∂ ∂ = − + ∂ ∂
∑ (1)
and
( ) ρε
∂ ∂ ∂∂ ∂ = − − + − ∂ ∂ ∂ ∂ ∂ 1 AA A AA
bb
uPyy y ydq PD P RT
t P z z z dt P t (2)
For the process conditions used in this work,
( )215 i
*e *i
i ip
Ddqq q
dt r= − (3)
The gas flows through a packed bed is described by the Ergun equation:
( ) ( )22
2 3 2 3
111 75 b gb
p b p b
dPu . u
dz d d
ε ρµ εα
ε ε−−
= − − (4)
The value of the coefficient α = 180 as suggested by McDonald [10] is found todescribe accurately the gas flow in a packed bed studied by Alpay [1]. However,Murray [4] suggested that α = 250 described his experiment conditions better.
Two main mechanisms contributed to axial dispersion. These are (i) moleculardiffusion and (ii) turbulent mixing arising from the splitting and recombination offlows around adsorbent particles. The correlation proposed by Langer et al. [11] canbe used here to predict the axial dispersion coefficient:
1
pax ax m
ax ax m bb
p
udD D
DPe
ud
τβ τ εε∞
= + +
(5)
where Pe∞ is the limiting value of the Peclet number, axβ is the radial dispersionfactor and Dm is the molecular diffusion coefficient. The axial tortuosity factor, axτ ,is given by:
0 45 0 55ax b. .τ ε= + (6)
The term including ax ax mDβ τ accounts for the perceived effect on axial dispersiondue to local radial concentration and velocity gradients. The theoretical value of
axβ , 8, is obtained from a highly turbulent random walk model. The value of Pe∞depends on the particle size and for dp < 3000 µm is given as:
670 pPe d∞ = (7)
JTDIS43F[01].pmd 02/15/2007, 16:385

C. Y. SOO, Y. L. LAI, T. G. CHUAH, S. MUSTAPHA & T. S. Y. CHOONG6
The detailed derivation of the model and the equations describing the respectiveboundary conditions for pressurization and depressurization steps can be found inChoong [9].
3.0 NUMERICAL SIMULATION
The partial differential equations (PDEs) in the RPSA model are discretised in thespace domain to a system of ordinary differential equations (ODEs) using theorthogonal collocation (OC) method. The ODEs are then integrated over time. Allsimulations are performed using the OC method with a 20th degree polynomial.Details on the OC method can be found in Rice and Do [12] and Villadsen andMichelson [13]. The computer program is written in FORTRAN 90 for theimplementation of modelling and simulation. Standard algorithms from theIMSL FORTRAN library are employed as external subroutines. The ODEintegration algorithm employed the IMSL FORTRAN library subroutineDIVPAG, which is based on a variable order, variable step method implementingbackward differentiation formulae, and is suitable for a stiff system of first ordernon-linear ODEs. The accuracy of the integration is controlled by the absolutetolerance, TOL, used in the subroutine. The value of TOL used in the simulation is1 × 10–5.
The CSS is calculated using the method of successive substitution. The simulationinvolves a series of complete cycles with the results of the previous cycle used asinitial conditions for the next cycle. The CSS is determined using the rational stoppingcriterion developed earlier by Choong et al. [14].
4.0 RESULTS AND DISCUSSION
As mentioned by Ruthven et al. [3], the inclusion of axial dispersion in PSA modelshelps to eliminate the predicted discontinuities of concentration due to shocks. Theaxial dispersion coefficient can be estimated using the Langer’s correlation or anyother suitable correlation. A constant effective axial dispersion coefficient, D,1 × 10–3 m2 s–1 is often used in the literature for a 1 m length column RPSA [9,15,16].However, for process conditions used by these researchers, the Langer’s correlationestimated D to be around 1 × 10⁻⁴ m2 s–1, not D = 1 × 10⁻³ m2 s–1. The effects of thesetwo D are to be investigated here.
For the simulation results based on the experimental conditions of Alpay [1](Table 1), about 2000 cycles were required to reach CSS, as shown in Figure 2. Theoxygen mole fraction profiles did not vary much after 1000 cycles. When thecommonly used D = 1 × 10⁻³ m2 s–1 was applied in the simulation, the oxygen molefraction waves travelled smoothly down the column, as shown in Figure 2. However,using the Langer’s correlation, the results were unphysical as there were oxygenmole fractions exceeding 1.0 in the column, as shown in Figure 3. From a close
JTDIS43F[01].pmd 02/15/2007, 16:386

ON THE EFFECT OF AXIAL DISPERSION IN THE NUMERICAL SIMULATION 7
0.7
0.6
0.5
0.4
0.3
0.2
0.1
0
Oxyg
en
mo
le f
racti
on
0 0.2 0.4 0.6 0.8 1 1.2
13002000
20
500
100
1000
Figure 2 Oxygen mole fraction as a function of axial distance. Process conditions are from Alpay[1] with an effective axial dispersion coefficient, D = 1 × 10⁻³ m2 s–1
Figure 3 Oxygen mole fraction as a function of axial distance. Process conditions are from Alpay[1] with an effective axial dispersion coefficient, D = 1 × 10⁻⁴ m2 s–1
00 0.2 0.4 0.6 0.8 1 1.2
13002000
20500
1001000
1.20
1.00
0.80
0.60
0.40
0.20
Oxyg
en
mo
le f
racti
on
Axial distance, m
Axial distance, m
JTDIS43F[01].pmd 02/15/2007, 16:387

C. Y. SOO, Y. L. LAI, T. G. CHUAH, S. MUSTAPHA & T. S. Y. CHOONG8
examination of Figure 3, the oxygen mole fraction waves were accumulated atz = 0.2 m and did not travel down the end of column.
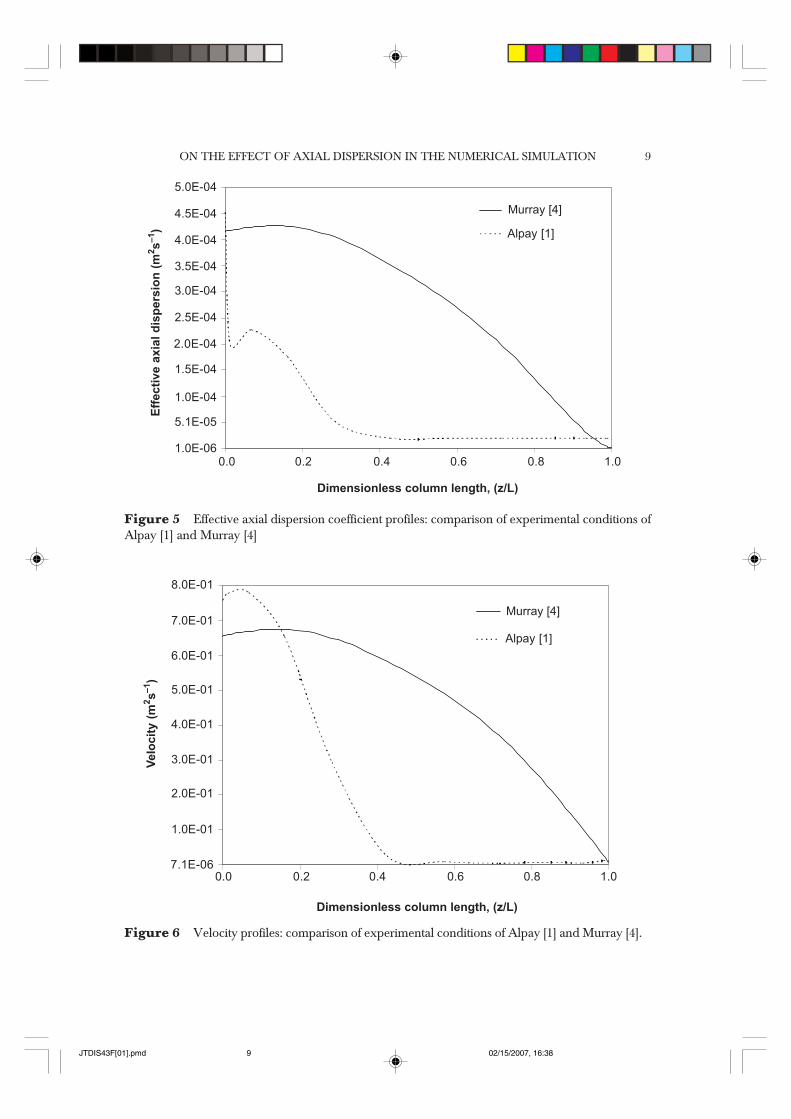
The numerical difficulty observed in the 1 m length column was not encounteredin simulations using the experimental data of Murray [4] as shown in Table 1. Thesimulations were performed using the Langer’s correlation. The experimentalconditions of Murray [4] are similar to Alpay [1], except a shorter column (0.2 m) isused rather than a column length of 1 m. Figure 4 shows the oxygen mole fraction asa function of axial distance for the experimental conditions of Murray [4]. There is nounphysical value of oxygen mole fraction as found in Figure 3. A comparison of theeffective axial dispersion profiles and the velocity profiles was made for the respectiveexperimental conditions of Alpay [1] and Murray [4]. Figure 5 shows the effective axialdispersion profiles across the column for the experimental conditions of Alpay [1] andMurray [6]. It is observed that the effective axial dispersions for both experimentalconditions are in the same order of magnitude. Figure 6 reveals that the velocitycalculated from Murray’s experimental conditions is generally higher than that of Alpay’sexperimental conditions. This allows deeper penetration of the oxygen mole fractionwave for the numerical simulations of Murray’s experimental conditions and therefore,no numerical difficulty was encountered.
0.1
00.00 0.02 0.06 0.10 0.14 0.18 0.20
13002000
20500
1001000
0.7
0.6
0.5
0.4
0.3
0.2Oxyg
en
mo
le f
racti
on
Axial distance, m
0.04 0.08 0.12 0.16
Figure 4 Oxygen mole fraction as a function of axial distance. Process conditions are from Murray[4] with effective axial dispersion coefficient, D = Langer et al. [9]
JTDIS43F[01].pmd 02/15/2007, 16:388
ON THE EFFECT OF AXIAL DISPERSION IN THE NUMERICAL SIMULATION 9
Figure 5 Effective axial dispersion coefficient profiles: comparison of experimental conditions ofAlpay [1] and Murray [4]
0.01.0E-06
Eff
ecti
ve a
xia
l d
isp
ers
ion
(m
2s
–1)
Dimensionless column length, (z/L)
0.2 0.4 0.6 0.8 1.0
5.1E-05
1.0E-04
1.5E-04
2.0E-04
2.5E-04
3.0E-04
3.5E-04
4.0E-04
4.5E-04
5.0E-04
Murray [6]
Alpay [1]
Murray [6]
Alpay [1]
0.0
Velo
cit
y (
m2s
–1)
Dimensionless column length, (z/L)
8.0E-01
7.0E-01
6.0E-01
5.0E-01
4.0E-01
3.0E-01
2.0E-01
1.0E-01
7.1E-060.2 0.4 0.6 0.8 1.0
Figure 6 Velocity profiles: comparison of experimental conditions of Alpay [1] and Murray [4].
Murray [4]
Alpay [1]
Murray [4]
Alpay [1]
JTDIS43F[01].pmd 02/15/2007, 16:389

C. Y. SOO, Y. L. LAI, T. G. CHUAH, S. MUSTAPHA & T. S. Y. CHOONG10
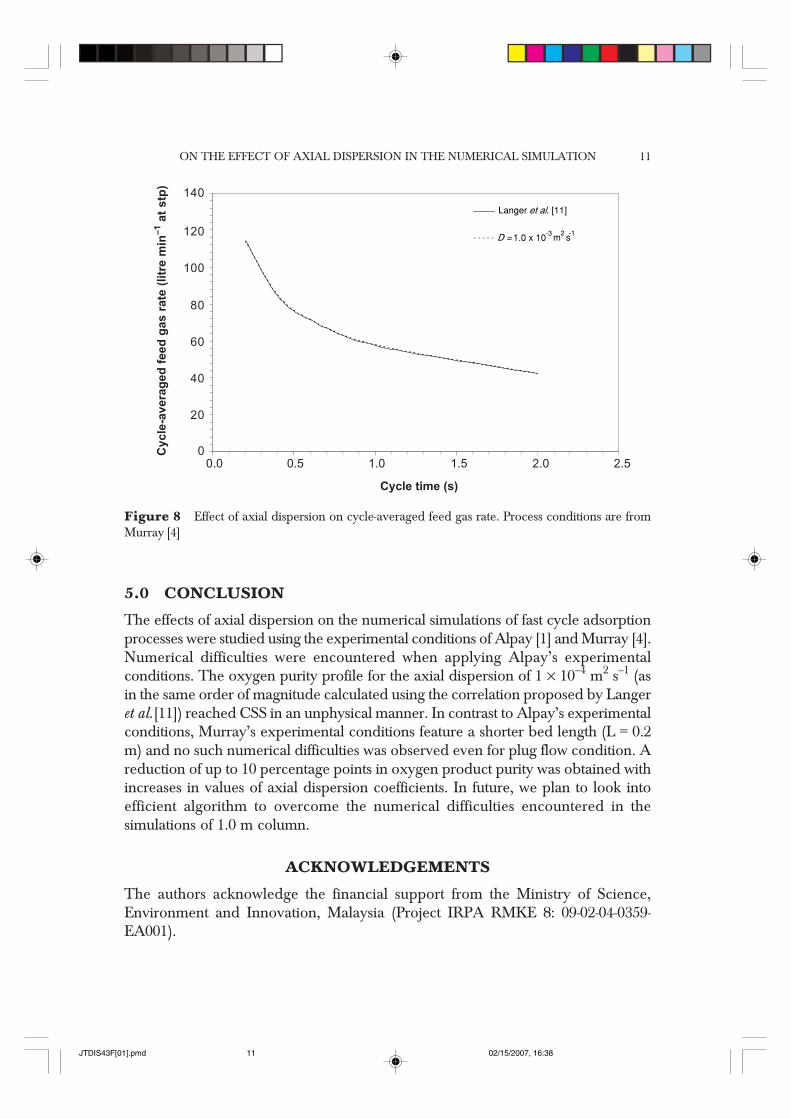
Having confirmed that there was no numerical difficulty for the simulation ofexperimental conditions of Murray [4], the effect of axial dispersion on cycle-averagedfeed gas rate and oxygen product purity were studied. The two effective axialdispersion coefficients used are: constant D =1 × 10⁻³ m2 s–1 and D obtained fromthe Langer correlation. Figures 7 and 8 show the effect of axial dispersion on oxygenproduct purity and cycle-averaged feed gas rate, respectively. It is observed thatincreasing the value of effective axial dispersion coefficient reduces the oxygen productpurity. The oxygen product purity was reduced by an average of 8 percentagepoints. There was a maximum reduction of 10 percentage points in oxygen productpurity when D =1 × 10⁻³ m2 s–1 was used. However, Figure 8 shows that the effectiveaxial dispersion coefficients have no effect on the cycle-averaged feed gas rates.This is because our model does not imply axial dispersion of total material. FromFigure 7, we may conclude that the optimum cycle time for oxygen product purityis 1.0 s.
Figure 7 Effect of axial dispersion on oxygen product purity as a function of cycle time. Processconditions are from Murray [4]
D=1.0d10-3 m^2/sD = 1.0 x 10⁻³ m2 s-1
Langer et al. [11]
Oxyg
en
pro
du
ct
pu
rity
(%
)
Cycle time (s)
70
0.0
60
50
40
30
20
10
00.5 1.0 1.5 2.0 2.5
JTDIS43F[01].pmd 02/15/2007, 16:3810
ON THE EFFECT OF AXIAL DISPERSION IN THE NUMERICAL SIMULATION 11
5.0 CONCLUSION
The effects of axial dispersion on the numerical simulations of fast cycle adsorptionprocesses were studied using the experimental conditions of Alpay [1] and Murray [4].Numerical difficulties were encountered when applying Alpay’s experimentalconditions. The oxygen purity profile for the axial dispersion of 1 × 10⁻⁴ m2 s–1 (asin the same order of magnitude calculated using the correlation proposed by Langeret al.[11]) reached CSS in an unphysical manner. In contrast to Alpay’s experimentalconditions, Murray’s experimental conditions feature a shorter bed length (L = 0.2m) and no such numerical difficulties was observed even for plug flow condition. Areduction of up to 10 percentage points in oxygen product purity was obtained withincreases in values of axial dispersion coefficients. In future, we plan to look intoefficient algorithm to overcome the numerical difficulties encountered in thesimulations of 1.0 m column.
ACKNOWLEDGEMENTS
The authors acknowledge the financial support from the Ministry of Science,Environment and Innovation, Malaysia (Project IRPA RMKE 8: 09-02-04-0359-EA001).
Figure 8 Effect of axial dispersion on cycle-averaged feed gas rate. Process conditions are fromMurray [4]
D=1.0d10-3 m^2/sD = 1.0 x 10⁻³ m2 s-1
Langer et al. [11]
Cycle
-avera
ged
feed
gas r
ate
(litr
e m
in–1 a
t stp
)
Cycle time (s)
140
0.0
120
100
80
60
40
20
00.5 1.0 1.5 2.0 2.5
JTDIS43F[01].pmd 02/15/2007, 16:3811

C. Y. SOO, Y. L. LAI, T. G. CHUAH, S. MUSTAPHA & T. S. Y. CHOONG12
NOTATION
dp particle diameter mD effective axial dispersion coefficient m2 s–1
De* modified effective diffusion coefficient m2 s–1
Dm molecular diffusion coefficient m2 s–1
i an indexL length of bed mP total bed pressure PaPe∞ limiting value of the Peclet numberq* equilibrium adsorbed phase concentration mol kg–1
q– adsorbed phase concentration averaged overan entire particle volume mol kg–1
rp radius of an adsorbent particle mRg ideal gas constant J mol–1 K–1
u superficial gas velocity m s–1
t time stc cycle time sT temperature K or °Cy gas phase mole fractionz axial co-ordinate m
Greek Lettersα a coefficient in the Ergun equationβax radial dispersion factorεb bed porosityρb bed bulk density kg m–3
ρg gas density kg m–3
τax axial tortuosity factor
SubscriptsA, B component A (oxygen) or component B (nitrogen)i component i
AbbreviationsADPF axially dispersed plug flow
JTDIS43F[01].pmd 02/15/2007, 16:3812

ON THE EFFECT OF AXIAL DISPERSION IN THE NUMERICAL SIMULATION 13
CSS cyclic steady stateLDF linear driving forceOC orthogonal collocationODE ordinary differential equationPDE partial differential equationRPSA rapid pressure swing adsorptionTOL tolerance used in the ODE solverURPSA ultra rapid pressure swing adsorption
REFERENCES[1] Alpay, E. 1992. Rapid Pressure Swing Adsorption Processes. Ph.D. Thesis. University of Cambridge.[2] Turnock, P. H., and R. H. Kadlec. 1971. Separation of Nitrogen and Methane via Periodic Adsorption.
A.I.Ch.E. J. 17: 335-342.[3] Ruthven, D. M., S. Farooq, and K. S. Knaebel. 1994. Pressure Swing Adsorption. New York: VCH Publishers.[4] Murray, J. W. 1996. Air Separation by Rapid Pressure Swing Adsorption. Ph.D. Thesis, University of
Cambridge.[5] Choong, T. S. Y., D. M. Scott, and W. R. Paterson. 1998. Axial Dispersion in Rich, Binary Gas Mixtures:
Model Form and Boundary Conditions. Chemical Engineering Science. 53: 4147-4149.[6] Keefer, B. G., and C. R. McLean. 2000. High Frequency Rotary Pressure Swing Adsorption Apparatus. US
Patent 6,056,804.[7] Kulish, S., and R. P. Swank. 1998. Rapid Cycle Pressure Swing Adsorption Oxygen Concentration Method
and Apparatus. US Patent 5,827,358.[8] Alpay, E., C. N. Kenney, and D. M. Scott. 1993. Simulation of Rapid Pressure Swing Adsorption and
Reaction Processes. Chem. Engng Sci. 48: 3173-3186.[9] Choong, T. S. Y. 2000. Algorithm Synthesis for Modelling Cyclic Processes: Rapid Pressure Swing Adsorption.
Ph.D. Dissertation. University of Cambridge.[10] Macdonald, I. E., M. S. El-Sayed, K. Mow, and F. A. L. Dullien. 1979. Flow Through Porous Media - the
Ergun Equation Revisited. Ind. Engng. Chem. Fundam. 18: 199-207.[11] Langer, G., A. Roethe, K. P. Roethe, and D. Gelbin. 1978. Heat and Mass Transfer in Packed Beds - III.
Axial Mass Dispersion. Int. J. Heat Mass Transfer. 21: 751-759.[12] Rice, R. G., and D. D. Do. 1995. Applied Mathematics and Modelling for Chemical Engineers. U.S.A.: John
Wiley & Sons.[13] Villadsen, J. V., and M. L. Michelson. 1978. Solution of Differential Equations by Polynomial Approximation.
New Jersey: Prentice-Hill.[14] Choong, T. S. Y., D. M. Scott, and W. R. Paterson. 2002. Development of Novel Algorithm Features in
the Modelling of Cyclic Processes. Computers Chem. Engng. 26: 95-112.[15] Nilchan, S. 1997. The Optimisation of Periodic Adsorption Processes. Ph.D. Thesis. University of London.[16] Ko, D., and I. Moon. 2000. Optimization of Start-up Operating Condition in RPSA. Separation and Purification
Technology. 21: 17-26.
JTDIS43F[01].pmd 02/15/2007, 16:3813