old is gold
TRANSCRIPT

OLD is GOLD
Forecasting 2016 All The Australian Airports

OLD is GOLD
Forecasting 2016 All The Australian Airports By :
Mohammed Salem Awadh
Consultant

Old Is Gold Forecasting 2016 All The Australian Airports By Mohammed Salem Awad consultant the concept of this article, is to evaluate the results of previous models that I used them. One of the amazing results is the Model of
All Australian Airports, you can reach the study by the following link http://www.slideshare.net/Airport_Forecasting/the-job-almost-done-25174204
So if the Thumb is identify by 32 characters and the Eye is iden fy by 520 characters, So what are the main characters that define the Airport Forecasting Model .
The concept is sample and straight, if two , three, …..ten predicators deals with same data,, the results should be same, i.e black or white, good or bad no grey color.
This lead us to implement the right solution i.e Max/Min Signal Tracking Approach. This approach will deliver the best possible solution for analyzing data only one best solution, that give the best possible value of R at the balancing level of signal tracking, also convince us, there will be no another way if the result is poor, so we have to look for the reasons why we can’t forecast .
Today, we will do nothing except we will extend our previous model that developed in 2012, for 2013, 2014, and 2015 with same model parameter ( Displacement and Rota onal factors ) and we will calculate the errors between actual figures and model numbers, also we will calculate the correlation coefficient R. Goals and Targets:
Top managements always ask about setting goal and targets, but at what level, and what is our objectives, is it short term targets or long term targets, how we interpolate the results, is it logic to accept the results or just to implement the formula. Really all this inquires lead us to practice the term “Forecasting By Objective”
Based on what the analysis proposed there are many methods as
1- Forecasting based R square Value ( Best Value ) 2- Forecasting based On Setting Signal Tracking to Zero 3- Forecasting based On Setting Signal Tracking in accepted region ( -4 < S.T. < 4 ) 4- Forecasting based on most recent year 5- Forecasting to meet a specified target ( Trend Target ).
We will address the third method and we will compare the results and evaluate the errors

Forecasting
Accuracy Matrix:
One of the new creative methodology. It basically developed based on two main estimated mathematical parameters, Displacement and Directional factors which has a consequence impacts on R and Signal Tracking by setting boundary accuracy:
For Fair forecasting, the model should fulfill these criteria
R2 ≥ 80 and
Signal Tracking should be - 4 ≤ S. T. ≤ + 4
Then by developed Fair – Poor Forecasting Matrix , For Fair forecasting, the model should fulfill the above criteria – (Golden Rules) which already addressed in details in :
The Job Almost Done :
Since three years, an article is published, the Job Almost Done, it address forecasting all Australian airports for the period 2013 based on a three years data base (2010-2012), and the result is fairs, with high accuracy.
On the line of the same analysis, we are going to use the same model with the same mathematical parameters, that mean we are going to extend the model to another three years with 2013 i.e 2014 and 2015.
First we calculate the signal tracking of the extended period. And as shown in the figure, the analysis explore 6 six years data base , the first – three years ( 2010-2012) shows the optimum solution of the previous article, as the signal tracking in the control limits ( - 4,+4) while, for the extended period ( 2013-2015) the signal tracking shows many deviations that cross the limits, while the overall value of R- square six years period (2010-2015) is 94.5 % .

Data Base ( 2010 – 2012 )
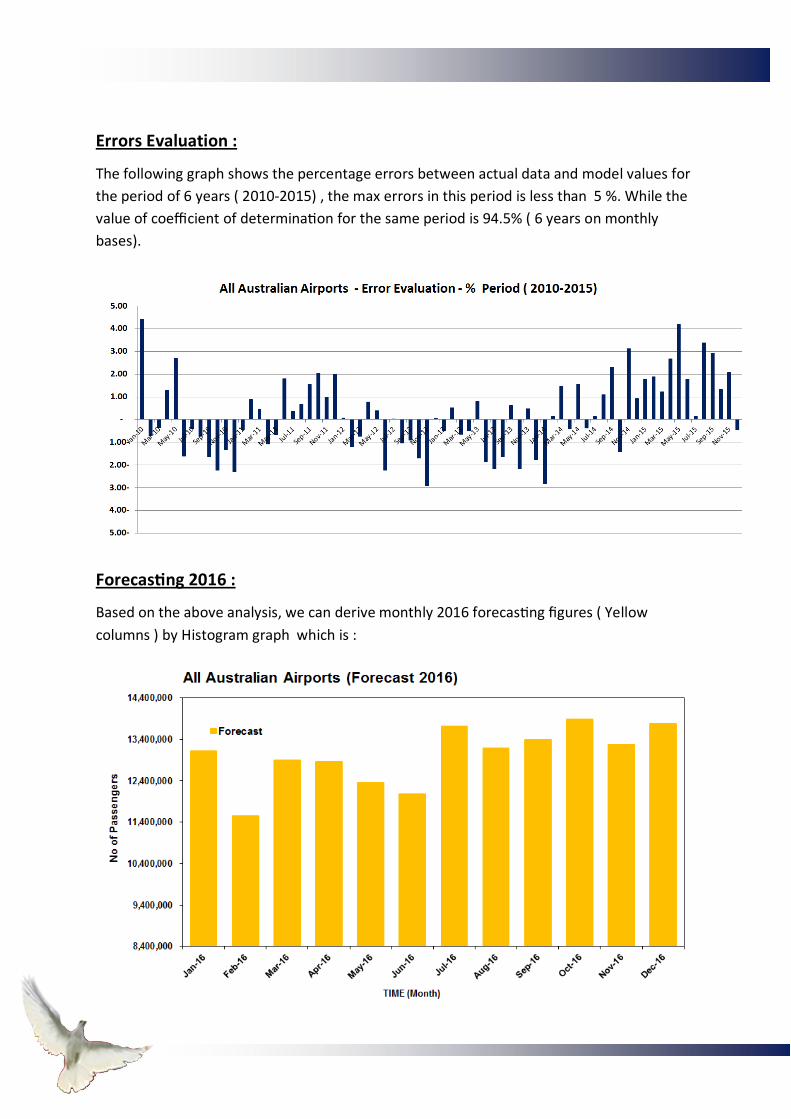
Errors Evaluation :
The following graph shows the percentage errors between actual data and model values for the period of 6 years ( 2010-2015) , the max errors in this period is less than 5 %. While the value of coefficient of determina on for the same period is 94.5% ( 6 years on monthly bases).
Forecas ng 2016 :
Based on the above analysis, we can derive monthly 2016 forecas ng figures ( Yellow columns ) by Histogram graph which is :

Summary :
In spite of the reference of old – data, the analysis still fair, there no huge deviations when we compare the actual data with the model for the period of 2010-2015, which also supported by correla on value that reach 97.2 %, while a significant figures for signal tracking shows the impact of rotational factor as a sine wave as shown in max/min signal tracking approach for period 2013-2015. Finally the forecasted figures 2016 are shown in the table.
Appendix:
Article: the job almost done
http://www.slideshare.net/Airport_Forecasting/the-job-almost-done-25174204