oklahoma state university endeavor lab wind tunnel … · figure 1: oklahoma state university wind...
TRANSCRIPT

Aerolab LLC8291 Patuxent Range RD, Suite 1200
Jessup, MD. 20794. USAPhone: +1 (340) 776-6585, Fax: +1 (301) 776-2892Email: [email protected] Website: aerolab.com
OKLAHOMA STATE UNIVERSITYENDEAVOR LAB WIND TUNNEL
FLOW QUALITY AND TEST REPORT
Prepared For:Oklahoma State University
Brad RowlandPhone: (435) 830-0075
Prepared by:Aerolab
Havya PatelPhone: (301) 776-6586
June 13, 2018
Proprietary Information:
Information contained in this document is proprietary to Aerolab LLC and shall not be disclosedor used for any purpose without the consent of Aerolab, or as specified in the Non DisclosureAgreement (NDA) / Proprietary Information Agreement (PIA) between Aerolab and the recipient.

Contents
1 Introduction 1
2 Wind Tunnel Design 1
2.1 Wind Tunnel Configuration and Identification . . . . . . . . . . . . . . . . . . . . . . . 1
3 Flow Quality Metrics 2
3.1 Flow Uniformity . . . . . . . . . . . . . . . . . . . . . . . . . . . . . . . . . . . . . . . . 2
3.2 Flow Angularity . . . . . . . . . . . . . . . . . . . . . . . . . . . . . . . . . . . . . . . . 2
3.3 Turbulence Intensity . . . . . . . . . . . . . . . . . . . . . . . . . . . . . . . . . . . . . . 2
4 Flow Quality Targets 3
5 Experimental Set-up 3
6 Instruments 5
7 Test Results 7
7.1 Turbulence . . . . . . . . . . . . . . . . . . . . . . . . . . . . . . . . . . . . . . . . . . . 7
7.2 Flow Uniformity . . . . . . . . . . . . . . . . . . . . . . . . . . . . . . . . . . . . . . . . 8
7.3 Flow Angularity . . . . . . . . . . . . . . . . . . . . . . . . . . . . . . . . . . . . . . . . 11
i

List of Figures
1 Oklahoma State University Wind Tunnel . . . . . . . . . . . . . . . . . . . . . . . . . . 1
2 Flow Angularity Test Data Matrix . . . . . . . . . . . . . . . . . . . . . . . . . . . . . . 4
3 Flow Uniformity Test Data Matrix . . . . . . . . . . . . . . . . . . . . . . . . . . . . . . 4
4 CTA Overview . . . . . . . . . . . . . . . . . . . . . . . . . . . . . . . . . . . . . . . . . . 5
5 CTA Components and Installation . . . . . . . . . . . . . . . . . . . . . . . . . . . . . . 7
6 Flow Uniformity Plots . . . . . . . . . . . . . . . . . . . . . . . . . . . . . . . . . . . . . 9
7 Flow Velocity Profiles . . . . . . . . . . . . . . . . . . . . . . . . . . . . . . . . . . . . . 9
8 Temperature Gradient along the z-axis . . . . . . . . . . . . . . . . . . . . . . . . . . . 10
9 Flow Uniformity 7 in. from center . . . . . . . . . . . . . . . . . . . . . . . . . . . . . . 10
10 Flow Angularity Plots . . . . . . . . . . . . . . . . . . . . . . . . . . . . . . . . . . . . . 13
List of Tables
1 Flow Quality Targets . . . . . . . . . . . . . . . . . . . . . . . . . . . . . . . . . . . . . . 3
2 Instruments used for Flow Quality Testing . . . . . . . . . . . . . . . . . . . . . . . . . 6
3 Turbulence Intensity Test Data . . . . . . . . . . . . . . . . . . . . . . . . . . . . . . . . 8
4 Flow Uniformity Test Data . . . . . . . . . . . . . . . . . . . . . . . . . . . . . . . . . . 8
5 Flow Uniformity 7 in. radius from center . . . . . . . . . . . . . . . . . . . . . . . . . . 10
6 Flow Angularity Test Data . . . . . . . . . . . . . . . . . . . . . . . . . . . . . . . . . . 11
ii

Figure 1: Oklahoma State University Wind Tunnel
1 Introduction
A series of flow quality tests have been executed to characterize and quantify the aerodynamicflow quality metrics of the Oklahoma State University wind tunnel. Aerolab’s original tests wereexecuted at Aerolab’s facilities between May 28, 2018 and June 11, 2018 prior to shipment of thetunnel to Oklahoma State University. This document captures the data that has been requestedby Oklahoma State University from tests conducted. The experimental setup employed a 2-axistraverse system equipped with both a pitot-static probe and a Constant Temperature Anemometer(CTA) probe. The combination of instruments allowed for the characterization of flow uniformity,flow angularity, and turbulence intensity.
2 Wind Tunnel Design
The Oklahoma State University wind tunnel is a special purpose wind tunnel designed for aca-demic purposes. The wind tunnel has been designed to balance performance, flow quality, andcost with a footprint and envelope size optimized for Oklahoma State University’s unique appli-cation and facility requirements. The wind tunnel is of the closed circuit, closed wall test sectionhorizontal return type. The test section has an 24” x 24” square cross section. Flow is providedfrom a single centrifugal fan mounted in the third diffuser. A rendering of the wind tunnel, isprovided in Figure 1
2.1 Wind Tunnel Configuration and Identification
The wind tunnel is configured with the following attributes:
• Closed Circuit – Closed Wall Test Section Horizontal Return type wind tunnel
• Test Section: 24”x24” Contraction Ratio of 6.25:1 from the primary settling chamber.
• Max Speed: 83MPH.
• Power Section: Single centrifugal fan
• 4 Diffusers
1

• 4 turbulence reducing screens and 1 honeycomb upstream of the test section
• Precision Data Acquisition and Control (DAC) System
3 Flow Quality Metrics
Wind tunnel flow quality is typically measured by 3 different metrics: flow uniformity, flow an-gularity, and turbulence intensity. These 3 metrics are universally used to characterize the flowquality of a wide variety of low-speed wind tunnel systems including closed circuit closed testsection, closed circuit open test section, open circuit closed test section, and free jet (open circuitopen test section).
3.1 Flow Uniformity
Flow uniformity is a measure of velocity variation across the working cross section of a windtunnel or free jet system where experimental data will be collected. This location is typically inthe test section of a closed test section wind tunnel or at some location downstream of the nozzleof an open test section wind tunnel or free jet system. For most applications the location of 1diameter away from the nozzle is appropriate for free jet wind tunnels. Flow uniformity is usuallycharacterized as either as a min–max value or an RMS deviation from the mean velocity in theinviscid core flow of the test section (Mathew, 2005).
3.2 Flow Angularity
Flow angularity refers to mean velocity vectors at an angle to the test section centerline. Two typesof angularity are defined. In the first type, the mean velocity vectors are parallel to each other butnot to the test section centerline: the mean velocity vector possesses a lateral and/or a verticalcomponent. If a lateral component is present, the term ‘cross- flow’ is often used. The verticalcomponent is also termed ‘up-flow’ or ‘down-flow’ depending on the direction of the flow. In thesecond type, the stream lines are not parallel to each other and are symmetrically deviating fromthe test section centerline i.e. the flow is converging or diverging. In reality, both types will besimultaneously present.
3.3 Turbulence Intensity
Turbulence intensity is equivalent to the ratio of the standard deviation of mean velocity to meanvelocity (as a percentage) where:
Umean =1
N
N∑i
Ui (1)
Urms = (1
N − 1
N∑i
(Ui − Umean)2)0.5 (2)
Tu =Urms
Umean(3)
where Umean = Mean Velocity, Urms = Standard Deviation of Velocity, Tu = Turbulence Intensity
2

4 Flow Quality Targets
Table 1 quantifies the flow quality targets that were proposed by Aerolab for OSU’s wind tunnel.
Flow Uniformity <1 %Flow Angularity (Y) ±1◦
Flow Angularity (Z) ±1◦
Turbulence Intensity <1%
Table 1: Flow Quality Targets
5 Experimental Set-up
For all three metrics, the measure of flow velocity across the relevant portion of the test section issufficient to quantify the performance and to compare it against a prescribed standard. Aerolab’sexperimental arrangement for uniformity measurements employed a 2-axis traverse system witha stepper motor actuated control. The traverse axes include the vertical (Z) axis and the lateral (Y)axis. The traverse was positioned axially such that the probe was positioned in the test sectioncenter. A test section wall panel was fabricated that included a vertical slot allowing the traverseprobe to move within the test section volume.
For the flow angularity experiment, a 5 hole probe was sweeped throughout the cross section of thetest section to obtain the revelant data, and a pitot probe was located in the aft of the test section.While conducting the test for the flow uniformity, a pitot probe was sweeped throughout the crosssection of the test section to obtain the data. In both these experiments, the data was collectedat 1 in. increments along the Y and Z axis. The data point matrix has been shown in Figures 2and 3. Both these tests were performed at both 450 RPM and 800 RPM. The experimental set-upfor turbulence measurements included placing a hot wire anemometer in the center of the testsection and varying the RPM from 100 to 900 at increments of 100.
3

Figure 2: Flow Angularity Test Data Matrix
Figure 3: Flow Uniformity Test Data Matrix
4

6 Instruments
Multiple instrument types were utilized to sample flow velocity across a given cross section of thetest chamber. The first instrument type was a pitot-static probe connected to a high accuracydifferential pressure transducer (0.01% full scale accuracy). The second instrument type wasa Constant Temperature Anemometer (CTA) system. The CTA system allows for streamwise andcrossflow velocity measurements at high sampling rates allowing for the determination of bothaverage streamwise velocity and streamwise turbulence intensity. Aerolab utilized a Dantec Dy-namics MiniCTA which was configured in a single component configuration. An overview of theCTA framework is presented in Figure 4.
Figure 4: CTA Overview
The CTA was interfaced to a National Instruments CompactDAQ system equipped with a voltageanalog to digital converter (ADC). The CompactDAQ and traverse system were controlled by anAerolab Flow Survey PC with a field version of Aerolab’s internally developed Aeroware data acqui-sition and control software. Traverse measurements utilized a Mensor CPT6100 digital differentialpressure transducer interfaced directly to the tunnel data acquisition and control system. Envi-ronmental data including barometric pressure, relative humidity, and temperature were sampledin real-time by the data acquisition and control system.
A table showing the instrument types, models, accuracies, serial numbers, and calibration datesfor the pressure measurement instruments is provided in Table 2
5

Designation Manufacturer / Model Reference Calibration DueDifferential DynamicPressure Transducer
Mensor CPT6100, 0-1 PSI,Gauge, 0.01% FS Accuracy
S/N: 4100K84 05/17/2019
Differential ModelPressure Transducer
Mensor CPT6100, 0-1 PSI,Gauge, 0.01% FS Accuracy
S/N: 41000KMI 05/17/2019
Differential Baro-metric PressureTransducer
Mensor CPT6100, 8-17 PSI,Absolute, 0.01% R Accuracy
S/N: 41000AST 05/15/2019
Pitot-Static Probe Aerolab EWTPS1 S/N: SPP001MK 06/06/2019Tunnel Relative Hu-midity and Temp
Veris HN2NMSTA22 (2%,NIST), Temp
S/N: 106185 06/07/2019
DAQ Chasis NI 9174 S/N: 01D0C9AD No calibration for this de-vice
Analog In Module NI 9237 4-Ch 20 mA Input S/N: 1D24788 04/09/2019Analog In Module NI 9207 8-Ch ±20mA ±10V S/N: 1D2FC13 04/23/2020Analog Out Module NI 9265, 4-Ch 20 mA Output S/N: 1D495B6 05/30/2019Thermocouple Input NI 9212 8-Ch S/N: 1C7ECA2 03/03/2019Power Supply Rhino 24V DC, 30W, 1Ph PSL-24-030 No calibration for this de-
vice
Table 2: Instruments used for Flow Quality Testing
Details of the CTA system are as follows:
• Manufacturer: Dantec Dynamics
• Model: MiniCTA 54T42
• S/N: 9054T0421
• Probe: 55P11
• Probe S/N: 9055PO11
• Bandwidth: 10 kHz
Tests are conducted at a range of airspeeds in the test section center and across the cross section(laterally) in 1” increments at a single airspeed. Data is collected as follows:
• Sampling Rate: 10 kHz
• Sample Duration: 5 seconds
Images showing the CTA equipment and experimental setup are provided in Figure 5
6

Figure 5: CTA Components and Installation
7 Test Results
7.1 Turbulence
The results from the factory CTA turbulence intensity test are provided below. Tests were con-ducted for a range of fan RPMs from 100 to 200.The formula is utilized for the calculation ofturbulence intensity:
Tu(%) =σ
KEAS(4)
Results show turbulence intensity levels are really low across the range of fan RPMs.The data istabulated in 3
7
RPM Mean Airspeed (MPH) Standard Deviation (MPH) Turbulence Intensity100 7.3003 0.0131 0.1793 %200 16.3983 0.0122 0.0742 %300 26.0161 0.0084 0.0321 %400 35.3388 0.0247 0.0700 %500 44.6285 0.0262 0.0587 %600 53.8349 0.0350 0.0650 %700 63.8385 0.0880 0.1378 %800 73.4636 0.0433 0.0590 %900 82.6042 0.0530 0.0641 %
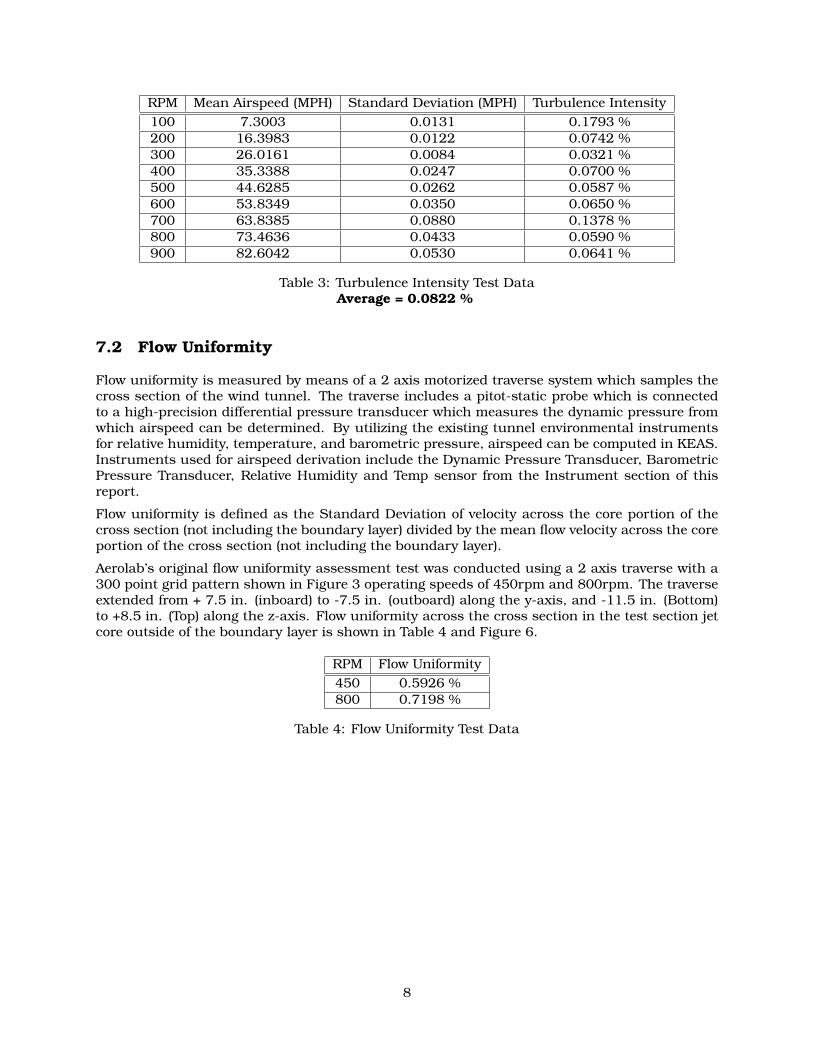
Table 3: Turbulence Intensity Test DataAverage = 0.0822 %
7.2 Flow Uniformity
Flow uniformity is measured by means of a 2 axis motorized traverse system which samples thecross section of the wind tunnel. The traverse includes a pitot-static probe which is connectedto a high-precision differential pressure transducer which measures the dynamic pressure fromwhich airspeed can be determined. By utilizing the existing tunnel environmental instrumentsfor relative humidity, temperature, and barometric pressure, airspeed can be computed in KEAS.Instruments used for airspeed derivation include the Dynamic Pressure Transducer, BarometricPressure Transducer, Relative Humidity and Temp sensor from the Instrument section of thisreport.
Flow uniformity is defined as the Standard Deviation of velocity across the core portion of thecross section (not including the boundary layer) divided by the mean flow velocity across the coreportion of the cross section (not including the boundary layer).
Aerolab’s original flow uniformity assessment test was conducted using a 2 axis traverse with a300 point grid pattern shown in Figure 3 operating speeds of 450rpm and 800rpm. The traverseextended from + 7.5 in. (inboard) to -7.5 in. (outboard) along the y-axis, and -11.5 in. (Bottom)to +8.5 in. (Top) along the z-axis. Flow uniformity across the cross section in the test section jetcore outside of the boundary layer is shown in Table 4 and Figure 6.
RPM Flow Uniformity450 0.5926 %800 0.7198 %
Table 4: Flow Uniformity Test Data
8

Figure 6: Flow Uniformity Plots
The fastest flow occured towards the top of the tunnel while the slowest flow occured at the bottomdue to the presence of the boundary layer. The velocity increased as you move up the Z axis from-11.5 to 8.5 due to the presence of a small temperature gradient. Colder air at the bottom of thetunnel is more dense and tends to move slower, while warmer and less dense air at the top of thetunnel tends to flow faster. The temperature gradients at the two operating speeds can be seenin Figure 8
Figure 7: Flow Velocity Profiles
9

Figure 8: Temperature Gradient along the z-axis
It should be noted that the temperature gradients at both speeds are <0.8◦C and flow uniformitiesof 0.5926% and 0.7198% are acceptable values for a wind tunnel of this scale.
The flow uniformities at a 7 in. radius from the center of the test section where a model will beplaced is shown in Table and Figure 5 and Figure 9
RPM Flow Uniformity450 0.2775 %800 0.0.3127 %
Table 5: Flow Uniformity 7 in. radius from center
Figure 9: Flow Uniformity 7 in. from center
10

7.3 Flow Angularity
A traverse sweep of the 5 hole probe cross section was performed at a speed of 800rpm and thedata processed to find the flow angularity. The post-processed data is displayed in Table 6 andFigure 10
V mean (ft/s) 103.8755V std (ft/s) 0.3819
V uniformity % 0.3677Alpha mean (deg) -0.9607Beta mean (deg) -0.3473Alpha std (deg) 0.2137Beta std (deg) 0.2102Ps mean (psf) 2087.2411Ps std (psf) 0.7620
Ps Uniformity (%) 0.0365Pt mean (psf) 2100.6Pt std (psf) 0.7951
Pt Uniformity (%) 0.0379Q mean (psf) 13.33Q std (psf) 0.0974
Q Uniformity (%) 0.7303
Table 6: Flow Angularity Test Data
11

12

Figure 10: Flow Angularity Plots
13