oil revenues and economic development: the case of rajasthan, india
TRANSCRIPT

Oil Revenues and Economic Development: The Case of Rajasthan, India 1
Paul Segal and Anupama Sen
WPM 43
August 2011
1 This paper draws on presentations given by the authors in Jaipur, December 2010, and on Segal (2011b).
i

The contents of this paper are the authors’ sole responsibility. They do not necessarily represent the views of the Oxford Institute for Energy
Studies or any of its members.
Copyright © 2011 Oxford Institute for Energy Studies
(Registered Charity, No. 286084)
This publication may be reproduced in part for educational or non-profit purposes
without special permission from the copyright holder, provided acknowledgment of the source is made. No use of this publication may be made for resale or for any other
commercial purpose whatsoever without prior permission in writing from the Oxford Institute for Energy Studies.
ISBN
978-1-907555-27-5
ii
iii
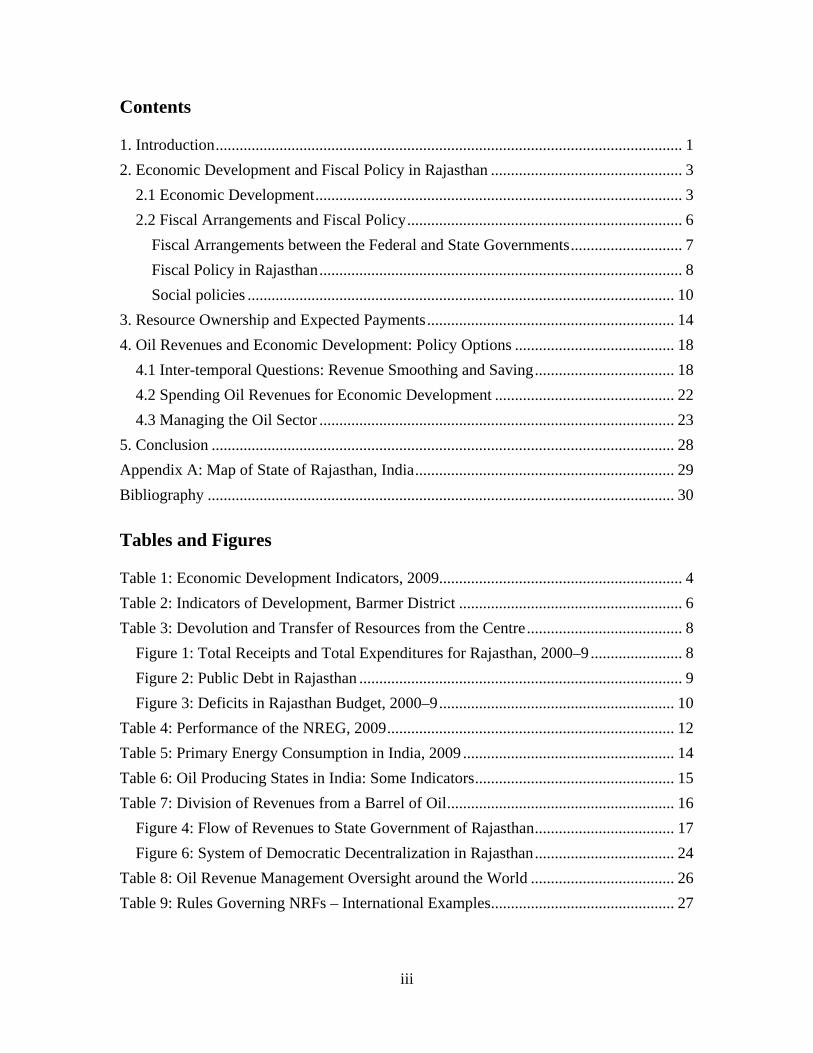
Contents 1. Introduction ..................................................................................................................... 1 2. Economic Development and Fiscal Policy in Rajasthan ................................................ 3
2.1 Economic Development ............................................................................................ 3 2.2 Fiscal Arrangements and Fiscal Policy ..................................................................... 6
Fiscal Arrangements between the Federal and State Governments ............................ 7 Fiscal Policy in Rajasthan ........................................................................................... 8 Social policies ........................................................................................................... 10
3. Resource Ownership and Expected Payments .............................................................. 14 4. Oil Revenues and Economic Development: Policy Options ........................................ 18
4.1 Inter-temporal Questions: Revenue Smoothing and Saving ................................... 18 4.2 Spending Oil Revenues for Economic Development ............................................. 22 4.3 Managing the Oil Sector ......................................................................................... 23
5. Conclusion .................................................................................................................... 28 Appendix A: Map of State of Rajasthan, India ................................................................. 29 Bibliography ..................................................................................................................... 30 Tables and Figures Table 1: Economic Development Indicators, 2009 ............................................................. 4 Table 2: Indicators of Development, Barmer District ........................................................ 6 Table 3: Devolution and Transfer of Resources from the Centre ....................................... 8
Figure 1: Total Receipts and Total Expenditures for Rajasthan, 2000–9 ....................... 8 Figure 2: Public Debt in Rajasthan ................................................................................. 9 Figure 3: Deficits in Rajasthan Budget, 2000–9 ........................................................... 10
Table 4: Performance of the NREG, 2009 ........................................................................ 12 Table 5: Primary Energy Consumption in India, 2009 ..................................................... 14 Table 6: Oil Producing States in India: Some Indicators .................................................. 15 Table 7: Division of Revenues from a Barrel of Oil ......................................................... 16
Figure 4: Flow of Revenues to State Government of Rajasthan ................................... 17 Figure 6: System of Democratic Decentralization in Rajasthan ................................... 24
Table 8: Oil Revenue Management Oversight around the World .................................... 26 Table 9: Rules Governing NRFs – International Examples .............................................. 27

1. Introduction In 2004 a large discovery of oil was made in the state of Rajasthan in north-west India.
Oil began to flow in 2009. This paper discusses options for the use and management of
oil revenues in Rajasthan, picking up the challenge from the point at which revenues start
to flow to the government. Drawing on international experience, we discuss how resource
revenues are spent in practice, and how they might better be used to benefit the citizens
who ultimately own them.
The receipt and expenditure of oil revenues are matters for fiscal policy, and we consider
them in the context of India’s federal system, where fiscal responsibility is divided
between the federal government and state governments. But the time profile of oil
revenues is distinctive compared with fiscal revenues more generally: oil revenues are
volatile, driven largely by the volatility of oil prices, and they are, generally speaking,
temporary (though in some cases their lifespan is very long). These features imply that oil
revenues may have to be smoothed over time, and that it may be optimal to save some
share of them for future consumption. We discuss how these decisions must be made in
the light of broader macroeconomic conditions and policy.
The quantities of oil that are expected to be produced, and their resulting revenues, are
significant, but unlikely to be immediately transformative to state finances. The estimated
total hydrocarbons resource base in Rajasthan as of 2010 is 6.5 billion barrels, and the
fields are estimated to have the potential to reach output levels of 240,000 barrels of oil
per day. The average flow of revenues over the life of the asset, which is estimated at 32
years, has been put at US$ 15.46 billion, or annually, roughly 1.4 per cent of the state’s
GDP. Given this modest share, potential concerns over the ‘resource curse’, or the
proposition that natural resource wealth retards economic development (see van der
Ploeg (2010) for discussion), are unlikely to apply.
Rajasthan is a relatively poor state in India: its per capita income (in 2004 prices) is
approximately US$ 461.5 (PPP$ 1,303)2, considerably below the Indian average of
2 1USD=Rs 48 except where indicated, and where historical exchange rates have been used.
1

approximately US$ 702.7 (PPP$ 1,984).3 It has a population of 68.6 million people
(Census of India, 2011), of which 15 million (22 per cent) 4 live below the national
poverty line. It is a landlocked state, with 60 per cent of its area making up the Thar
Desert, and it has only 1 per cent of India’s water resources. Correspondingly, it has a
lower level of human development (a Human Development Index, or HDI, of 0.54) than
India as a whole (0.61) (Government of India, 2009). The hydrocarbon resource base is
located in the district of Barmer, which is one of the poorest in the state. Given these low
levels of economic and human development, effectively-spent resource revenues could
have a significant impact on the welfare of Rajasthan’s citizens.
3 Directorate of Economics and Statistics, Government of Rajasthan; Purchasing Power Parity based on a conversion factor of PPP$1= Rs.17 (World Development Indicators, 2009). 4 National Sample Survey, 61st Round, 2004–5
2

2. Economic Development and Fiscal Policy in Rajasthan 2.1 Economic Development Rajasthan is geographically India’s largest state, comprising 10 per cent (300,000 sq.km.)
of its total area. It is located in the north-west of the country, bordered by Pakistan to the
west, and by the Indian states of Gujarat, Madhya Pradesh, Uttar Pradesh, Haryana, and
Punjab around its remaining borders.5 The 550 km ‘Aravalli’ hills run diagonally across
the state from the north-east to the south-west, dividing it into a western arid region and
an eastern semi-arid region. The Thar Desert covers 11 of its 33 districts and 40 per cent
of its population (HDR, 2008). Rajasthan has a relatively young population and growing
workforce; approximately 8 per cent of the population are over 60 years of age.6 Water
scarcity and drought have been major obstacles to Rajasthan’s development.
Rajasthan is an agricultural state, although the nature of the model has gradually changed.
Initially, the sowing of maize and millet, and pastoral activities, were the main sources of
livelihoods. Over time, this has shifted to the cultivation of water-intensive ‘cash’ crops
such as wheat, oilseeds, sugarcane, and rice, making the sector more vulnerable to water
scarcity and drought. The majority of its population continues to subsist on agriculture,
but this exists alongside ‘allied’ activities such as animal husbandry, as people seek to
adapt to uncertainty in livelihoods, and there is very high intrastate migration, due to the
need to seek work.
Rajasthan contributes about 3 per cent of India’s GDP. GDP growth rates have been
erratic,7 and in 2009 growth was roughly 5.0 per cent, and lower than that for India.
Rajasthan’s economy is structurally similar to India’s; agriculture comprises the smallest
share of output, although the majority of the population depend on it. The agricultural
sector is relatively stagnant, growing by only 1.1 per cent between 1996 and 2006 (HDR,
2008). During the same period, the composition of the industrial sector changed, with a 5 Appendix A contains a map of Rajasthan. 6 Based on Indian average from Census 2001; data on this from Census 2011 was not available at the time of writing. 7 See http://planningcommission.gov.in/data/datatable/index.php?data=datatab to find GDP growth rates over time.
3

decline in registered manufacturing and an increase in unregistered (informal sector)
manufacturing (HDR, 2008). Industry makes up 30 per cent of the economy, but
industrial activity is largely confined to a few districts within the state which have the
infrastructure to support it. Services (particularly tourism) comprise the largest share of
the economy, though not of employment. Gross fixed capital formation in the state is 24
per cent, which is respectable by global standards, but lower than the Indian average.
Table 1: Economic Development Indicators, 2009 Rajasthan India 2009 GDP at constant (2004) prices in US$ billion 35.1 936.22009 GDP at constant (2004) prices in PPP$ billion 99.14 2,643.4Share of Primary Sector (%) 19.9 15.7Share of Industry (%) 30.0 28.1Share of Services (%) 50.1 56.2GDP Growth Rate (%) 5.0 8.0Per Capita Income (2004 prices) in US$ 461.5 702.7Per Capita Income (2004 prices) in PPP$ 1,303.0 1,984.0Gini Coefficient for Rural Areas 0.25 0.30Gini Coefficient for Urban Areas 0.37 0.37Gross Fixed Capital Formation (percentage of GDP at current prices)
24.0 30.0
Human Development Index (2006) 0.541 0.605Population in millions of people (2011 Census) 68.6 1,210.2Population Density in people per square km (2011 Census) 201 382Population Below Poverty Line (%) 22.0 27.5Literacy Rate (%; 2011 Census) 67.1 74.0Life Expectancy 62 63.5Infant Mortality Rate (per ’000 births) 63 53Primary School Dropout Rate (2008; %) 46.6 25.6Source: Rajasthan Directorate of Economics and Statistics (2009a; 2009b); Planning Commission (2010); Government of India (2010a); Government of India (2009); Census of India (2011) Rajasthan has mineral deposits (iron ore, copper ore, limestone, gypsum, silica, and
others) over many of which it has a monopoly on production within India (HDR, 2006).
Despite this, levels of economic development have remained low.8 Per capita income is
about 60 per cent of the level of India. However, 22 per cent of the population (15 million
8 This has to do with the cost of freight within India making imports of these minerals cheaper than transporting them to other states. (HDR, 2008).
4

people) are below the poverty line, which is also lower than the Indian average.9 This
suggests that the level of inequality within Rajasthan is low, although the state as a whole
is poor. There has been a continuous decline in rural poverty since the 1970s (HDR,
2002). Some studies point to low income inequality combined with the ‘clustering’ of
households just above the poverty line (World Bank, 2006).
Relative to India as a whole, Rajasthan scores low on human development indicators such
as literacy rates and primary school dropout rates. The latter may be exacerbated by the
intrastate movement of people, in search of work. Gender inequality is high, as seen in
the sex ratio (921 females per 1000 males; (HDR, 2008)). Around 23 per cent of the
population live in urban areas (HDR, 2006), but levels of urban poverty are higher than
rural poverty (HDR, 2008). Much of Rajasthan’s struggle with attaining higher levels of
economic and human development has been attributed to its high levels of intrastate
migration, driven largely by the search for employment.
The hydrocarbons resource base is located in Barmer, a western district situated on the
border with Pakistan. Barmer is underdeveloped even by the standards of Rajasthan, as
illustrated in Table 2. Barmer is ranked 21 out of 33 districts in the state based on the
Human Development Index. Seventy-five per cent of the population depend on
agriculture and livestock; the share of agriculture has declined in recent years, with that
of livestock activity increasing, indicating an increase in nomadic occupations. There is a
relatively high workers’ participation rate, but studies have indicated that there may also
be significant underemployment (HDR, 2008). There is very little industrial activity.
9 The poverty line in Rajasthan was estimated at Rs 375 per month for rural areas and Rs 560 per month for urban areas in the National Sample Survey, 61st Round, 2004–5. Using the CPI (Industrial Workers) and CPI (Agricultural/Rural Workers) indices to update the urban and rural poverty lines, respectively, an estimate of poverty lines in 2009 is Rs 565 for rural areas and Rs 812 for urban areas. In January 2011, the Planning Commission announced that it would adopt poverty line estimates from the 2009 Tendulkar Committee Report for future rounds of poverty estimation through the National Sample Survey (NSS), as it uses an updated method for estimating poverty lines. Under this new method, the poverty line for rural areas is Rs 478, and for urban areas, Rs 568.The next NSS round will be conducted in 2011–12.
5

Table 2: Indicators of Development, Barmer District Barmer Rajasthan GDP (US$ billion) 0.54* 35.1 Agriculture (%) 32 19 Industry (%) 24 30 Services (%) 43 50 2009 Per Capita Income (US$) 250* 461.5 Area (sq. Km) 28,387 300,000 Population (Millions) 1.96 68.6 Population Density (per sq. Km) 69 201 Sex Ratio (females per 1000 males) 892 926 Literacy Rate (%) 59 67.1 Infant Mortality Rate (%) 62 63 Primary School Dropout Rate (%) 41.2 46.5 Workers’ Participation Rate (%) 46.8 42.0 Human Development Index 0.509 0.541 * Current Prices; Note: Barmer GDP for 2004. Source: HDR (2009); HDR (2006; 2008); Census of India (2011); Government of India (2009) As Barmer is located in difficult terrain and population density is low, access to basic
infrastructure is limited. In 2009, only 23 per cent of households had access to electricity,
71 per cent to water, and 11 per cent to sanitation facilities (HDR, 2009). The district is
predominantly rural, with only 7.6 per cent of ‘urban population’. The provision of public
health infrastructure is dismal, with 916 hospital beds serving a population of 1.96
million people (HDR, 2009, 44). Adverse weather conditions, lack of infrastructure, and
presumably high levels of emigration have contributed to the underdevelopment of the
district.
2.2 Fiscal Arrangements and Fiscal Policy Fiscal arrangements between the federal and state governments are somewhat complex.
India is a federation of 28 states and seven smaller ‘union territories’. Under the federal
system, policy implementation is divided between the federal and state governments.
This division is laid out in the Indian Constitution10 through a ‘Union list’, a ‘State list’,
and a ‘Concurrent list’ of policy areas. Whilst the federal and state governments bear
exclusive responsibility for the Union and State lists, respectively, policy areas in the
10 Seventh Schedule
6

Concurrent list come under joint jurisdiction. All residual powers lie with the federal
government.
Fiscal Arrangements between the Federal and State Governments Most taxes, including taxes on income and wealth from non-agricultural sources –
corporation tax, taxes on production, and customs duty – are received by the federal
government. A number of taxes lie within the remit of states, but the most important is
tax on the sale of goods (Singh, 2006). Fiscal transfers are independent of the financial
contribution of a region (Noronha et al., 2009).
The result of this arrangement is that states have a limited capacity to finance
expenditures using their own revenues, and the majority of states’ budgetary resources
comes from four main channels of funding. The first is through transfers by the Finance
Commission, a body appointed every five years11 to make recommendations on how
federal income should be devolved to states. The Thirteenth Finance Commission has
recommended the devolution of 32 per cent of federal tax revenues to states for 2010 to
2015.12 The second channel is transfers from the Planning Commission,13 which makes
grants and loans to states in the ratio 30:7014 for their development plans. The third
channel is through transfers from federal Ministries, which award grants to their state
counterparts for specific projects (Singh, 2006, 6). The fourth channel is through loans
and guarantees from the federal government. Central loans constitute about 60 per cent of
states’ debts. The boundaries between the four channels are often blurred, and there may
be instances where federal transfers or federal loans and guarantees are reported as part of
Planning Commission transfers. Table 3 shows funds transferred from the centre to
Rajasthan during 2007–10.
11 The most recent recommendations have been from the Thirteenth Finance Commission, covering the period 2010 to 2015, whose recommendations have largely been adopted by the federal government in its 2010 Budget. 12 The Twelfth Finance Commission (2005–10) had recommended 30.5%. 13 The government agency that formulates Five Year Plans. 14 ‘Special Category States’, which include the relatively underdeveloped north-eastern states, are allocated transfers in the ratio 90:10.
7

Table 3: Devolution and Transfer of Resources from the Centre Total
Transfers (US$ bn)
Transfers to Rajasthan (US$ bn)
Transfers as share of Rajasthan State
Government Expenditure (%)
Transfers as share of Rajasthan State
GDP (%)
2007–8 64.6 3.4 37.2 10.8 2008–9 77.2 3.6 36.1 10.7 2009–10 76.4 3.5 34.9 10.0 Source: Reserve Bank of India (2010) Fiscal Policy in Rajasthan Total fiscal receipts were US$10.1 billion or 28.8 per cent of 2009 GDP, of which about
50 per cent was state tax and non-tax revenue, with the remainder coming from the
federal government. The annual average revenue that will flow to the government of
Rajasthan from hydrocarbons is estimated at US$ 483.1 million (Rs 23.2 billion), about 5
per cent of total receipts, or 11 per cent of Rajasthan’s own share of revenue receipts.
Figure 1 below shows total receipts and total expenditure for 2000–9.
Figure 1: Total Receipts and Total Expenditures for Rajasthan, 2000–9
0.00
2.00
4.00
6.00
8.00
10.00
12.00
2000
‐01
2001
‐02
2002
‐03
2003
‐04
2004
‐05
2005
‐06
2006
‐07
2007
‐08
2008
‐09
2009
‐10
US$
Billion
Total Receipts
Total Expenditure
Source: Finance Department of Rajasthan (2009; 2010; 2011); Budget Analysis Rajasthan Centre (2011); Government of Rajasthan (2010) Note: Data for 2010 are estimates, we therefore use data for 2009; figures may be subject to small variations.
8

Until recently Rajasthan has run relatively high fiscal deficits, and accumulated a higher
level of public debt than the (GDP-weighted) average across Indian states. Public sector
wage rises mandated by the federal government and increased spending on drought relief
increased the fiscal burden (World Bank, 2006).
Figure 2: Public Debt in Rajasthan
0
10
20
30
40
50
60
2000
‐01
2001
‐02
2002
‐03
2003
‐04
2004
‐05
2005
‐06
2006
‐07
2007
‐08
2008
‐09
2009
‐10
Percen
tage
of G
DP
RajasthanAll States
Source: Planning Commission (2010) Rajasthan’s fiscal position improved after it enacted the Fiscal Responsibility and Budget
Management Act (or FRBM Act) in July 2004, partly through debt write-offs, the
introduction of a value added tax in 2005, and other provisions. The state achieved a
revenue surplus by 2006, which aided the financing of investment projects. Rajasthan
reformed its pensions system, and participated in a debt-swap programme, swapping
some high cost institutional debt with domestic long-term lending agencies for cheaper
market borrowing. Public debt fell in 2006 and the target reduction in fiscal deficit to 3
per cent of GDP was also achieved. The targets for deficit reduction were relaxed in 2008
as part of a strategy of expansionary fiscal policy to ameliorate the effects of the global
financial crisis (the target fiscal deficit was raised to 4 per cent instead of 3 per cent).
9

Figure 3: Deficits in Rajasthan Budget, 2000–9
Source: Finance Department of Rajasthan (2009; 2010; 2011); Budget Analysis Rajasthan Centre (2011)
‐3.00
‐2.00
‐1.00
0.00
1.00
2.00
3.00
4.00
5.00
6.00
7.00
2000
‐01
2001
‐02
2002
‐03
2003
‐04
2004
‐05
2005
‐06
2006
‐07
2007
‐08
2008
‐09
2009
‐10
Percen
tage
of G
DP
Revenue Deficit
Budget Deficit
Fiscal Deficit
Primary Deficir
Figure 3 shows an upward trend in deficits from 2008. A parallel occurrence was an
increase in salary and pensions recommended by the Sixth Pay Commission, which
erased the revenue surplus.
Some of the main fiscal challenges for Rajasthan include sustaining growth in its own
share of tax revenues, and creating the fiscal ‘space’ for development spending without
considerably adding to public debt.
Social policies There has been much debate on the implementation of social policies in India, given the
extent of poverty and the nature of social delivery mechanisms. Although a range of
poverty alleviation programmes exists, it is widely acknowledged that these often fail to
deliver to the targeted population. For instance, a study by the Overseas Development
Institute in 2004 found that at least 20 per cent of funds disbursed through poverty
reduction programmes in India failed to reach the poor, and within some schemes,
‘leakages’ were as high as 70 per cent.
It has been argued that the replacement of poorly-targeted subsidy schemes with a direct
cash transfer to families in poverty would be a more efficient way to alleviate income
10
poverty (Kapur et al., 2008). It has also been suggested that money spent on federal
subsidies could be put to better use by local self-government institutions (or Panchayati
Raj Institutions)15 and administered through ‘public works’ programmes. There have also
been arguments in support of direct unconditional fiscal transfers to local government
bodies, which could then decide upon the choice of intervention (Kapur et al., 2008). As
with other poor states, this debate exists within Rajasthan. Anand (2010) argues that the
state has spent considerable resources on subsidies which often fail to benefit the target
population. He finds that although expenditures on the provision of basic services to the
poor, for example in electricity, transport, and irrigation, have consistently increased, few
poor people have been able to benefit from access to them.
Direct cash transfers have been used in the past, through targeted pension schemes. The
National Old Age Pension Scheme is a federal programme from 1995; under this, the
federal government allocates funds to states towards a monthly pension for the elderly
and encourages states to match this amount. In Rajasthan, the total amount per pensioner
is approximately Rs 400 per month (US$ 8.3, PPP$ 23.5). This is administered through
post offices or through a direct cash transfer, collected by the pensioner from the district
official. This programme has limited reach, as the federal government has an upper limit
on the number of pensions it can fund in each state. There is also evidence of under-
coverage and high transactions costs associated with the application process (Dutta,
2008). Rajasthan’s own pension scheme, which is run as a complement to the federal
scheme, began in 1974, and provided pensions for the elderly (over 65), disabled people,
and widows.
A federal government initiative that aims at addressing the problem of rural
unemployment across states is the National Rural Employment Guarantee (NREG)
programme. It was launched in 2005 (National Rural Employment Guarantee Act, 2005)
and is modelled on a programme originally implemented in the state of Maharashtra.
Under the NREG, state governments must provide at least 100 days of unskilled work in
a financial year, to rural households that demand it. Work must be provided within 15 15 These are part of India’s system of democratic decentralization where socioeconomic programmes are implemented through community participation. This system is discussed later on.
11

days of being demanded, or governments must pay workers an ‘unemployment
allowance’ until work is provided. Workers must be paid no less than the minimum wage,
which is Rs 100 per day. Funding for the programme is shared between the federal and
the state governments in a 75:25 ratio.16 States must also have in operation a Fund to help
administer the programme. Two important features of the NREG programme are, first,
that work has to be provided within 5 km of the worker’s residence; and second, every
eligible member of a household is entitled to register for a ‘job card’ and apply for work.
The NREG was initially implemented in 200 districts across India, of which six were
from Rajasthan (Banswara, Dungarpur, Jhalawar, Udaipur, Karauli, and Sirohi); this was
later extended to six more districts; Barmer, Chittaurgarh, Jaisalmer, Jalor, Sawai
Madhopur, and Tonk (Menon, 2008). It has now been expanded to all ‘rural’ districts in
India.
Table 4: Performance of the NREG, 2009
Households demanding employment
Households provided
employment
Women participants
(%)
Average person-days
per household
Number of households achieving
100 days’ employment
Rajasth-an
6,522,264 6,522,264 66.9 69 1,514,420
India 52,864,608 52,530, 453 48.1 54 7,083,663 Source: Ministry of Rural Development (2010) The total federal funds available for the NREG programme in 2010 were Rs 300 billion
(US$ 6 billion) of which 19 per cent (Rs 59 billion or US$ 1.2 billion) was released to
Rajasthan (Tewari, 2010). As the allocation of funds under the NREG is made based on
the demand for work under NREG in these states, this implies that the NREG may have
succeeded in generating rural employment. Work schemes under the NREG are meant to
be implemented with the close involvement of local self government institutions
(Panchayati Raj Institutions) and civil society. As both of these are particularly active in
Rajasthan, they may have contributed to the awareness of work available under the
NREG amongst the rural population, and to the increased demand for federal funding.
16 This ratio is relaxed for ‘special category’ states in the north-east.
12

Barmer was one of the 12 districts chosen for the implementation of the NREG in
Rajasthan in 2007. The number of households who demanded employment was 277,595.
The total funds for implementation stood at roughly US$ 27 million, of which the federal
government contributed US$ 23.7 million and the state government US$ 2.7 million. The
average number of employment days in a year was 63.2 in 2007. At a minimum wage of
Rs 100 a day, this amounted to about Rs 500 (approximately US$10.4) a month. As per
the 2001 Census, the number of rural households in Barmer was 284,796; the number of
job cards issued was 374,604. This indicates that more than one job card was issued to
some households. Most work carried out under the NREG Act is related to infrastructure
creation; a total of 7,218 projects have been completed since implementation (HDR,
2009).
The above policies are not directly connected to the hydrocarbon sector, but ‘local
content’ initiatives in Barmer aim to use the presence of the industry to encourage
development and to provide good quality employment. Efforts towards this have been
made through a partnership between the oil exploration companies and multilateral
funding agencies. An agreement was signed in 2007, for an initial term of three years, to
set up an ‘Enterprise Centre’ (for local development and training in vocational skills), a
‘Rural Dairy Development Project’ (to create alternative income-generating activities for
rural households), and the ‘Child and Maternal Health Initiative’ (to increase awareness
of health issues). The projects were based on similar initiatives in Azerbaijan, Chad,
Mozambique, and Peru, and were to be adapted to the local environment with the close
involvement of NGOs. Vocational training is being provided to local small and medium
sized firms, to assist them in becoming potential suppliers and service providers to the oil
and gas industry in Barmer (HDR, 2009).
13

3. Resource Ownership and Expected Payments The principle that natural resources, including oil, should benefit the people of the
country in which they are located has been codified in numerous international human
rights treaties. Both the International Covenant on Civil and Political Rights and the
International Covenant on Economic, Social, and Cultural Rights state in their Article 1
that ‘All peoples may, for their own ends, freely dispose of their natural wealth and
resources’ (Wenar 2007, 14). Nonetheless, almost all countries enlist the services of
international oil companies to do the job of extracting, transporting, and processing their
oil. In the case of Rajasthan these services are managed and performed by Cairn India, in
a joint venture with Oil and Natural Gas Corporation Limited (ONGC). Under the Indian
federal fiscal system, revenue from royalty and sales tax on onshore resources flows to
state governments, whereas offshore resources are administered entirely by the federal
government.
India’s total primary energy consumption was 469 mtoe in 2009; of this, proven reserves
of oil were 5.8 billion barrels in 2009. Natural gas reserves were 1.12 tcm. Oil production
was 754,000 barrels of oil per day in 2009, while consumption was 3.2 million barrels of
oil per day. Although oil comprises roughly 30 per cent of primary energy, India has had
to import two-thirds of its oil requirements.17
Table 5: Primary Energy Consumption in India, 2009 Fuel Type % Coal 53.5 Oil 31.3 Natural Gas 8.5 Hydro 6.0 Nuclear 0.8 Source: BP Statistical Review of World Energy, 2010 Most reserves of oil and gas have been found offshore; Table 6 below contains indicators
for oil producing states in India.
17 The oil import bill was US$ 79 billion in 2009; there are also costs associated with distribution to final consumers.
14

Table 6: Oil Producing States in India: Some Indicators
2008 GDP at constant
(1999–2000) prices US$
billion
Fiscal deficit (% of 2009 GDP)
Population (2011)
(millions)
Per Capita Income at 2004
prices (rupees)
Oil production (2009)
’000 tonnes
Andhra Pradesh
52.4 3.9 84.7 33,804.4 304
Arunachal Pradesh
0.6 22.9 1.4 26,451.2 131
Assam 11.1 16.7 31.2 20,124.2 4,740* Gujarat 44.5** 3.2 60.2 39,119.1 5,961 Nagaland na 7.5 2.0 na na Rajasthan 30.1 3.8 68.6 22,151.1 447 Tamil Nadu
47.6 3.1 72.1 35,788.7 238
India 695.7 4.0*** 1210.2 33,731 33,691 * Includes figure for Nagaland. ** Figure for 2007. *** All states. Note: Figures for per capita Income are approximations and may vary. Source: Planning Commission (2010); Ministry of Petroleum (2009). In the past, states rich in mineral deposits have failed to successfully raise their levels of
economic development. For instance, eastern and north-eastern states which contain
reserves of oil and other minerals have lower per capita incomes than the Indian average
of US$ 702 (Orissa – US$ 524, Assam – US$ 419, Arunachal Pradesh – US$ 551,
Meghalaya – US$ 557).18 This suggests that states could benefit from considering
alternative policy options for the use and management of resource revenues early on in
the process.
The oilfields in Rajasthan are governed by a production sharing contract between the
government of India, Cairn India Limited, and Oil and Natural Gas Corporation (ONGC)
Limited. 19 Royalty in this contract, which accrues to the state government, is set at 20
per cent of the well head value of crude oil.
18 Figures for Arunachal Pradesh and Meghalaya are from 2008. 19 Rajasthan’s Mangala–Bhagyam–Aishwarya fields could be said to be similar to Azerbaijan’s Azeri–Guneshli–Chirag fields, in terms of geography and time profile. The Chirag field began production in 1997, and in 1999 Azerbaijan set up an Oil Fund for savings and stabilization. We discuss policy options later in this paper.
15

Table 7 below illustrates the division of revenues between the federal and the state
government from a barrel of oil produced in Barmer.
Table 7: Division of Revenues from a Barrel of Oil – An Illustration Pricing For Brent at US$ 7520 a barrel, the selling price is US$ 63.8 per
barrel - Pricing is based on ‘Bonny Light’, a comparable low sulphur
crude. - The selling price represents an average 15% discount on Dated
Brent.
Revenues to State Government
Total revenues to State per barrel: US$ 11.1 - Royalty for pre-NELP blocks at 20% of wellhead value on a
cumulative basis: approximately US$ 9.8 per barrel - Central Sales tax21 at 2% of Selling Price: US$ 1.3 per barrel
Revenues to Federal Government
Total to Centre: US$ 3 + Profit Sharing + Corporation Tax22 - ‘Cess’ of Rs 978.5 or US$ 3 per barrel - Profit sharing in the range of 20–50%, which amounts to 40–
45% of ‘profit petroleum’ generated over the life of the asset - Corporation Tax on profits of 19.99% for the first 7 years and
33.33% thereafter.
Source: Compiled by authors based on company estimates The estimated resource base in Barmer is around 6.5 billion barrels, with the current
approved level of peak production set at 175,000 barrels of oil per day. However, peak
production may have the potential to reach 240,000 barrels of oil per day. Figure 4
depicts the flow of revenues over the life of the asset (currently estimated at 32 years),
based on a real oil price of US$ 75 per barrel.
20 Assumed. 21 A tax on interstate sales, fixed by the federal government, but revenue from which goes to the state 22 Data on profits was unavailable.
16

Figure 4: Flow of Revenues to State Government of Rajasthan
Source: Compiled by authors based on company data and analyst reports23
0
200
400
600
800
1,000
1,200
09-1010-1111-1212-1313-1414-1515-1616-1717-1818-1919-2020-2121-2222-2323-2424-2525-2626-2727-2828-2929-3030-3131-3232-3333-3434-3535-3636-3737-3838-3939-4040-41
US$
Mill
ions
Royalty payable to Raj Govt
Sales tax payable to Raj Govt
The years of peak production are estimated to be 2016–18. However, experiences in other
parts of the world have shown that the production profile may change as exploration
continues. The total revenues to the state government over the life of the asset are
estimated to be US$ 15.46 billion (which is an undiscounted value); of this, US$ 13.68
billion will be from royalty and US$ 1.78 billion from sales tax. The simple yearly
average of revenues from royalty is US$ 427.6 million, and from sales tax is US$ 55.5
million, calculated at 2010 prices.24 The total average annual revenue flow to the state
government based on this is US$ 483.1 million. This comprises 1.4 per cent of
Rajasthan’s 2009 GDP of US$ 35 billion. This would also vary depending on the level of
production in each year, and would reach US$ 1,082 million in the peak year, as shown
in Figure 4 above.
23 Based on an exchange rate of 1 US$=Rs 45, a real oil price of US$ 75 at 2010 prices, and an escalation of 3% per annum. 24 Discounted estimates were unavailable; this is a limitation to the analysis.
17

4. Oil Revenues and Economic Development: Policy Options In this section we discuss how Rajasthan can best use its new oil industry and the
revenues it produces, to encourage economic development. We first consider the inter-
temporal management of oil revenues, and then turn to options for spending oil revenues,
and managing the oil sector.
4.1 Inter-temporal Questions: Revenue Smoothing and Saving25 Here we consider the choice of when to spend oil revenues, how to stabilize expenditures,
and whether, and how, to save revenues for the future. Resource revenues that flow to the
government are a component of fiscal revenues more generally, and should be considered
in the light of overall fiscal policy. Indeed, in most countries the government simply
absorbs resource revenues into the general budget, making no extra effort to manage
them. But there are two features of the time path of resource revenues that demand
particular attention: first, they tend to be highly volatile, reflecting the volatility of
commodity prices. Second, they are in principle exhaustible and in many cases will be
expected to run out in the foreseeable future. Volatility calls for short-run expenditure
smoothing; exhaustibility may call for long-run saving (which is formally just longer-
term smoothing). Both, however, need to be considered in the context of wider inter-
temporal macroeconomic policy.
Oil revenues are highly volatile for the simple reason that oil prices are highly volatile.
The smooth flow of income portrayed in Figure 4 [Flow of Revenues to State
Government of Rajasthan] is an expected average, but in fact revenues are likely to vary
substantially from year to year. This volatility must be carefully managed: the temptation
is to spend all the revenues that are available at any given time, which can lead to
economic and political problems (see Segal 2011b for discussion). Sudden increases in
expenditure can lead to bottlenecks and inflation in constrained sectors of the economy;
sudden declines in expenditure can lead to unemployment and idle capital, and political
25 This section draws on Segal (2011b).
18

difficulties as groups that have become used to benefiting from the expenditures suddenly
find themselves poorer.
There are two standard approaches to the intertemporal management of resource
revenues. The ‘permanent income’ (PI) approach argues that the permanent or annuity
value of estimated total lifetime revenues should be spent each year, saving or borrowing
the difference between this quantity and actual revenues. Thus if total oil wealth is
estimated to be US$100bn, and the average real return on investment is estimated at 4 per
cent, then US$4bn would be spent each year, from the moment the oil is discovered.26 A
still more conservative approach than this is the ‘bird-in-hand’ (BIH) rule, which states
that all revenues should go into a fund, and that current consumption should come only
from the real return to that fund. Hence under BIH one spends the real return to already-
extracted resources, while under PI one spends the expected real return on the value of
the entire resource stock. Once the resource is exhausted BIH collapses to the PI rule, but
expenditures start off lower than under PI, rise as long as oil is being produced, and end
up higher.
The difficulty with the PI approach is that it requires an estimate of the long-run value of
revenues, which in turn requires estimating the long-run commodity price. This is
impossible to do with certainty. Chile’s Fund for Social and Economic Stabilization is
financed primarily with copper revenues, where a panel of experts estimate the long-run
price and revenue. The more conservative BIH rule underlies Norway’s fiscal rule for oil
revenues, under which all of the net cash flow from the extraction of petroleum is saved
in the Government Pension Fund – Global in order to finance pensions in the future. The
fiscal rule states that for current expenditures, only ‘the expected return on the fund can
be used. The expected real rate of return on the fund is estimated at 4 per cent. This
means that the fiscal budget can be settled with a deficit corresponding to this rate of
return.’ (Statistics Norway, 2007) In practice, however, this rule has been breached in
most years (Jafarov and Leigh, 2007).
26 Typically this requires borrowing in the early stages of resource extraction if revenues start off lower than this estimated long-run real return.
19
Both the PI and BIH strategies imply smoothing expenditures relative to volatile
revenues, and saving some share of revenues for future spending. There is no doubt that it
is optimal to smooth expenditures relative to revenues, although expenditures in the
aggregate should take account of macroeconomic concerns and, broadly speaking, should
be counter-cyclical. The more challenging intertemporal questions for Rajasthan are how
much to spend as opposed to save, and how to invest the portion of revenues to be saved.
It sounds prudent to save or invest the capital due to resource revenues for the future,
while spending only the sustainable permanent return on that capital in each period. The
argument that an exhaustible resource should not be consumed but should be transformed
into an income-yielding asset is intuitively very appealing. But the judgement of how
much to save has to be made in the light of expectations of future levels of income and
the stock of capital more generally. In particular, it may not be optimal to defer
consumption in a country that expects per capita economic growth. If it is optimal to
smooth consumption over time, including across generations, then the fact that people
will be richer in the future implies that people today should be consuming more of the
finite resource revenues than people in the future. Moreover, while at first sight it may
seem unfair for current generations to consume the value of finite natural assets, they will
in fact leave most of their physical assets to future generations in any case, in the form of
the capital stock.
This argument becomes even stronger for countries like India, and Rajasthan state in
particular, where there are significant numbers of people in extreme poverty. If we expect
that growth will in any case lift people out of poverty in the future, then spending
resource revenues on poverty reduction in the short term is likely to be optimal. Put
simply: reducing extreme poverty may be the best use of any extra oil revenues; since
there will be less poverty in the future, it is optimal to make such expenditures in the
present.
This argument must be balanced, however, with the possibility that investment of
revenues may increase the incomes of the poor in the future, and that this may have a
greater impact on poverty than spending on the current consumption of the poor. Thus
20

one must also consider the expected return to investment in terms of increasing the
incomes of the poor.
This brings us to the question of how to save revenues if they are to be saved for the
medium or long term. Standard economic advice, typically given by the IMF, favours the
use of sovereign wealth funds (SWFs) such as those used by Norway and Chile, which
invest abroad in a variety of financial instruments. The advantage of investing abroad is
that the returns to a SWF are supposed to be uncorrelated with most shocks that hit the
country. So while a decline in copper prices will reduce Chile’s copper revenues, it
should not adversely affect the real return accruing to its fund. However, it has recently
been argued (for example by Collier et al., (2009) and van der Ploeg and Venables
(2010)) that many developing countries can achieve higher social returns by investing
domestically in infrastructure, public goods, education, and other public services than by
investing abroad. This is all the more likely because the positive spillovers of such
investments can imply that their total return to the country is higher than just the direct
financial return. Moreover, many countries under-invest in these areas because of credit
constraints, and resource revenues loosen this constraint.
What do these considerations imply for Rajasthan? Given the relatively low level of
economic development in the state, discussed in Section 2 above, three main implications
may be drawn. First, Rajasthan has large numbers of people on very low incomes, many
of them in extreme poverty, and these people have urgent needs in the present. Second,
India is growing rapidly, at an average of 8 per cent per annum, and therefore future
generations are likely to be economically better off than current generations. Third,
Rajasthan’s hydrocarbons reserves are likely to provide revenues for at least 30 years, in
which time further discoveries may be made.
Given these observations, saving revenues for the future in a separate fund, similar to a
Sovereign Wealth Fund is unlikely to be the optimal strategy for Rajasthan. First,
expenditures on poverty reduction, discussed in the next section, are likely to have very
high social returns. Second, if revenues are to be saved, a capital-scarce economy like
that of Rajasthan is likely to enjoy a much higher social return from domestic investment
21

than it would from investing in international financial markets. Levels of domestic
investment may be below optimum due to credit constraints, which resource revenues
could help overcome. Finally, smoothing of revenues is also a sensible strategy, either
through a stabilization fund, or through government asset management.
4.2 Spending Oil Revenues for Economic Development If Rajasthan chooses to spend its new oil revenues domestically rather than save in
international financial markets, how might it best put them to use? The most common
fate of natural resource revenues is simply to contribute to general government revenue,
and thence to finance general government expenditures. At the same time, some share of
these revenues is typically substituted for existing taxes. Bornhorst et al. (2009) find that
on average countries tend to reduce the collection of non-resource revenues (both taxes
and other sources of income) by 0.2 percentage points of GDP for every 1 percentage
point of GDP they receive in resource revenues.
The first and simplest option is therefore just to allow them to accrue in the state
government’s general budget, following existing expenditure or tax priorities. In this case
the benefits of government expenditures accrue, naturally, to the recipients of the goods
or services purchased. The benefits of lower taxes accrue to individuals according to how
their own tax burden declines. Eliminating taxation altogether, for instance, is not a
distribution-neutral policy if the taxes being eliminated are not distribution-neutral.
Where taxes are or would be relatively progressive, a proportionally-uniform tax
reduction is regressive, and vice versa.
A second option is to hypothecate resource revenues for development spending. As
discussed earlier, the rate of gross fixed capital formation in Rajasthan is 24 per cent,
below the average for India. Resource revenues could be used with the specific aim of
raising investment levels to the Indian average.
A third option for expenditure would be to use resource revenues for social spending and
poverty reduction. Given the success of the NREG programme at both reducing poverty
22

and building local infrastructure, supplementing the NREG in Rajasthan could be a
highly productive use of oil revenues. Revenues of US$ 483.1 million a year could
potentially be used to fund 36 days of extra employment for each participating household
in the state. An alternative use for resource revenues in poverty reduction could be to
complement the NREG programme by using it to fund a universal old age pension.
Bolivia’s successful Renta Dignidad programme uses hydrocarbon revenues to this end.
Rajasthan’s existing pensions scheme (funded partly by federal government and partly by
the state) is Rs 400 a month. Oil revenues could fund a further universal pension payment
of Rs 355 a month,27 bringing the total to Rs 755. This would be above the rural poverty
line of Rs 565 and 93 per cent of the urban poverty line of Rs 812. Old age poverty would
therefore be eliminated.
4.3 Managing the Oil Sector The efficient and effective management of oil revenues depends greatly on political and
administrative institutions. Like any government revenues, their effective use requires
that citizens have a say in their expenditure. Transparency in the receipt and expenditure
of resource revenues, and accountability of those in power, are important in achieving
this. It is important for local communities, NGOs, and other affected parties to have input
into decision making over the development of the industry itself, as well as over
expenditures of revenues. This helps to ensure political buy-in and reduces the chance of
conflict later. Moreover, disputes can become more acute when the financial stakes are
raised by the discovery of natural resources. For this reason stable political structures that
provide a peaceful setting for the resolution of disagreements are essential to avoid the
escalation of conflict.
Good management of the oil sector requires that all major stakeholders are included in
decision making. Rajasthan, fortunately, has a stable and democratic political structure
that should be robust to new oil revenues. Rajasthan comprises geographically distinct
regions, with a dispersed, ethnically diverse, and primarily rural population (World Bank,
27 Based on 2011 population estimate of 68 million and assuming 8% of the population are aged over 60, which is the Indian average from the 2001 Census (2011 estimates unavailable).
23

2006). As anywhere, it is difficult to summarize the role of the myriad socioeconomic
groups that exist, and their influence in shaping local politics. Here we consider the role
of local institutions in the context of their relevance to the use of resource revenues.
While there have been political disputes of the type experienced in any democracy,28 in
general no serious conflicts exist in Rajasthan, and the state has a long tradition of
community and NGO activism.
The most important institution of local governance in Indian states is the Panchayati Raj
Institutions (PRIs),29 or system of ‘democratic decentralization’, which administers
development programmes with community participation. The PRI is a three-tier system
of local self government, comprising publicly elected committees at the district level
(zilla parishad), block level (panchayat samiti), and village level (gram panchayat).
Figure 6: System of Democratic Decentralization in Rajasthan
State Finance Commission Financial Devolution
73rd Constitutional Amendment Functional Devolution
Wards Number: 104,937
Territorial constituencies Number: 5,273
3. Village Level (Gram Panchayat) Number: 9,166
2. Block Level (Panchayat Samiti): Number: 248
1. District Level (Zilla Parishad) Number: 33
Source: Compiled by Authors PRIs have been galvanized in the implementation of poverty alleviation programmes
including the NREG programme, through the requirement that at least 50 per cent of
work projects under the NREG must be implemented by gram panchayats, or at the
28 For example, the 2008 protest by the Gujjars, a pastoral community in Rajasthan, over their exclusion from the list of Scheduled Tribes, or communities that are granted special welfare status by the government on account of their social and economically disadvantaged positions. 29 Panchayat translates to ‘assembly of five’.
24
village level. The First State Finance Commission (1995–2000) recommended the
devolution of 2 per cent of the state’s net tax proceeds to the PRIs and ‘urban local
bodies’. This was increased to 3.5 per cent, a further 0.5 per cent as an ‘incentive’
amount,30 and 1 per cent of royalties from minerals, by the Third State Finance
Commission (2005–10). The total amount devolved equates to US$ 465 million, of which
US$349 million is for PRIs, released over five years (or US$70 million a year).
The NREG Act also mandates the conduct of regular ‘social audits’ by village
communities, using the PRIs, to allow citizens the right to control and monitor
expenditures by their local government on public projects.
Rajasthan has been among the more progressive states in efforts to improve governance.
The Right to Information Act (or RTI Act) was implemented in 2001, and has
transformed the way citizens and communities engage with government policy. The
federal government passed national legislation (Right to Information Act) in 2005 which
strengthened the scope of the original state legislation – it provides all citizens access to
information relating to the affairs of the state and public bodies through the provision of
certified copies of documents, the inspection of public works, or the taking of sample
materials from public works. Each government department is required to designate an
officer for dealing with public enquiries under the RTI Act, and the failure to comply can
attract disciplinary action. This has injected a great deal of transparency into the system
of governance. The government of Rajasthan also publishes Citizens’ Charters for its
major departments, informing citizens of their rights or entitlements with respect to each
department.
Given this institutional environment, Rajasthan may reasonably conclude that new
institutions to monitor oil revenues specifically may be unnecessary. Oil revenues and
their expenditure should fall under the existing transparency laws, and expenditures
should moreover be subject to scrutiny by the PRIs. The state government may, however,
consider an independent group to monitor oil in particular. Table 8 summarizes details of
supervisory bodies in a number of resource-rich countries, which typically comprise a
30 This is released only if PRIs achieve certain targets.
25

committee of about 10 members with the specific mandate to monitor collection and use
of resource revenues. Such bodies may be particularly useful to ensure the separation of
purely economic management from political priorities, as has been achieved in the
electricity sector in India. For instance, while the beneficiaries of expenditures are a
matter for political decision making, it may be wise to separate the economic imperative
of expenditure smoothing, discussed above, from the political process. Table 9
summarizes constraints that governments have placed on themselves to encourage good
decision making. Such self-imposed constraints can never be binding – as mentioned
above, even Norway, often held up as a paragon of responsible resource management, has
never quite stayed within its own fiscal rule – but they may help to guide policy makers
and provide support for civil society in holding governments to account.
Table 8: Oil Revenue Management Oversight around the World Country Oversight Body Membership Mandate Azerbaijan Supervisory Board 9 members, appointed by
President; should represent government & civil society
Review & comment on draft annual budget, annual report, and financials, audits
Chad Committee for the Control & Supervision of Oil Resources
9 members, multiple constituencies. 4 members from civil society
Ensure compliance with financial law; authorize and control withdrawals, and oversee use of funds
Kuwait Board of Directors of Kuwait Investment Authority
8 members, multiple constituencies. 5 members from private sector
Oversee and direct the activities of the state oil company
Sao Tome & Principe
Petroleum Oversight Commission
11 members, multiple constituencies. 3 members from civil society
Permanent oversight of all payment, management, and use of oil revenues and oil resources
East Timor Petroleum Fund Consultative Council
Multiple members. Includes former government appointees and civil society
Advise on matters relating to the performance and operation of the Petroleum Fund
Source: Bell and Faria in Humphreys et al. (eds) (2007, 303).
26

Table 9: Rules Governing NRFs – International Examples Inflows Quantitative Constraints Qualitative Constraints Norway All oil
revenues enter the Fund
Parliament unconstrained; politicians committed to informal ‘handling rule’ not to spend > 4% of the balance of the Fund per annum
Outflows cover the balance of government budget, decided by Parliament
East Timor
All oil revenues enter the Fund
Parliament unconstrained, but stays within highest amount that can be sustained in perpetuity (the permanent income from oil wealth). Formula given by law.
Outflows cover balance of government budget, decided by Parliament
Sao Tome & Principe
All oil revenues enter the Fund
Outflows cannot legally exceed highest amount that can be sustained in perpetuity (except in transition period before regular oil production starts). Formula specified in law.
Outflows enter government budget directly. But must be used for development
Alaska Fixed proportion of oil revenues enters the Fund
Formula governs amount of money that can be paid out. Rules enshrined in state law and Constitution.
Outflows only transferred to citizens through permanent fund dividends. Rules in state law & Constitution
Less discretion
More discretion
Source: Humphreys and Sandbu in Humphreys et al. (eds) (2007, 216).
27

28
5. Conclusion Rajasthan’s oil revenues represent a significant new source of income for the state’s
government, though their magnitude – averaging about 1.4 per cent of GDP – is not large
enough to be immediately transformative. Rajasthan is, however, a poor state within
India, with substantial development needs, and these revenues may help to support
existing policies. Priorities for the state include investment to raise productivity and
improve employment, as well as poverty alleviation, and other direct social policies. The
state could target oil revenues to poverty reduction by using them to extend the National
Rural Employment Guarantee, or to provide a universal pension that would eliminate old-
age poverty. We argued that smoothing fiscal expenditures, including oil revenues, is
likely to be wise, but saving oil revenues abroad using international financial markets is
likely to be less beneficial than the social policies mentioned, or investing domestically.
The oil sector requires careful management to ensure that the population that ultimately
owns the oil benefits from it, and Rajasthan has a strong set of democratic institutions,
which devolve all the way to the village level, with which to monitor oil revenues and
their expenditure. A new committee with the mandate to oversee the deployment of
revenues may also be advisable, however, given the complexities of the sector. Oil is
unlikely to transform Rajasthan, but with careful management it may make a significant
contribution to its development.
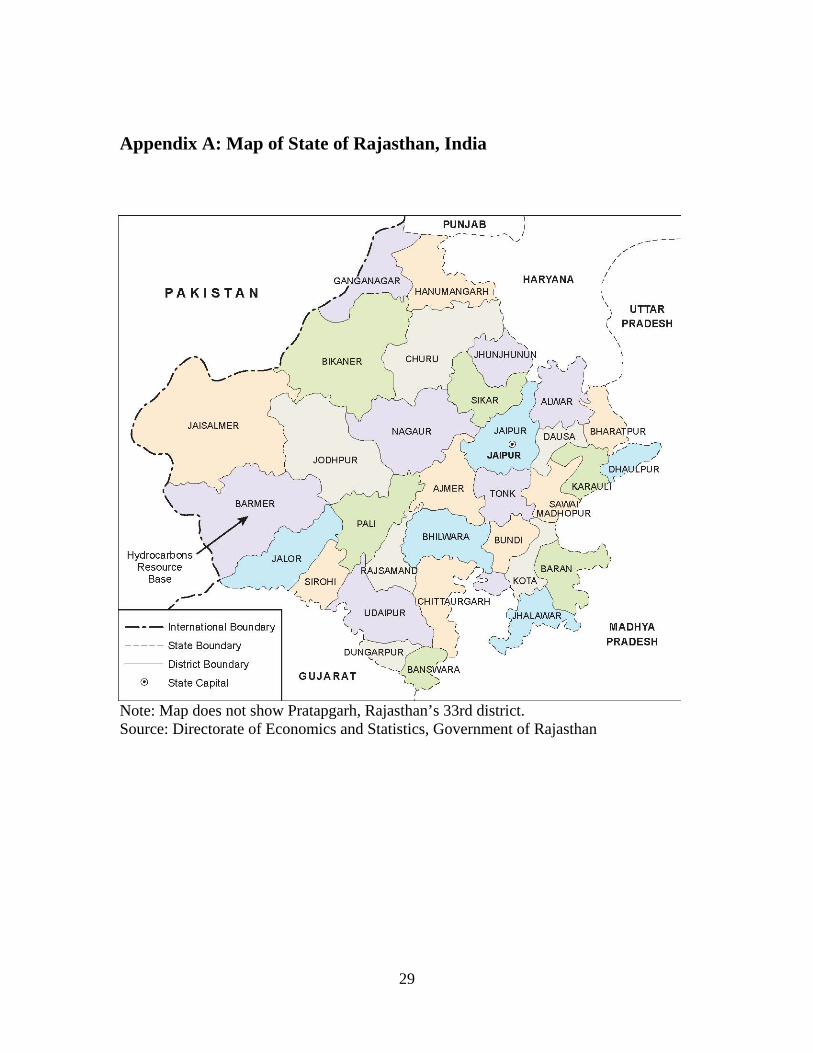
Appendix A: Map of State of Rajasthan, India
Note: Map does not show Pratapgarh, Rajasthan’s 33rd district. Source: Directorate of Economics and Statistics, Government of Rajasthan
29
Bibliography Afridi, F. (2008). ‘Can Community Monitoring Improve the Accountability of Public Officials?’ Economic and Political Weekly, October 18, 2008. Anand, M. (2010).Budgetary Implications of Costs of and Recovery from Select Public Services in Rajasthan, Economic and Political Weekly, Vol. XLV, No. 33, pp. 68-77. Baig, Taimur, Amine Mati, David Coady, and Joseph Ntamatungiro (2007). ‘Domestic Petroleum Product Prices and Subsidies: Recent Developments and Reform Strategies’, IMF Working Paper WP/07/71. Bolivian Ministry of Autonomy (Ministerio de Autonomía Estado Plurinacional de Bolivia) (2008). ‘Qué es la Renta Dignidad?’, 1 January 2008, downloaded 4 October 2010, [www.autonomia.gob.bo/portal2/index.php?option=com_content&task=view&id=393&Itemid=35http://www.autonomia.gob.bo/portal2/index.php?option=com_content&task=view&id=393&Itemid=35]. Bornhorst, Fabian, Sanjeev Gupta and John Thornton (2009) “Natural Resource Endowments, Governance, and the Domestic Revenue Effort: Evidence from a Panel of Countries”, European Journal of Political Economy, 25, pp. 439–446. BP Statistical Review of World Energy, June 2010 Budget Analyis Rajasthan Centre (2011). “Rajasthan Budget Summary”, Jaipur [http://www.barcjaipur.org/?p=94] Census of India (2011). Ministry of Home Affairs, Government of India. Available at: http://censusindia.gov.in. Collier, P., van der Ploeg, F., and Spence, M. (2009). ‘Managing Resource Revenues in Developing Economies’, OxCarre Research Paper, revised 18 May 2009, 15. Dutta, P.V. (2008). ‘The Performance of Social Pensions in India: The Case of Rajasthan’, World Bank Social Protection and Labour Discussion Paper No. 0834. El-Katiri, Laura, Bassam Fattouh and Paul Segal (2011). ‘Anatomy of an Oil-Based Welfare State: Rent Distribution in Kuwait’, forthcoming in David Held and Kristian Ulrichsen (eds.), The Transformation of the Gulf States: Politics, Economics and the Global Order, 2011, Routledge. Farrington, J. and Saxena, N.C. (2004). ‘Protecting and Promoting Livelihoods in India: what role for pensions?’, ODI Opinions. Finance Department of Rajasthan (2011). “Budget 2011-2012”, Government of Rajasthan
30

Finance Department of Rajasthan (2010). “Budget 2010-2011”, Government of Rajasthan Finance Department of Rajasthan (2009). “Budget 2009-2010”, Government of Rajasthan Fuentes, J. Rodrigo (2009). ‘Managing Natural Resources Revenue: The Case of Chile’, OxCarre Research Paper 40, October 2009. Government of India (2010a). Economic Survey 2009–10, Ministry of Finance. Government of India (2010b). Report of the Thirteenth Finance Commission, 2010–15. Government of India (2009). ‘Gendering Human Development Indices: Recasting the Gender Development Index and Gender Empowerment Measure for India’, Ministry of Women and Child Development. Government of India (2005).National Rural Employment Guarantee Act. Government of India (2004).National Sample Survey, 61st Round, 2004–5. Government of Rajasthan (2010). ‘Budget Study, 2010–11’, Directorate of Economics and Statistics, Jaipur. Government of Rajasthan (2009).Statistical Abstract of Rajasthan, 2009, Directorate of Economics and Statistics, Jaipur. Government of Rajasthan (2008).A Comparative Study of State Finances, 2008, Directorate of Economics and Statistics, Jaipur. Government of Rajasthan (2005).Report of the Third State Finance Commission for Rajasthan, 2005–10. HDR (2006). Rajasthan State Human Development Report, Government of Rajasthan. HDR (2008). Rajasthan Human Development Report: An Update, Government of Rajasthan and the Institute of Development Studies, Jaipur. HDR (2009). Barmer District Human Development Report, Government of Rajasthan and the Institute of Development Studies, Jaipur. Humphreys, M., Sachs, J., and Stiglitz, J. (2007). Escaping the Resource Curse, Columbia University Press. IMF (2010). ‘Islamic Republic of Iran: Selected Issues Paper’, IMF Country Report No. 10/76, March 2010.
31

Jafarov, E. and Leigh, D. (2007). ‘Alternative Fiscal Rules for Norway’, IMF Working Paper WP/07/241. Jha, R., Gaiha. R. and Shankar, S. (2008). Reviewing the National Rural Employment Guarantee Programme, 15 March 2008. Kapur, D., Mukhopadhyay, P., and Subramanian, A. (2008). ‘The Case for Direct Cash Transfers to the Poor’, Economic and Political Weekly, 12 April 2008. Karl, T. L. (1997). The Paradox of Plenty: Oil Booms and Petro-States, Berkeley: University of California Press. Menon, S.V. (2008). ‘Right to Information Act and NREGA: Reflections on Rajasthan’, MPRA Paper No 7351, University of Munich. Ministry of Rural Development (2010). ‘NREGA Outcomes (Physical Employment) for the financial year 2009–10’. Available at: http://164.100.12.7/Netnrega/mpr_ht/nregampr_dmu.aspx?fin_year=2009-2010&month=Latest&flag=1&page1=S. Accessed on 11 May 2011. Ministry of Petroleum (2009). ‘Basic Statistics on Indian Petroleum and Natural Gas’, Government of India. [=/available at: http://petroleum.nic.in/petstat.pdf McCarten, W.J. (2003). ‘The Challenge of Fiscal Discipline in Indian States’, in Fiscal Decentralisation and the Challenge of Hard Budget Constraints, Rodden, J., Gunnar, E., Litvack, J. (eds.) MIT Press. Noronha, L., Srivastava, N., Datt, D., and Sridharan, P.V. (2009). ‘Resource Federalism in India: The Case of Minerals’, Economic and Political Weekly, Volume XLIV, No. 8. Obstfeld, Maurice and Kenneth Rogoff (1996). Foundations of International Macroeconomics, Cambridge, MA: The MIT Press. ODI (2008). ‘The Indian National Rural Employment Guarantee Act: Will it reduce poverty and boost the economy?’, Project Briefing No. 7, January 2008, Overseas Development Institute. Planning Commission (2010). ‘Data for the Use of the Deputy Chairman, Planning Commission’, Government of India. Available at: http://planningcommission.gov.in/index.php. Prichard, W. (2010). ‘Taxation and state building: Towards a governance focused tax reform agenda’, Institute of Development Studies Working Paper 341. Rajaraman, I. and Sinha, D (2007). Functional Devolution to Rural Local Bodies in Four States, Economic and Political Weekly, 16 June 2007.
32

Rajasthan Directorate of Economics and Statistics (2009a). ‘Comparative Economic Indicators of Rajasthan and India’, Government of Rajasthan. Available at: www.statistics.rajasthan.gov.in/indicator_india_raj.asp. Rajasthan Directorate of Economics and Statistics (2009b). ‘Socioeconomic Indicators of Rajasthan’, Government of Rajasthan. Available at: www.statistics.rajasthan.gov.in/indicator_india_raj.asp. Reserve Bank of India (2010). State Finances: A Study of State Budgets, 2009–10. Segal, Paul (2010). ‘The Distribution of Oil Revenues in Mexico’, mimeo Oxford Institute for Energy Studies, draft 31 October 2010. Segal, Paul (2011a). ‘Resource Rents, Redistribution, and Halving Global Poverty: The Resource Dividend’, World Development, 39 (4), doi:10.1016/j.worlddev.2010.08.013. Segal, Paul (2011b). ‘How to Spend It: Resource Wealth and the Distribution of Resource Rents’, mimeo Oxford Institute for Energy Studies. Singh, N. (2006). ‘State Finances in India: A Case for Systemic Reform’, Santa Cruz Department of Economics, Working Paper Series. Statistics Norway (2007). Statistics Norway webpage, ‘Focus on Public Finances – Petroleum revenue’. Available at: www.ssb.no/off_finans_en/read_more.html
Stern, N. H., Peters, S., Bakhshi, V., Bowen, A., Cameron, C., Catovsky, S., Crane, D., Cruickshank, S., Dietz, S., Edmonson, N., Garbett, S.-L., Hamid, L., Hoffman, G., Ingram, D., Jones, B., Patmore, N., Radcliffe, H., Sathiyarajah, R., Stock, M., Taylor, C., Vernon, T., Wanjie, H., and Zenghelis, D. (2006). Stern Review: The Economics of Climate Change, Cambridge, UK: Cambridge University Press. Tewari, R. (2010). ‘Rajasthan gets nearly 20% of FY10 NREGA funds’, Livemint: The Wall Street Journal, 16 March. Available at: www.livemint.com/2010/03/16220513/Rajasthan-gets-nearly-20-of-F.html
Usui, N. (2007). ‘How Effective are Oil Funds? Managing Resource Windfalls in Azerbaijan and Kazakhstan’, 8, ADB-ERD Policy Brief Series, No. 50, Asian Development Bank. van der Ploeg, F. (2010). ‘Natural Resources: Curse or Blessing?’, OxCarre Research Paper 5, revised, 13 June 2010. van der Ploeg, F. and Venables, A. J. (2010). ‘Harnessing Windfall Revenues: Optimal policies for resource-rich developing economies’, OxCarre Research Paper 09, revised July 2010.
33

34
Wenar, L. (2007). ‘Property Rights and the Resource Curse’, Philosophy and Public Affairs, 36 (1), 2–32. World Bank (2006). ‘India–Rajasthan: Closing the Development Gap’, Poverty Reduction and Economic Management Unit, South Asia Region.